should have done this one before – not sure why I didn’t …
Posted on June 17, 2018 Leave a Comment
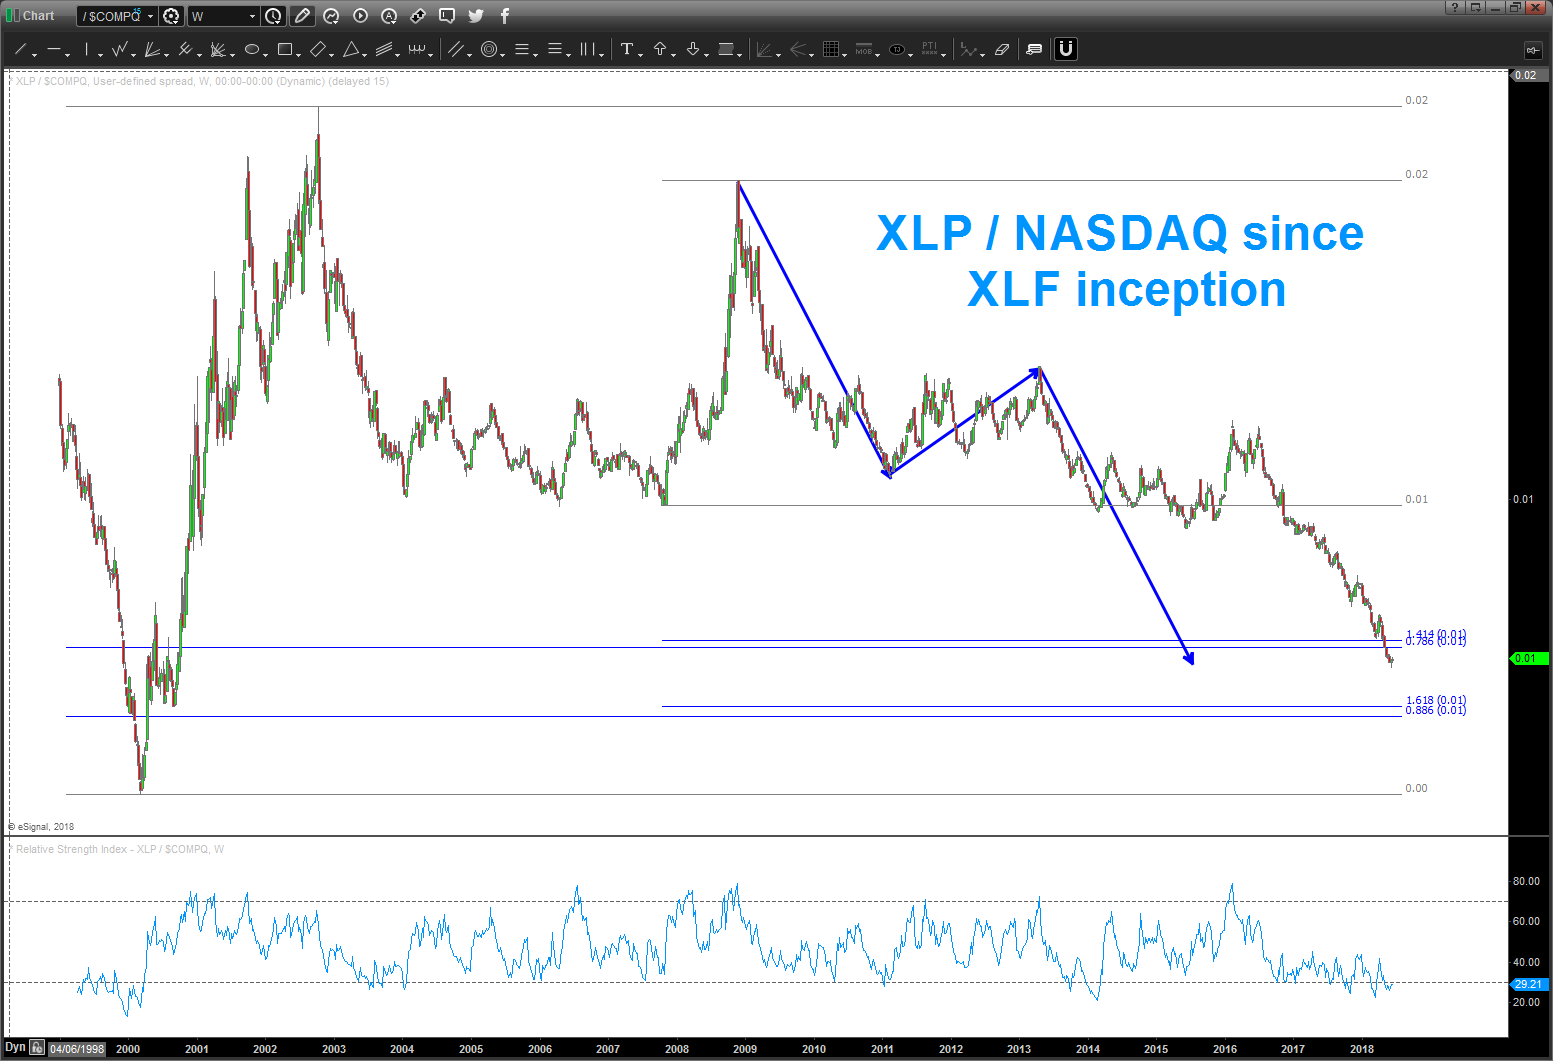
so, the NASDAQ looks unstoppable … we have sell patterns on the DOW, the S&P, the NYSE Index but the NASDAQ is moving into new territory and it sure looks like finishing/close to finishing a 5 wave sequence. So, why not do the XLP / NASDAQ? Honestly, I don’t know why I haven’t done this one before. I’ve always looked at the NYSE Index or the S&P versus the XLP. One would think that the high flyer would show tendencies to pivot UP or DOWN based on risk on/off mindset by the institutions, right?
so, here’s the XLP / NASDAQ and it paints a nice picture.
of note:
- XLP/NASDAQ
- note the AB=Cd pattern that is completing and showing a bullish hammer as of this past Friday’s close.
- RSI – been pegged at the lowest levels since 2000 and has finally showed some bullish divergence.
- we are BELOW the .786 retracement BUT we are not at new all time lows (vice the NASDAQ that is all all time highs)
- there is another level for targets lower (.886 retracement and 1.618 extension) if this level gives away …
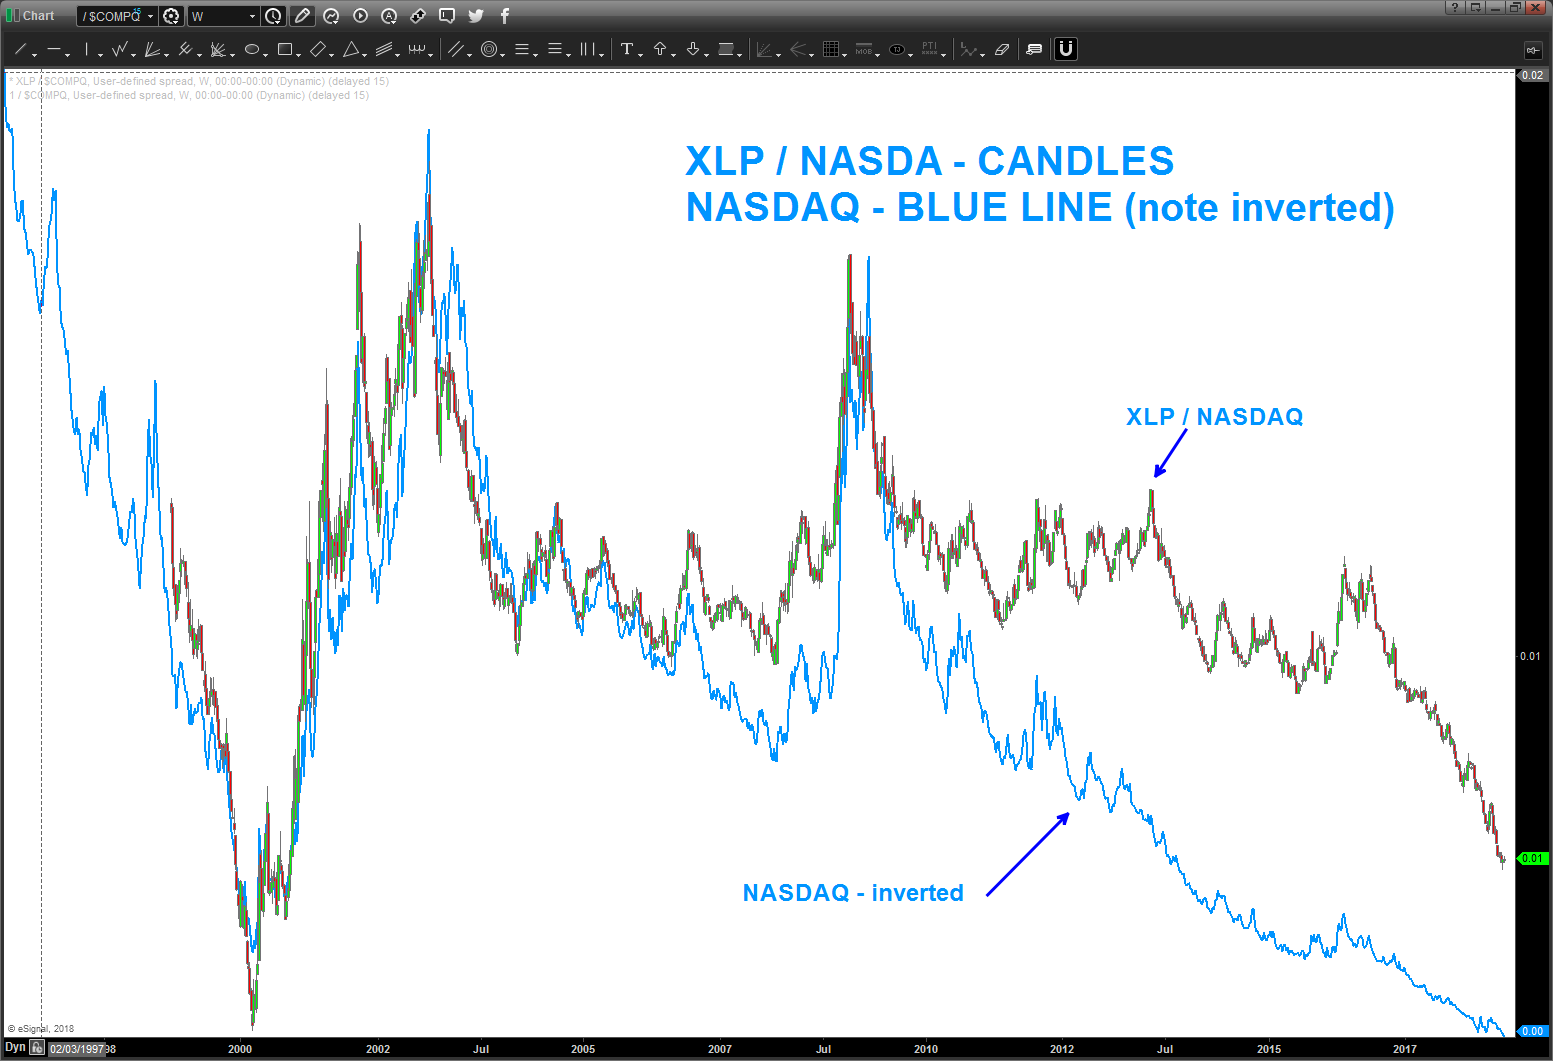
- XLP/NASDA w/ the NASDAQ overlaid and INVERTED
- NOTE – EVERY major pivot higher/lower has been at a pivot of this ratio .
Folks … don’t get complacent as there is a very large probability that the next move – across the board – is down.
Just calling it like I see it …
Happy Father’s Day!
Bart
XLP / S&P 500 – support here is justified and, perhaps, a signal of volatility to come? UPDATED 11/04/2018
Posted on June 9, 2018 1 Comment
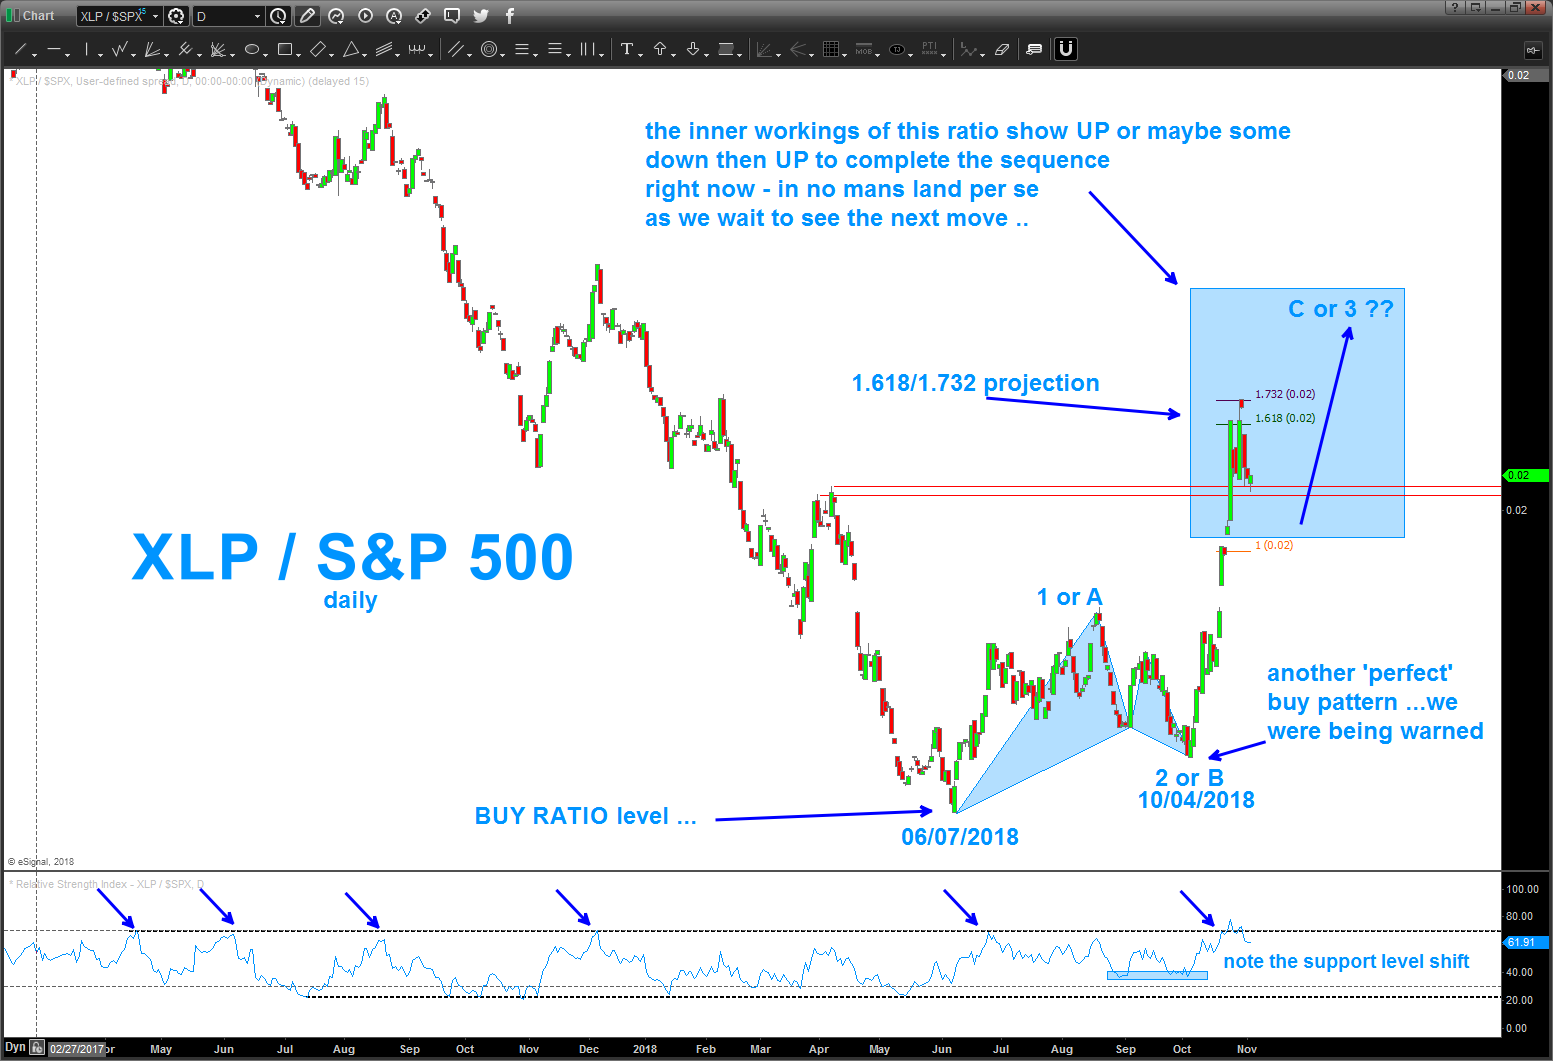
11/04/2018 – back on June 09, 2018 we saw this – almost – perfect pattern hit support. it’s the ratio of XLP / S&P 500 – we use ratio analysis to look for ‘risk on’ or ‘risk off’ mindset from the big dudes. in times of ‘risk on’ the ratio will go down as the big dudes / dudettes are not in defensive names (like staples) and when the ‘risk off’ mindset is present then the ratio will go up. i.e. the XLP is ‘outperforming’ from a relative strength perspective. the ratio completed a harmonic BUY pattern back in June and it took another 4 months before the market topped. one could conceivably say the rotation occurred in the summer. I’m posting the updated chart below … try and follow the bouncing ball of CONFIRMING indicators that the ratio was bottoming ….
where are we now? as you can see on the daily below we were DEFINITELY being warned w/ another near perfect BUY pattern on the ratio 10/04/2018. it exploded higher … I see a little more consolidation/ corrective form in the ratio an then another move higher to complete an inner 5 wave sequence. that’s when the ‘real’ pattern emerges. I DO NOT KNOW, yet, if this is an Elliott A-B-C corrective move (bullish for stocks) or a 1,2,3,4,5 wave sequence that foreshadows the ratio going higher (bearish for stocks) … were just going to have to chill and wait to see what unfolds.
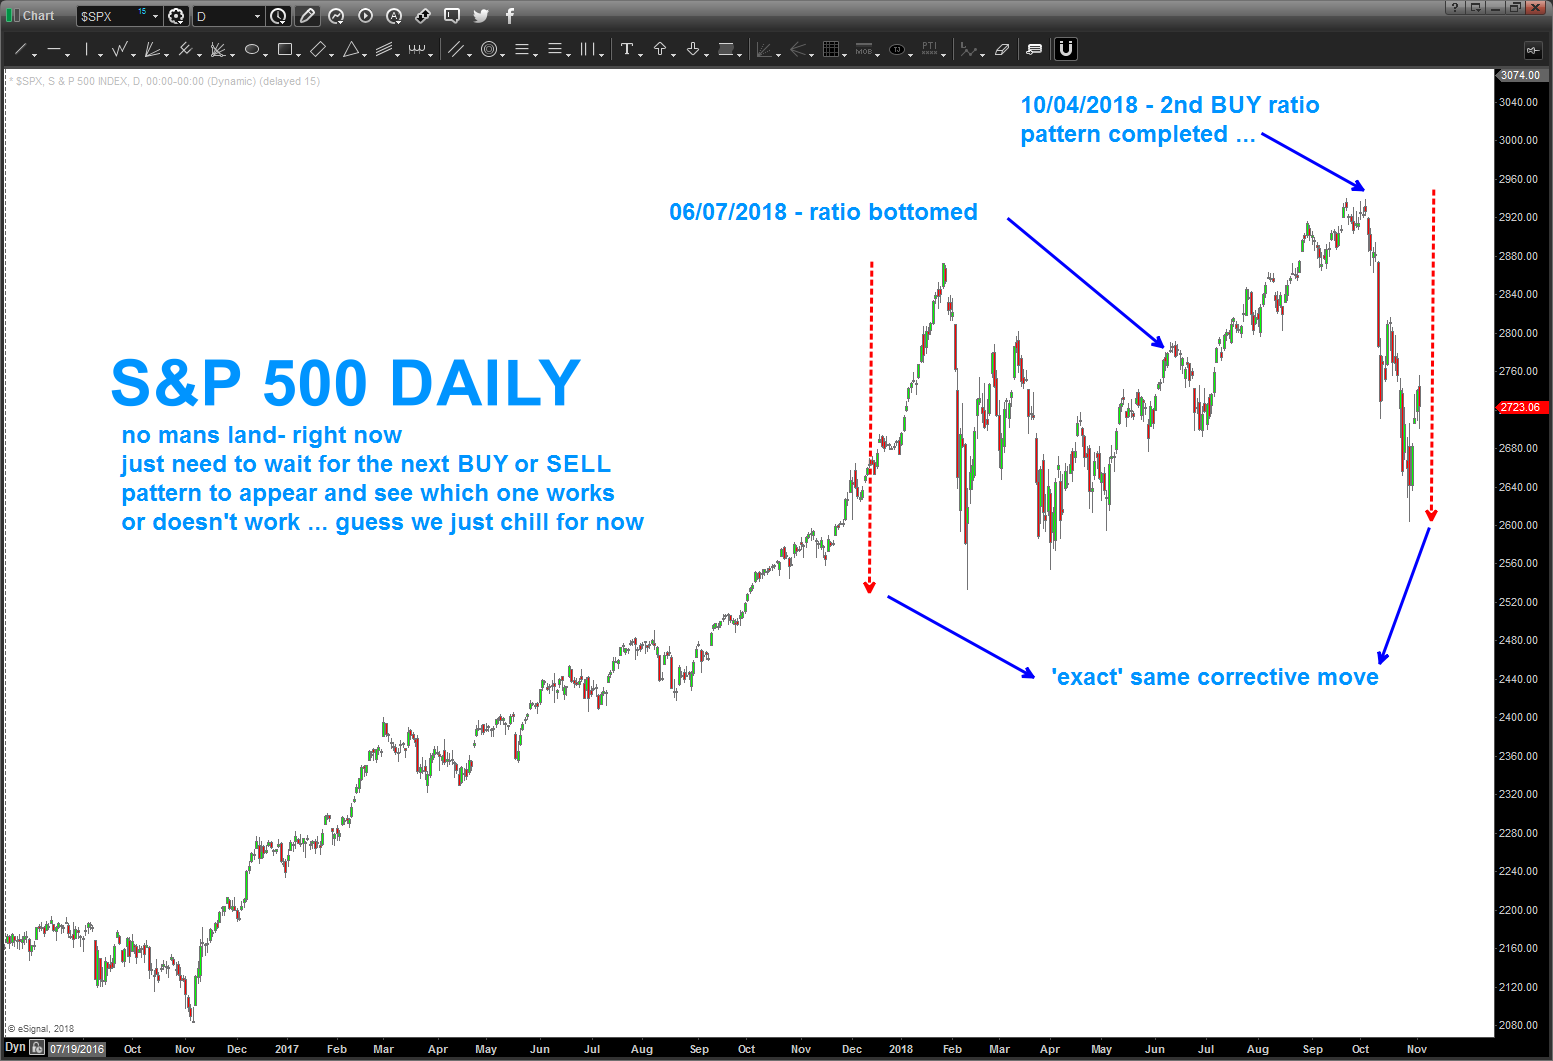
here’s the ratio ‘dates’ on top of the S&P 500 cash. again, somewhat in no mans land as we wait for the next BUY or SELL pattern to emerge. But, in the end, believe the ratio gave us ample time to position our portfolios accordingly – either the bear or bull you are. I’m neither … just a pattern recognition dude using some crayons to draw cool pictures and patterns.
______________________________________________________________________________________________________________________________________________________
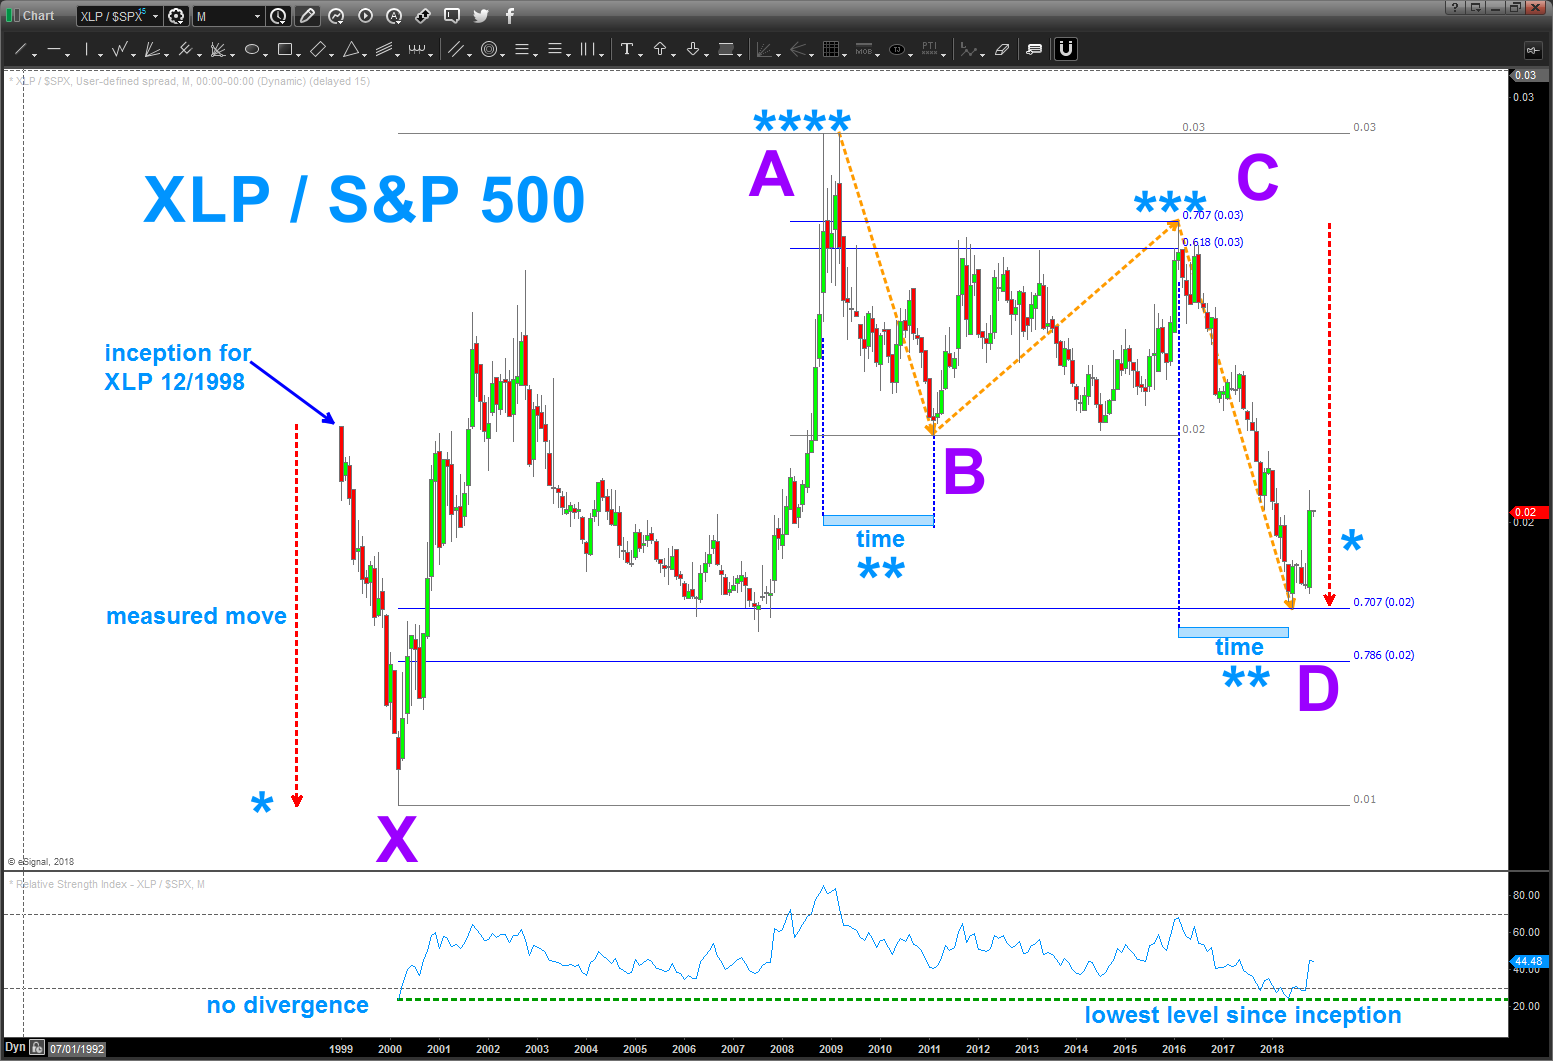
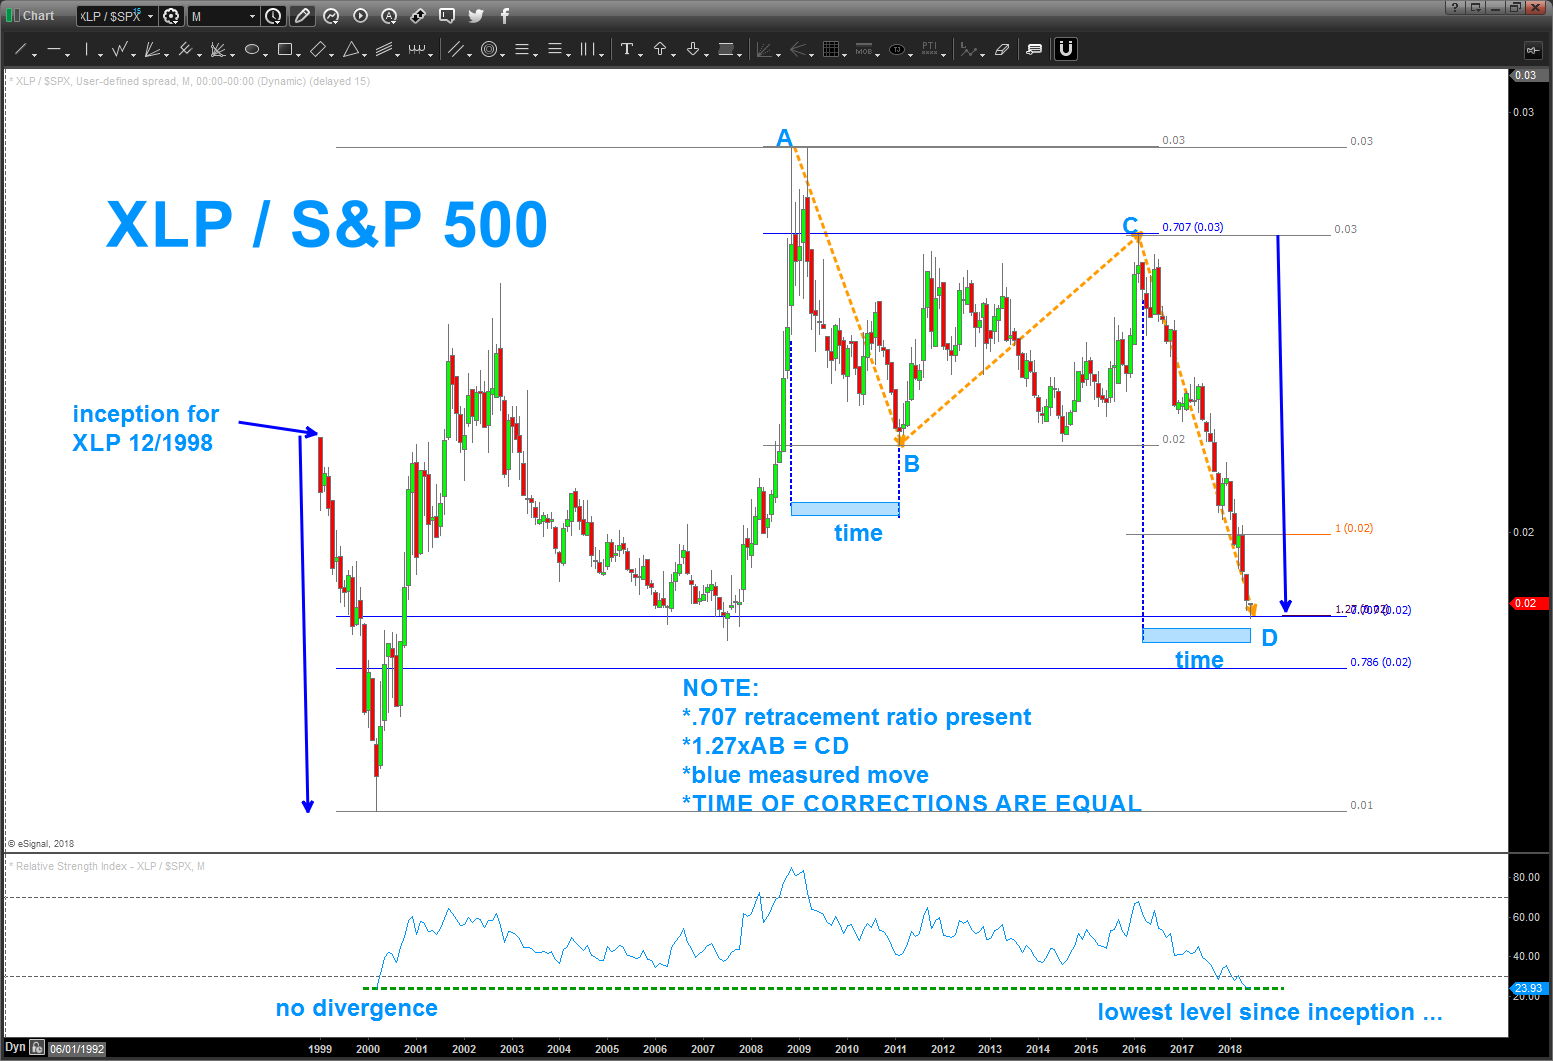
there is a different look/feel to the XLP / SPX versus the XLP / NYA. If you look at the chart below, you’ll see we did a pretty tight consolidation from 2011-2016 in the XLP / SPX. It’s a ‘perfect’ sell pattern at “C” that complete and then the ratio fell out of the sky.
i’m curious at the lack of follow thru w/ regards to the S&P 500 (not making new highs like Russell, NASDAQ, etc) so I decided to take a look at this ratio instead of NYSE as the denominator.
as you can see we have some key observations:
- take the time to study ‘past’ retracements as ‘sometimes’ the same ratio/vibration (remember that’s all it is – vibration) is present. In this case we have the .707 retracement level present at the high and now here at the lows
- 2
- Square Root of 2= 1.4142
- 1/1.4142 = .707
- the harmonic 1.27 is present in that 1.27*AB = CD
- 1.618
- square root = 1.27
- note the blue measured move arrow from the XLP inception in 1998 is present in this correction
- the MONTHLY RSI is at the lowest level since the inception of the XLP and this ratio of XLP/SPX
- THE TIME OF THE CORRECTIVE MOVES OF THE RATIO ARE EQUAL
what am i trying to get at? nothing more than I’m very cautious of any further up move in the markets (for now) .. .historically, when the XLP starts to perform it signals a ‘risk off mindset’ of the big institutions and volatility starts to rise …
while I DO NOT think the bull market is over by any stretch, I do think that another move lower is in tune (note the music reference :)) w/ the form, balance and proportion we are used to seeing from a corrective nature.
Bart
Crude Oil Update, ratio of XLE/NYA, HYG and Crude and a bunch of other stuff
Posted on June 3, 2018 Leave a Comment
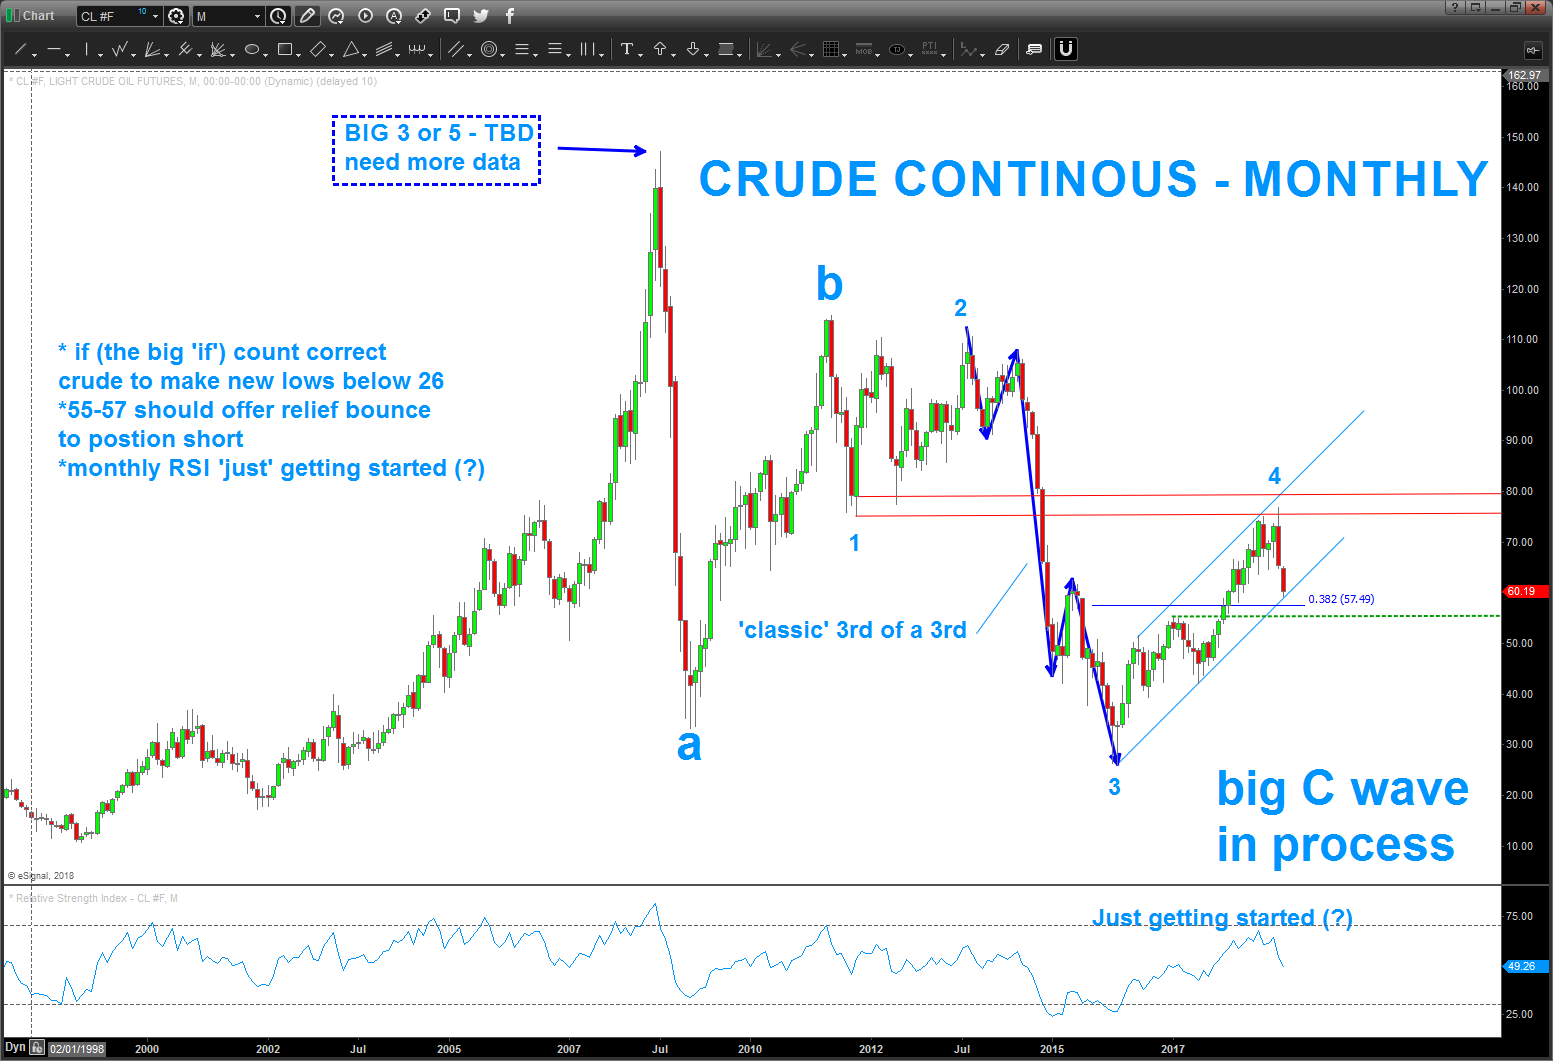
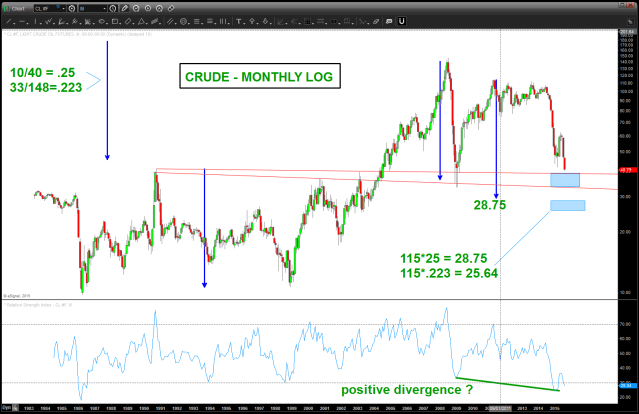
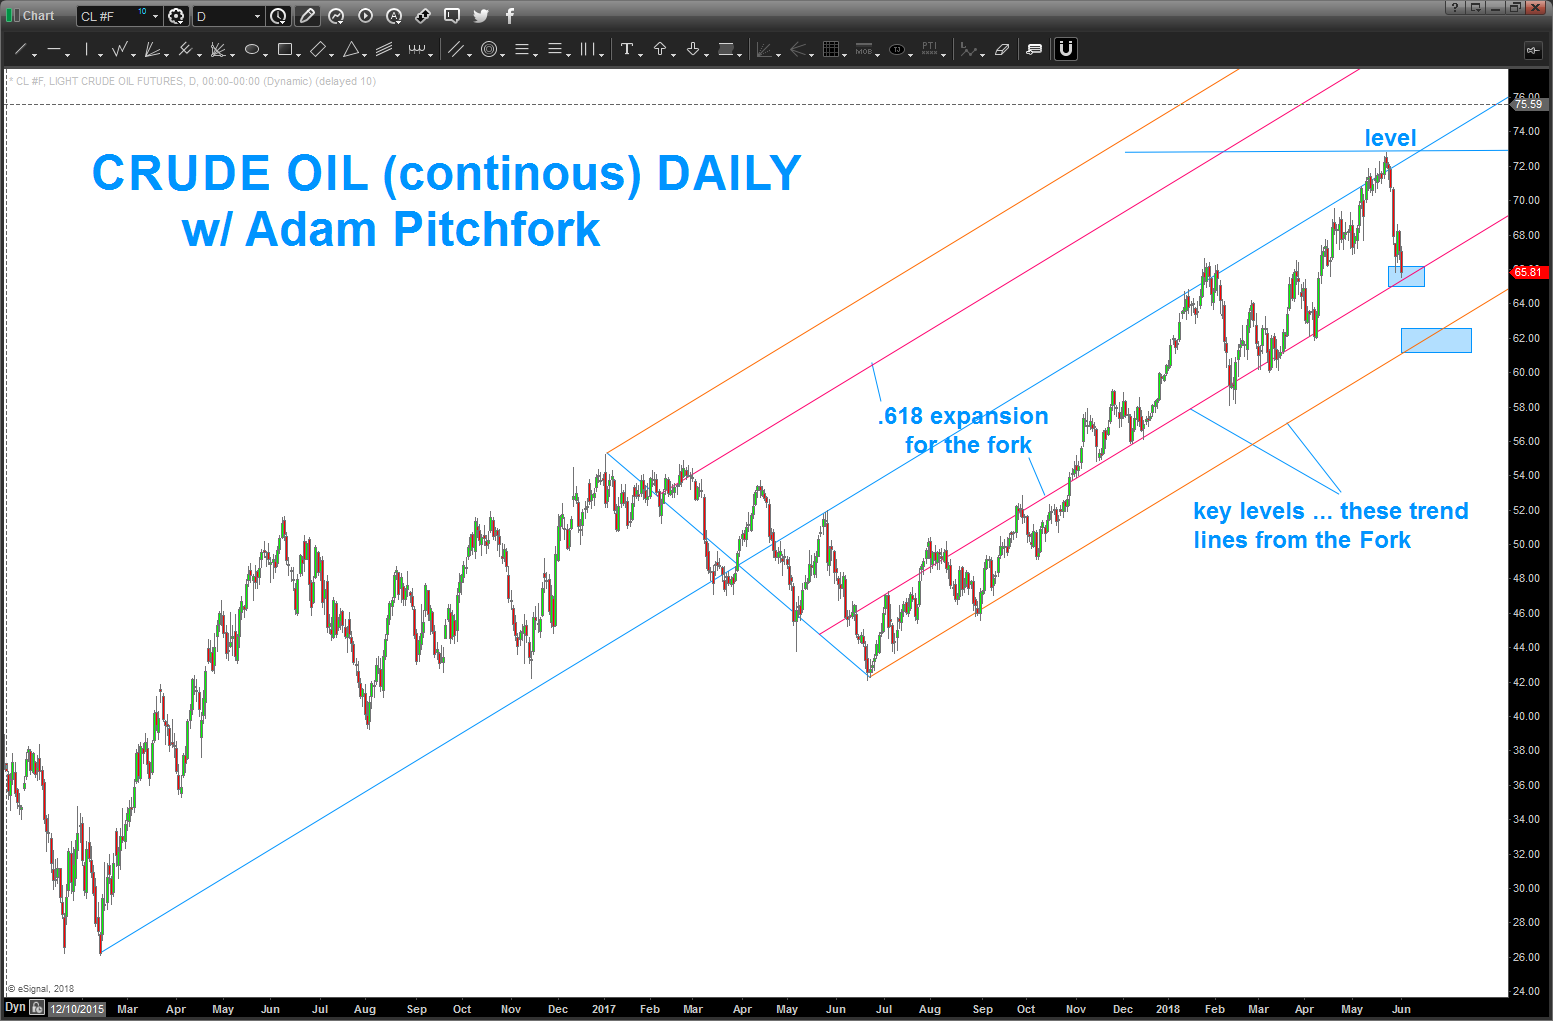
11/10/2018 – overall, our key 75-76 level was hit and has caused the sell off. take a look at the charts below …
some critical developments:
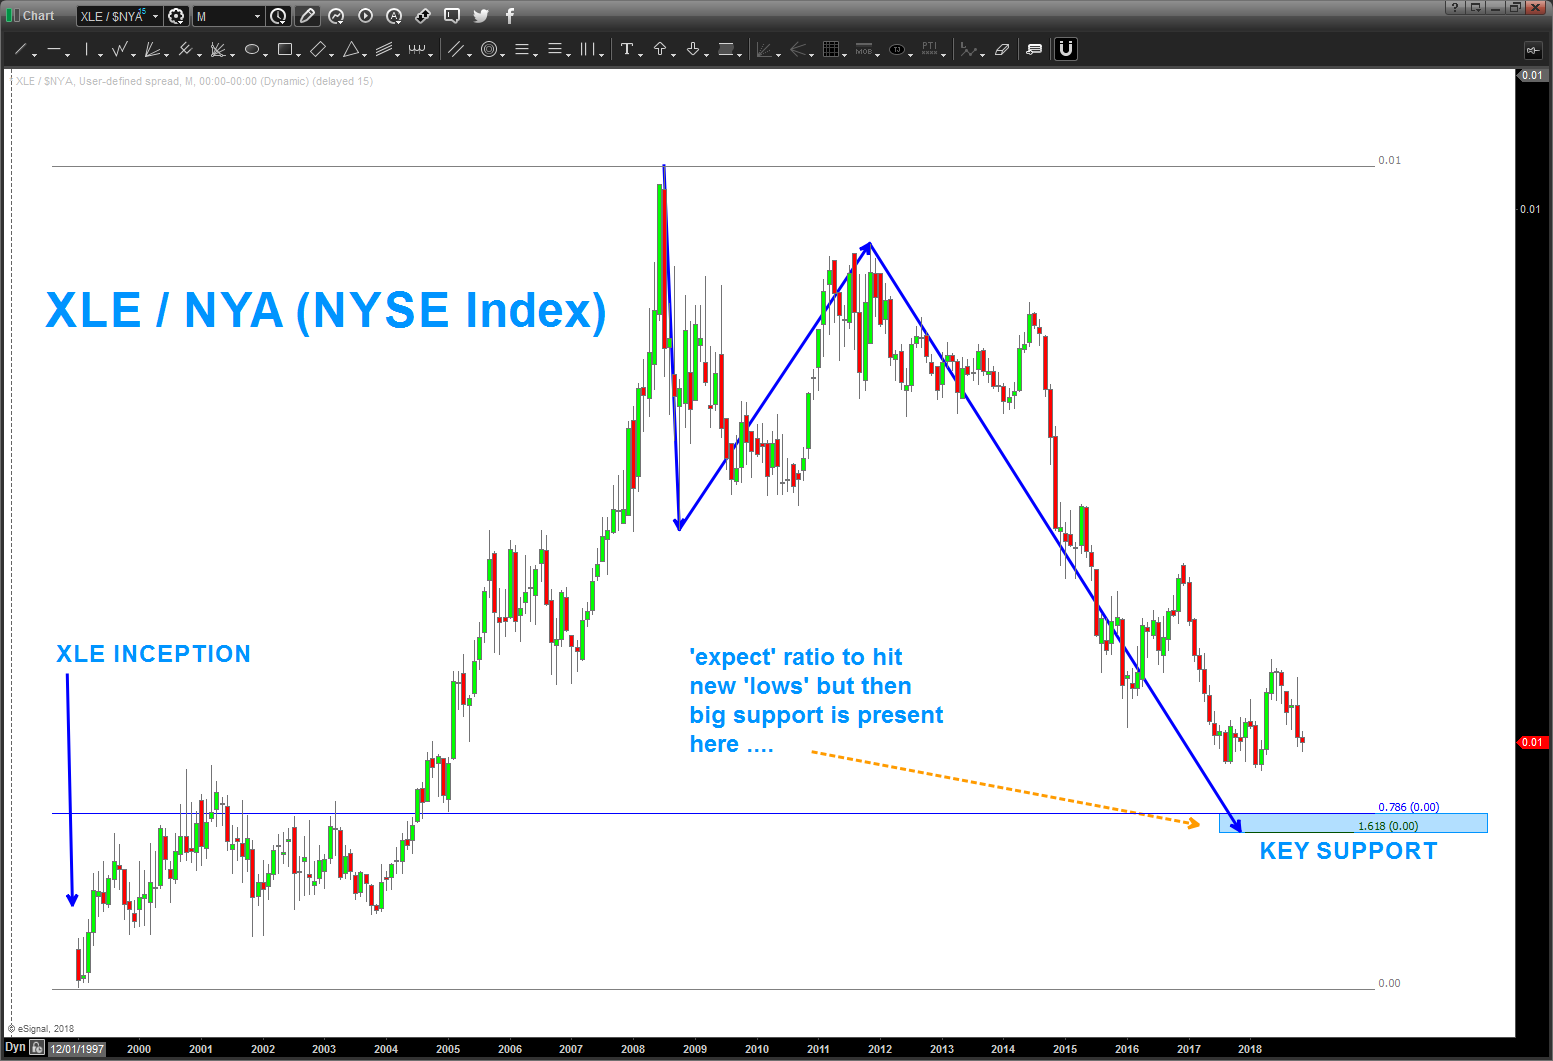
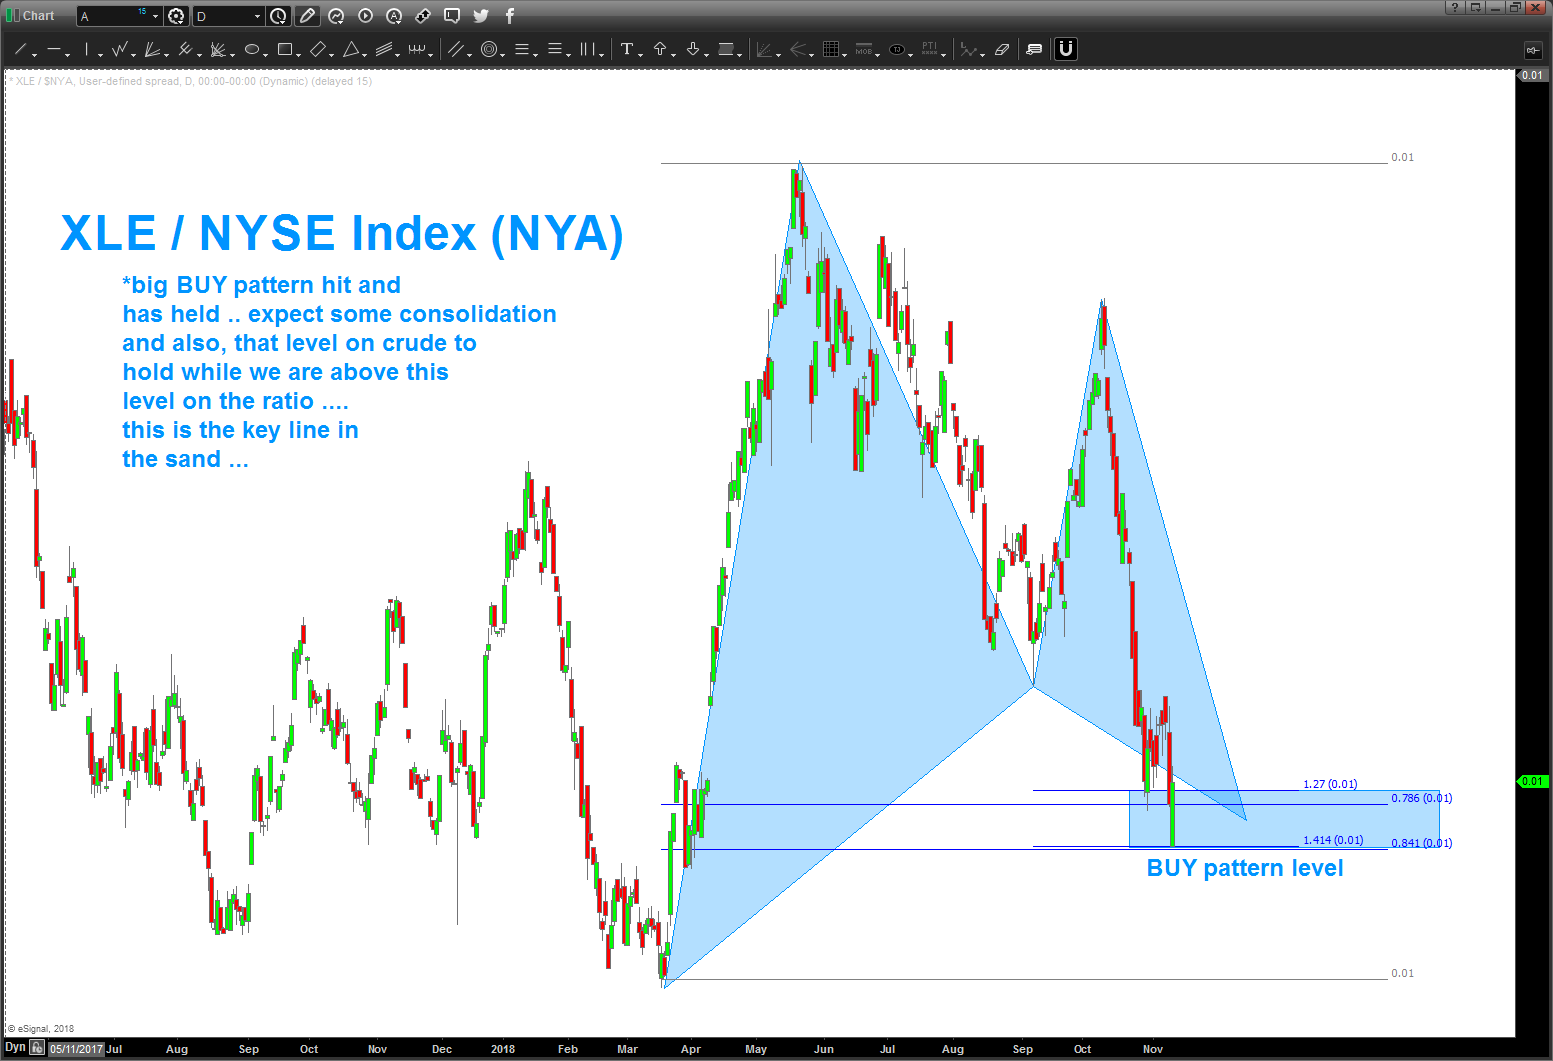
- the XLE/NYSE Index ratio has hit a perfect BUY PATTERN so expecting the energy complex to bounce/hold/consolidate as this level holds. IF IT FAILS then the sell off will be pretty immense. So watch t his level.
- on the Crude, anytime you have a .382 and .618 (.382+.618 = 1) present that should act as important S or R. In this case SUPPORT. we have some polarity present also so ‘expect’ a bounce in Crude … will update accordingly.
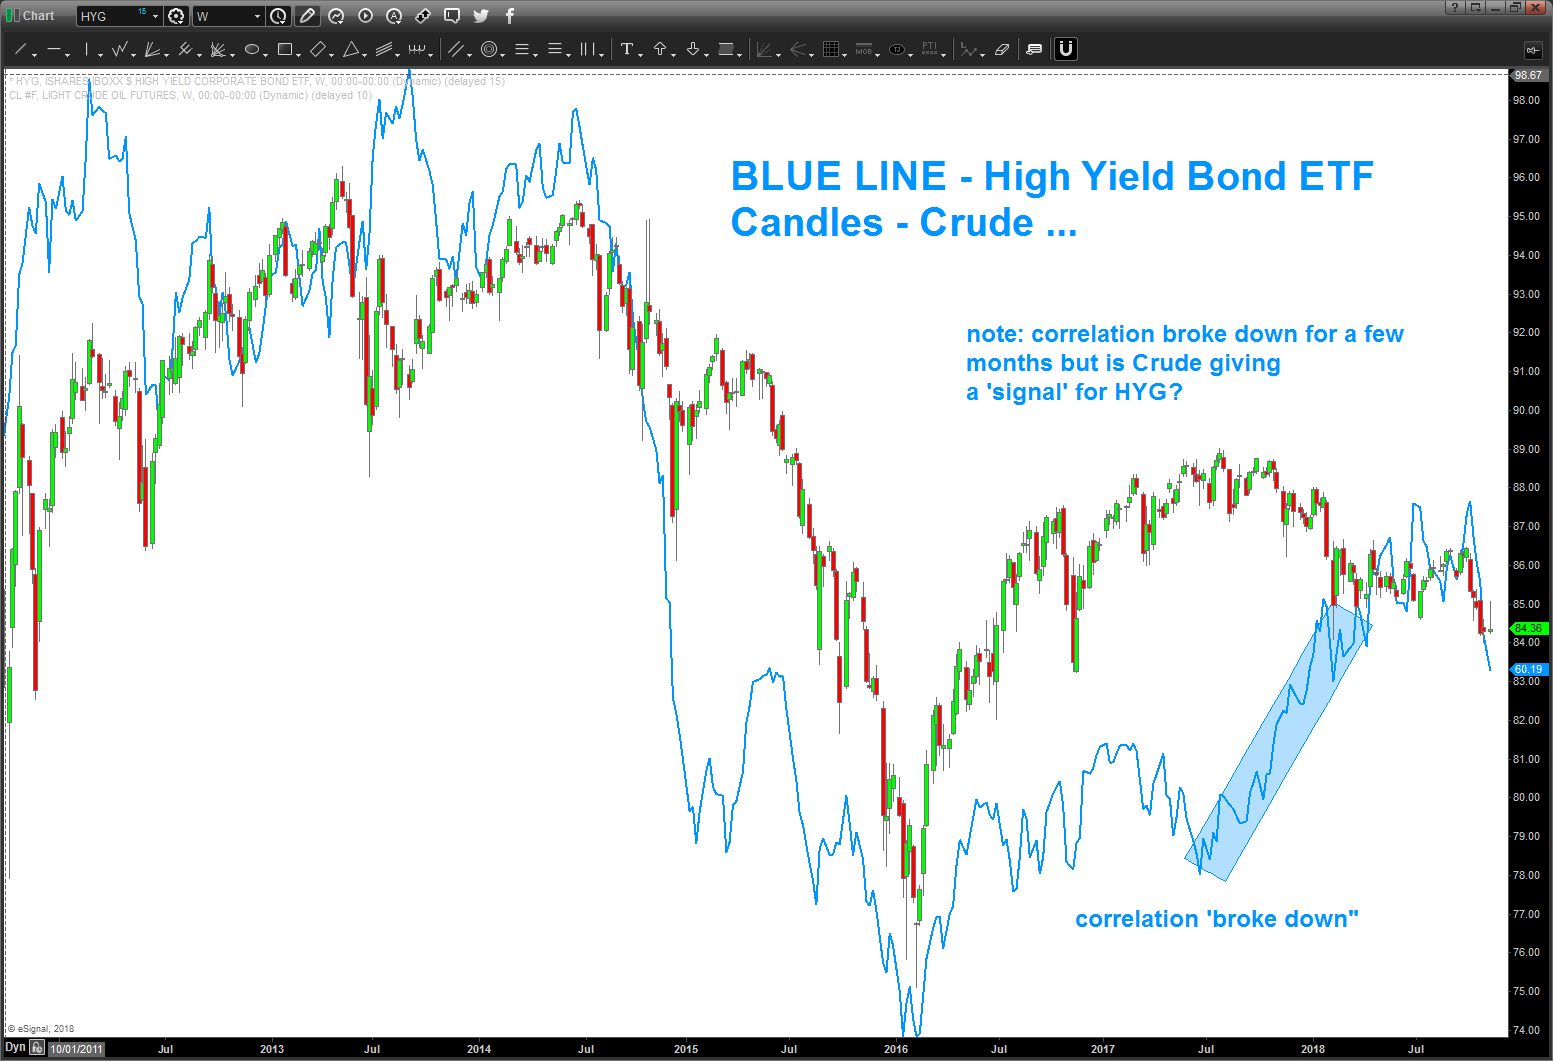
- also, note the correlation between crude and HYG. (High Yield Bond ETF) … perhaps the carnage in Crude will stop at support levels indicated which ‘should’ keep HYG at bay (if the correlation is still holding) but if Crude busts thru then that support cliff for HYG should give away and then it will get very interesting
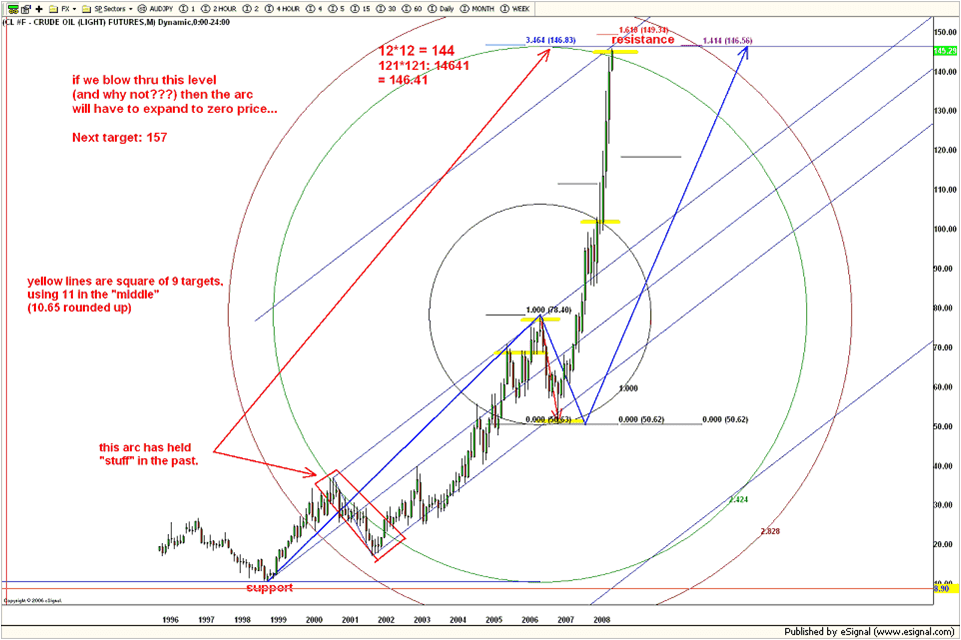
- also, put the oldie but goodie of the HIGH on crude on my birthday and the subsequent low to show some geometry at work and the fact that long term charts can certainly help .. .a famous quote “there is nothing new under the sun.”
thanks reading …. B
___________________________________________________________________________________________________________________________________________________________
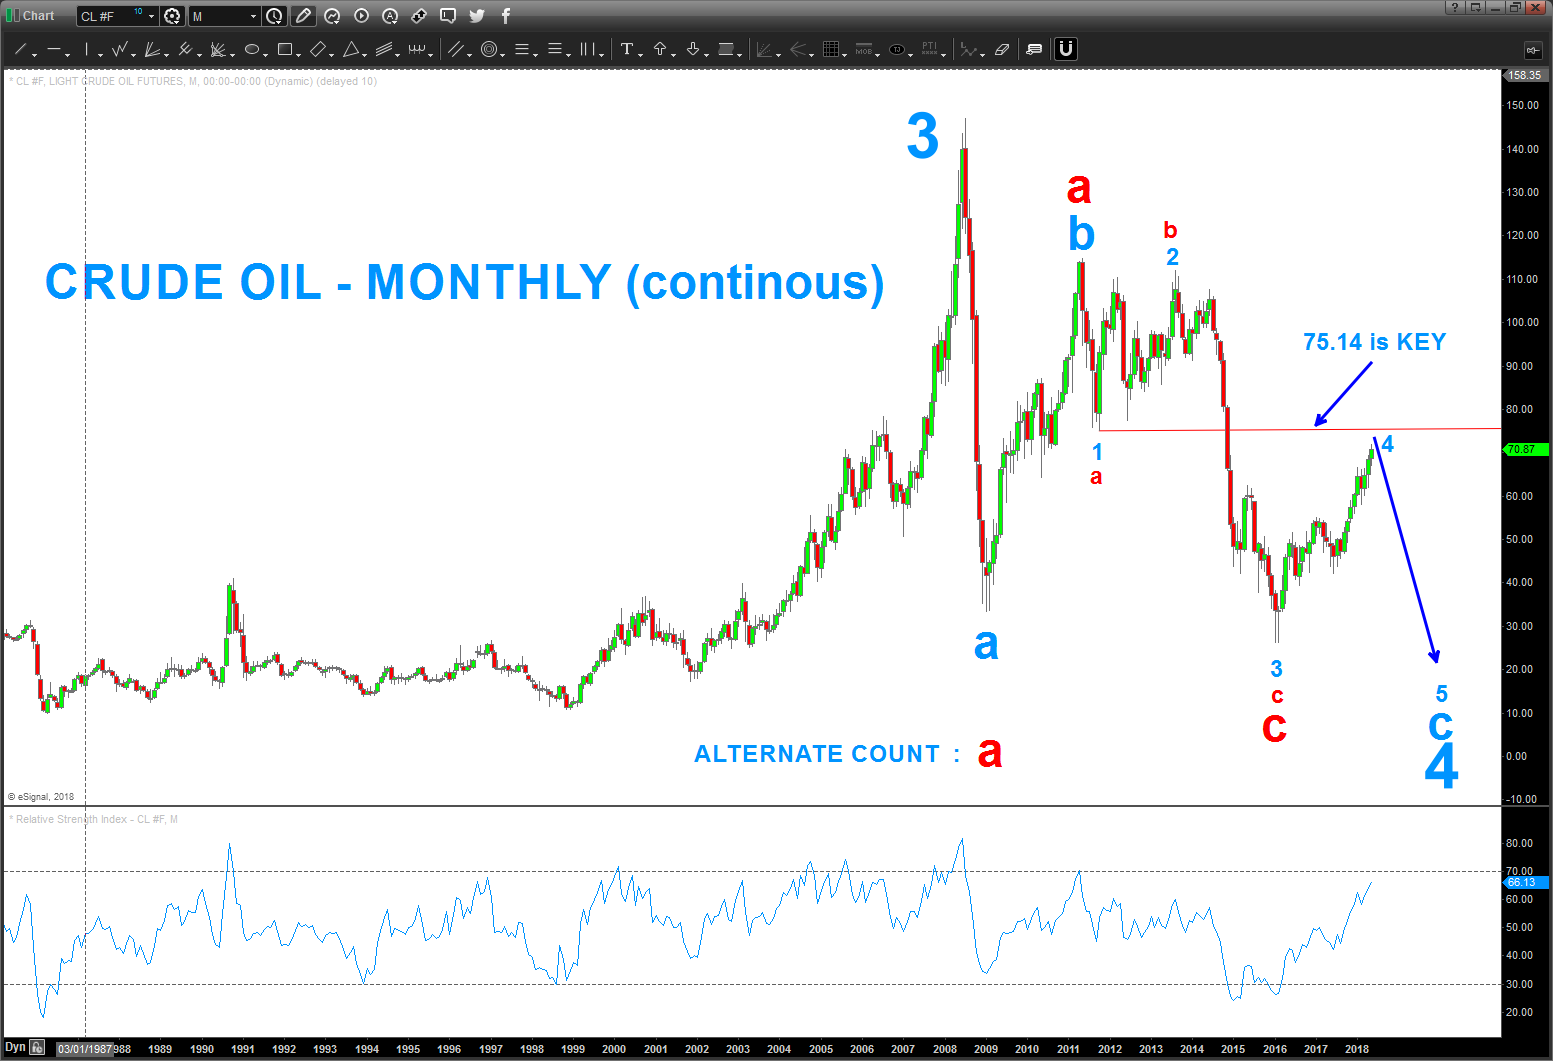
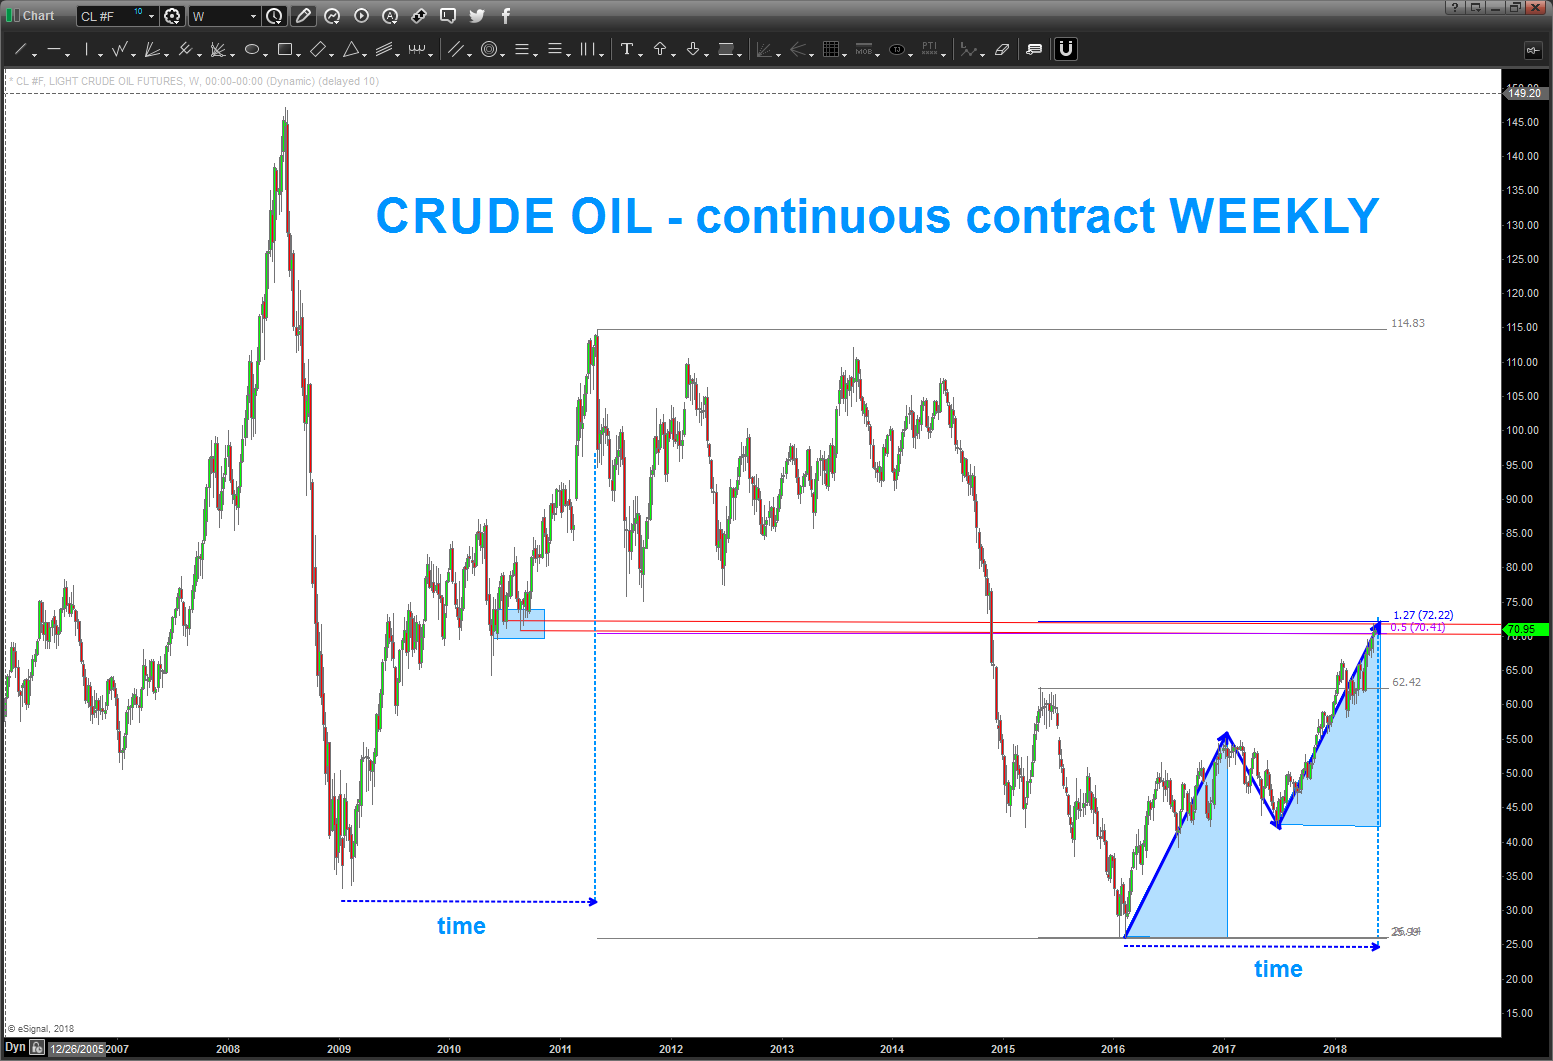
06/03/2018 – sorry that i didn’t send out the charts below via my blog .. honestly, I think I just forgot and then went on some travel …big thing here is we hit an important high a week or so ago based on TIME so this could be a very important top in crude.
honestly not sure if we have completed a 4 ( if YES we have BIG MOVE COMING lower) or an end to a bullish bounce and we are correcting to buy ..
either way, this should do it for crude for a while at least. will be watching and, again, apologize for not blogging earlier.
as an FYI, the charts are real time they were just sent out via email …
let me know if you have any questions.
Bart
this is the update as of 06/001/2018:
GWPH Greenwich Pharma is using Cannabis for this Lennox Gastaut Syndrome.
Posted on June 3, 2018 Leave a Comment

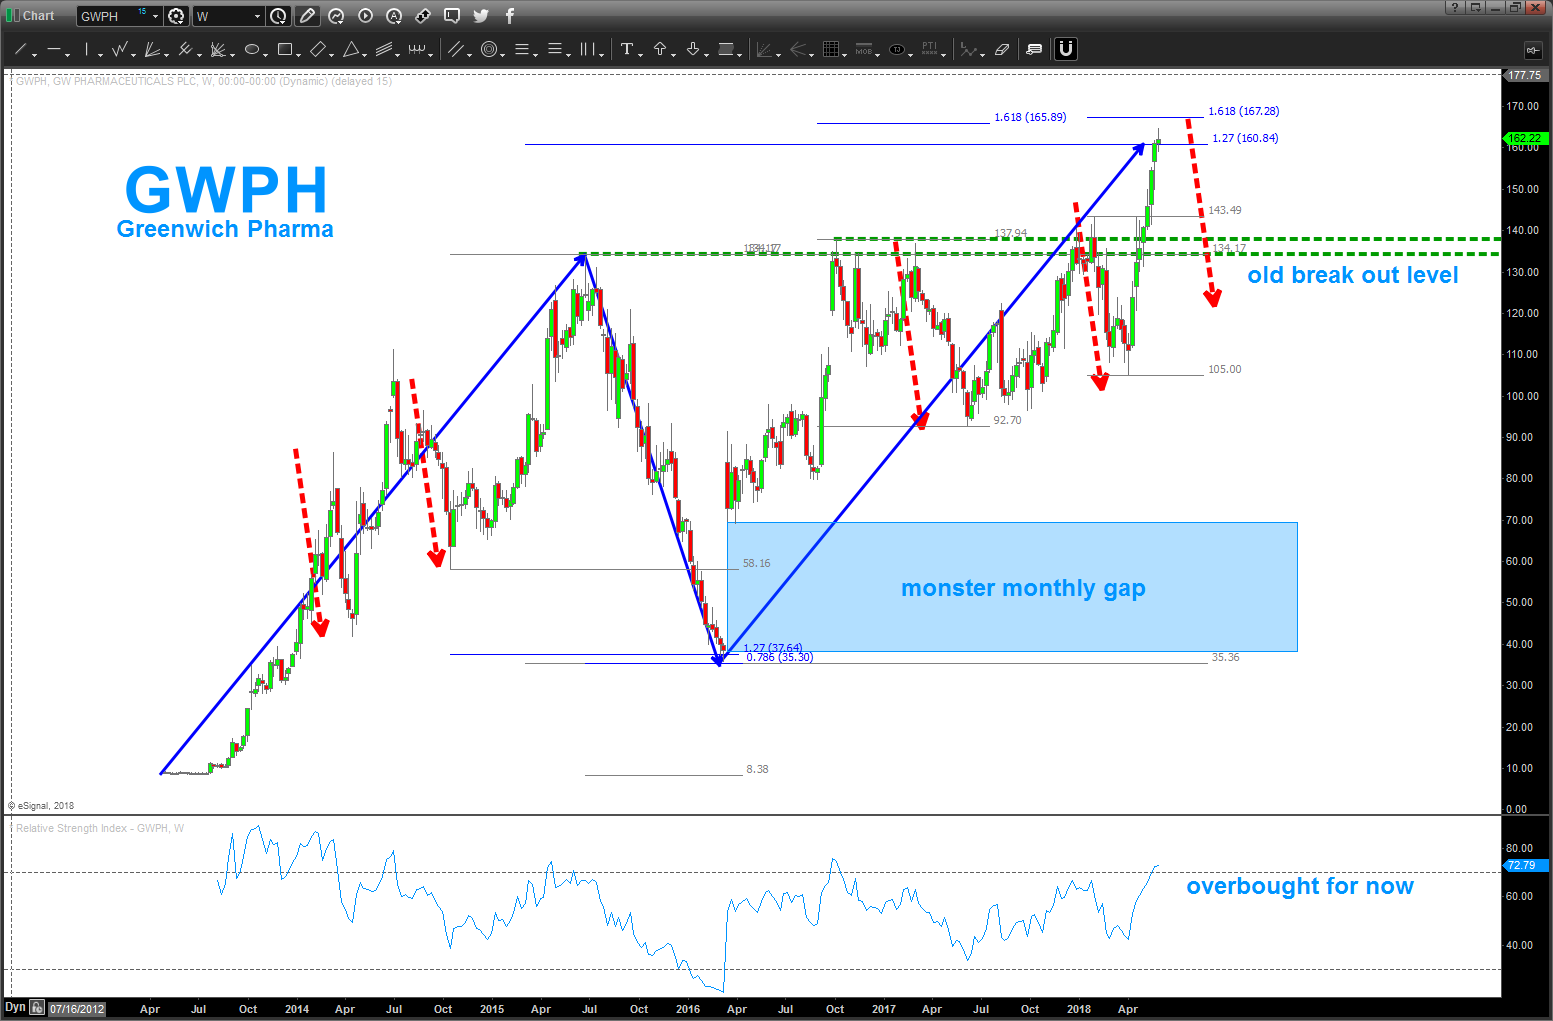
This company is about to launch and AMAZING ‘treatment’ called Epidiolex for Lennox-Gastaut syndrome, a rare, severe and difficult to treat form of childhood onset epilepsy. These children and their families are suffering thru up to 200 seizures a day. By dropping a couple of the Epidiolex drops into their mouth they are seeing amazing results.
Guess what – thee amazing treatment is derived from Cannabis. Period.
I am looking for a risk controlled entry for a long term buy and hold. The company is doing amazing things spinning out over 150 different chemical properties of this amazing plant based medicine.
No, we don’t have a bunch of kids baked while watching their Ipads … this is a natural based science relief …
Right now, we’ve completed some pretty hefty patterns so I’m looking for any pullback to BUY. Would really like to get this back to the ‘old breakout level’ for a BUY … note the MONSTER GAP on a monthly.
Pharma can be very wild based on FDA approval and Adverse Events and blah blah … but believe this company is onto something and the future is very bright.
Bart
Technology vs Staples (XLK / XLP) Ratio Analysis
Posted on June 3, 2018 Leave a Comment
I like Ratio Analysis … I also like to work w/ the patterns on these charts.
If you have been reading my blog for a while, you know that I ‘try’ (the operative word) to not read, watch or listen to any ‘other’ financial news commentary. Yes, there are people that I follow and am very interested in what they see/say (most are the same as me) but I can tell you that NONE of the people I follow or read are fundamental analysts. Not that they don’t do good work (they do) I’m just not smart enough to understand the information they put out. For me – it’s much easier to use crayons, some geometry and PRICE and TIME and PATTERNS to try to manage risk. The ‘why’ and the ‘blah blah’, again to me, is just noise.
so ratio analysis:
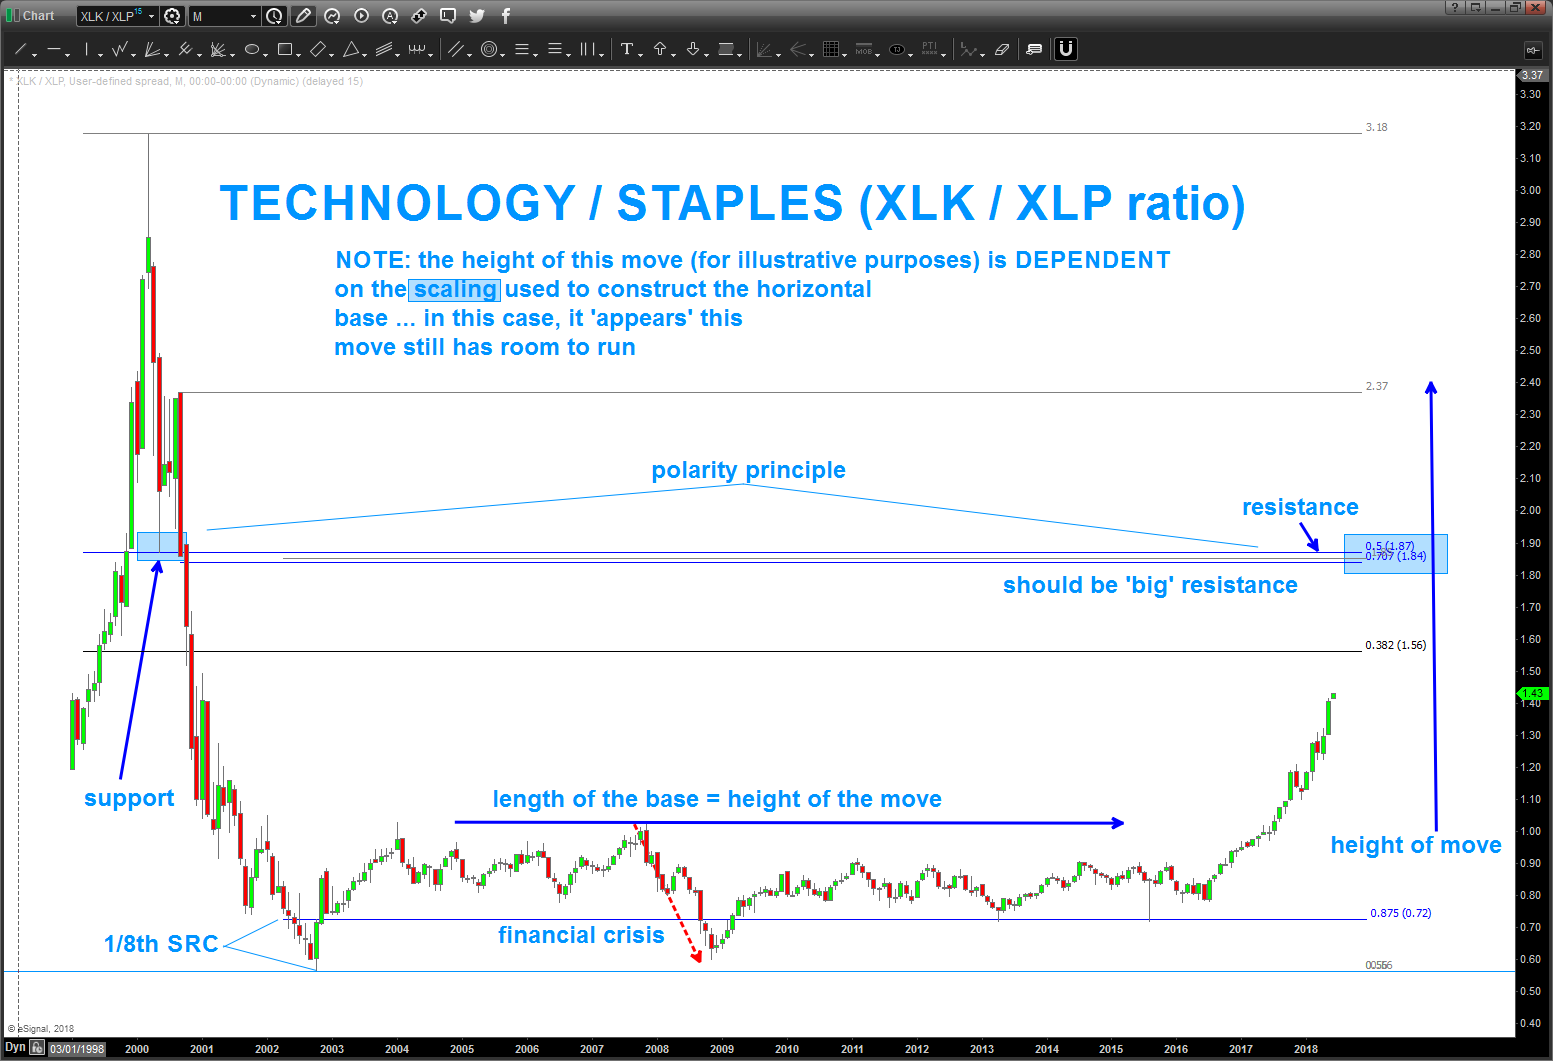
X/Y – if the chart goes up then X is stronger.
X/Y – if the chart goes down then Y is stronger.
X = XLK (technology = risk on) the Y = XLP (staples = risk off)
XLK/XLP – going up w/ strength. the big guys (institutions) aren’t showing a ‘risk off’ mindset. the XLK/XLP ratio move up is the LARGEST SINCE THE LOW OF 2002.
So, for me, while we might shuck and jive and perry left, perry right until we have a monthly bearish signal reversal candle I can’t join the camp of the sky is falling and all that jazz.
Bart
DB (Deutsche Bank) House of Cards?
Posted on May 29, 2018 1 Comment
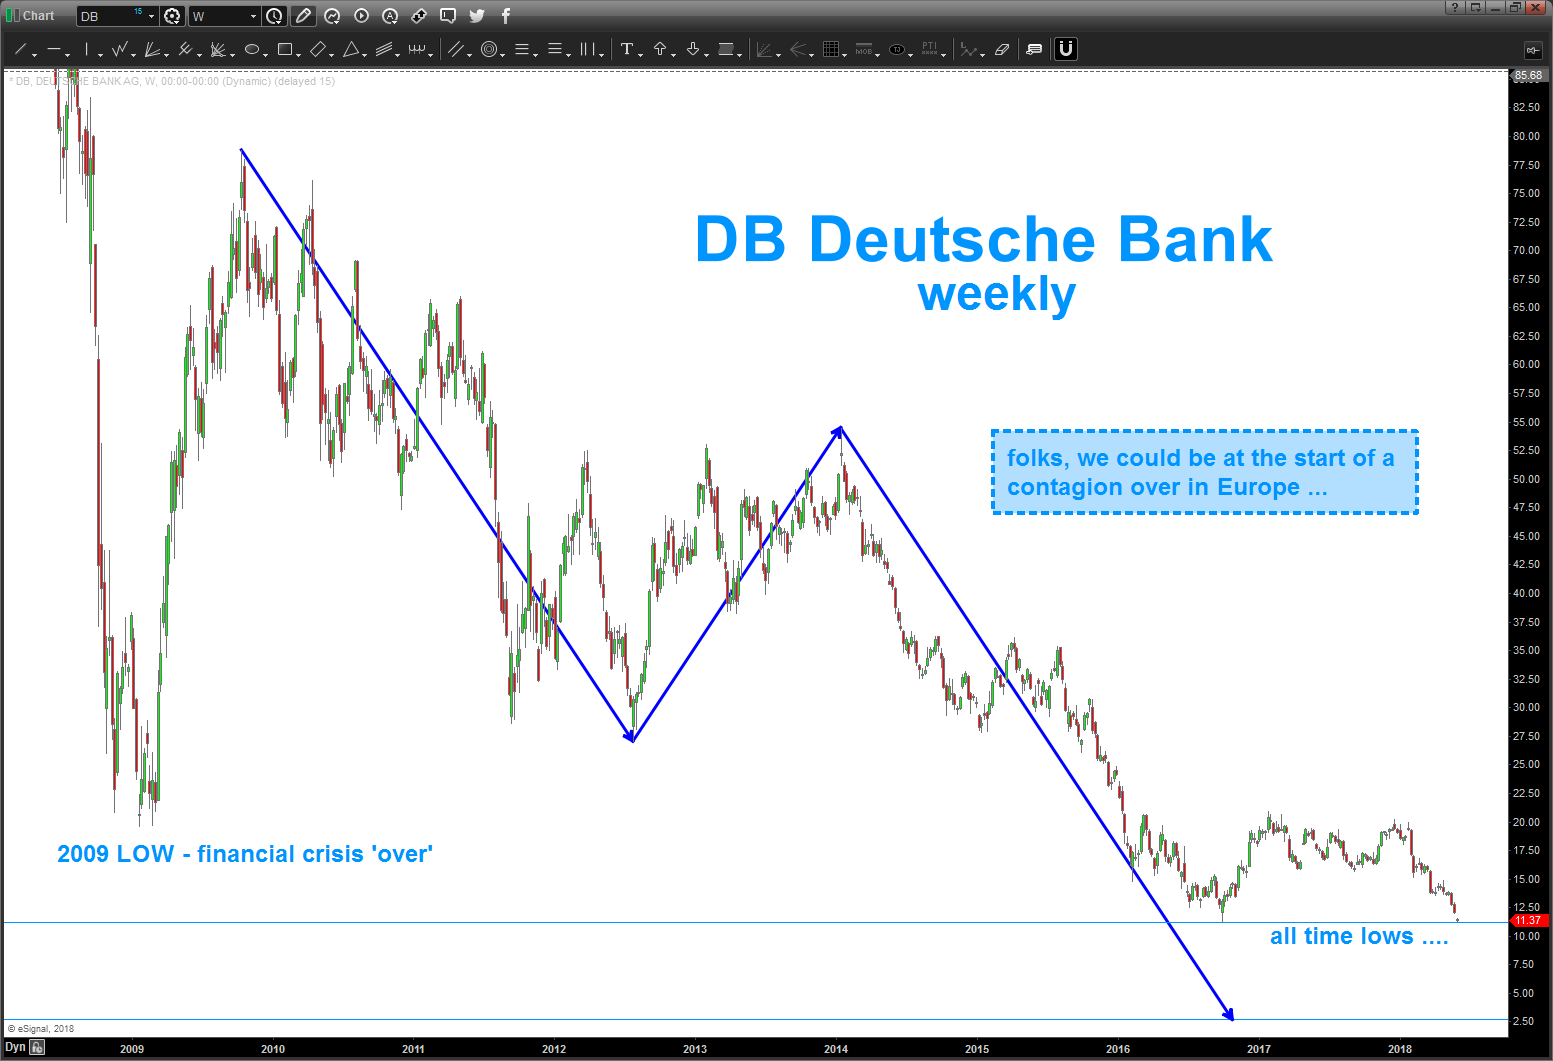
05/29/2018 – if you search ‘DB’ on my site you’ll see I’ve been watching this company for the past couple years. Why? Well, they are the largest holder of derivatives in the world and have so many ‘tangling alliances’ w/ the major global banks that they contain some serious systemic risk.
folks, this is getting really ugly … the probability of a contagion in Europe is growing larger every day.
watch the global flow of funds in the coming days … the ‘big money’ is going to have to go somewhere and, quite frankly, a big old position in the DOW 30 isn’t necessarily a bad thing is it? Yes, were going to get some global equity hits over the coming days weeks but ultimately, watch VOLUME and look for measured moves … but, for now and perhaps the foreseeable future stay out of Europe.
will update as we continue along …sheesh, the Eurozone is a hot mess.
Bart
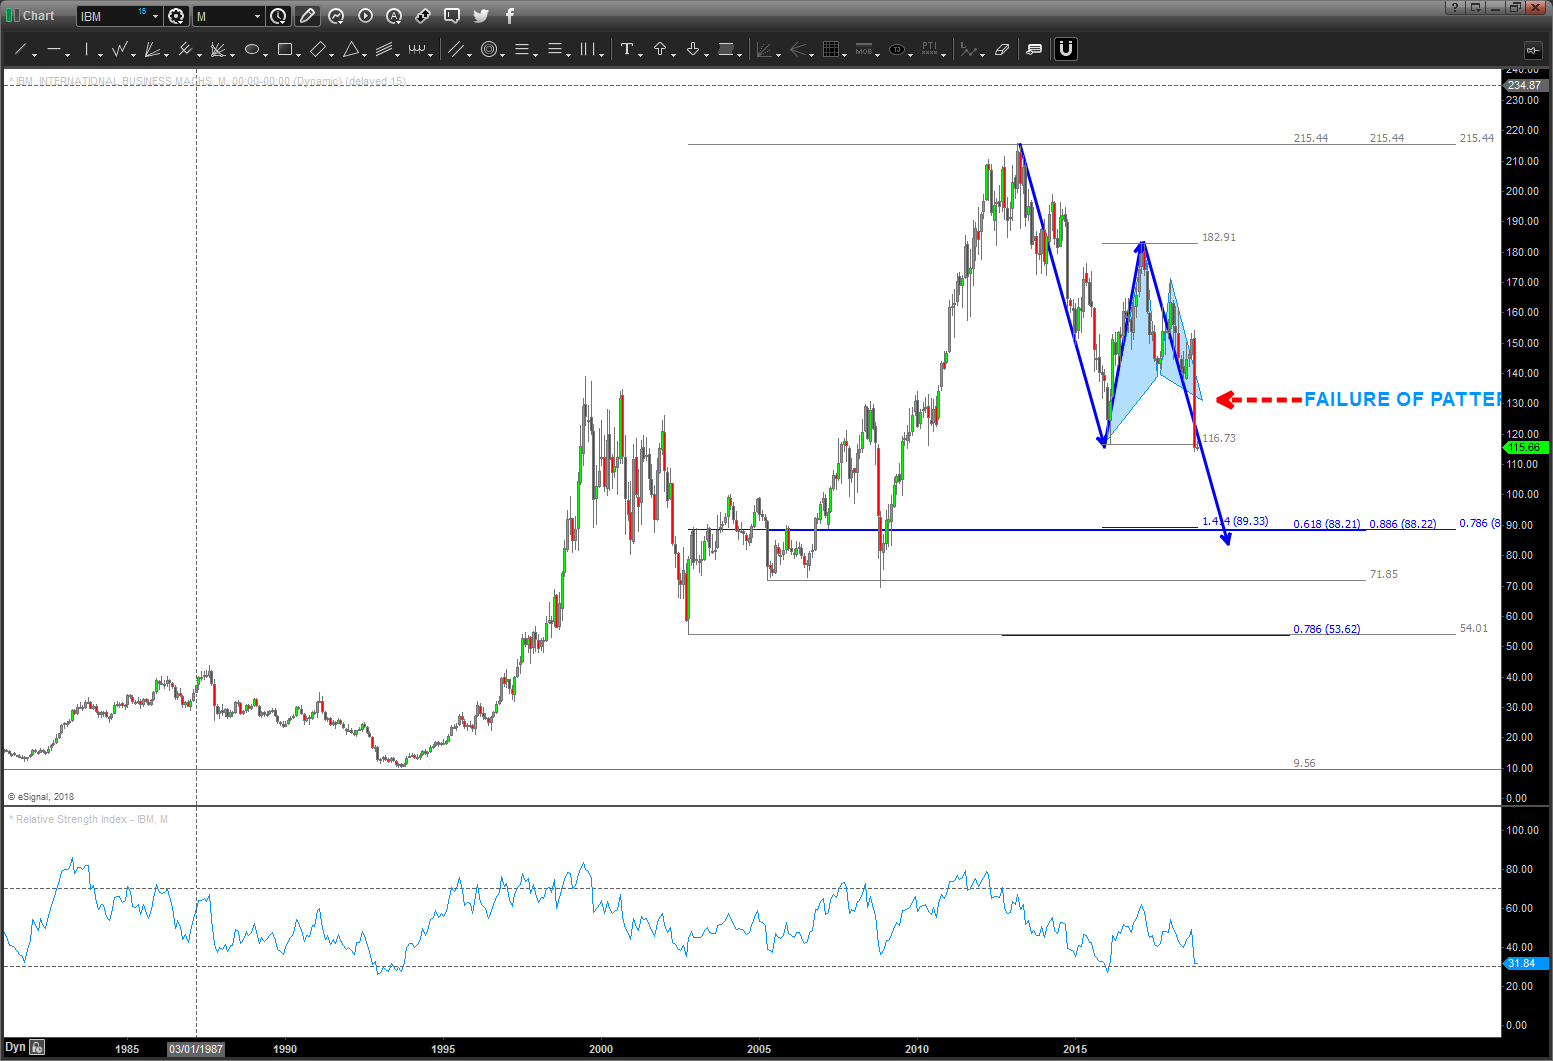
IBM pattern failure …
Posted on May 21, 2018 2 Comments
11/2/2018 – ouch.
The area labeled ‘FAILURE OF PATTERN BELOW’ is one of those levels that ‘should’ have acted as extremely nice support for IBM. Guess the operative word is ‘should’ w/ regard to that last sentence. Take a look at that candle … boom. That folks, is what a pattern failure looks like.
so, if you look below, it’s now setting up for a support zone (dare I say BUY zone) in/around 88-89. I’ll do some more work on it over the weekend but the BUY PATTERN mentioned w/ @seeitmarket went the way of the buffalo.
Bart
certainly appears to be setting up for a nice one …
Bart

