the last time this happened the market corrected 26 percent …
Posted on November 9, 2017 Leave a Comment
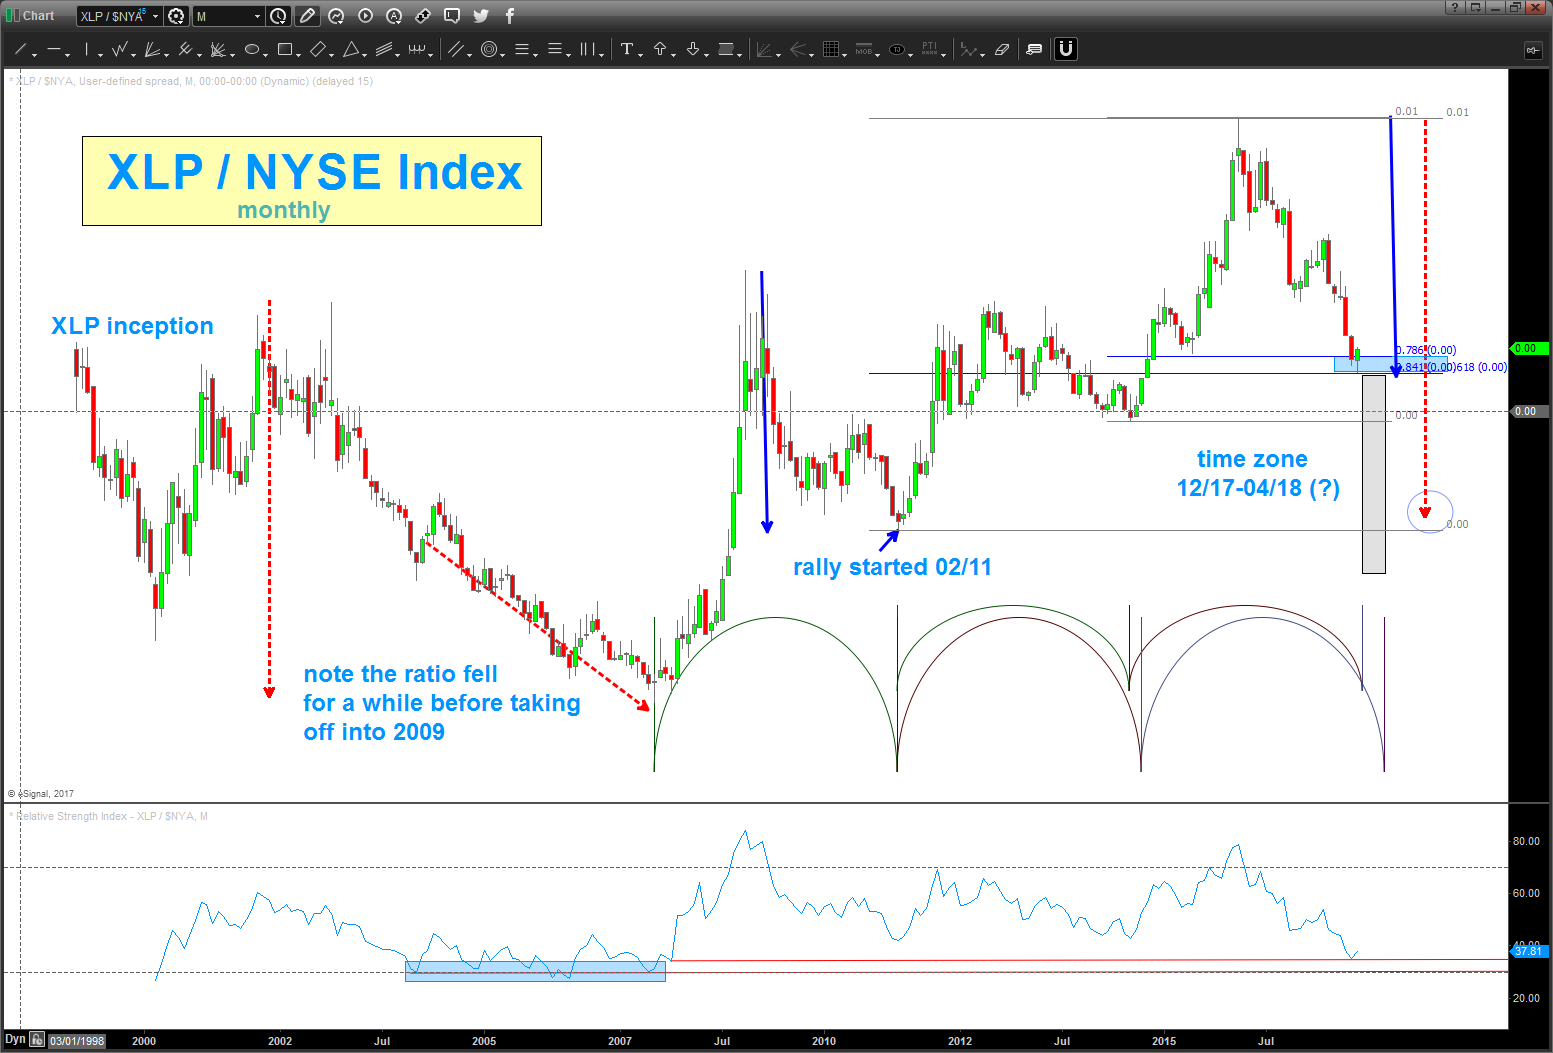
11/9/2017 – as you can see below and on other post we have been hawking the ratio analysis of XLP / NYSE Index. Won’t go into the why here as that has been done a number of times.
some key points to consider:
- we have completed the EXACT measured move correction and biggest since the 2009 lows.
- the last time this happened the market corrected 26% – just calling it like I see it.
- from a timing we are still not in the ZONE so it could shuck and jive here …
- RSI has hit the lower end of the range BUT note it banged around this level for a while as the market (overall market) kept going higher into 2000. so, it doesn’t HAVE TO cause a reaction.
- and, one last, today the market lost some ground right as the ratio was completing the measured move that we’ve been talking about for weeks if not months. questions?
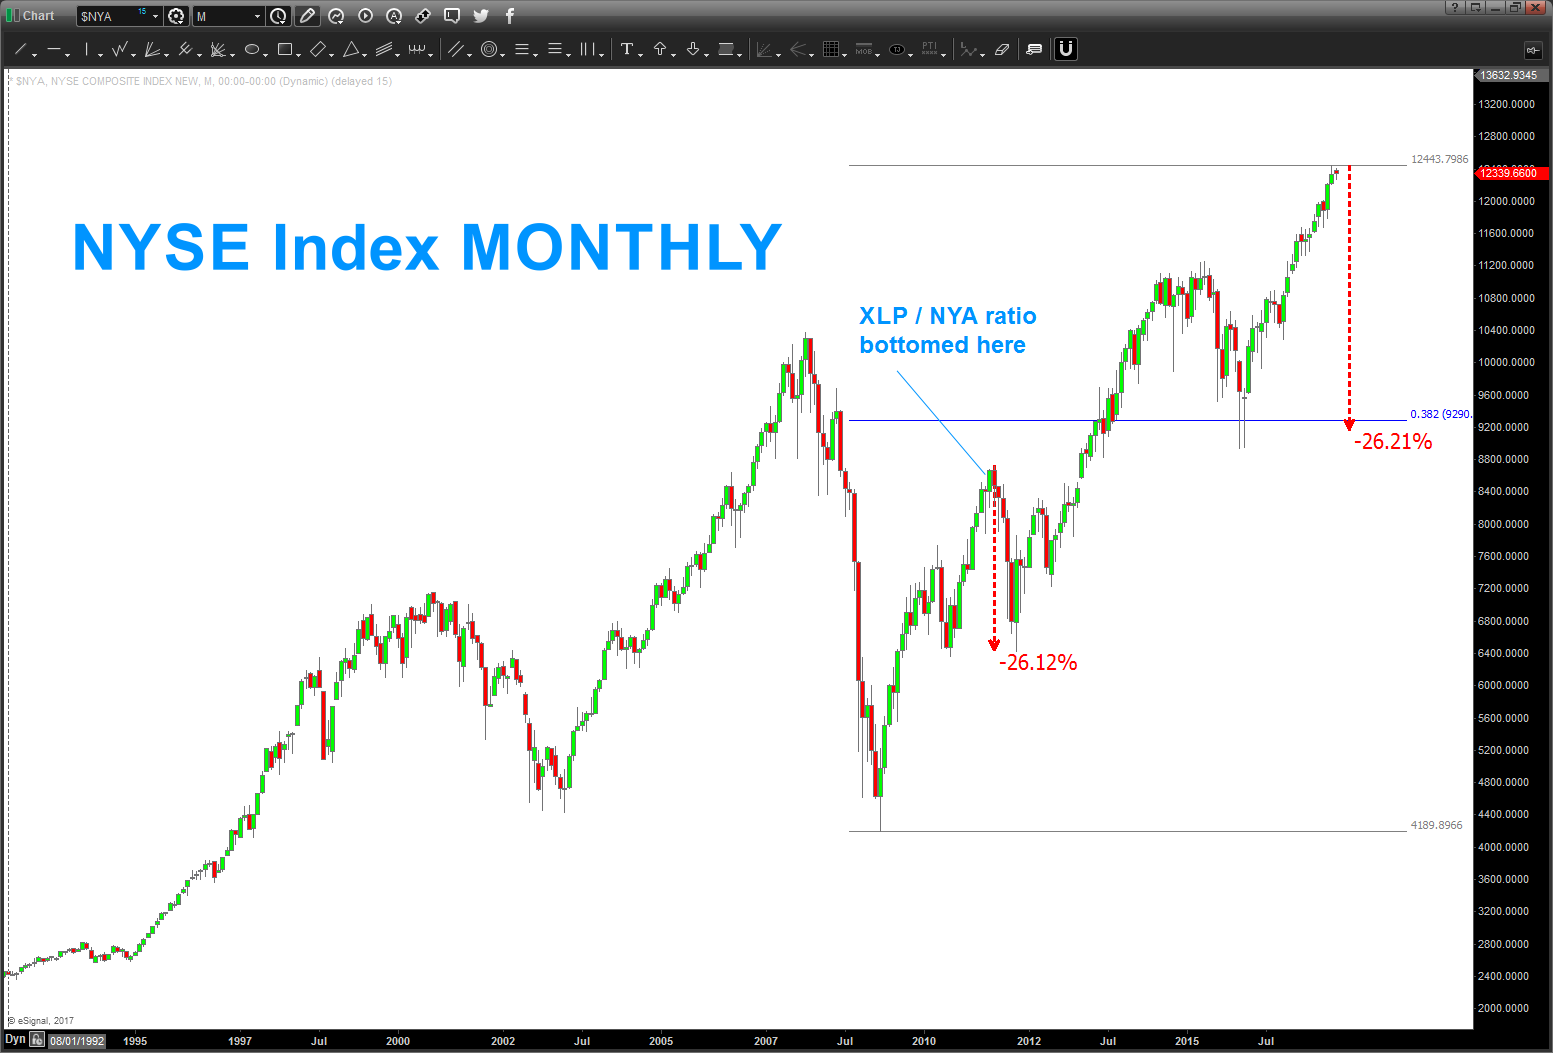
- two charts – an update to the ratio and the NYSE Index showing how it delayed for a month once the ratio bottomed and then sold off 26%
keep an eye on this ratio!
NYSE Index showing correction once the ratio bottomed
——————————————————————————————————————————————–
10/26/2017 – as you know, we were looking for support to hold on a .382 retracement of the XLP/NYA ratio. this support would cause a bounce or a move higher in the ratio and therefore bring volatility into the market. NOT EVEN CLOSE … that level has been pierced and now lower targets are shown.
folks, if your thinking of shorting I would wait .. when .382’s from all time lows don’t even cause a weekly/monthly move then something bigger is at hand going on …
I did some basic cycle work to show a time zone when the next support could come in December 2017-April 2018.
Until we elect a weekly or monthly signal reversal candle in this key ratio I wouldn’t touch the short side.
Bart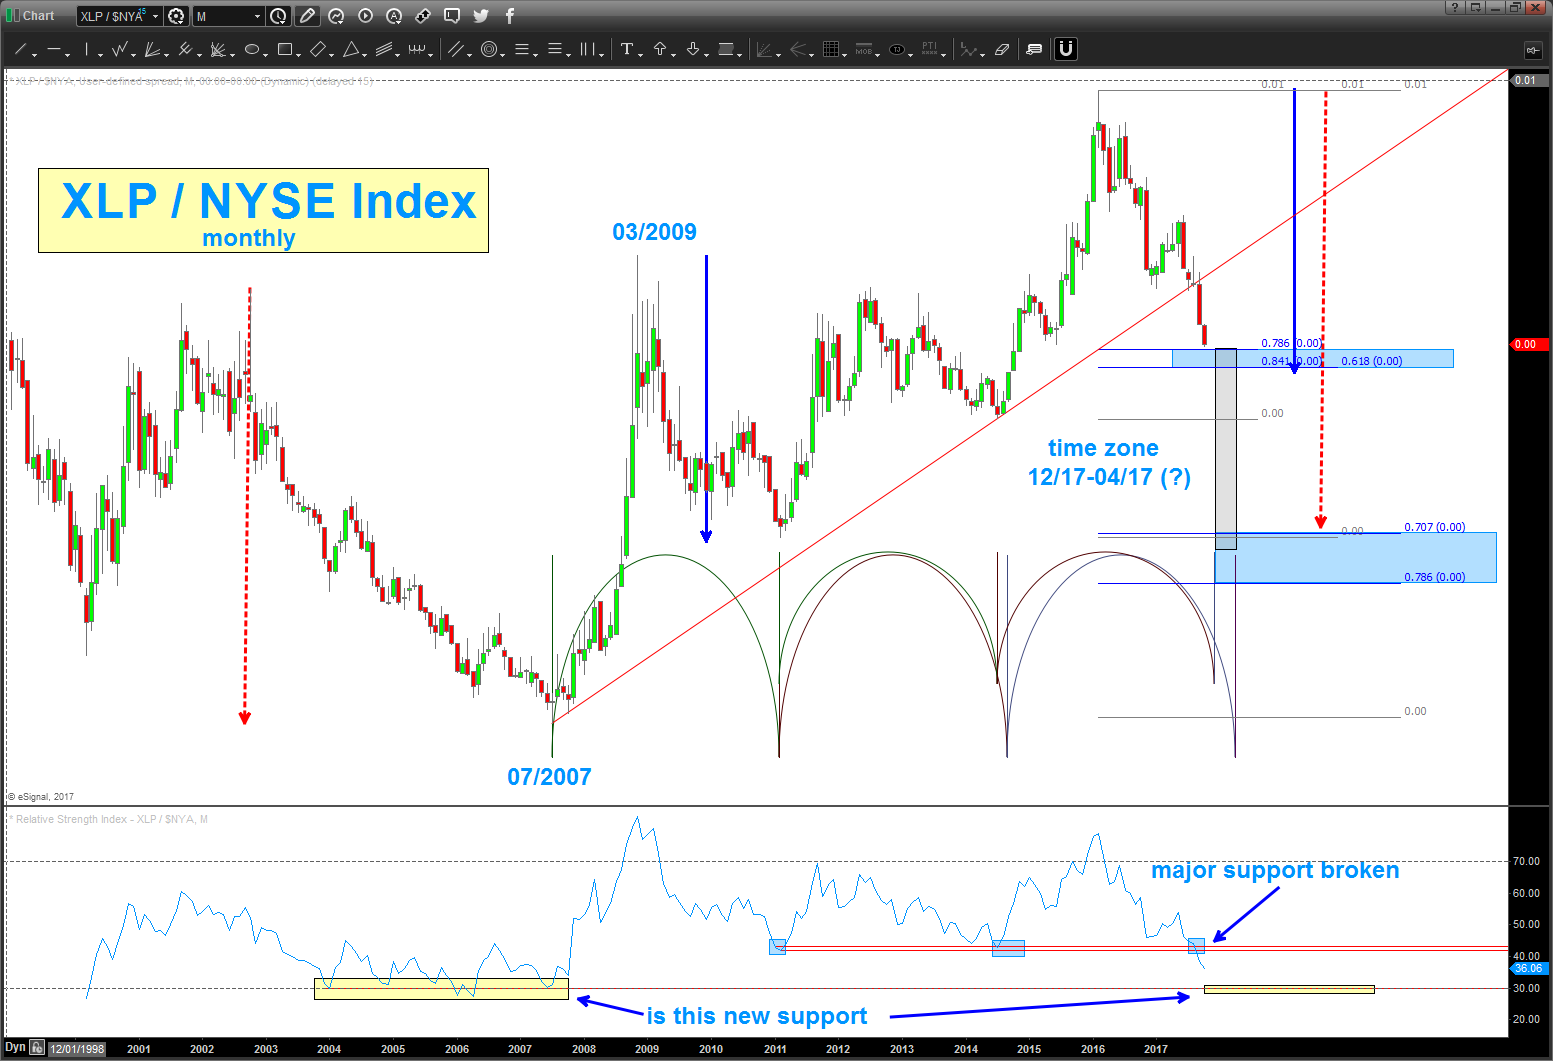
XLP / NYA ratio analysis update
Posted on October 26, 2017 Leave a Comment
10/26/2017 – as you know, we were looking for support to hold on a .382 retracement of the XLP/NYA ratio. this support would cause a bounce or a move higher in the ratio and therefore bring volatility into the market. NOT EVEN CLOSE … that level has been pierced and now lower targets are shown.
folks, if your thinking of shorting I would wait .. when .382’s from all time lows don’t even cause a weekly/monthly move then something bigger is at hand going on …
I did some basic cycle work to show a time zone when the next support could come in December 2017-April 2018.
Until we elect a weekly or monthly signal reversal candle in this key ratio I wouldn’t touch the short side.
Bart
Pound … almost time? UPDATE to the UPDATED and UPDATED 10/22/2017
Posted on October 22, 2017 Leave a Comment
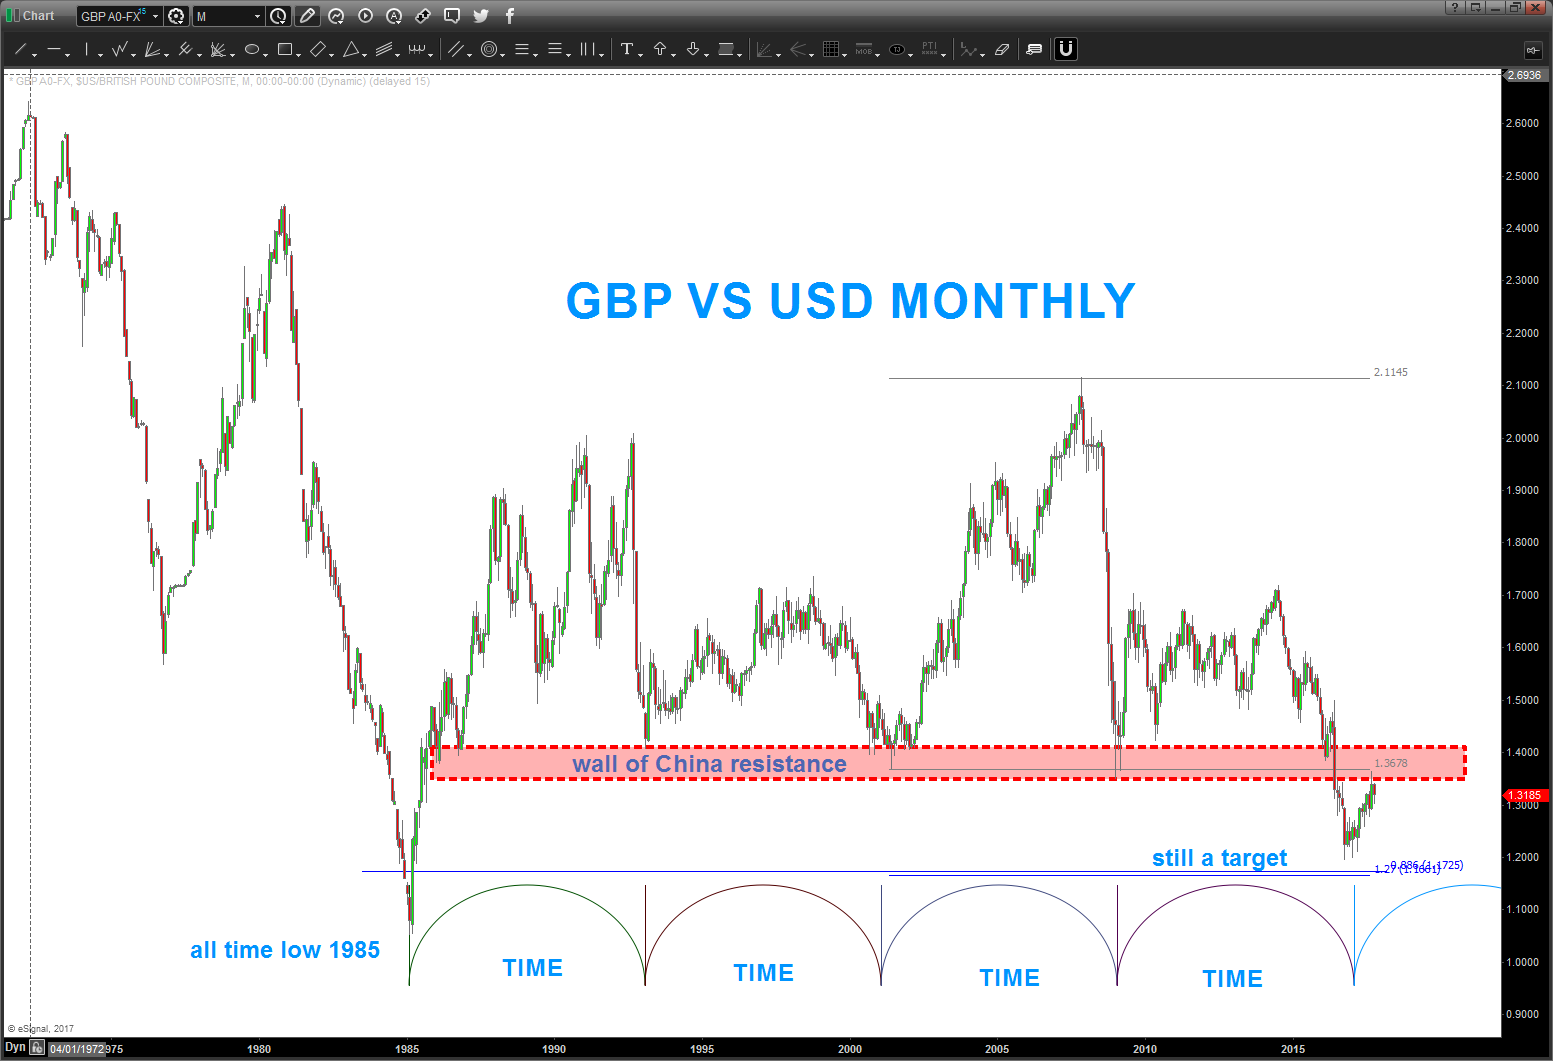
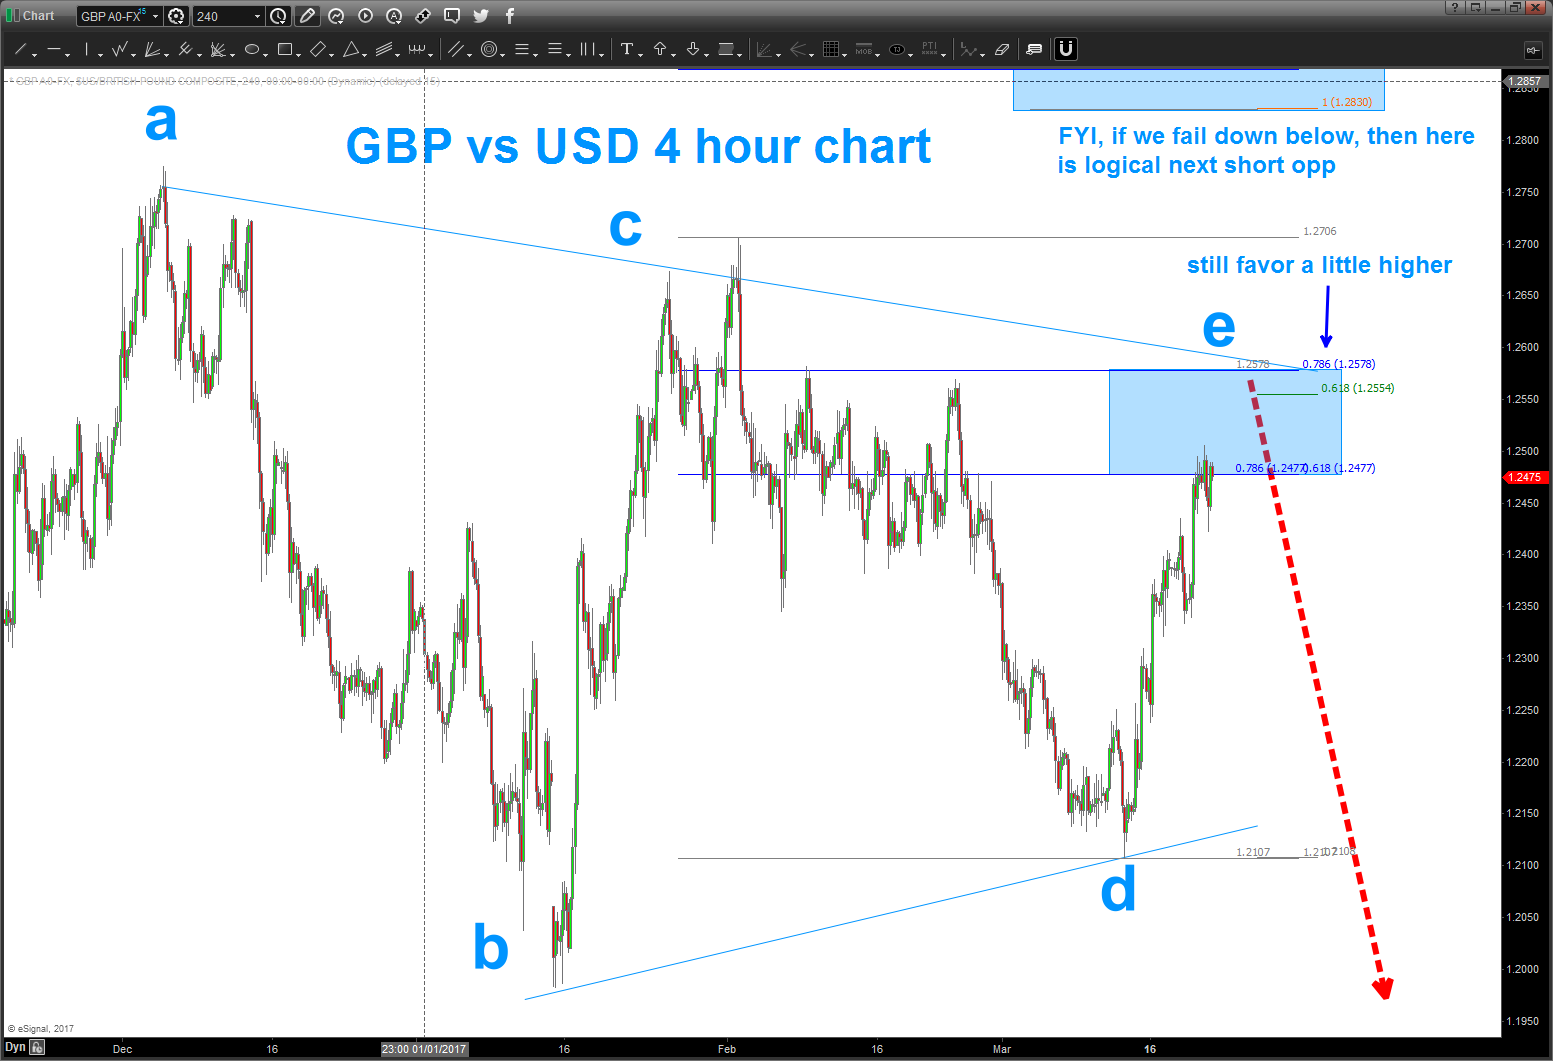
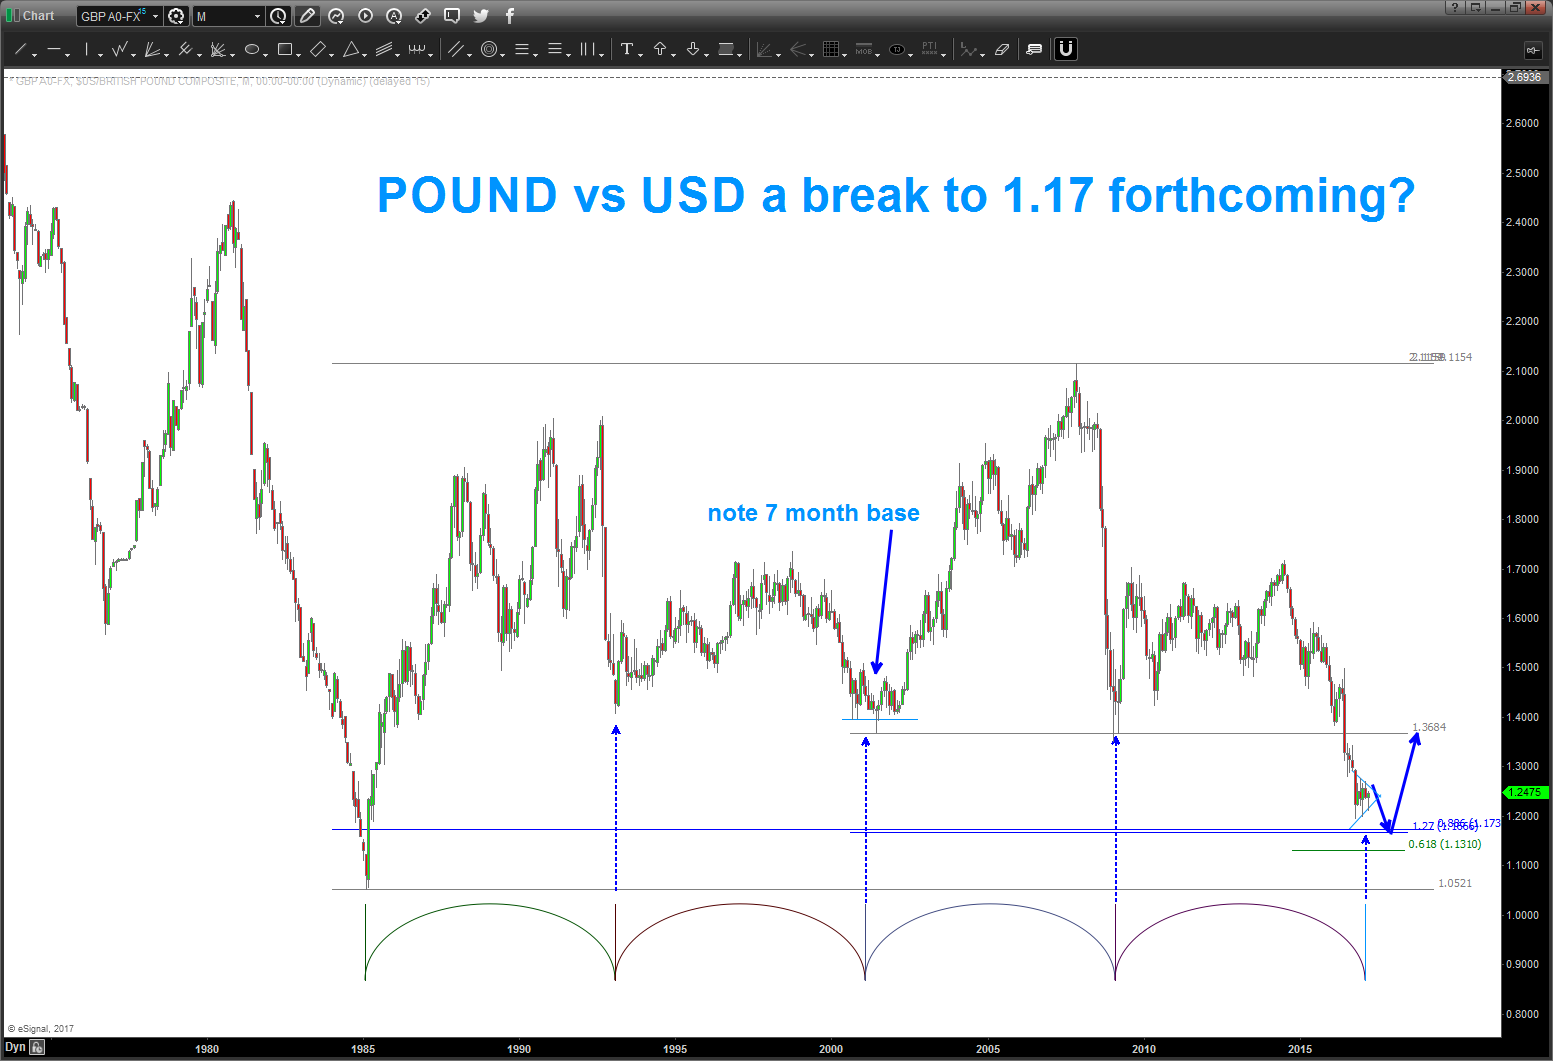
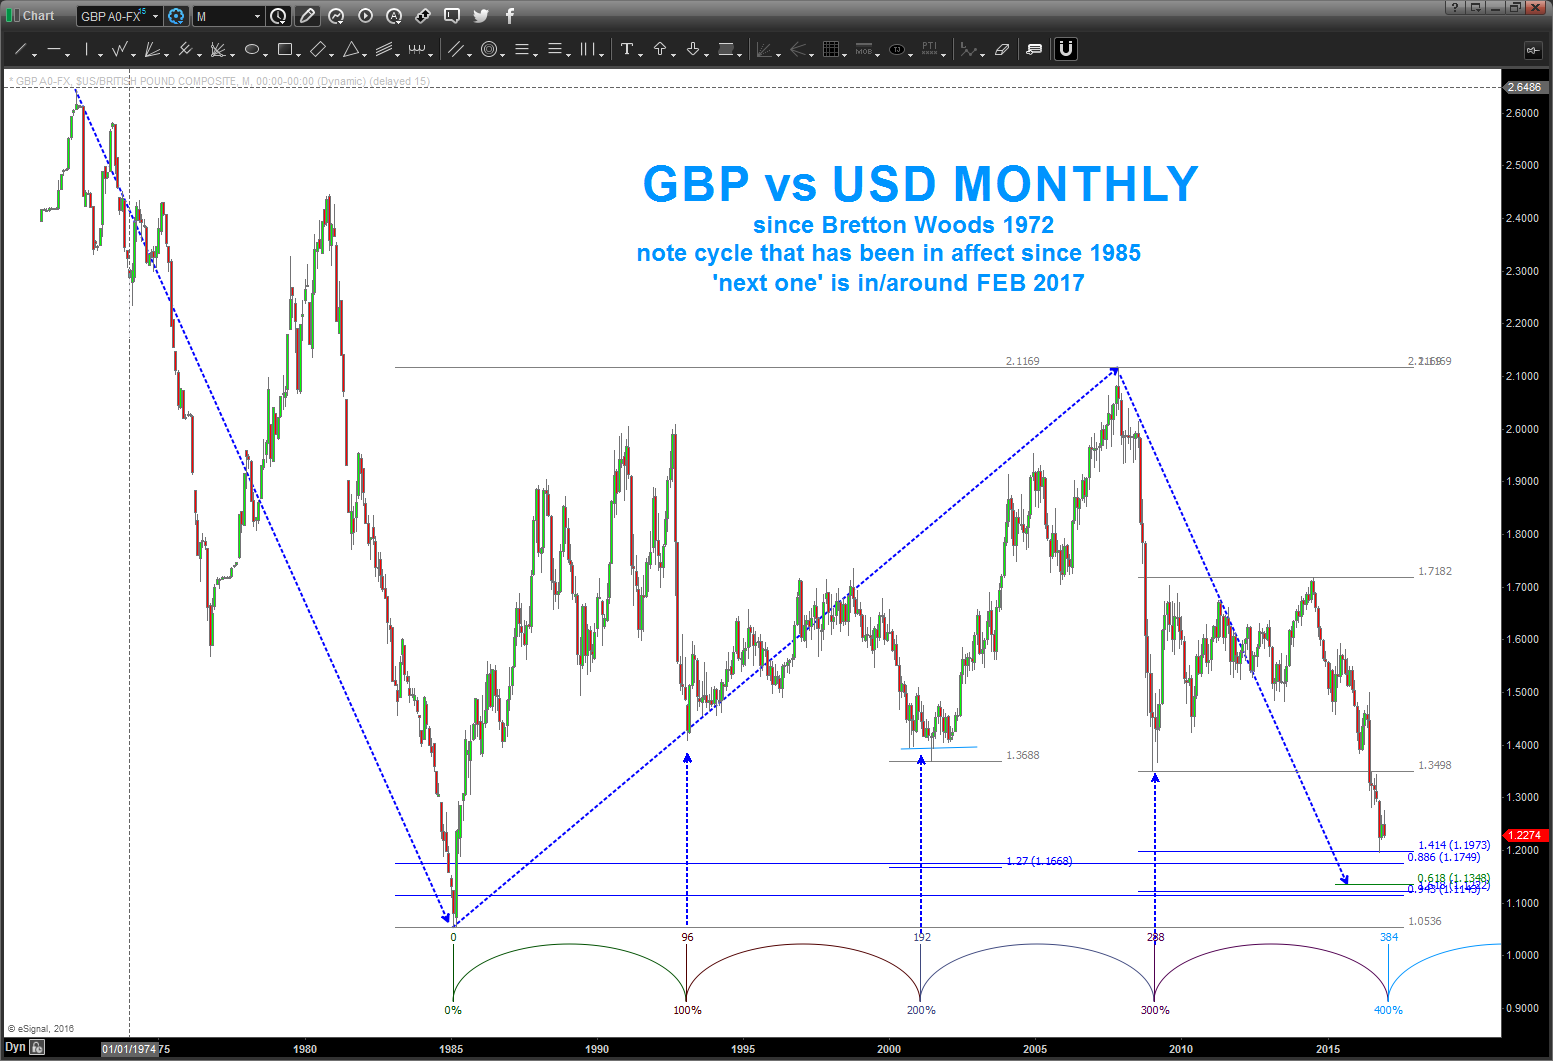
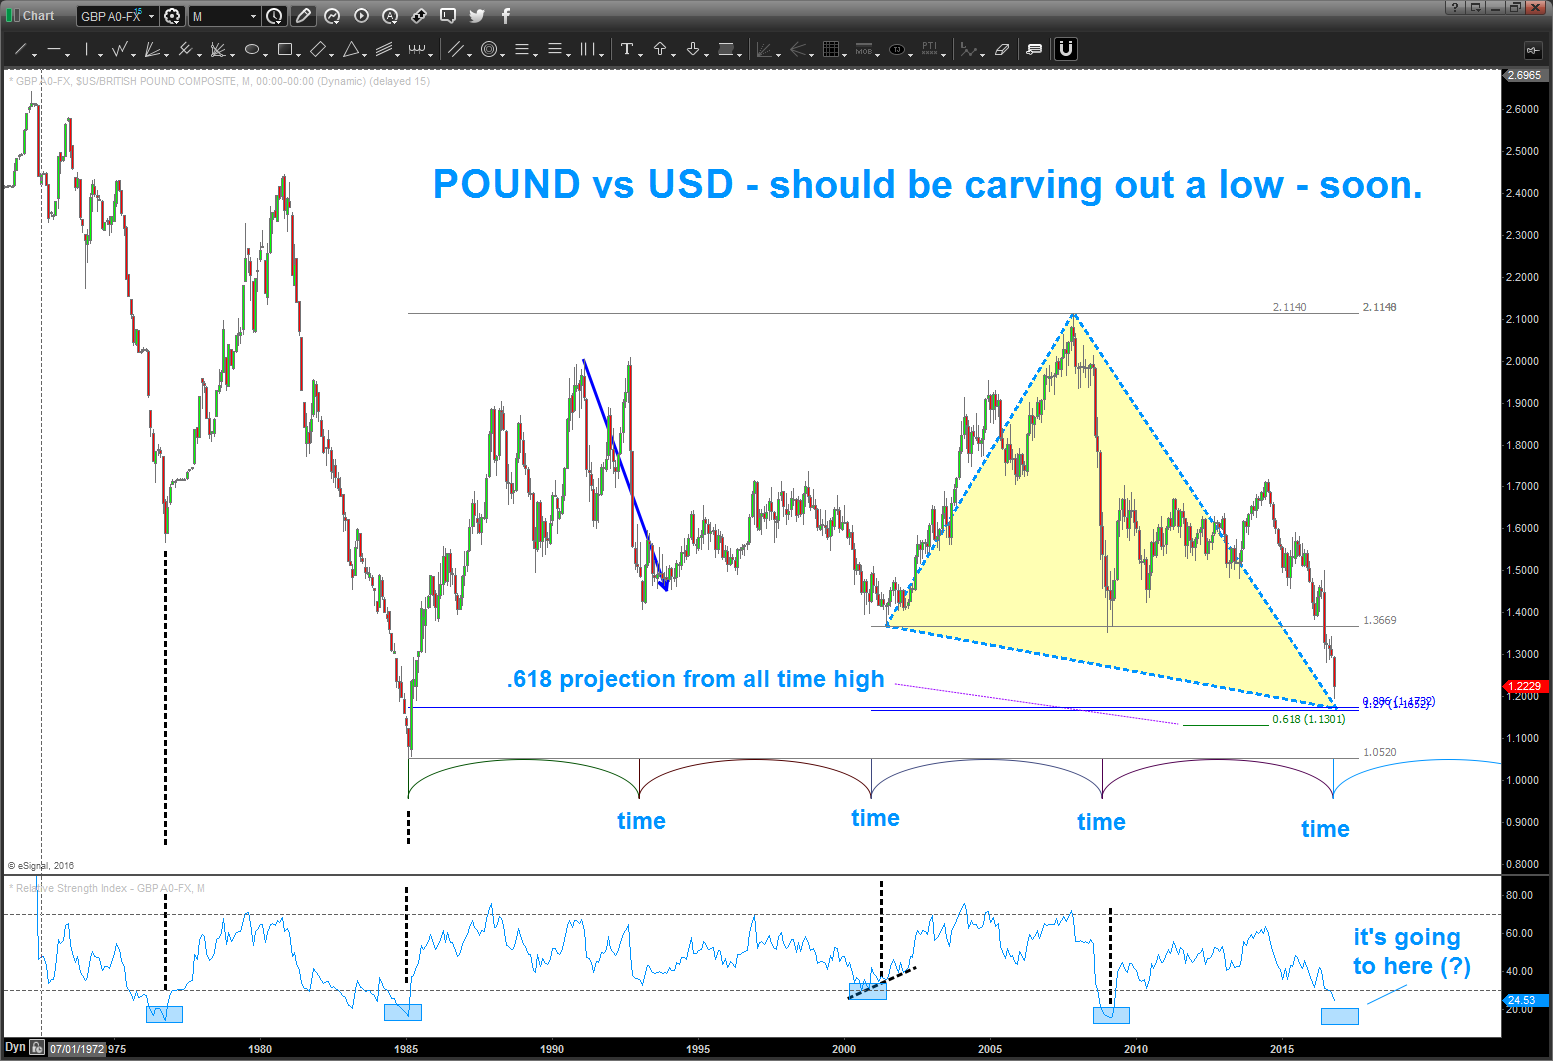
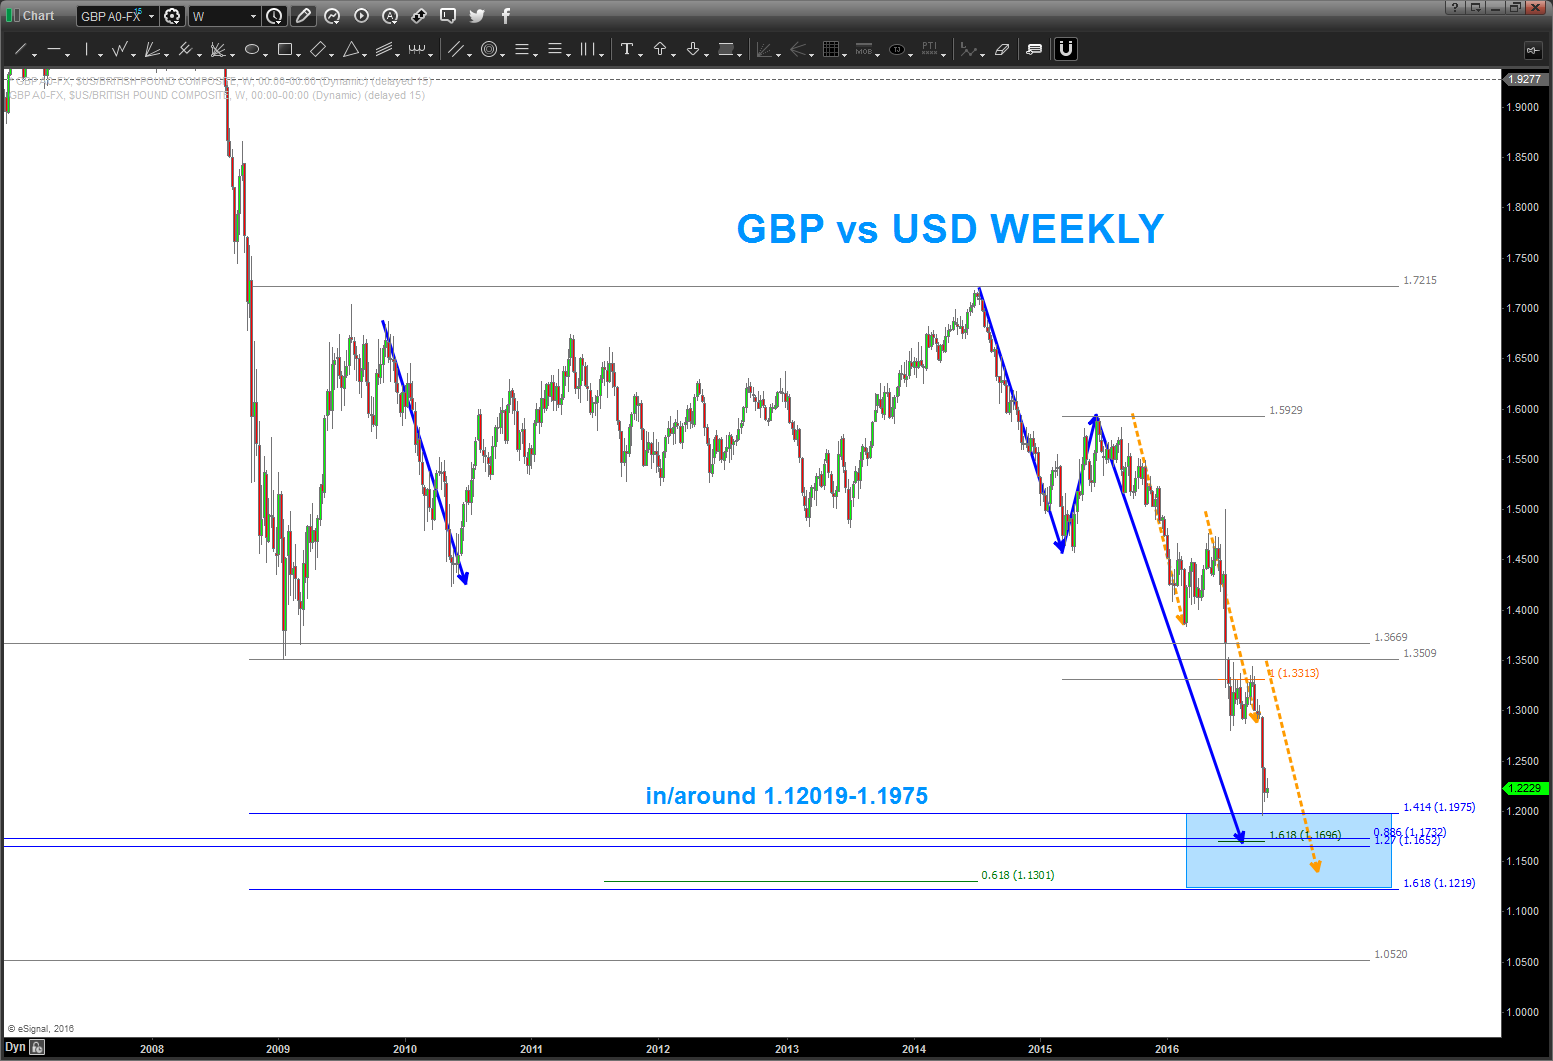
10/22/2017 – pound smacked into a wall of China resistance area. this one is tough … as you can see below, we did NOT work the triangle correctly and the rally continued into the polarity zone. the reason it’s tough is because of the very nice and basic time cycle shown below. it’s almost perfect and, for roughly 30 years, this cycle has caused the pound to explode higher … the ‘middle cycle’ in the time of 2000-2002 based for a while before exploding. so, do you trust POLARITY of the CYCLE? Call me crazy but I’m in favor of the cycle for now and will be looking for a BUY opportunity over the coming weeks/months as the ENTIRE WORLD has stops right above the Polarity Wall of China resistance area ….I’ll just try to look for a pattern.
it will work or it won’t … a very interesting time indeed.
—————————————————————————————————————————————————-
03/22/2017 – Pound carving out a triangle and then a dump into the 1.17? Only time will tell.
___________________________________________________________________________________
12/26/2016 – still looks like we have a little more time to go into the lows. perhaps a little lower at the targets shown (?)
USD vs Japanese Yen coming close to resolution (?)
Posted on October 22, 2017 Leave a Comment
10/22/2017 – we discussed the ‘RSI SHIFT’ below. taking note of it again …have been on the sidelines w/ regards to the USD vs YEN as I’m waiting for resolution of the downtrend line shown …
note: still in the ‘maybe’ camp of 2 being done … so were going to be watching the YEN very closely in the coming days/weeks. In the past, YEN strength hasn’t been too good for US Stocks …

—————————————————————————————————————————————————————————
here’s some work that I’ve been doing on the YEN: https://bartscharts.com//?s=yen
just taking a look at the weekly RSI and, when I trained under Constance Brown she said “the market will tell you when it’s shifting, watch the RSI zones for clues.”
as you can see below … the, what I believe, multi-decade wave 5 occurred in 10/2011 and a VERY powerful advance occurred. You’ve read about my chaos w/in the YEN and how I got stopped out something like 6-8 times (I’ve tried to flush it from my memory) in around 76 ..(yes, 76! and, no one said this was going to be easy!) for what I was expecting was going to be a monstrous ride.
anyway, note how support SHIFTED up after the decades long bear trend … (see dashed green lines) and how, after this correction – which might be pretty much complete it the support and resistance has now shifted down (see dashed red lines) ….
I’m in no mans land right now .. while I believe another advance of the USD against the YEN may be forthcoming I would have really liked to see the RSI resistance SHIFT back up into the 80’s. So .. while our ‘count’ isn’t complete in this wave, I’m going to step aside and see what happens the rest of the month.
as you can see w/ the ???? it’s time to sit on my hands and see what plays out … that’s only me. you do what you want and follow our plan, as always.
Bart

Proctor and Gamble Pattern
Posted on October 21, 2017 Leave a Comment
PG – lot’s going on here. went up and hit 1.618 extension last week …monthly. daily showing 3 drives to a top also …

KO Coca Cola
Posted on October 21, 2017 Leave a Comment
KO is flirting w/ another breakout to the upside near/around all time highs …
note:
- the monthly .618 price projection is the ‘reason’ for the resistance at 45.66
- the TIME component is .618 the last run and it’s hitting right now …
- perhaps, a double top?
- 3 drives to a top (dashed orange lines) present
IF we get a very strong weekly close higher, then 61 area is the next ‘logical’ stopping point ….

