S&P 500 logical stopping point …
03/31/2018 – I love measured moves. Frankly I think they are 1/ the easiest and most powerful indicators we have as technicians and 2/ one of the least used.
If you remember it’s how what we used to make an amazing buy on crude as it was plunging into it’s lows … measured moves on monthly/weekly charts is good.
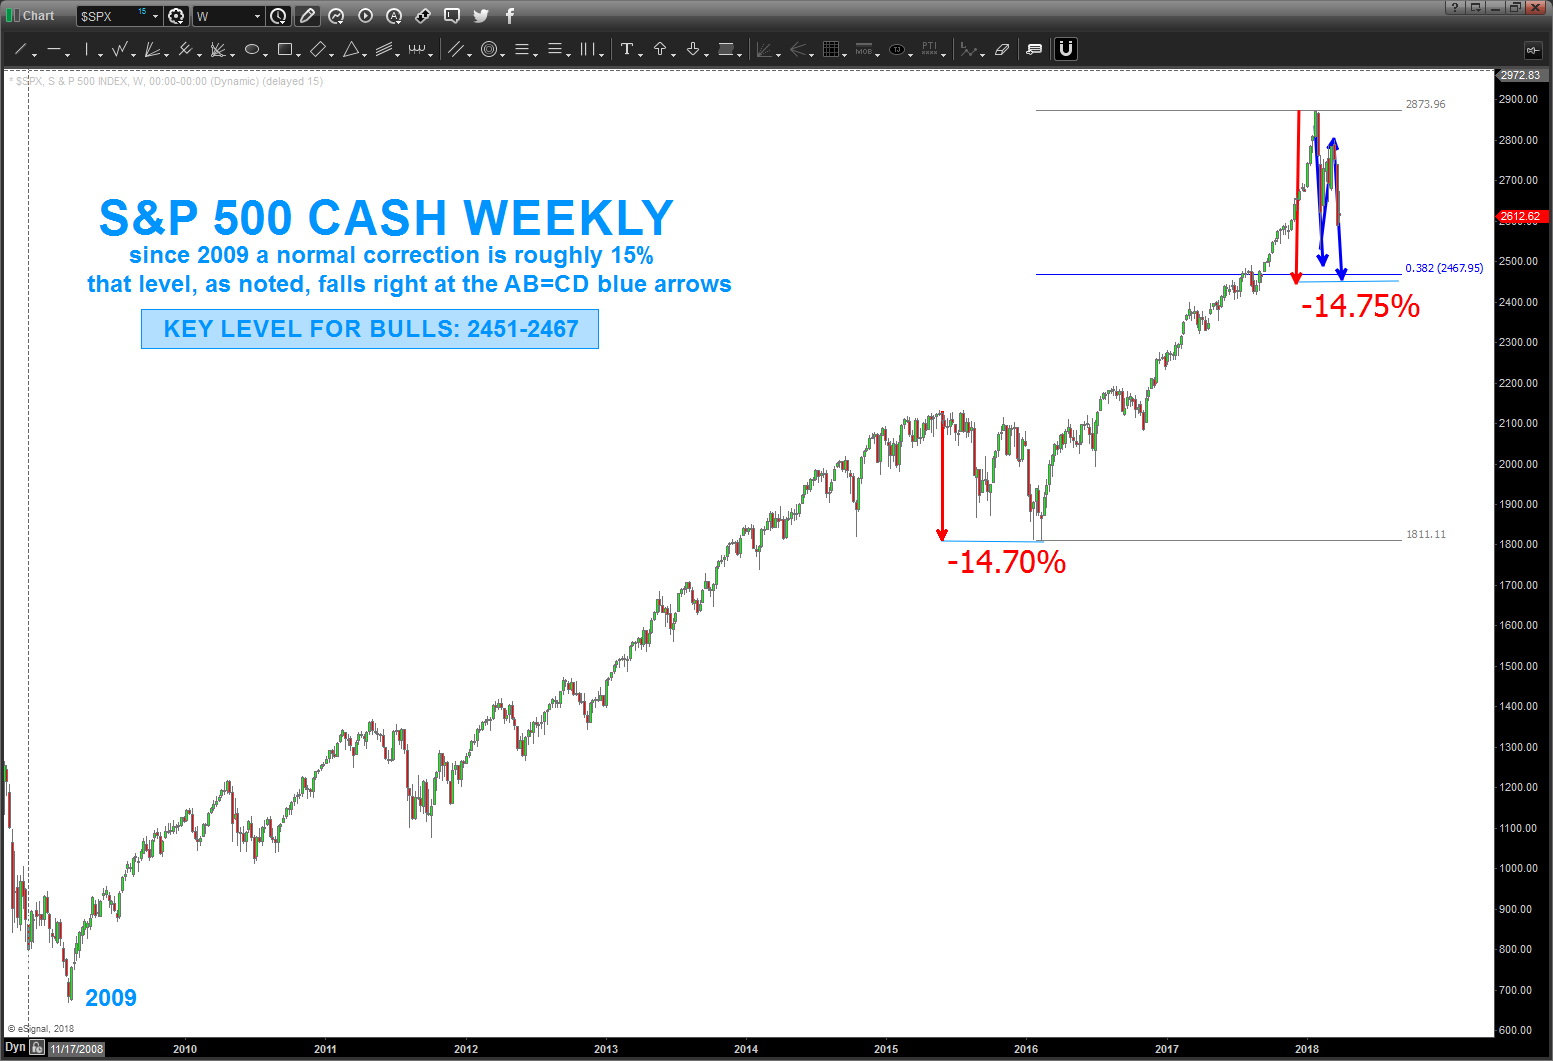
in this case we are looking at the S&P 500 cash. note, since the 2009 bull run the largest correction we’ve encountered has been 14.70% in/around 2015-2016.
if we take that SAME corrective move of 14.75% and overlay it on top of the monthly we come in around 2451.
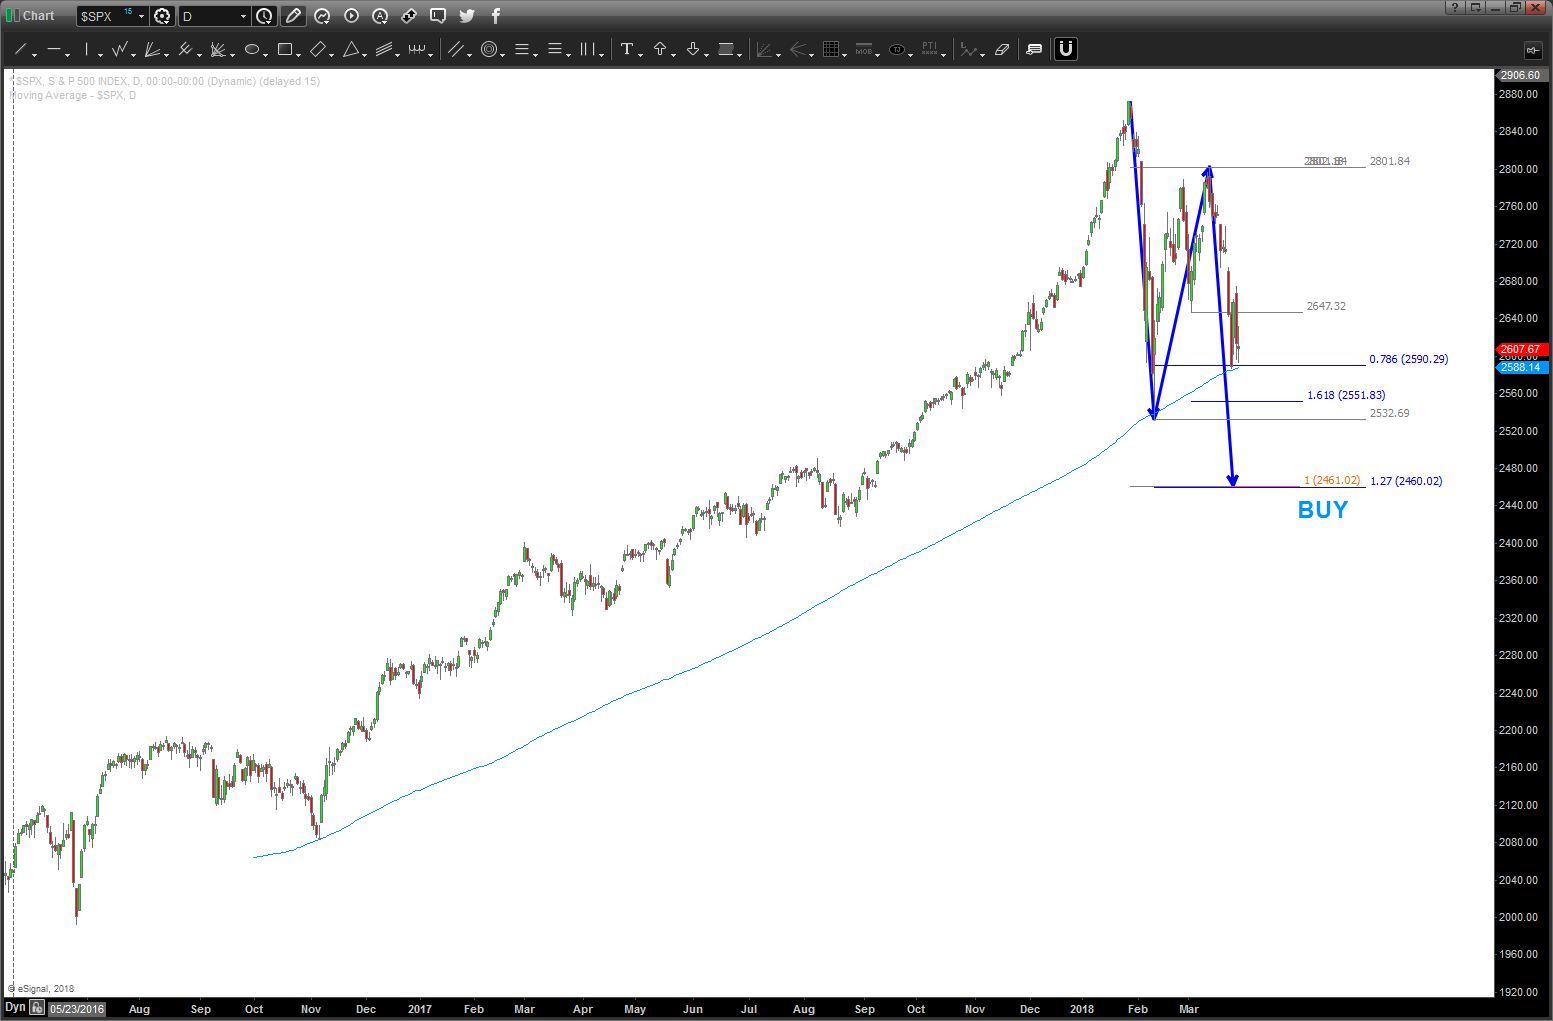
now, if we do ‘basic’ pattern recognition work we have a perfect BUY right/in around that level. necking down to the daily (second chart below) you can see how all the numbers are coming together in/around 2451-2467. My take, IF (the big IF) this bull market has steam, then this level ‘should’ hold and we go up nicely …
now, it’s just a pattern and DOES NOT have to work – it’s just probability folks. that being said, trends are given life and and have life taken from them w/ failed patterns and patterns that work.
as for me, this level is 1/ the same corrective move of 14.7% and a near perfect BUY pattern as shown. makes it interesting …
Bart