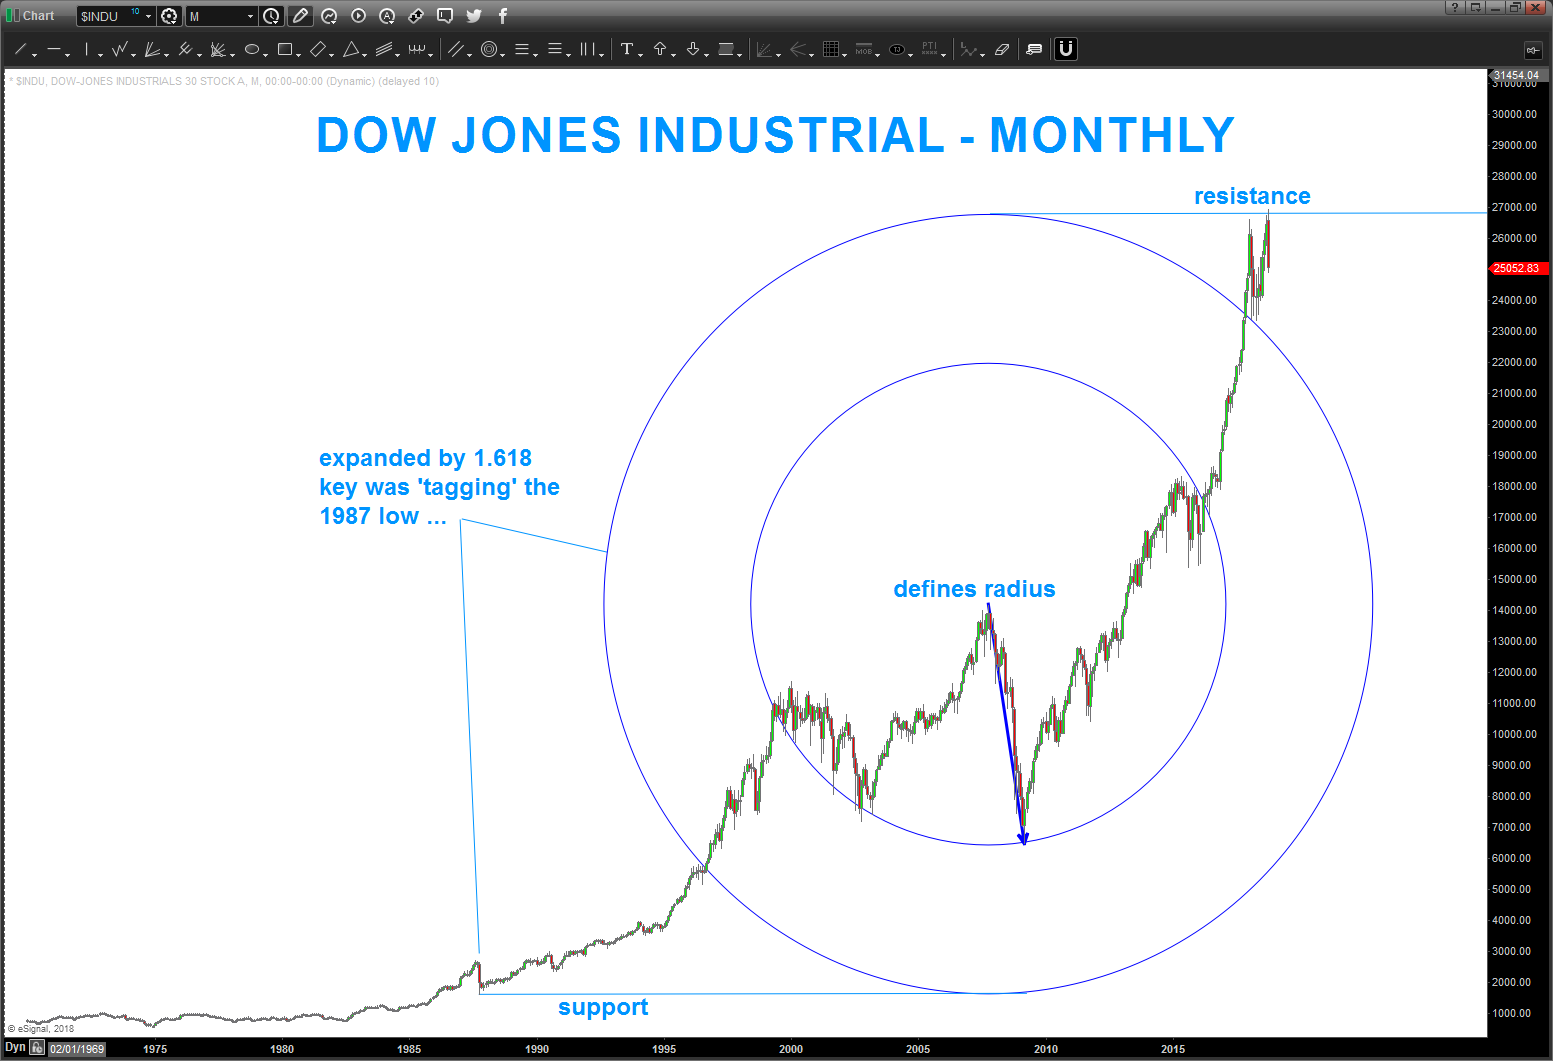
I like to draw circles … just work w/ me. how the 1987 low and recent high are connected by geometry
a couple weeks ago I posted this: https://atomic-temporary-44460632.wpcomstaging.com/2018/08/30/jpm-and-tops-of-circles/
it was some geometric work I did on JPM and ‘real time’ the top of a circle. I do have a theory of ‘why’ this technique works in projecting support or resistance but I’ll leave that to me and some of my friends. it really doesn’t matter – does it?
i’ve been silent on the blog world for a bunch of reasons .. the main reason is a loss that occurred in my family and I really haven’t felt like doing much. but, the emails have been coming in about the most recent moves.
if you go back and read you’ll find that I was pretty defensive for the entire summer .. did we/me miss some of the last part of these moves – yes but ultimately, the only buy pattern around was ABX and GE. TBT was also a nice play but the chaos of the euphoria just had me step aside.
so in order to get back into it, I put some Enigma on the Spotify and, specifically, Morphing Thru Time .. pretty ‘trip-in-dicular’ to say the least.
I called up the Dow Jones and could just see the connection between the 1987 low and this most recent high. Tops of circles are cool.
Bart