the Shanghai Dominoes
Posted on June 5, 2023 1 Comment
I continue to pick up The 32nd Jewel by Connie Brown. I dust it off and continue down the rabbit hole. What has been happening of late is I’ll get about 10 pages (no kidding) into a section and then something pops up in the writing and … down the rabbit hole I go, again. Most recently it has been helping, a lot, to follow Mr. Robert Edward Grant. He might not know it – OK, high probability he doesn’t – but his information has (amazingly ;)) been perfect for when I get “stuck” in The 32nd Jewel.
Today, I was going BACK to the subject of “Lattice Diagrams” and came across the “leading and lagging” market chapter. It’s a wonderful chapter to dust off the basics and look at something that you haven’t researched or analyzed in a while.
What drew my attention was the discussion about China and the Shanghai Composite. In a nutshell, China is a “leader” w/in the global financial trends. It’s not hard to imagine that Australia, India and South Africa all depend on China.
Additionally, if you have been following this blog for a while, you can see/understand the Canadian and Australia correlation. Then, it’s known (not going to say widely) that the TSX (Canada) leads the S&P.
So what is China doing?
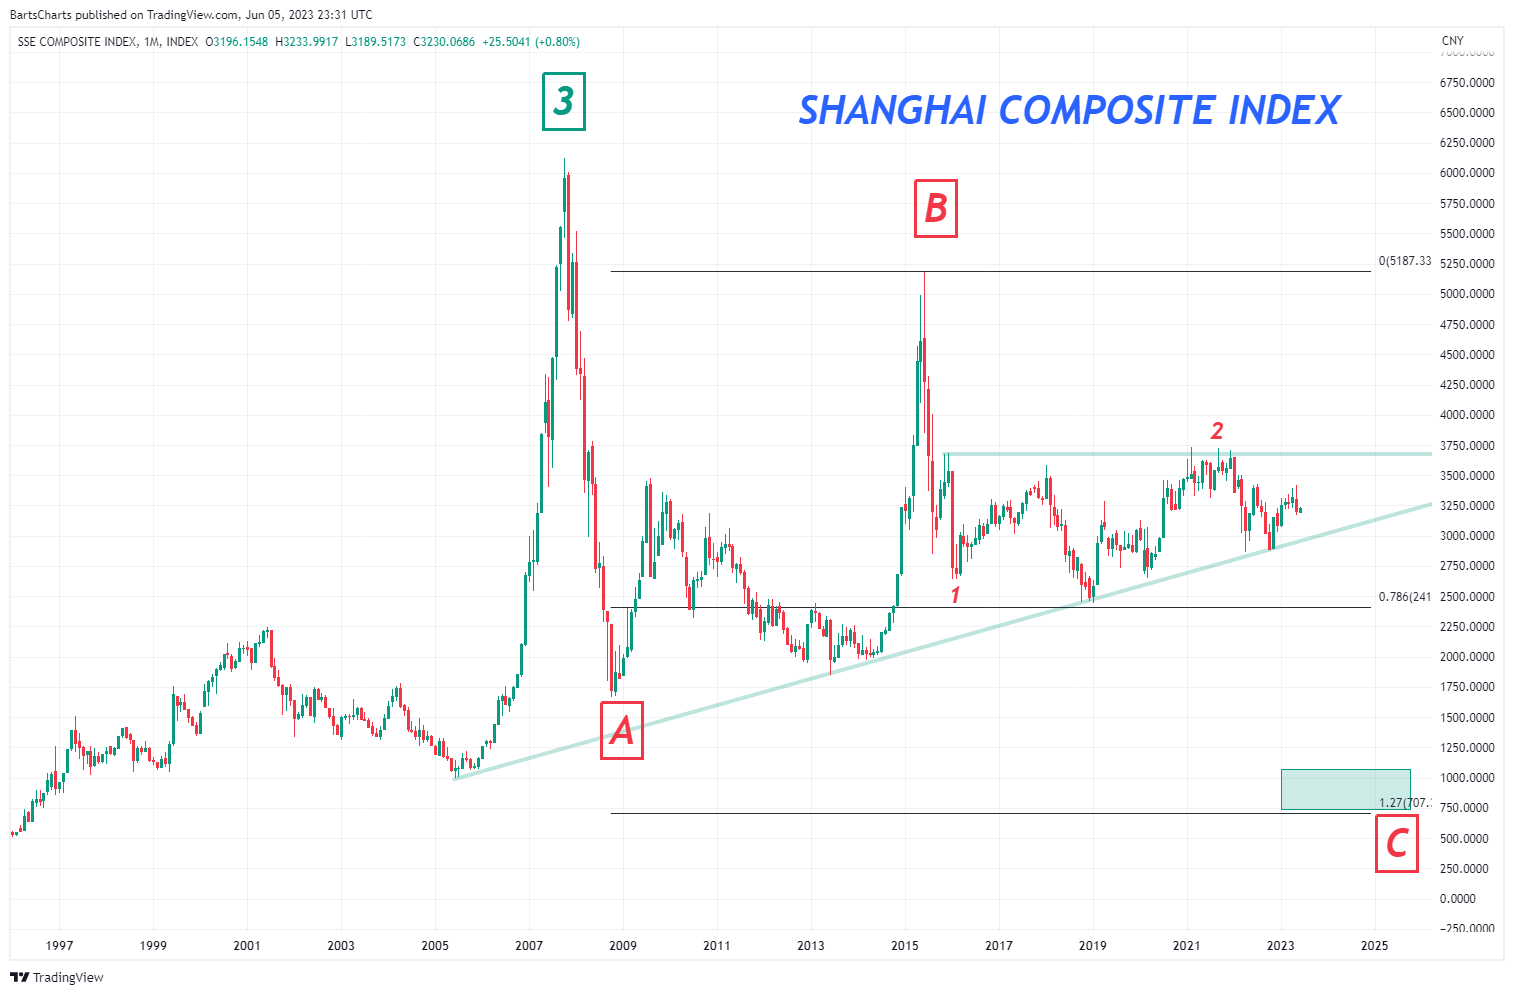
Well, on page 36 of The 32nd Jewel she gives a count that shows the Shanghai in a bearish “C” wave which portends to lower Shanghai which means the dominoes fall to the bears …folks, trust me here, you want Ms. Brown counting waves … she is, without a doubt one of the best in the world. So, took her count and I’ve added the 2. I’m staying away from a large multi year triangle thesis, for now. However, if we do break ABOVE 3750 BEFORE breaking below the trendline and the .786 it’s game on for the bulls.
For now, this is the count that appears to be the highest probability.
KEEP AN EYE ON THE SHANGHAI .. then, of course, the All Ordinaries (Australia), the Canadian TSX, the German DAX and the S&P500.
AVGO – May 30, 2023
Posted on May 30, 2023 Leave a Comment
Folks, thanks to @stocktwits and @howardlinzdon I wouldn’t have known about AVGO. OUCH …so, seeing in Howard’s feed I decided to just go take a look.
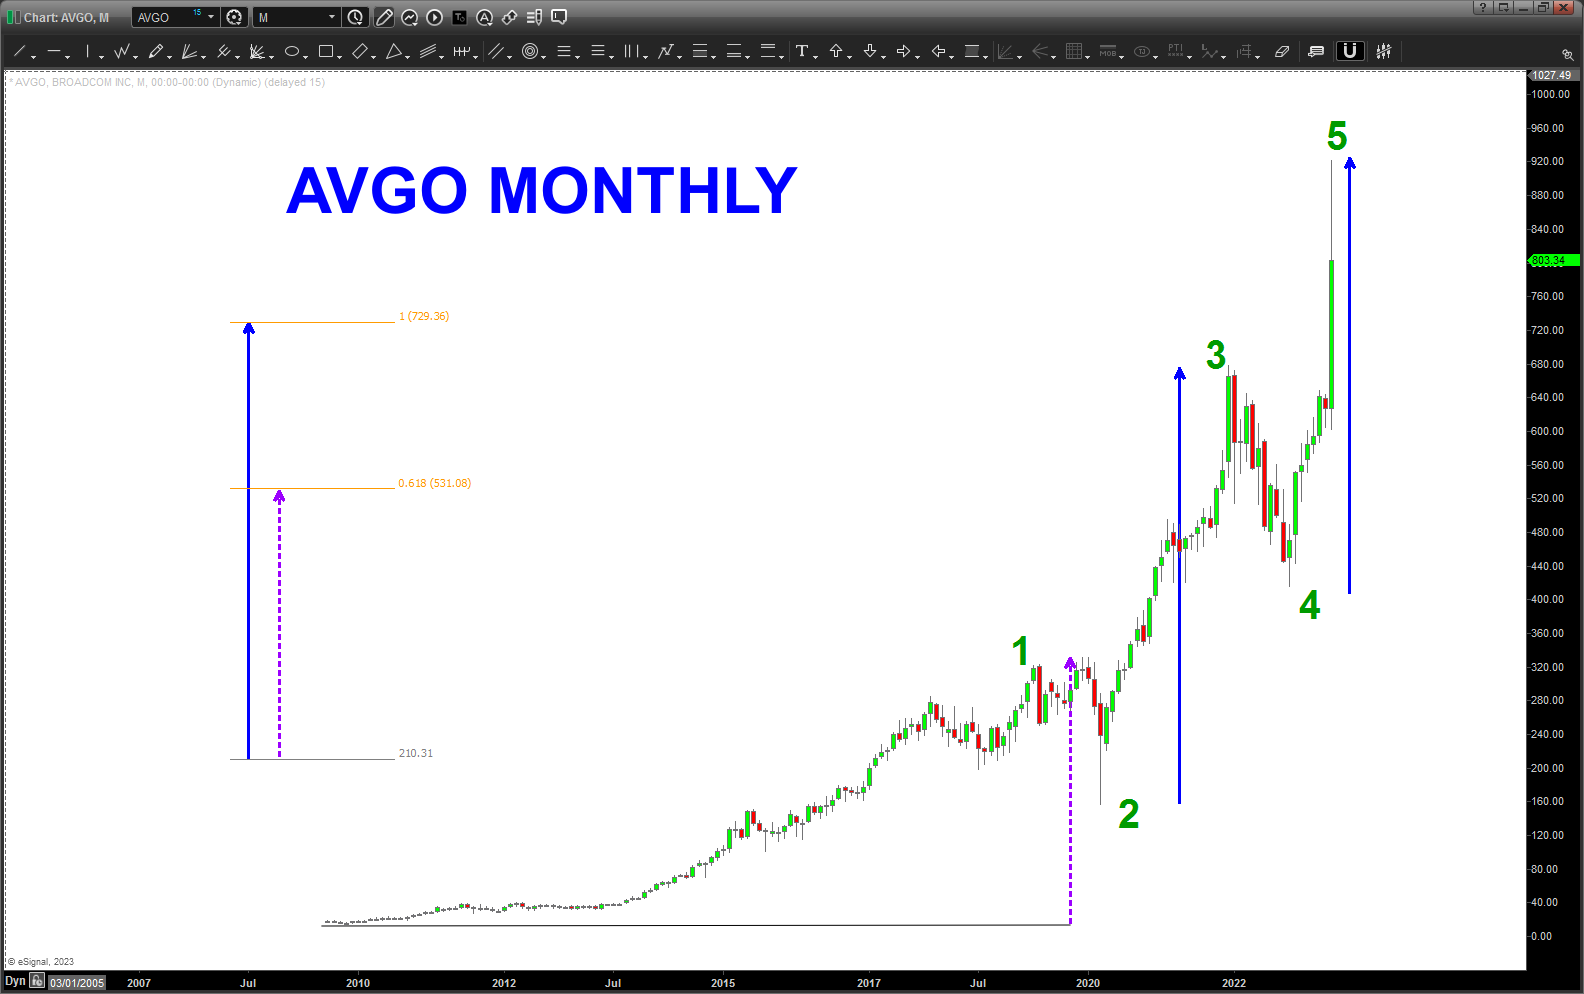
Amazing … take a look at this mathematical symmetry. Pretty amazing, isn’t it?
Yes, I know, it’s after the fact and I admit to that.
The cool thing is 1/ it’s still there (the math 🙂 ) but 2/ even cooler is my eye immediately saw it.
I tell you folks, the more you take off the charts, the more you will see.
Anyhoo, sure looks like a 1-2-3-4-5 and w/ that symmetry and math, along with today’s action certainly appears that is all she wrote!
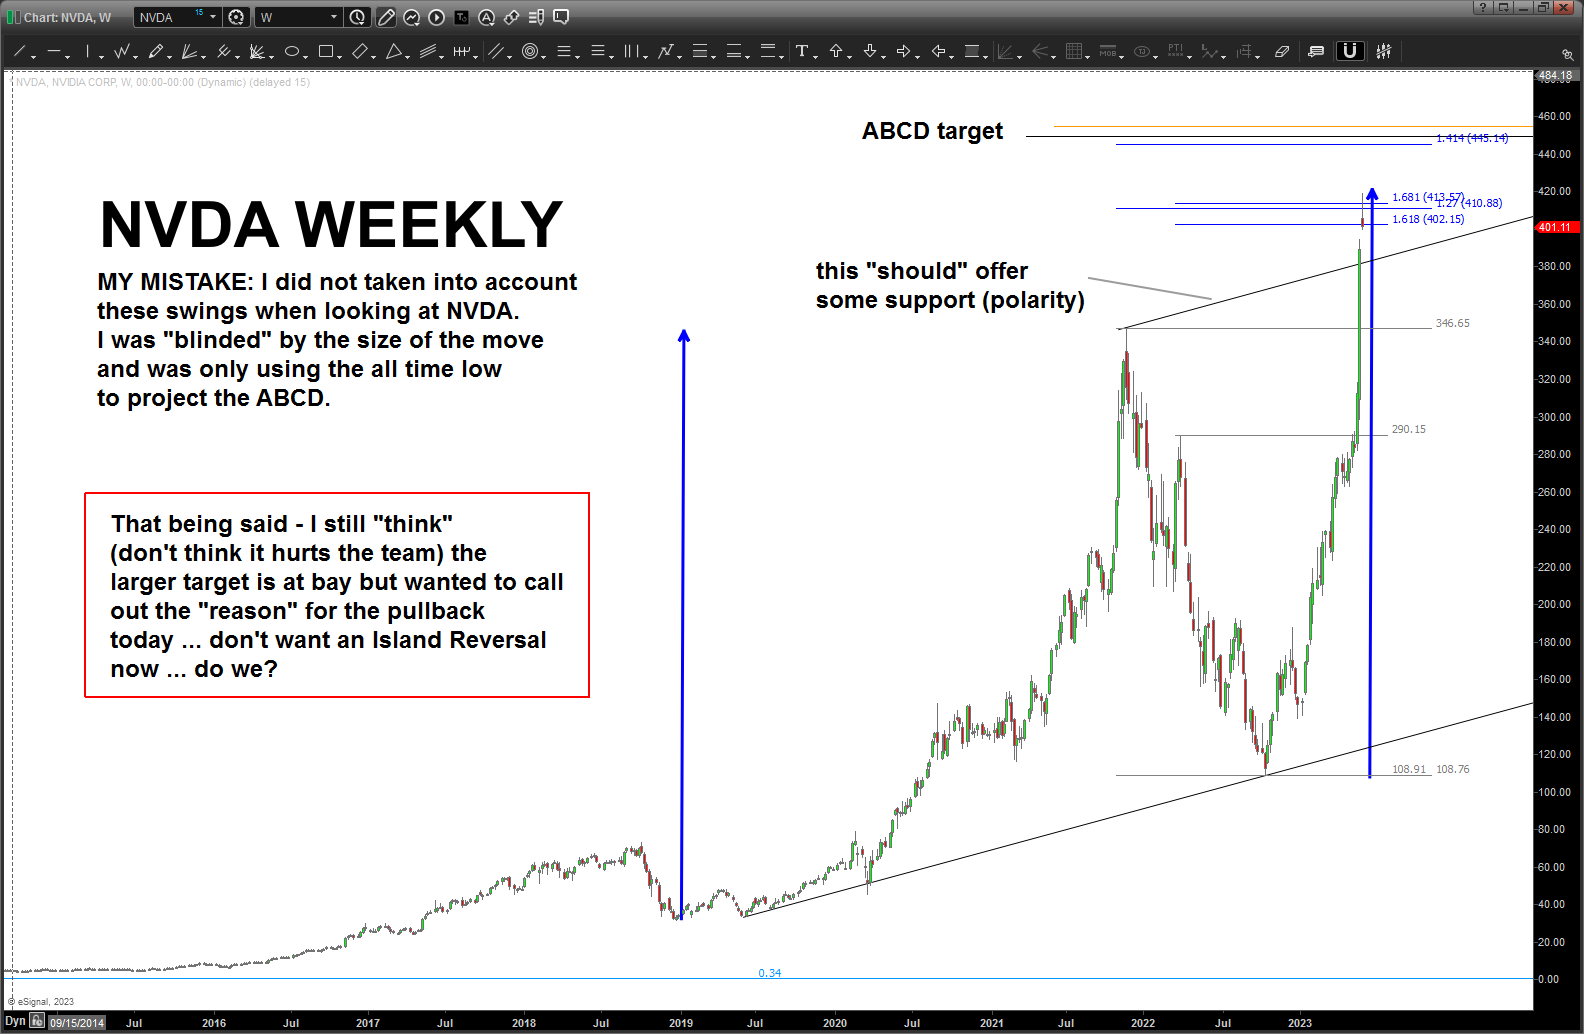
NVDA update – May 30, 2023
Posted on May 30, 2023 1 Comment
Took a peek at NVDA tonight and what came to my eye was the “look” of the “last” big move into a high from a measured move perspective and, yup, there it was – almost exactly equal to the length of the last move.
Honestly, I saw that but was “head faked” by the gigantic candle that brought us here so I used the all time low for the ABCD projection that is a little higher. But, tonight, it was the “shooting star” like nature of the candle that caught my eye. So, there it was and I, sorry folks, but I blew it. I did have the 1.27 extension on the chart and that “can” or “should” provide some resistance but, like anything, the level takes on more significance when you have a projection into that extension level. So, take that for what it’s worth.
Now, my “feel” is that we hit some resistance and perhaps a pullback and then up into the larger ABCD. That scenario, for now, would workout if that old trend line that got blown thru holds as support and NVDA bounces and goes up up up … this thesis is thawing and getting really cold if we get a weekly close below that old trend line.
So … lets see what happens.
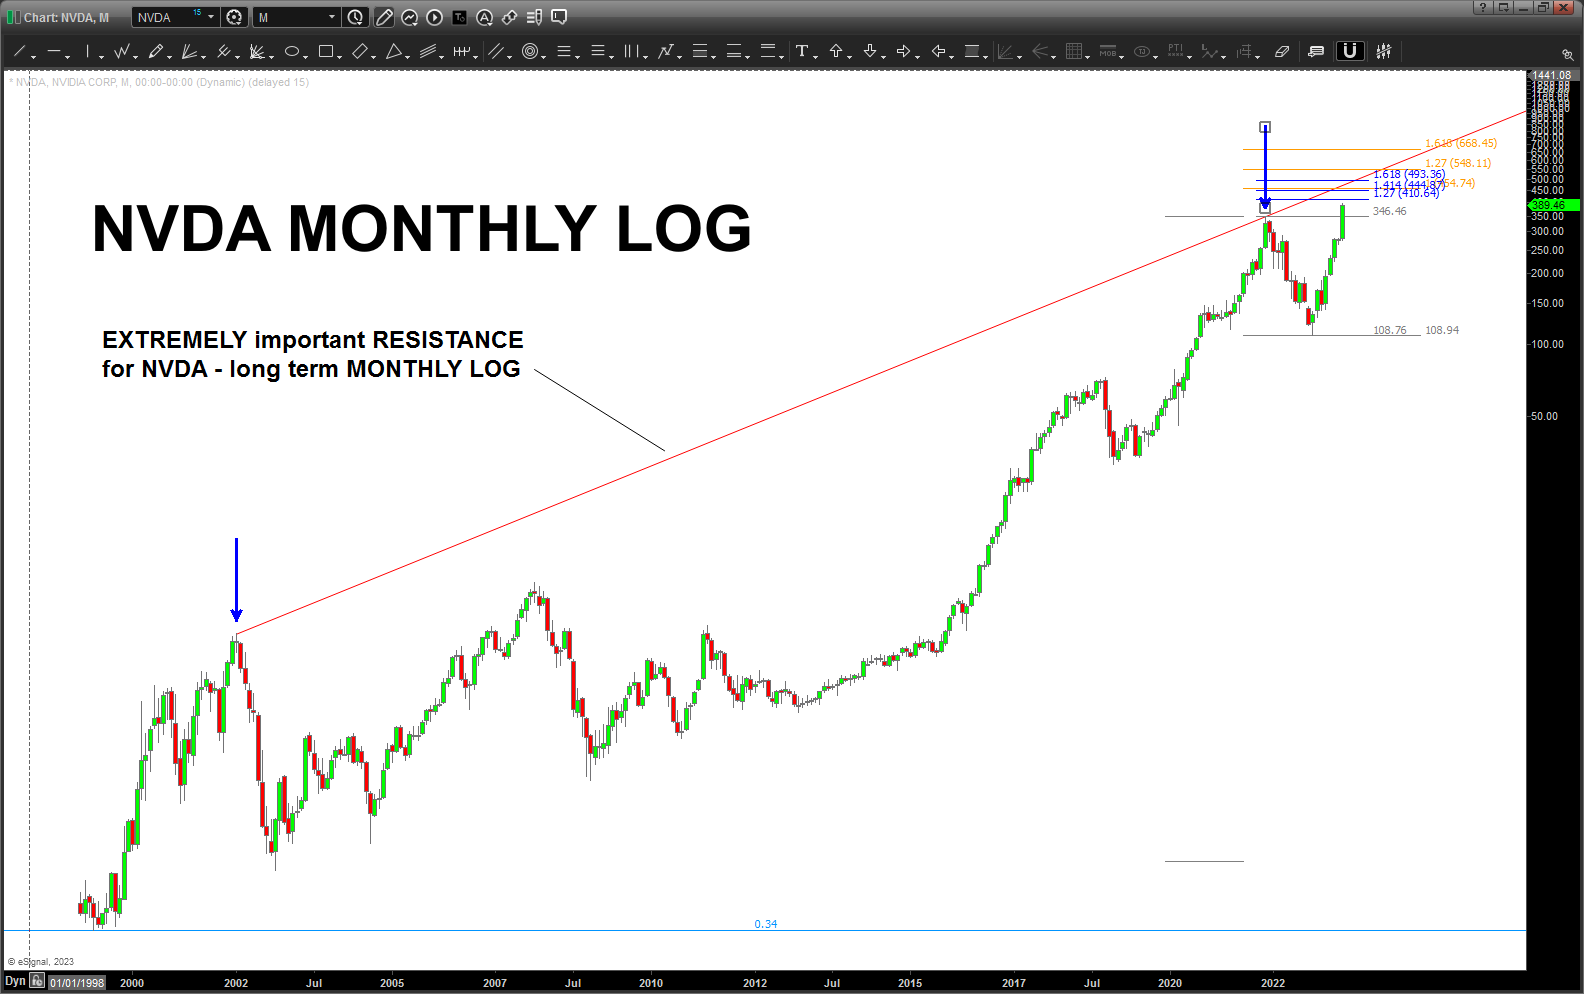
NVDA – May 29, 2023
Posted on May 29, 2023 Leave a Comment
NVDA – WOWZA.
I have a long term monthly count in my head that has a pullback/pause coming and then continuing higher. Yes, I think this is going higher. However, need it to get thru two things first:
Trend Line: note the long term log trend line from the first high 20 years ago the last major high (both regions denoted by the blue arrows) caused a pullback to occur … this trend line “should” at least offer some resistance. We blow thru it and this thing is in Zone 5 afterburner.
Right near the projected trend line resistance is the ABCD from the low down at .37 cents. The 1.27 extension “should” provide “some” resistance. The target for now: 444-454.
NO I’m not advocating a short here unless you have HUGE “fill in the blank” – I’m seeking an area of resistance that will enable a pause/pullback so I can manage risk and not try to get into a run away market something I have proven – again and again – to not be good at and, in fact, where a majority of my losses have come from. Trust me, I’ve had my fair share – BIG TIME. Maybe you have, will or won’t (it can be the “won’t” …usually isn’t but why not?) suffer losses but for me – I lose money trying to chase. PERIOD. So, I’ll see a level to try and get in IF a pullback ever occurs. For now … watch that 444-454 area.
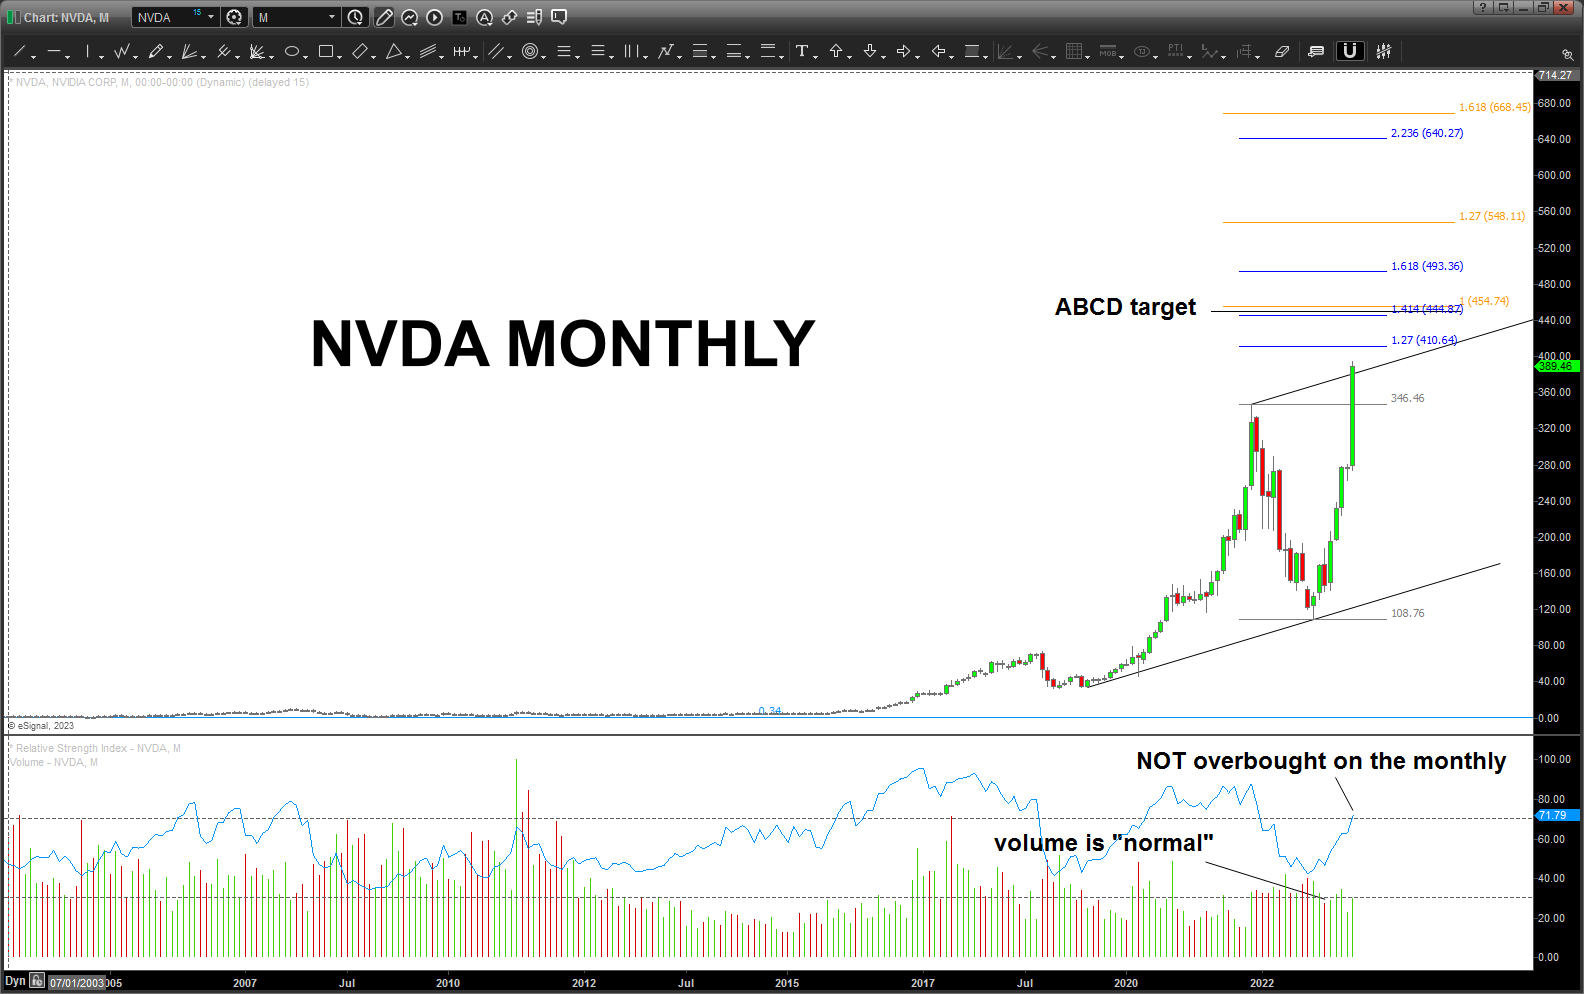
Also, I expected the volume to be much higher or even spiking but, with this much thrust, this high, the volume is normal to a tad bit latent. Hmmmm …coupled w/ the RSI isn’t overbought or showing any divergences. I think this thing has some legs but, again, I’m watching this rocket ship from my TV or staring up in the sky.
For those who have an e-ticket on this one .. hope these targets / resistance areas will help you manage risk.
Speaking of losses … we had a saying when I used to fly w/ my trusty (loved everyone of them OBTW) pilots … when it comes to gear down landings, there are those who WILL and those who HAVE. NEVER those who WON’T.
It’s OK to lose money …it sucks, I know, but it’s part of the game.
YEW – Bart
JPM redux – May 24, 2023
Posted on May 24, 2023 2 Comments
Last post on JPM: https://atomic-temporary-44460632.wpcomstaging.com/2023/05/21/jpm-may-21-2023/
Well, folks, the SELL PATTERN on JPM has worked so far and…that’s not good folks. I REALLY DO NOT care what your political affiliation is …in my simple mind you are a HUMAN and I AM connected to YOU.
So … this is a hard post. We are on the verge of a really important moment … and, frankly, I’m just going to say it on this blog:
KEEPING THE POLITICS OUT OF IT:
If JPM BUY PATTERN works – up up an way. The “metaverse” of the “real” world just continues to weave into Idiocracy.
IF JPM BUY PATTERN FAILS – it’s time folks. Stock up on REAL TANGIBLE ITEMS and be a good HUMAN …
It is that simple …
USO – May 21, 2023
Posted on May 21, 2023 1 Comment
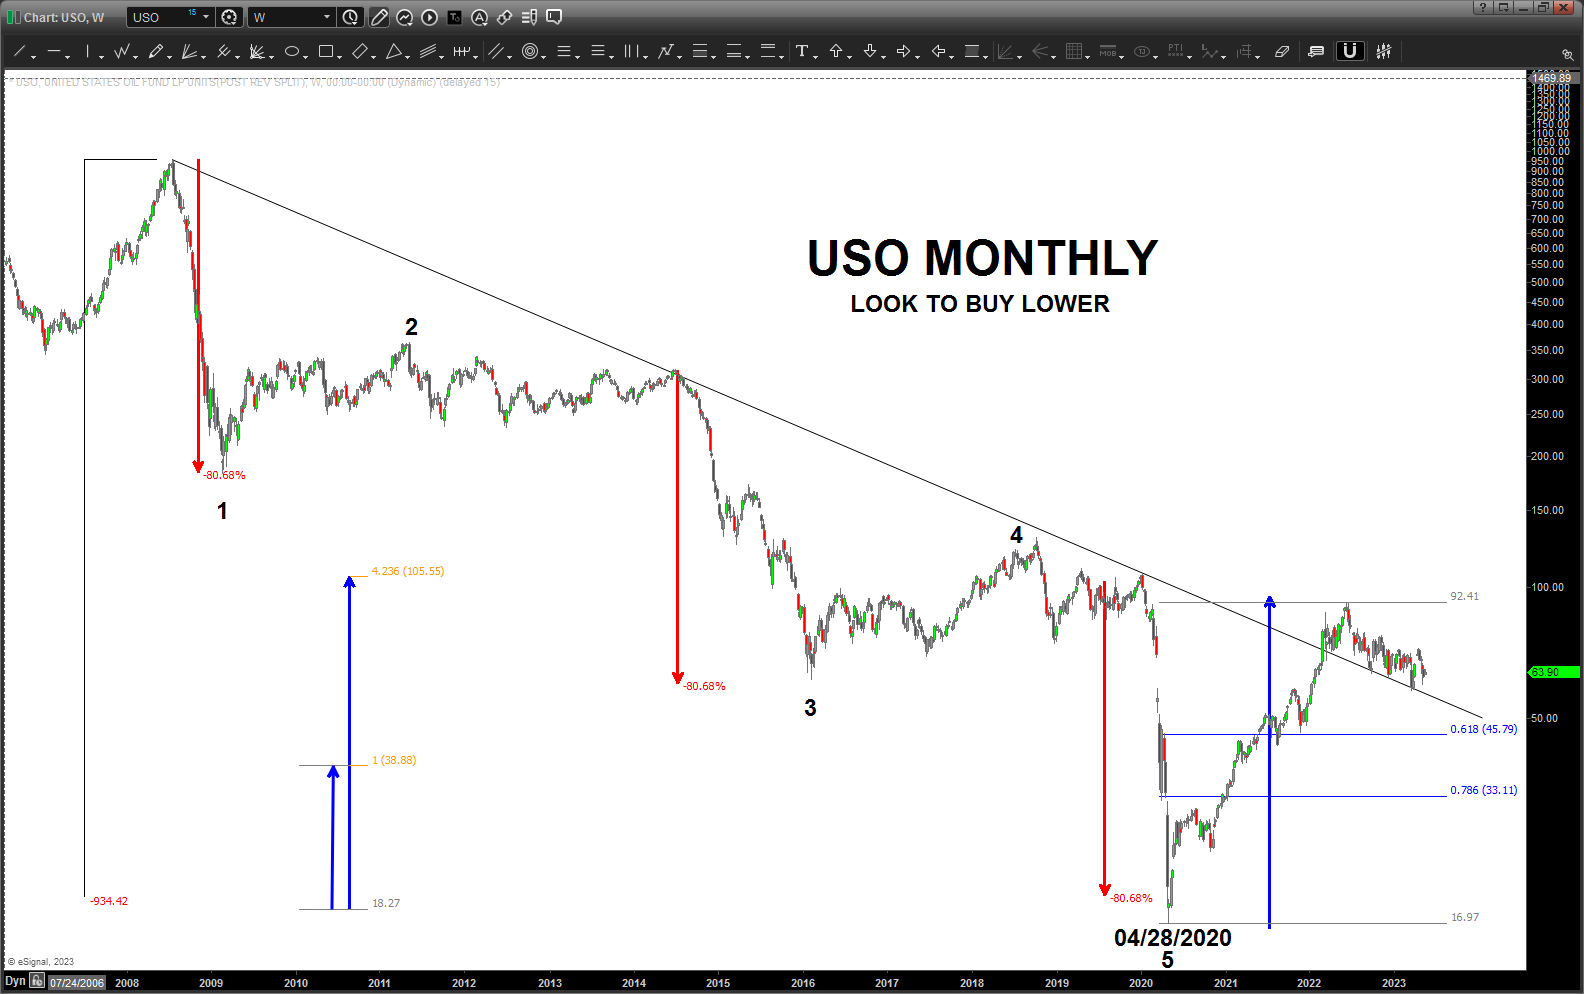
Take a look at USO below … certainly looks like 5 waves down and , every wave was symmetrical and the EXACT same percentage move. Pretty crazy .. that’s why I love LOG charts folks.
W/ the 5 waves down complete and the pretty big move afterward would look to be a BUYer w/ a nice pullback lower on USO. Could be a nice long run higher on this one …
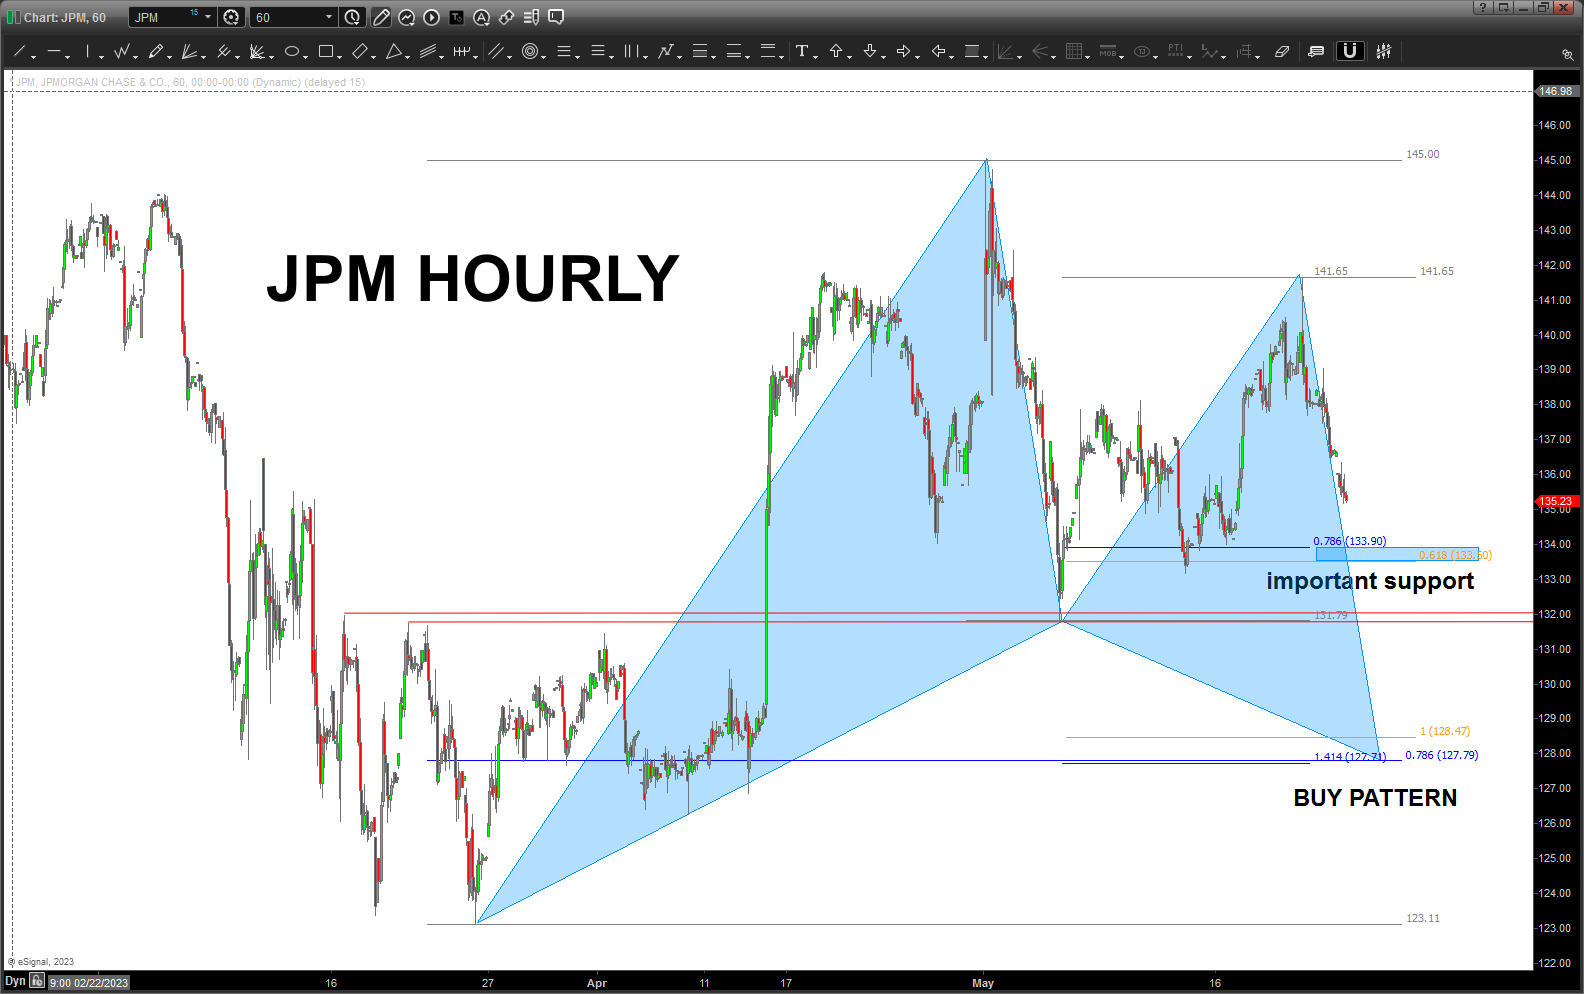
JPM – May 21, 2023
Posted on May 21, 2023 1 Comment
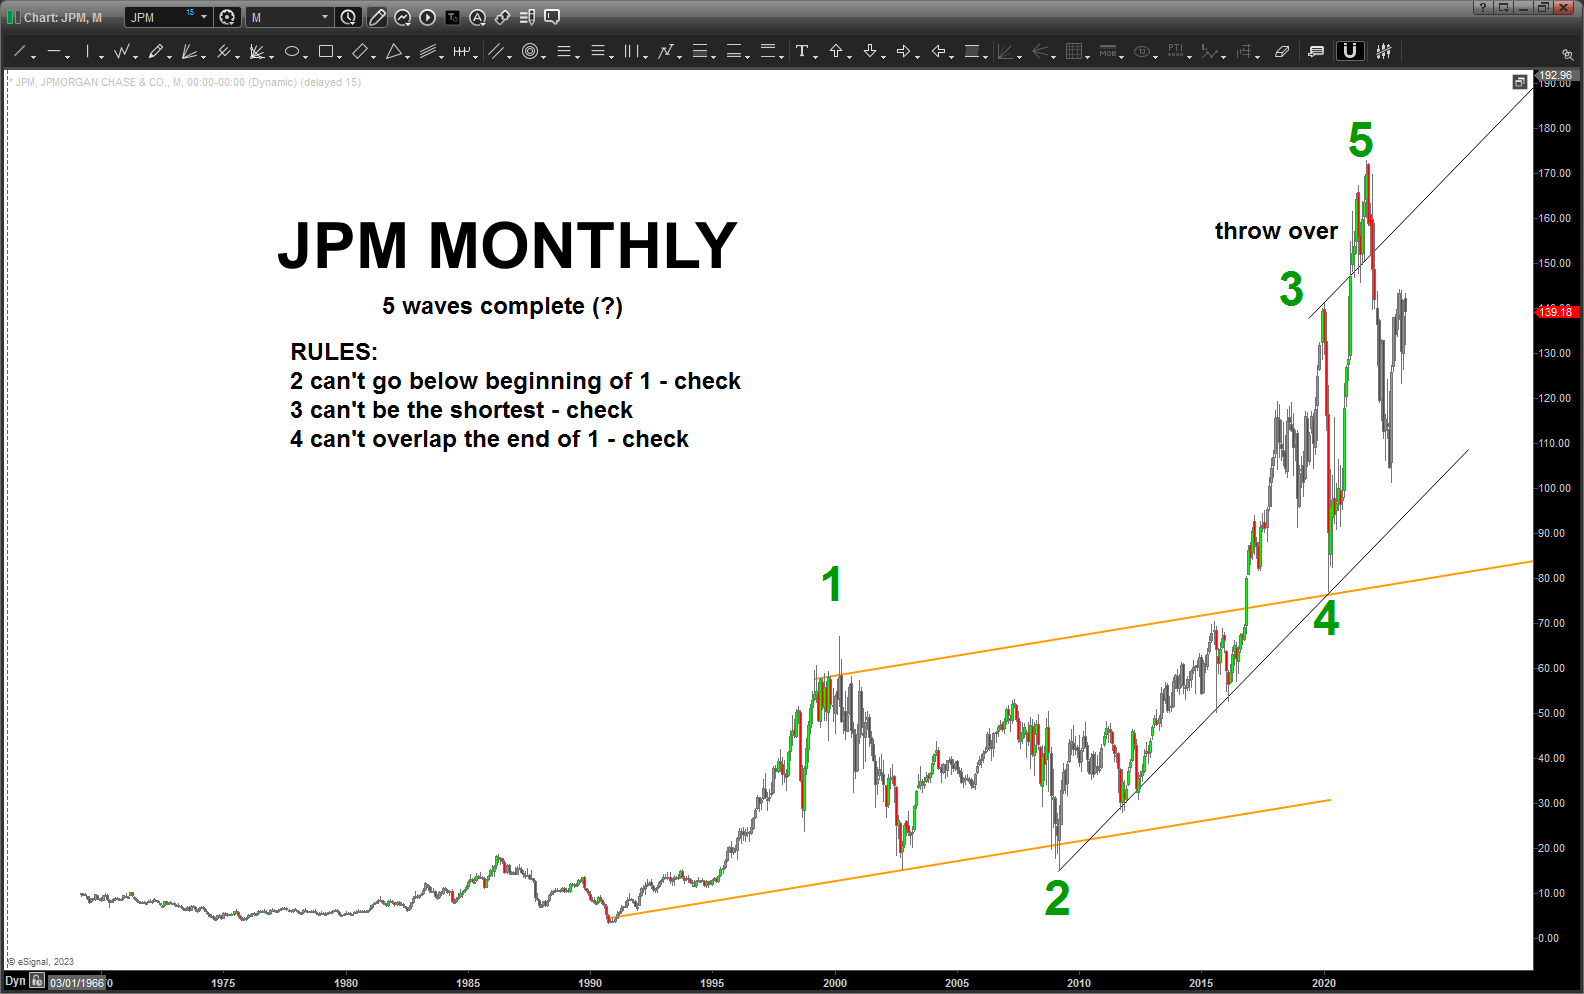
This is a long term monthly count from JPM that stretches back 50+ years.
Folks, certainly doesn’t “feel” like a 5 wave move in JPM is complete but the count doesn’t break any rules so … 5 waves complete?
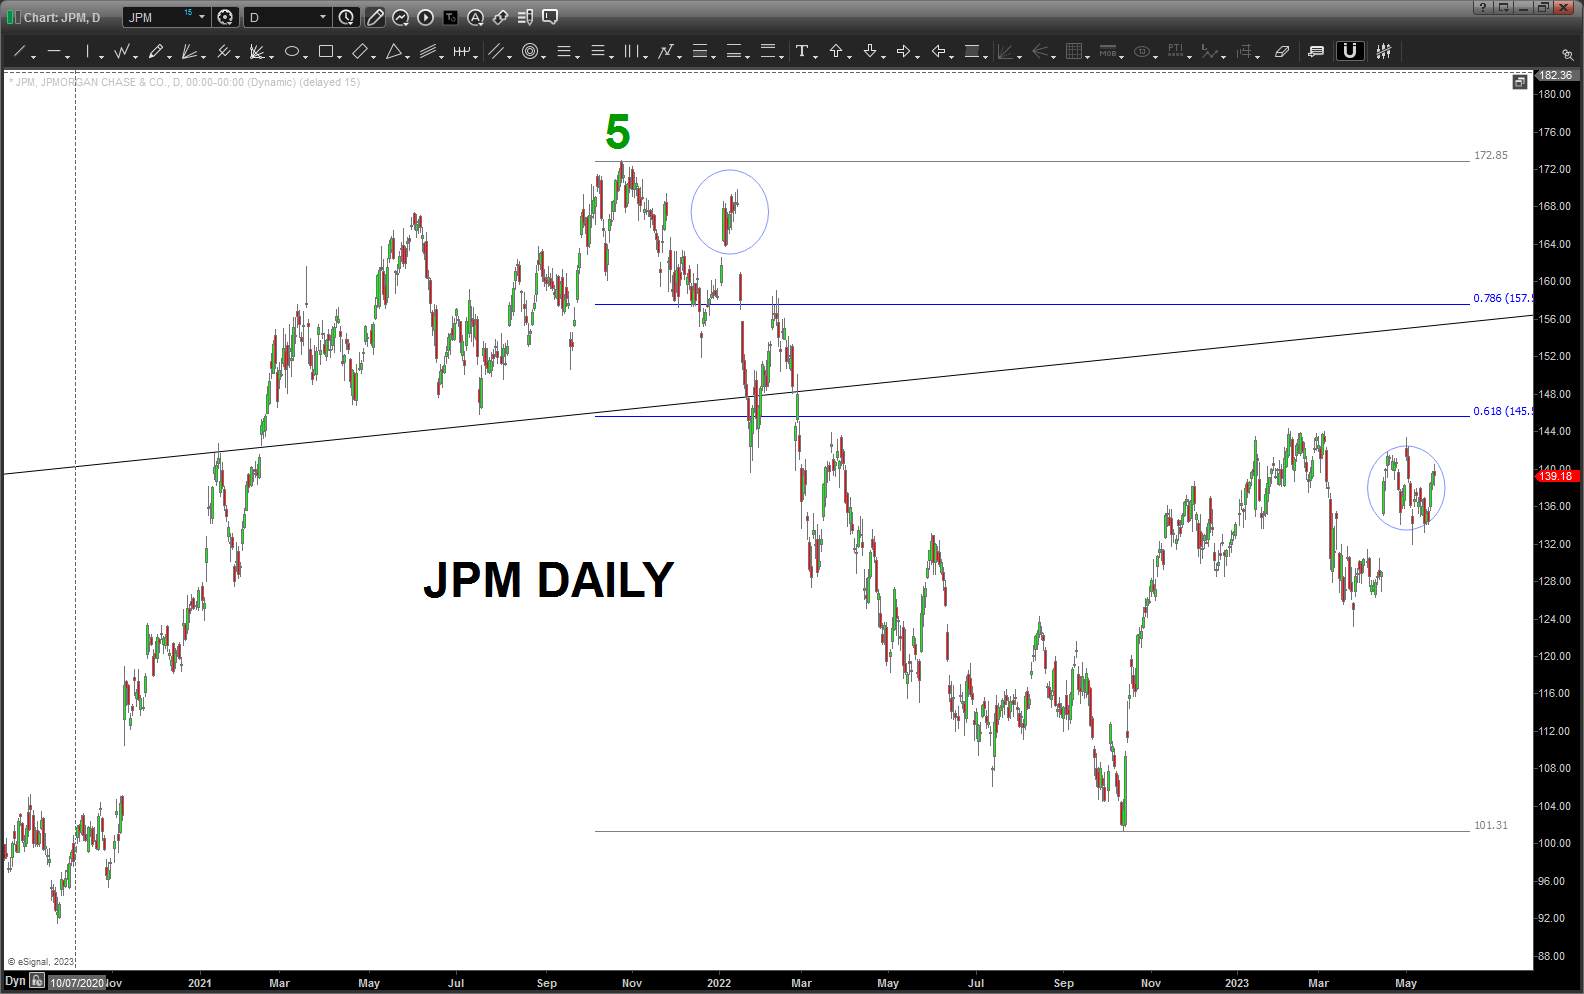
Here’s the daily chart below – calling attention to the island reversals and the island reversals that could be at play – right now. Here’s the last post on it: https://atomic-temporary-44460632.wpcomstaging.com/2023/05/04/jpm-may-04-2023/
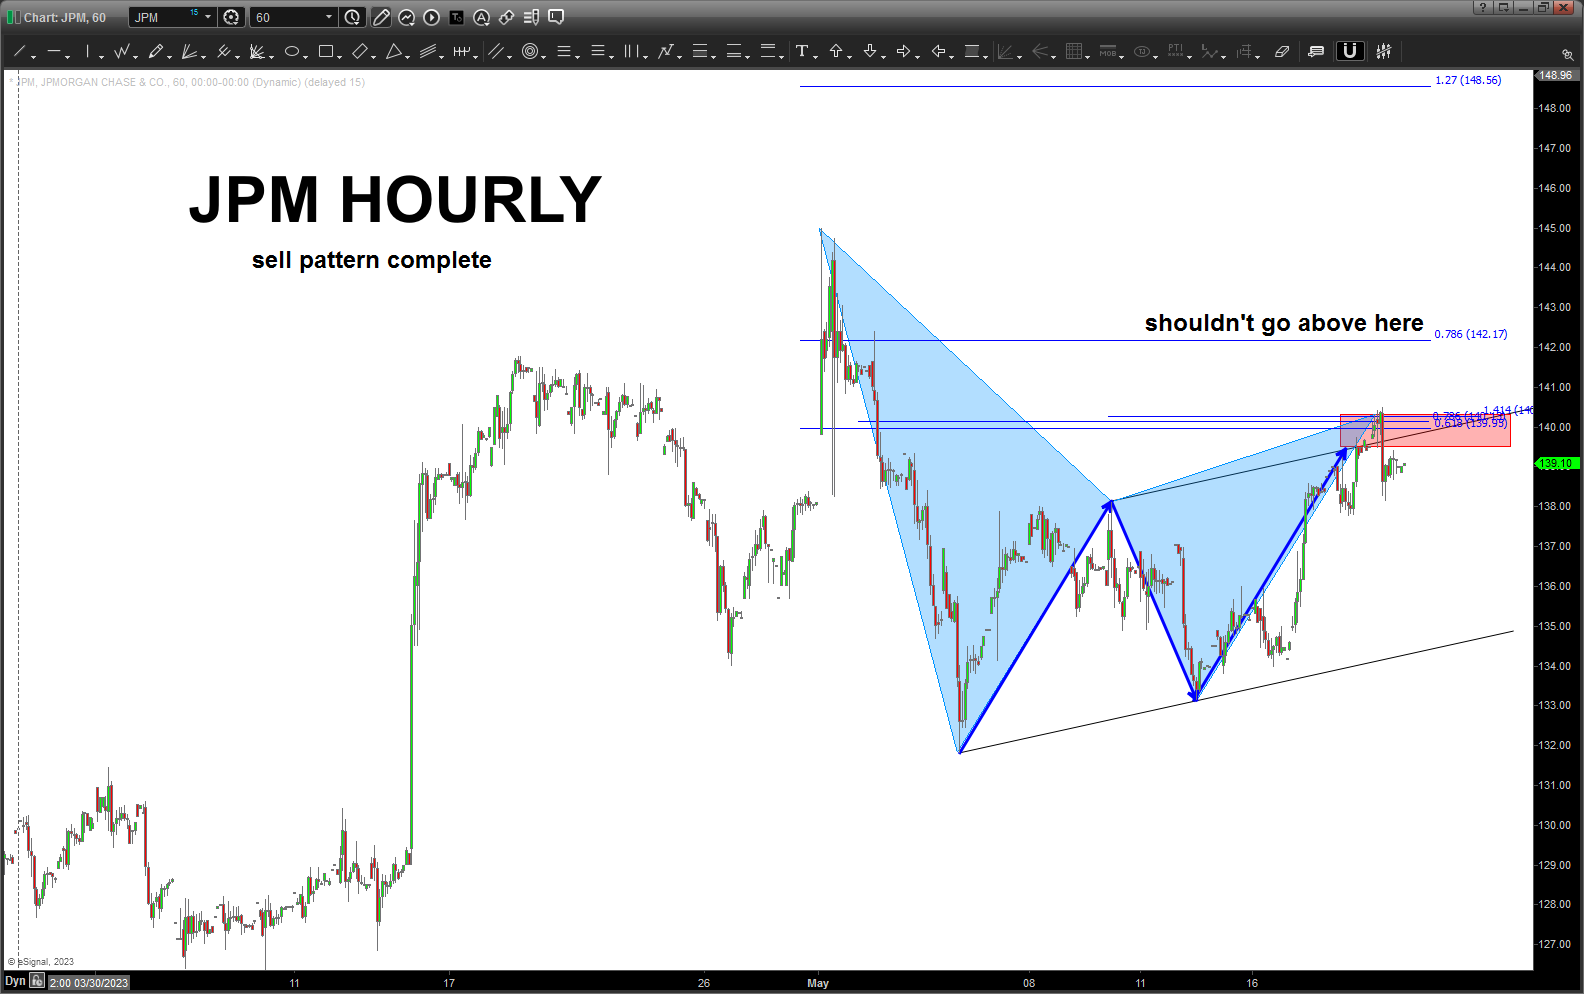
Well the count will either be correct or it won’t (yea I know, dugh) but .. here’s the 60 minute GART SELL PATTERN that hit so IF this pattern works THEN JPM should start back down which will put pressure on all the banks. IF this PATTERN FAILS then expect the daily .618 and .786 above to get attacked and, potentially send JPM off to new highs.
But, for now, pay attention the SELL PATTERN present on JPM:
Long Bond Futures – May 15, 2023
Posted on May 15, 2023 1 Comment
If your a technician, you can’t help but notice the very long (month ish) consolidation occurring in the bond market.
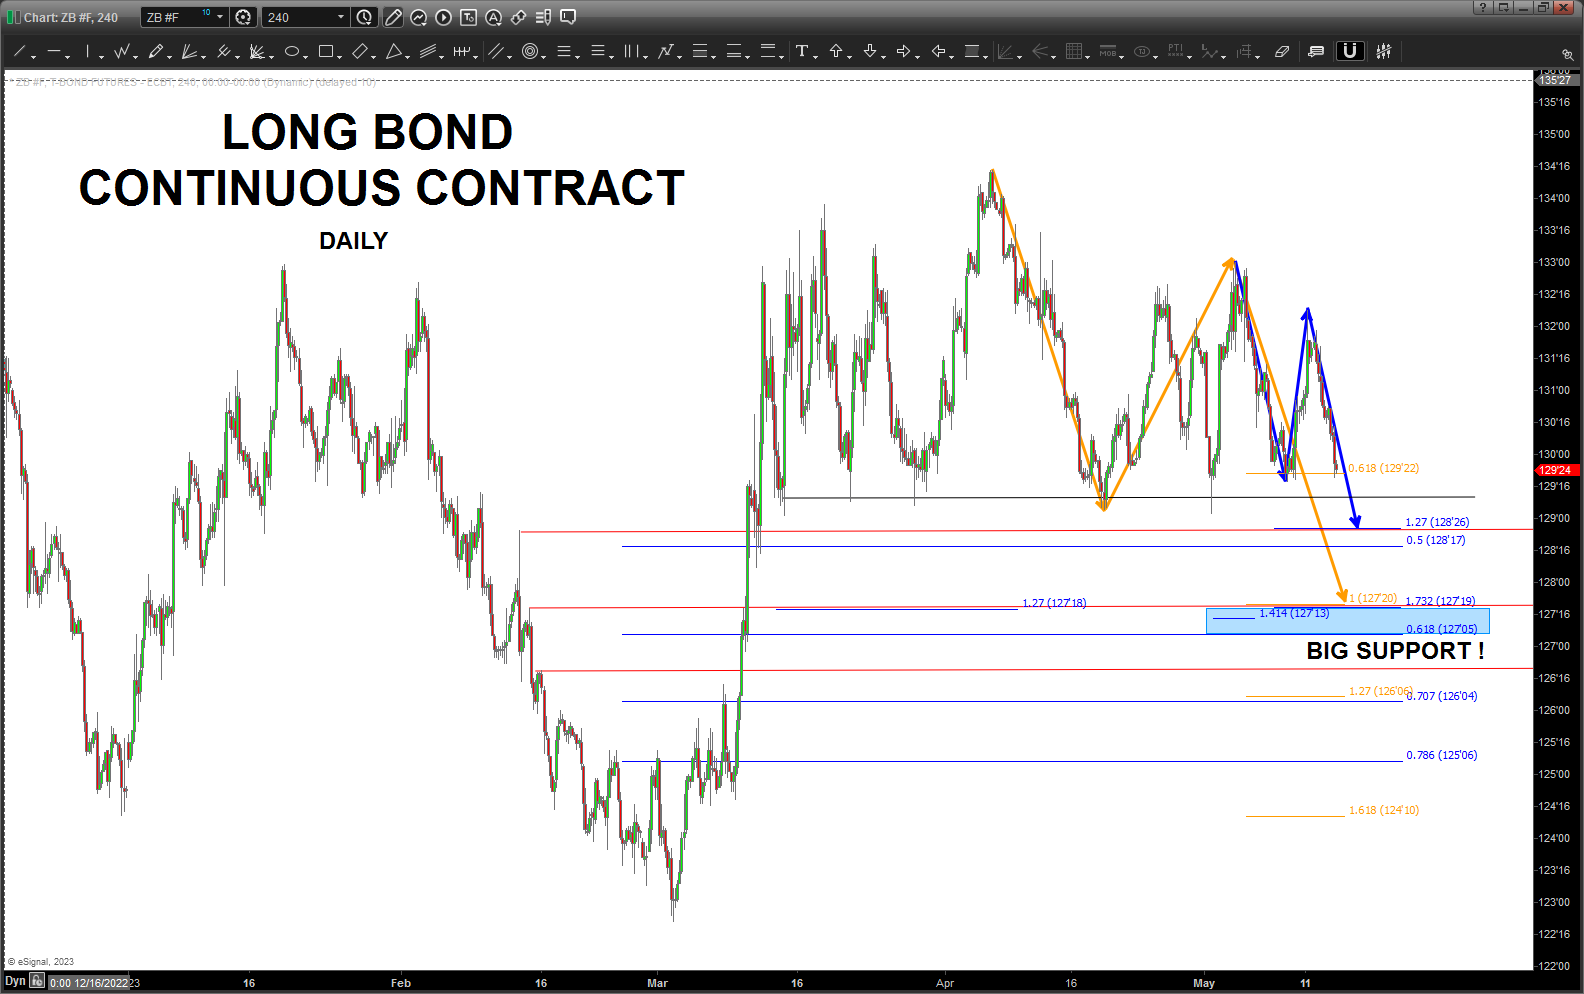
Today’s price action appears to want and break the support that has been around since March 15th. As you can see above, we do some ‘basic’ projections and right when the neckline breaks there is minor support (blue projection arrows) and then the BIG support w/ the blue rectangle present. A lot of math coming into that level. I believe that is the crucial level.
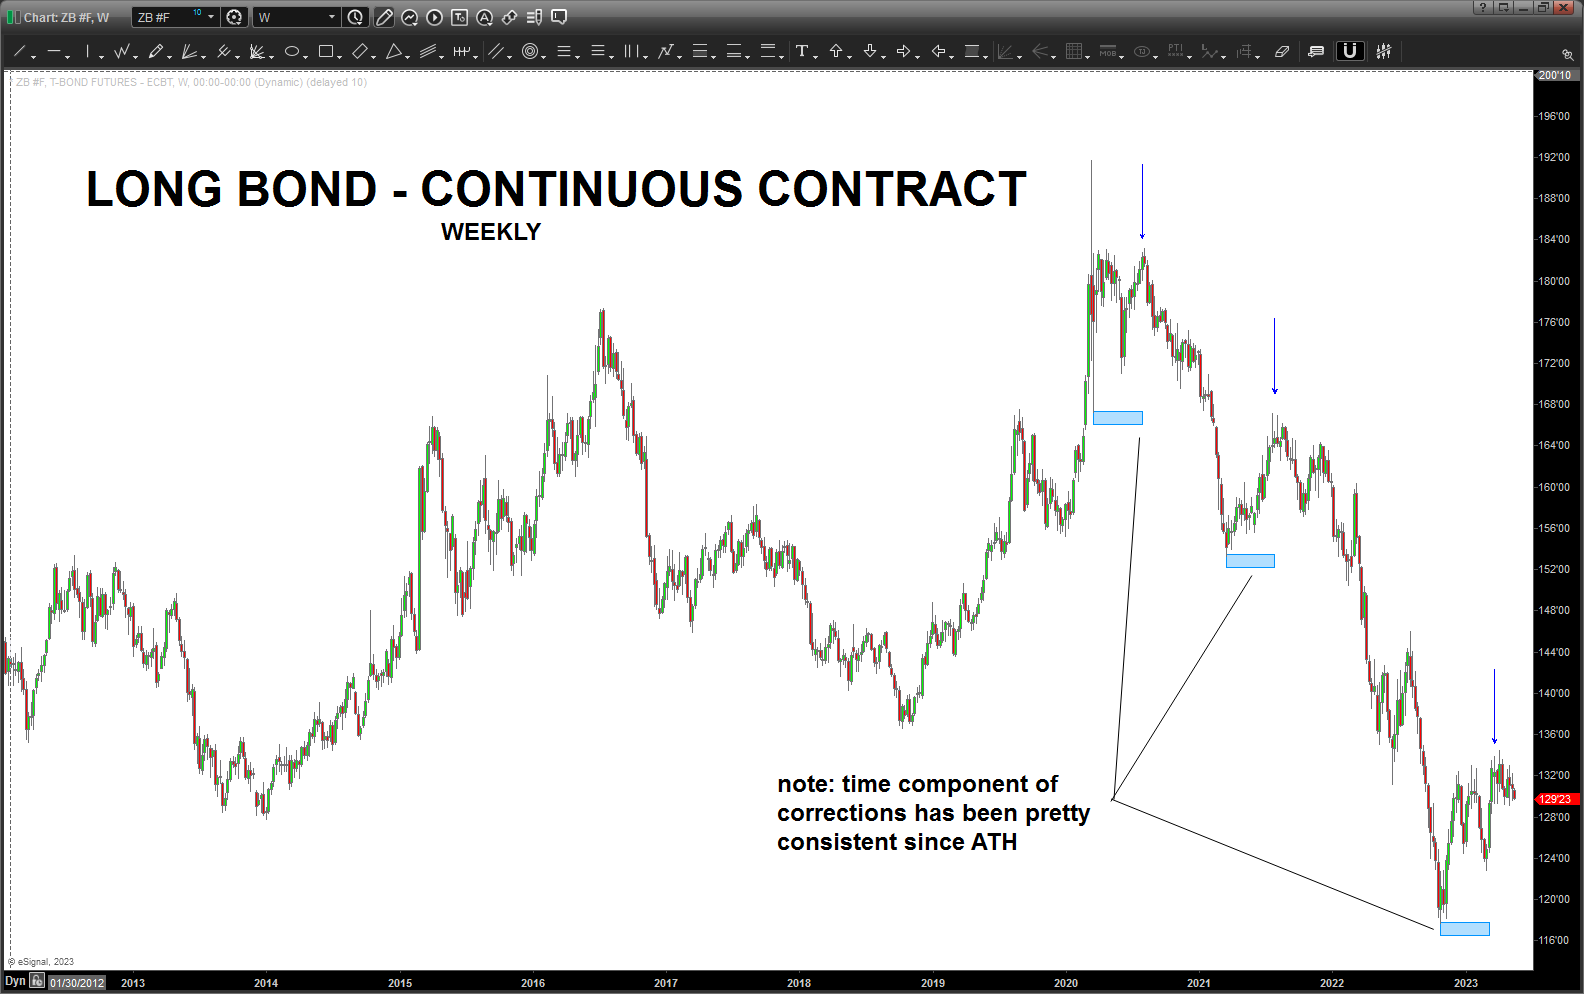
As you can see from the weekly chart above, the “time” of the corrections have been pretty symmetrical so from a timing perspective certainly looks like this “bounce” has run it’s course for one more leg down.
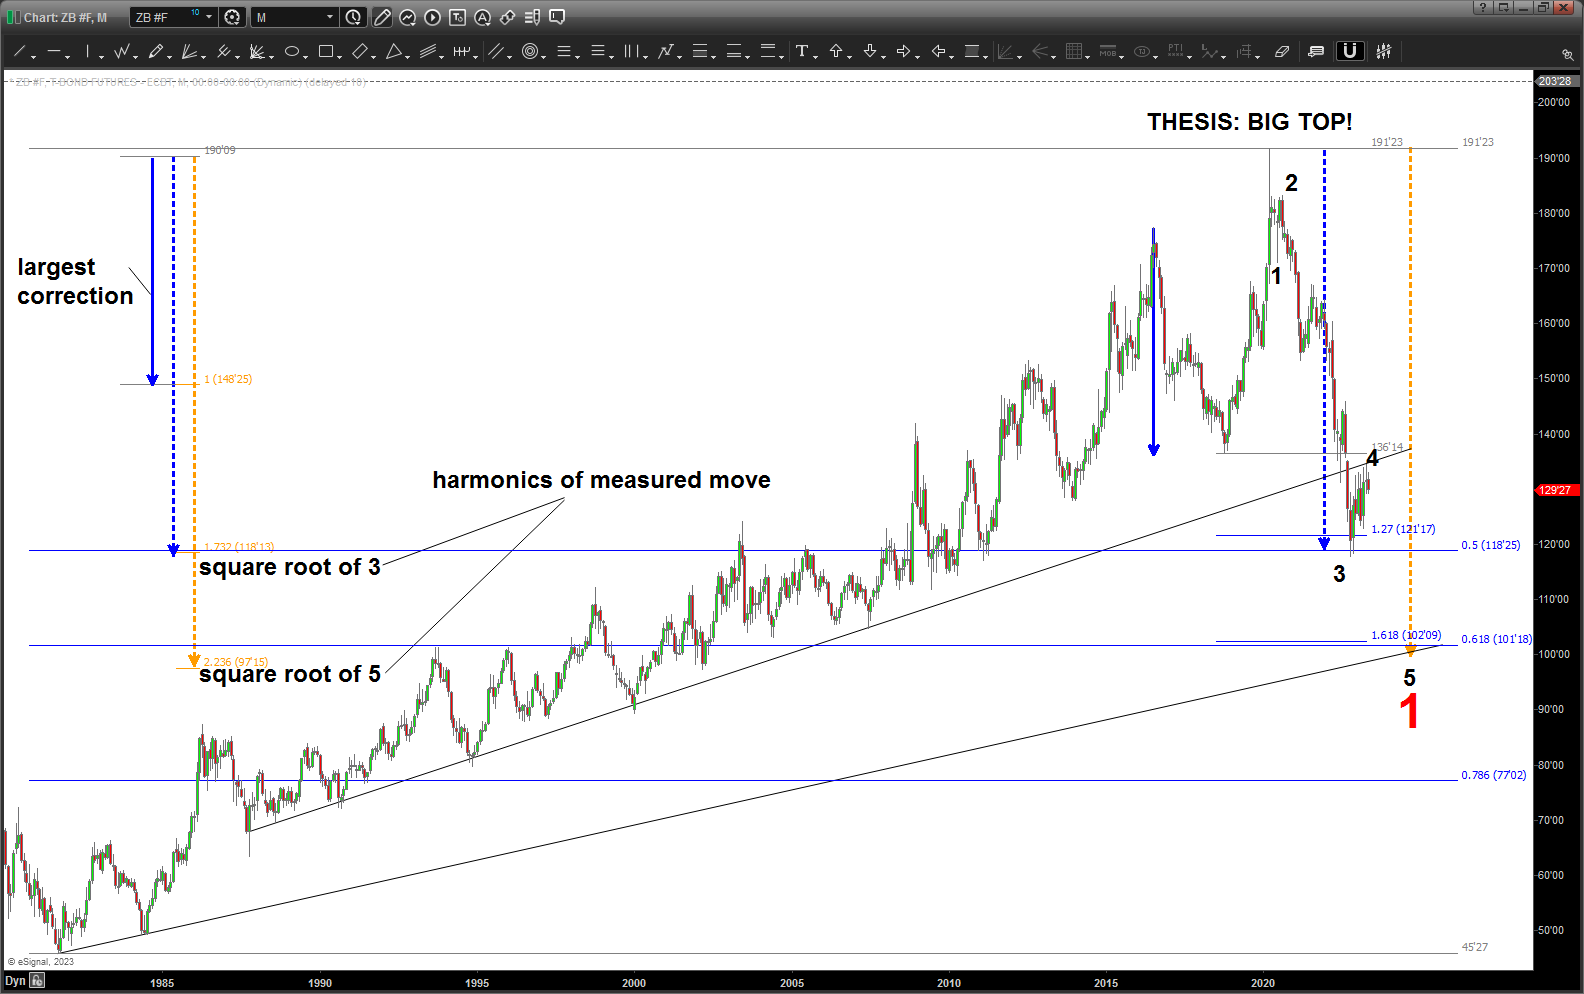
From the ATH, it’s a pretty clear count and I’m labeling this as a 4 completing/completed and another leg down (rates go UP in this case) into the .618 from the 1981 low (40+ years ago) in bond prices. Note the blue measured move above .. that was the largest correction in 40+ years. We take harmonics from that and you can see the square root of 3 harmonic nailed the low precisely. We have a .618 retrace, 1.618 extension, trend line coming from the low in 1981 and a harmonic of the largest prior correction.
That level is a good level to BUY – if we get down there.
KRE Regional Banks ETF – May 12, 2023
Posted on May 12, 2023 Leave a Comment
Last post on KRE: https://atomic-temporary-44460632.wpcomstaging.com/2023/04/30/kre-regional-banks-etf-april-30-2023/
Supposedly … who knows what is true these days .. 1000’s of banks are underwater. OK … whatever.
Here’s when we look at the CHART and we ask should we BUY or SELL or DO NOTHING.
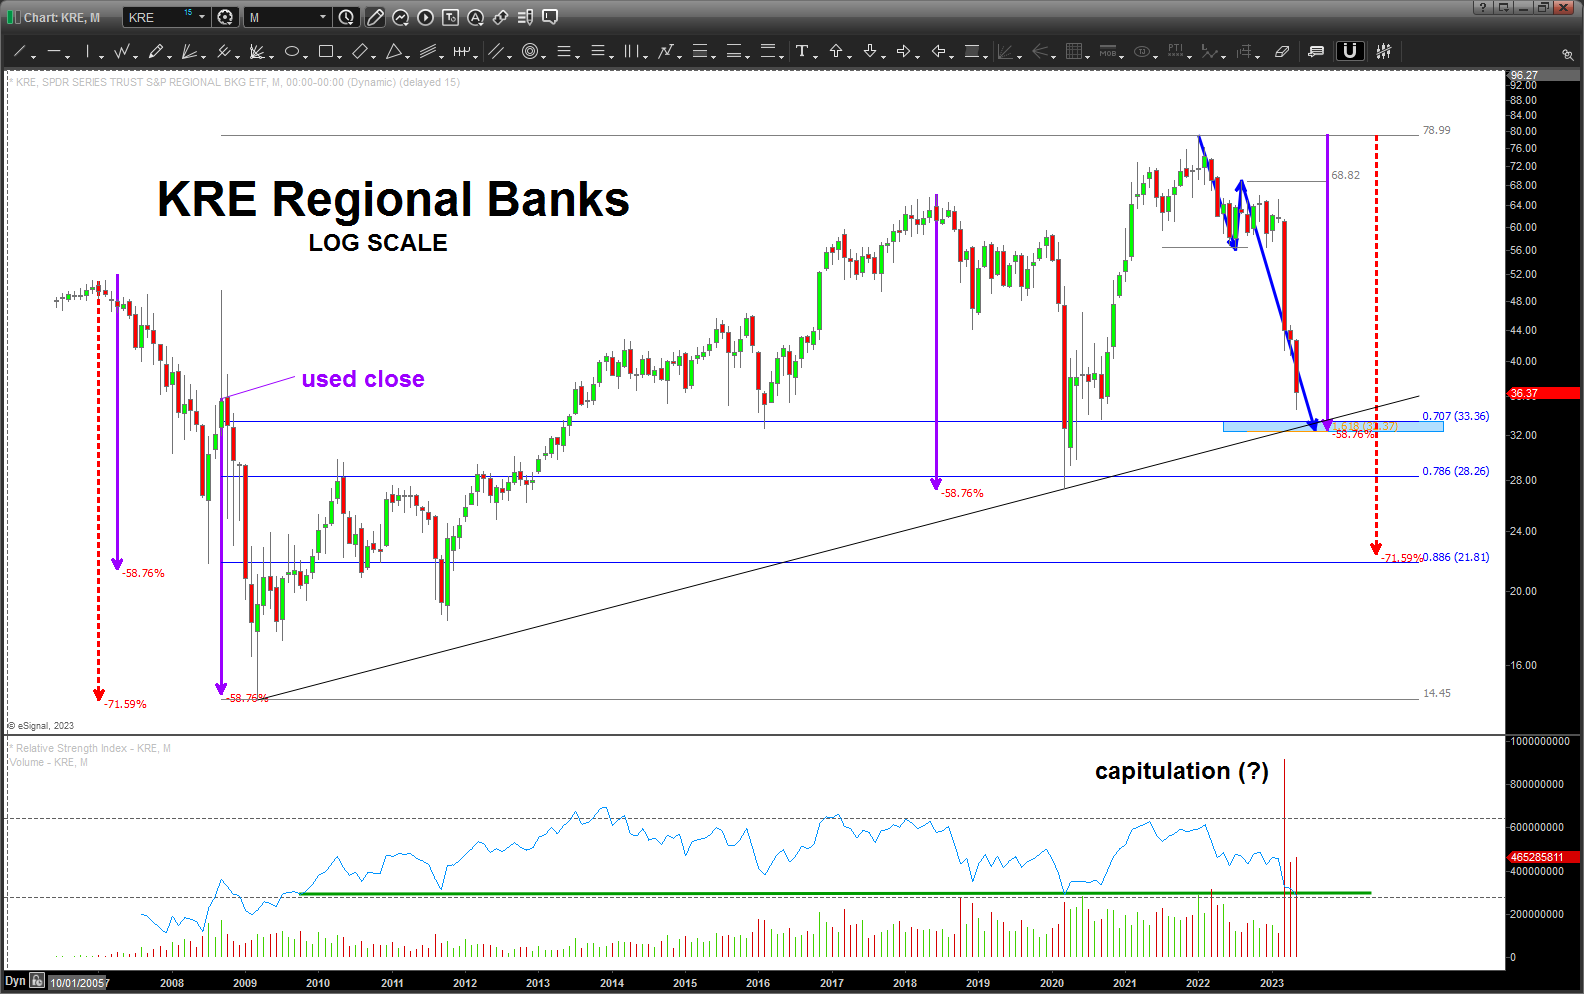
KRE sliced thru the first “potential support” and now we approach, what I think, is the KEY to the KRE. Here’s why:
- 58.76 – if you look at the purple measured moves you will see that EVERY major swing down has been 58.76%. I’ve used the “close” in 2008 as I’m not sure if that is a good print or not .. either way, that measured move nails EVERY LOW
- 1.618 projection lands … right at the 58.76 correction.
- .707 (square root of 2 = 1.4142 and 1/1.4142 = .707) just a little above this level
- Long term LOG trend line right at .. all the above
- Note the VOLUME – is that a capitulation spike in selling volume?
- RSI sitting at the crucial support level for the ENTIRE bullish move since 2009
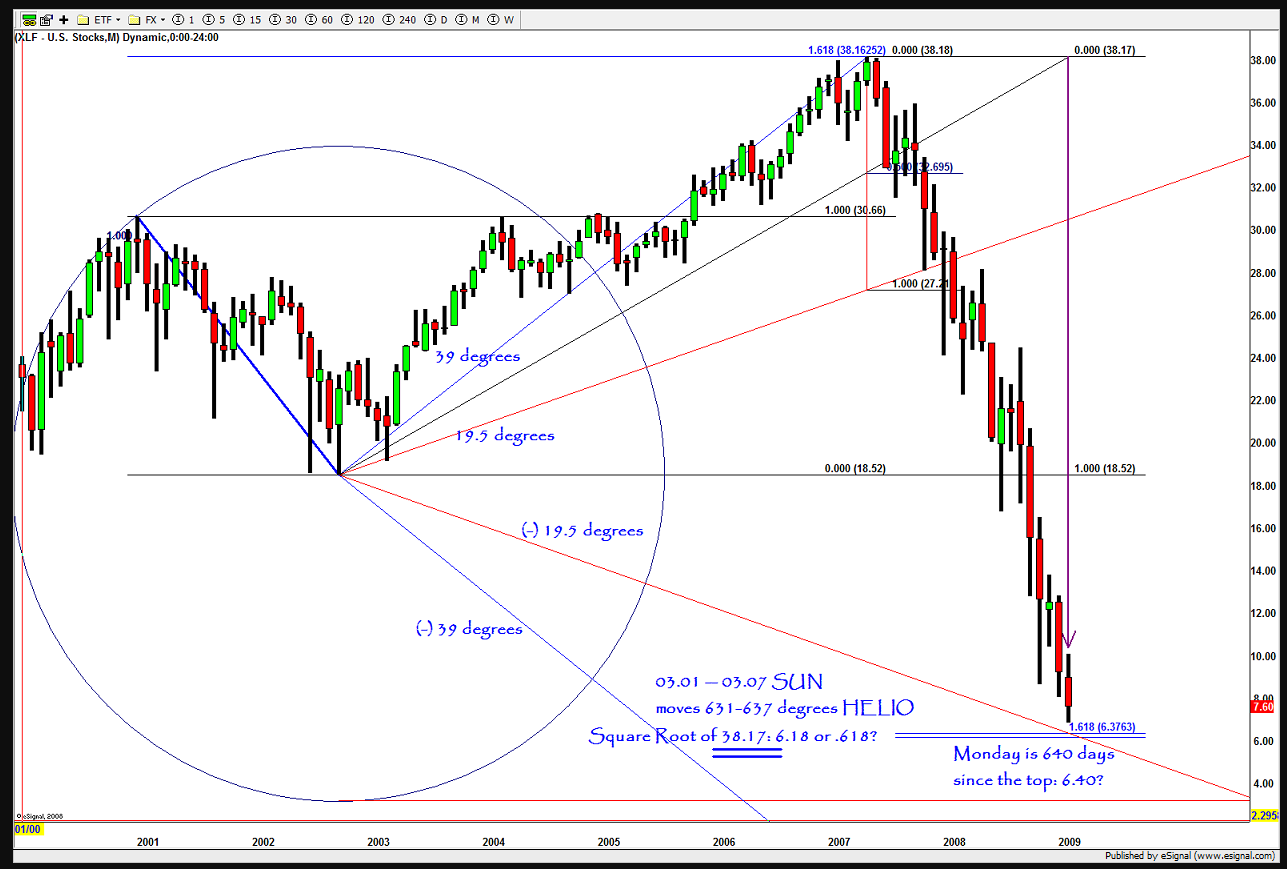
Nobody in their right mind is looking to BUY the banks but, then again, I can guarantee you NOBODY was looking to buy in March 2009. Maybe there was someone? Perhaps … me?
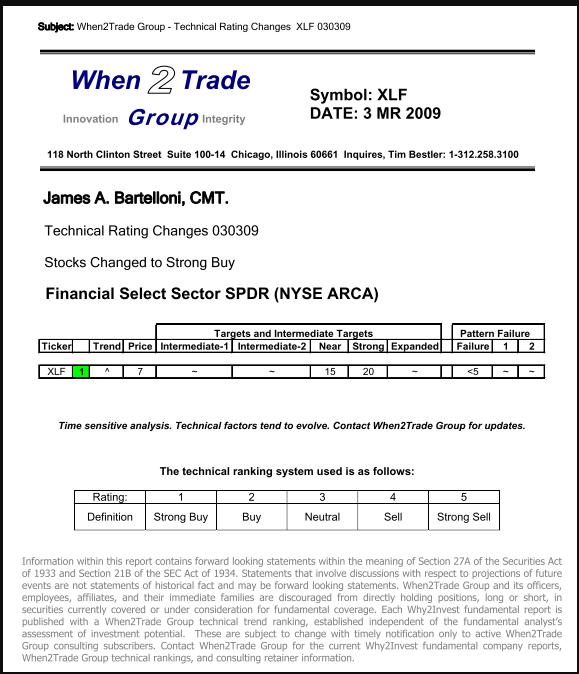
DATE STAMPED 3 MR 2009. (March 3, 2009)
Here’s why:
So … watch the THRUST coming into this level, maybe wait for a signal reversal candle (bullish).
What I can say is IF we blast thru this level (certainly “feels” like we should) then, yeah, a lot of banks are looking at some tough times and 28 and then 21 are the next targets.
Good weekend to all – B
Disney (DIS) – May 11, 2023
Posted on May 11, 2023 1 Comment
Last post on DIS: https://atomic-temporary-44460632.wpcomstaging.com/2023/01/23/disney-dis-january-23-2023/
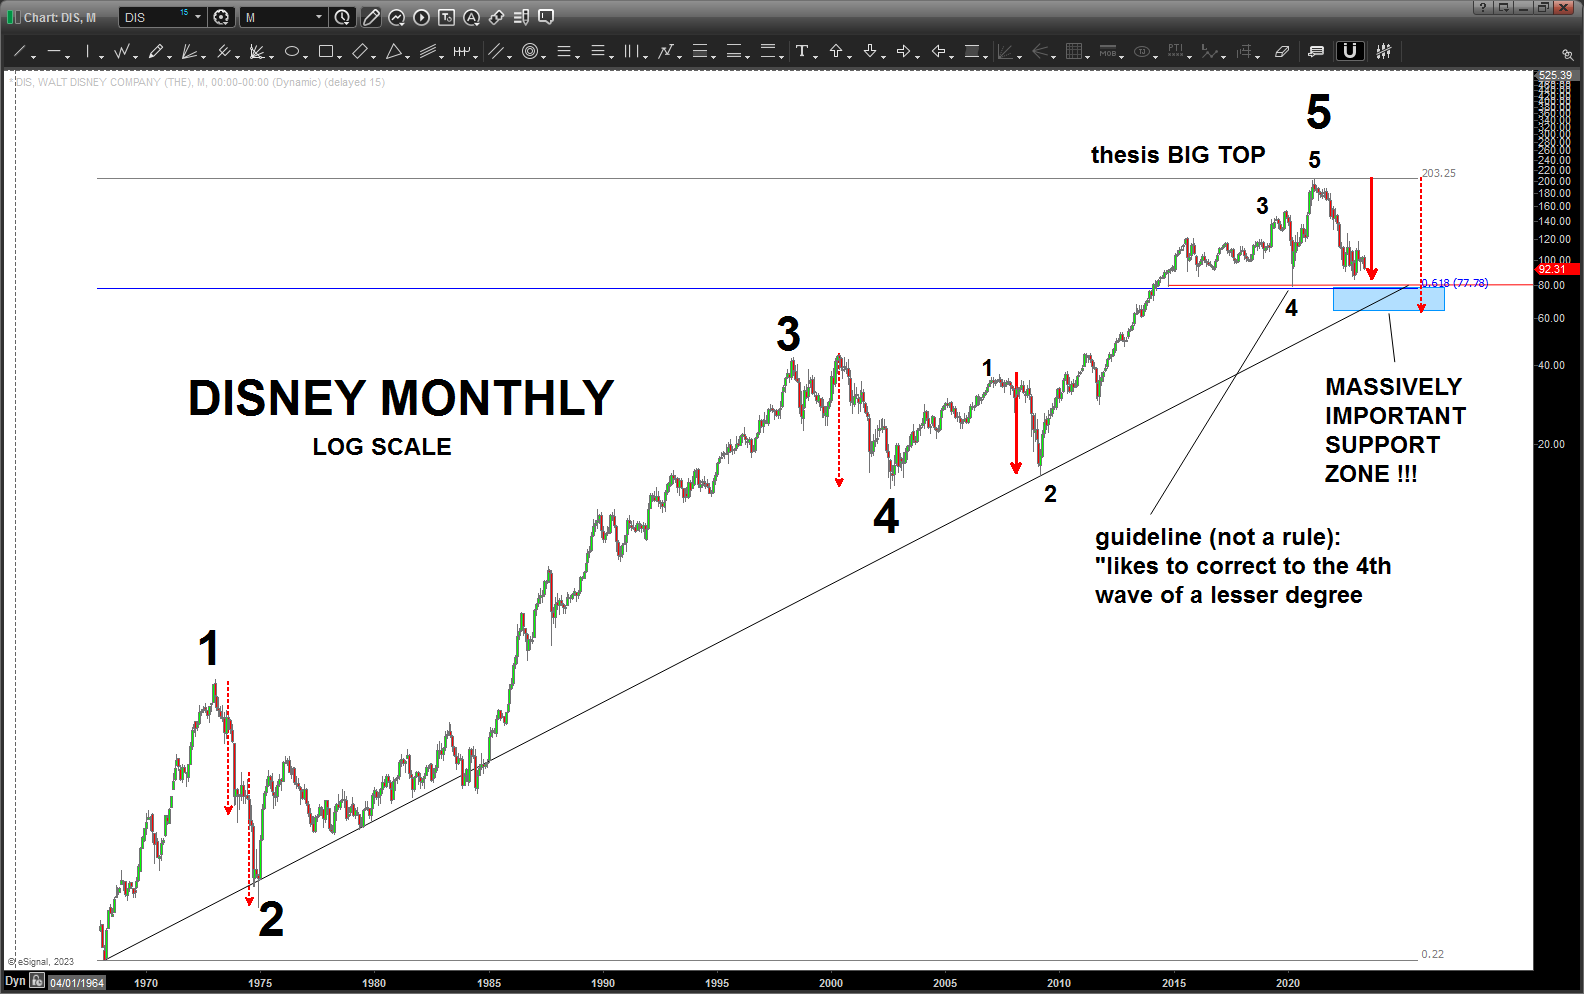
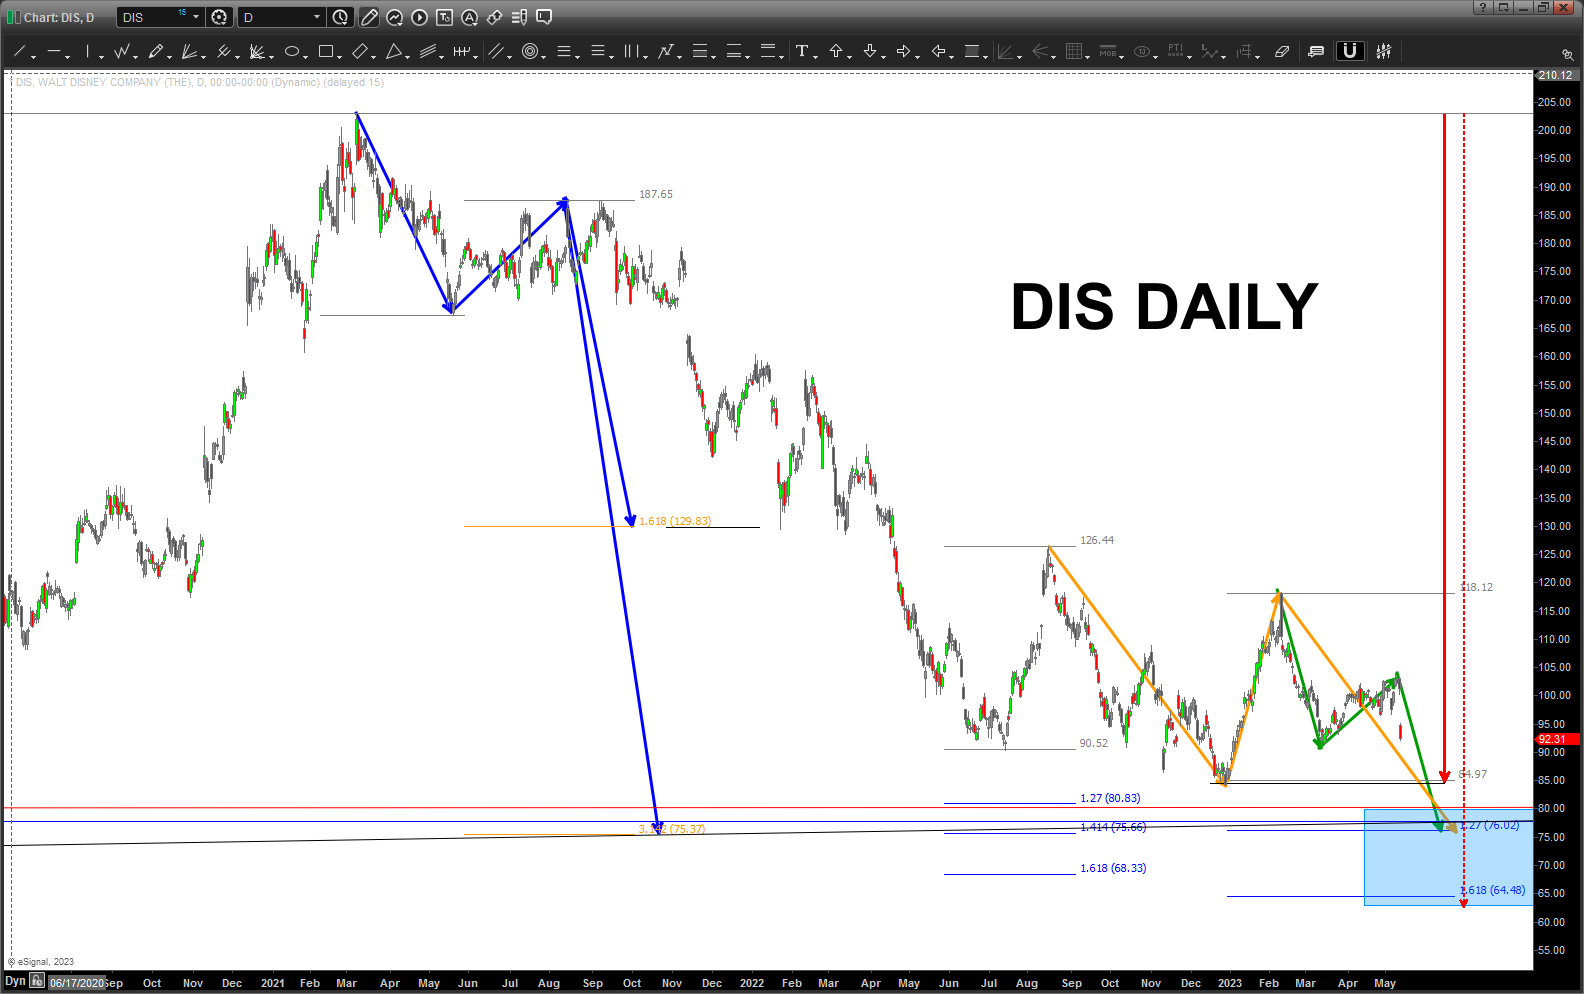
HUGE support from 62-77 … the .618 is from the all time low, we have the long term trend line from 50+ years ago and the “next” measured move correction (dashed red arrow – remember this is log scale), also take note of the two ABCD projections (orange and yellow) smacking into the 3.142 (PI) projection, square root of 2 (1.4142) extension and the square root of 1.618 (1.27) extension.
75-78 is pretty important …
Last, a GUIDELINE and NOT a rule is that corrections like to target the “4th wave of a lesser degree” and you can see that comes right in where .. yup, our target zone.
So, from a balance, form and proportion this correction doesn’t look done or over BUT that zone should be some nice support.
NOTE: looking at it on a monthly, looks like we might have a three drives to a bottom setting up …
TBD.