EUR.USD – May 10, 2023
Posted on May 10, 2023 1 Comment
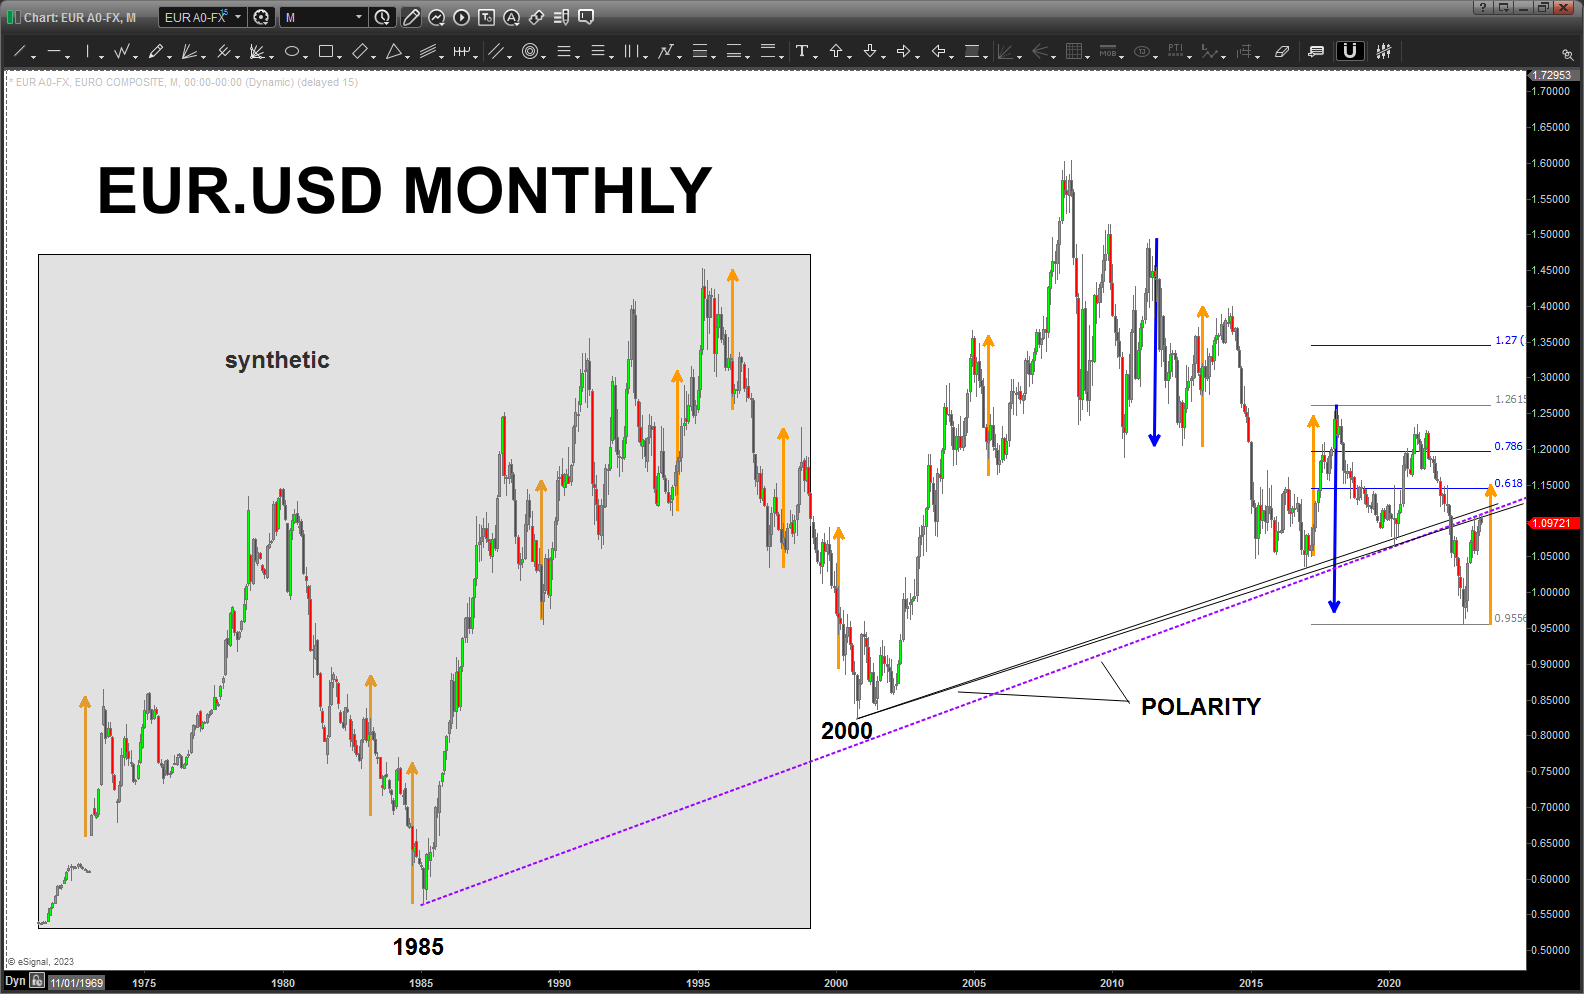
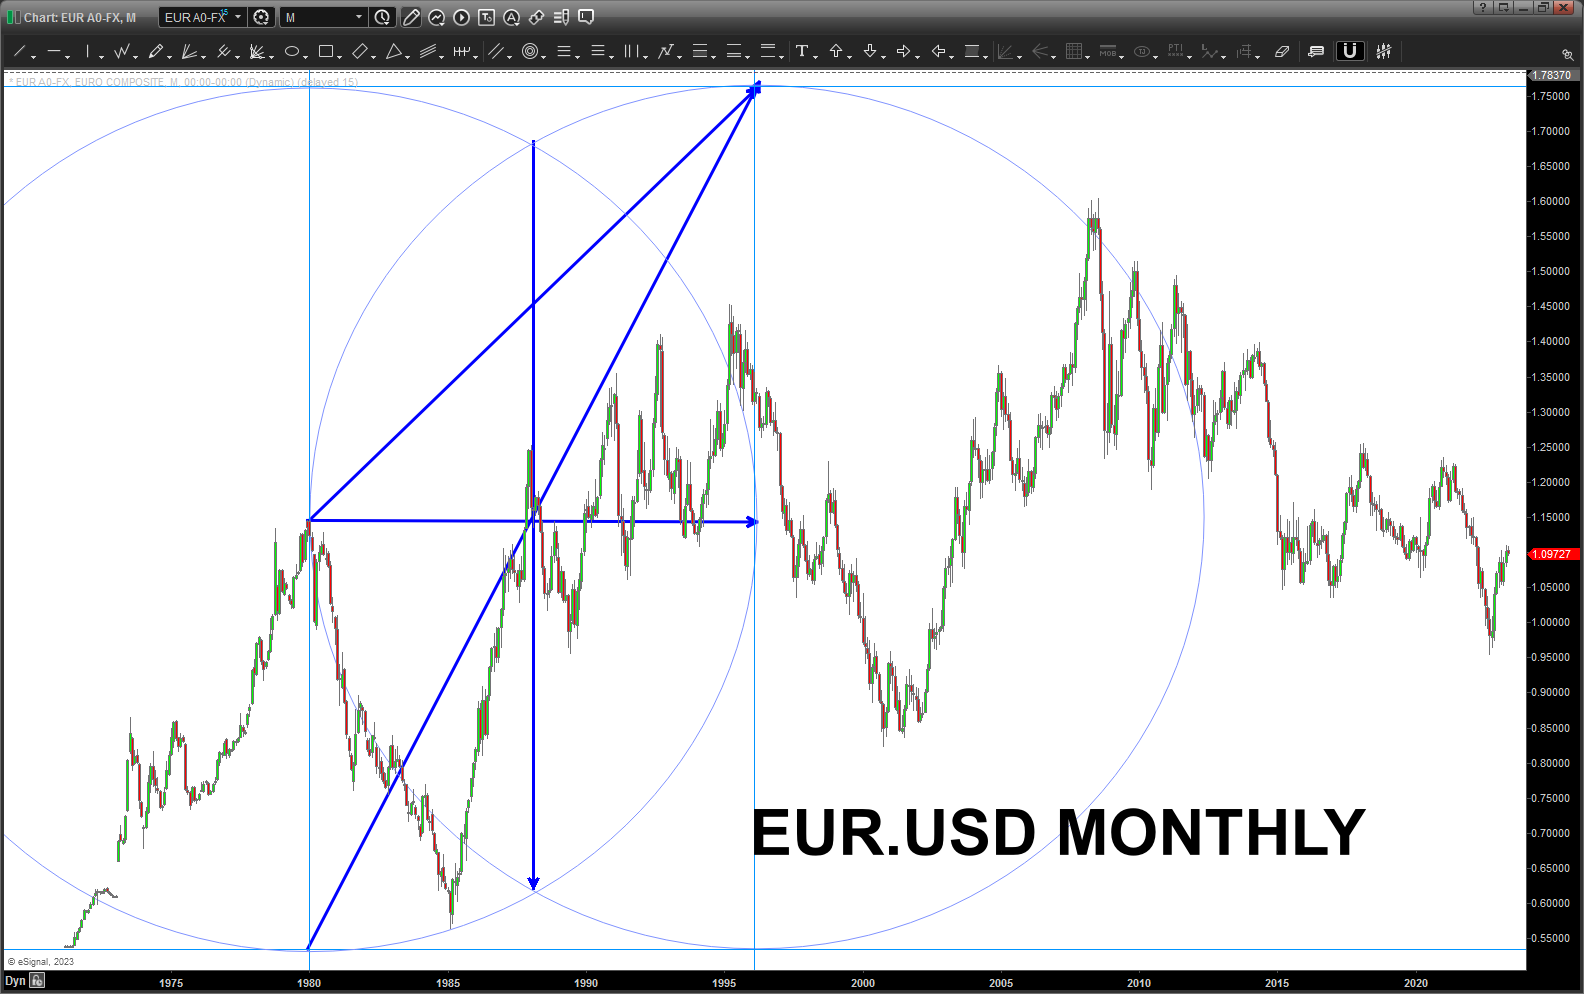
The EURO is smacking against some SERIOUS trendline resistance that goes back to 2000 and 1985 (synthetically).
Remember, the Euro wasn’t adopted until January 1, 1999. So, the grey box below is the “synthetic” version of the EURO w/ the Deutschmark and other currencies providing a “continuation” into the time frame of Bretton Woods.
Either way, pay attention to the “orange measured moves” as that looks to be a pretty good “beat” for price action. IF the EURO blows thru these trendlines then the next target certainly looks to be 1.15.
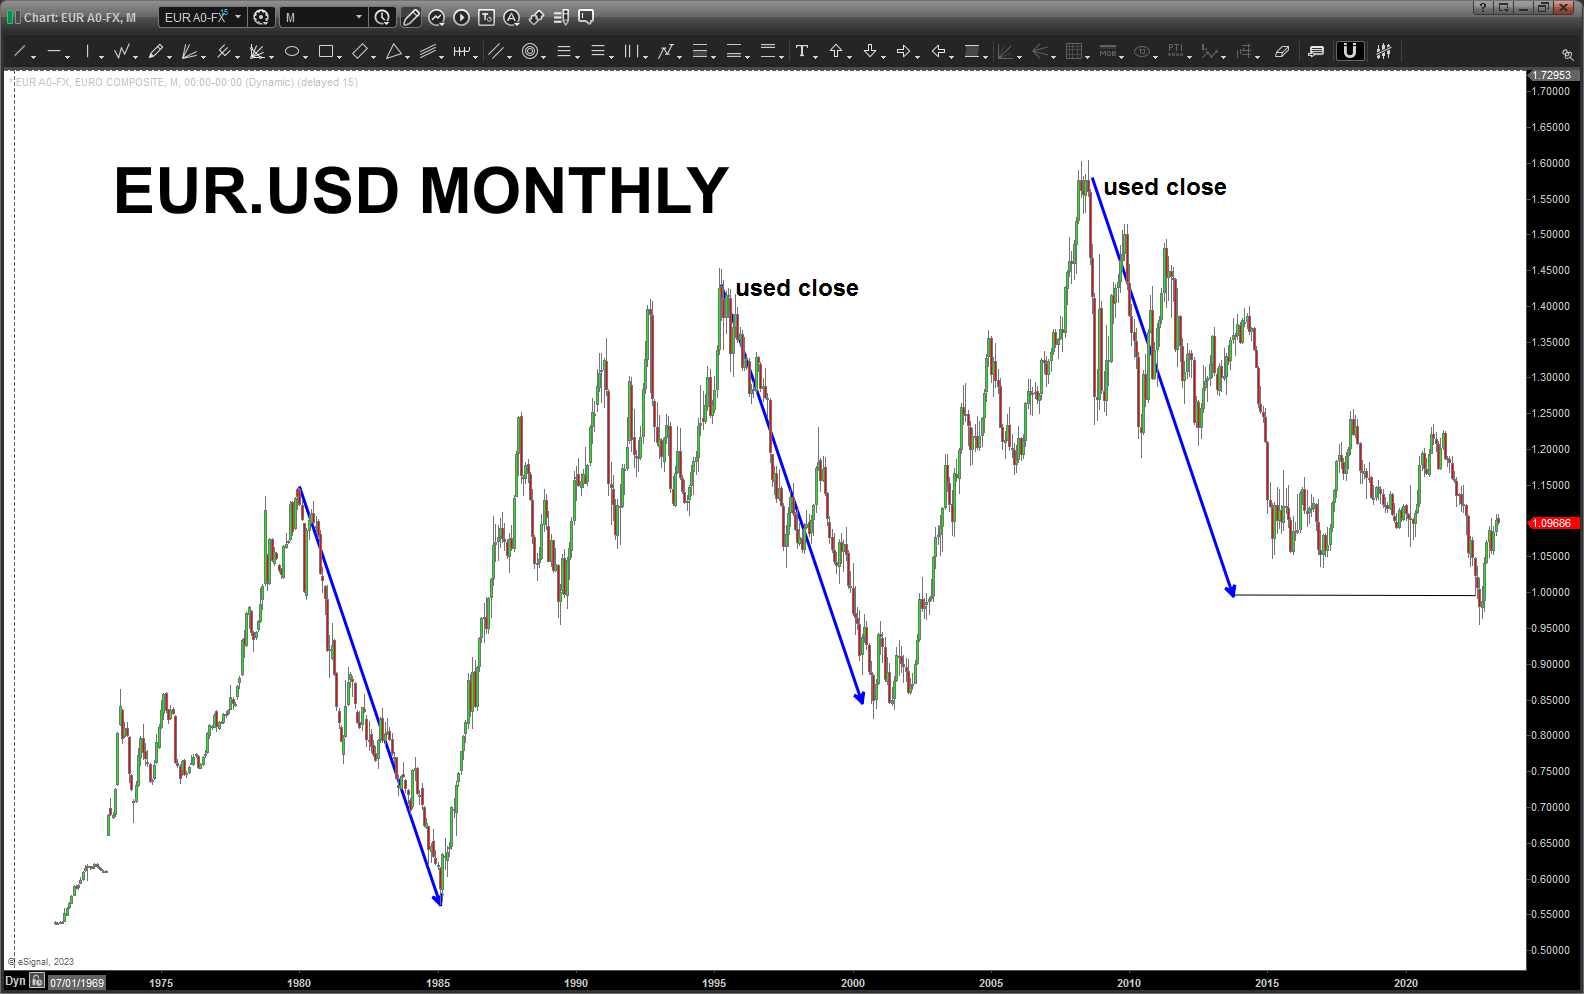
On the podcast “Trendlines over Headlines” I discussed how measured moves can also be used as time components. Took a few seconds to show this concept by taking the Orange and Blue measured moves and flipped them to horizontal to create the time component of the measured moves.
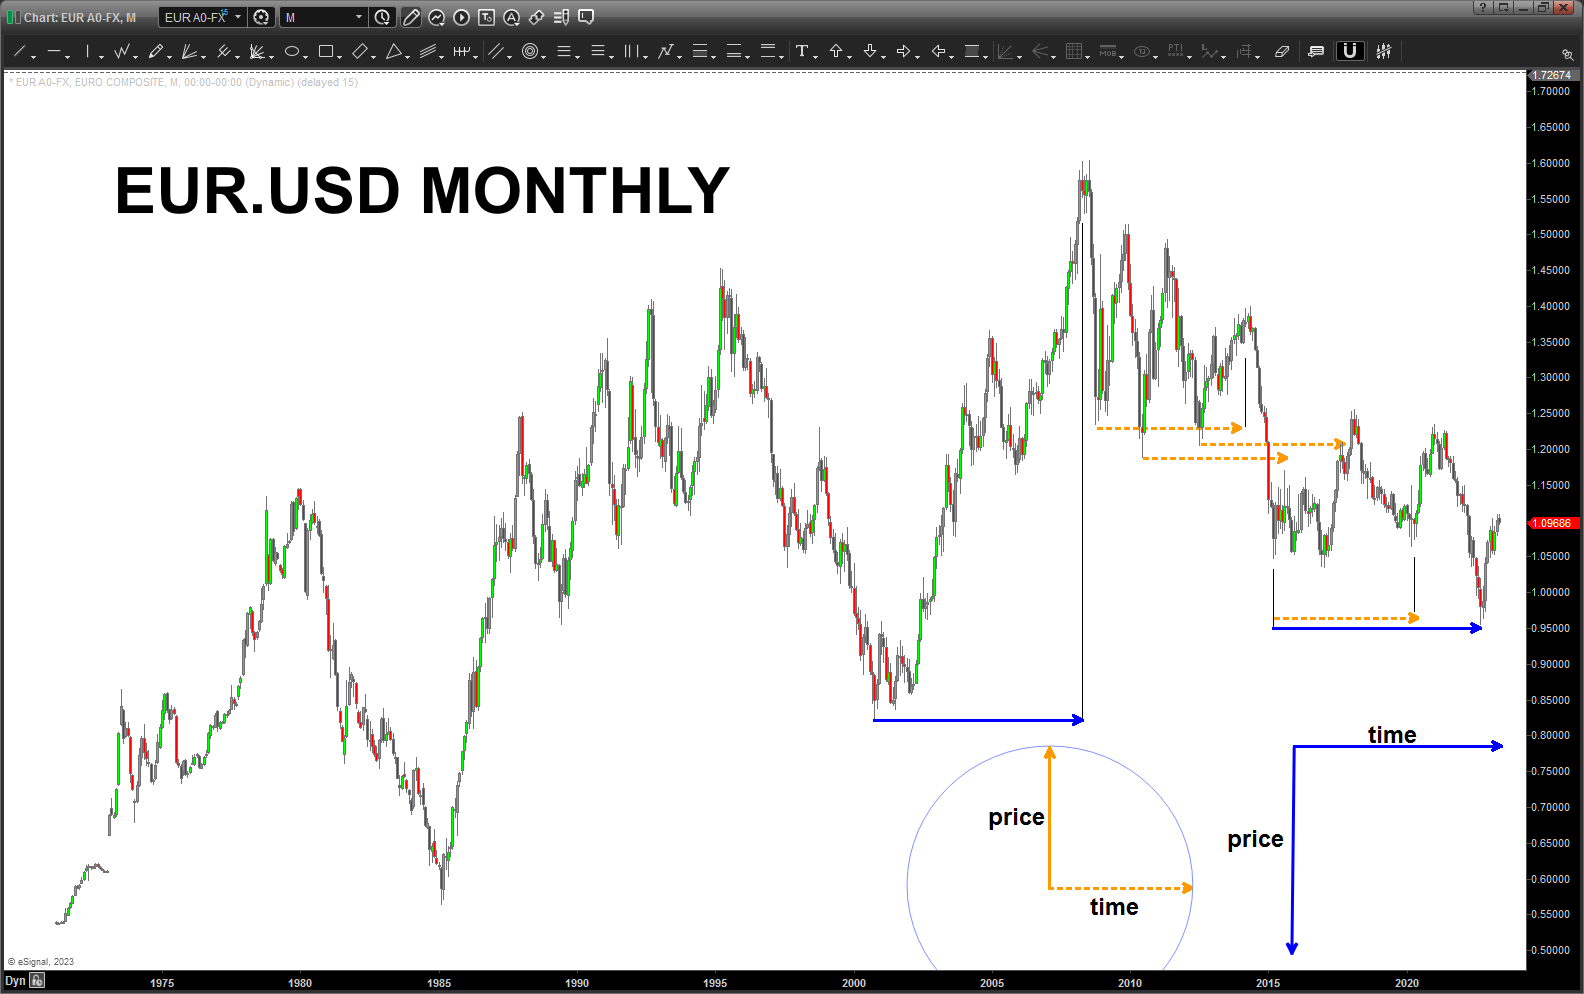
Folks … look at the chart below. From the 2000 low, you can see that the “measured move in time” was pretty accurate. Now, mind you, this is a MONTHLY chart so we have some “time” for the cycle to hit. But, you can get it down to the day and the hour. Something I’m working on … not quite there, yet. But, I just “like” the measured moves ….use them.
PRICE = TIME. They are the same thing on a chart …
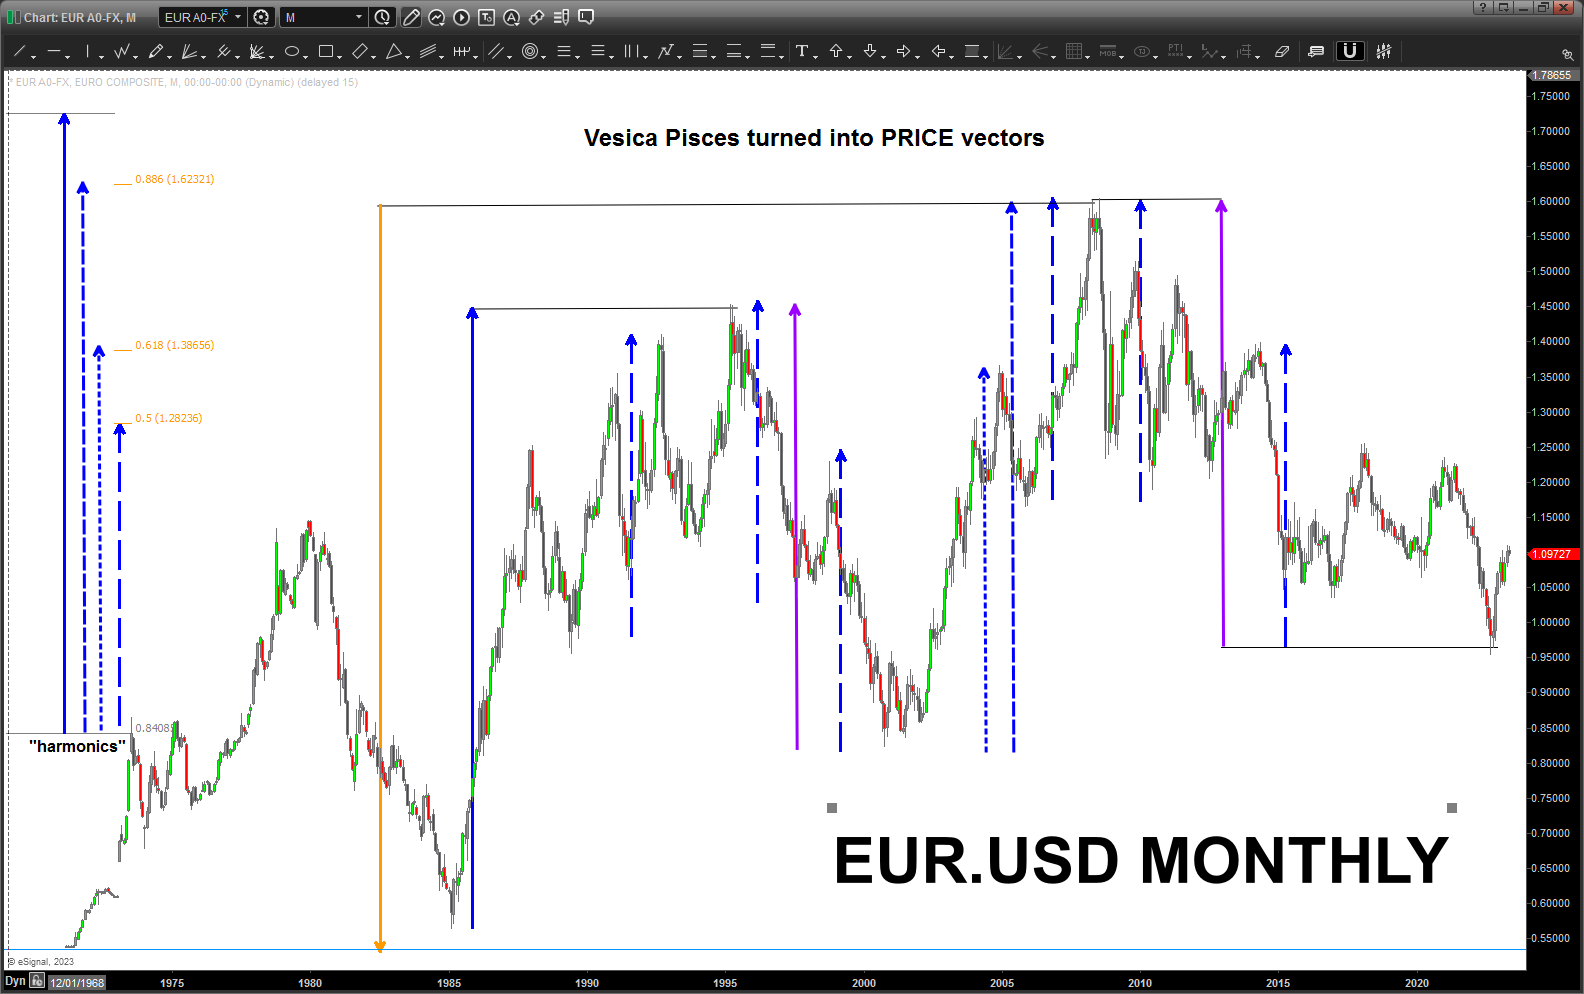
Here’s the creation of the Vesica Pisces for the EURO. For no other reason than to test it out, I’m going to use that first synthetic drop as the “seed”
Now, mind you, this isn’t something that you can really invest/trade off of but, for me at least, it’s a good exercise every now and then. 🙂
the Vesica Pisces is the manifestation for the creation of life and is where the numerical equivalents of the square roots of 1-5 come from … it’s inherently nested in Metatrons cube (Archangel Metatron is – according to legend – responsible for the geometry of creation. Mr. Robert Edward Grant has done AMAZING work showing how this happens and has recently PROVEN that the 3 pyramids were actually constructed at the same time w/ Metatrons cube in mind .. it’s amazing.
Anyway, the market vibrates and is harmonic and abides by natural law. Just like everything … our job is to find that “beat” and “vibration” and then give it a whirl. One last, note, you can move the vectors horizontal to show the TIME component. I would do that but .. need to go do some “work.”
Cheers and make it a great day.
Every PRICE move .. based on the Vesica Pisces. Believe it … or not.

DJ Transports – May 09, 2023
Posted on May 9, 2023 1 Comment
Last post on the Transports: https://atomic-temporary-44460632.wpcomstaging.com/2023/01/18/dj-transports-january-18-2023/
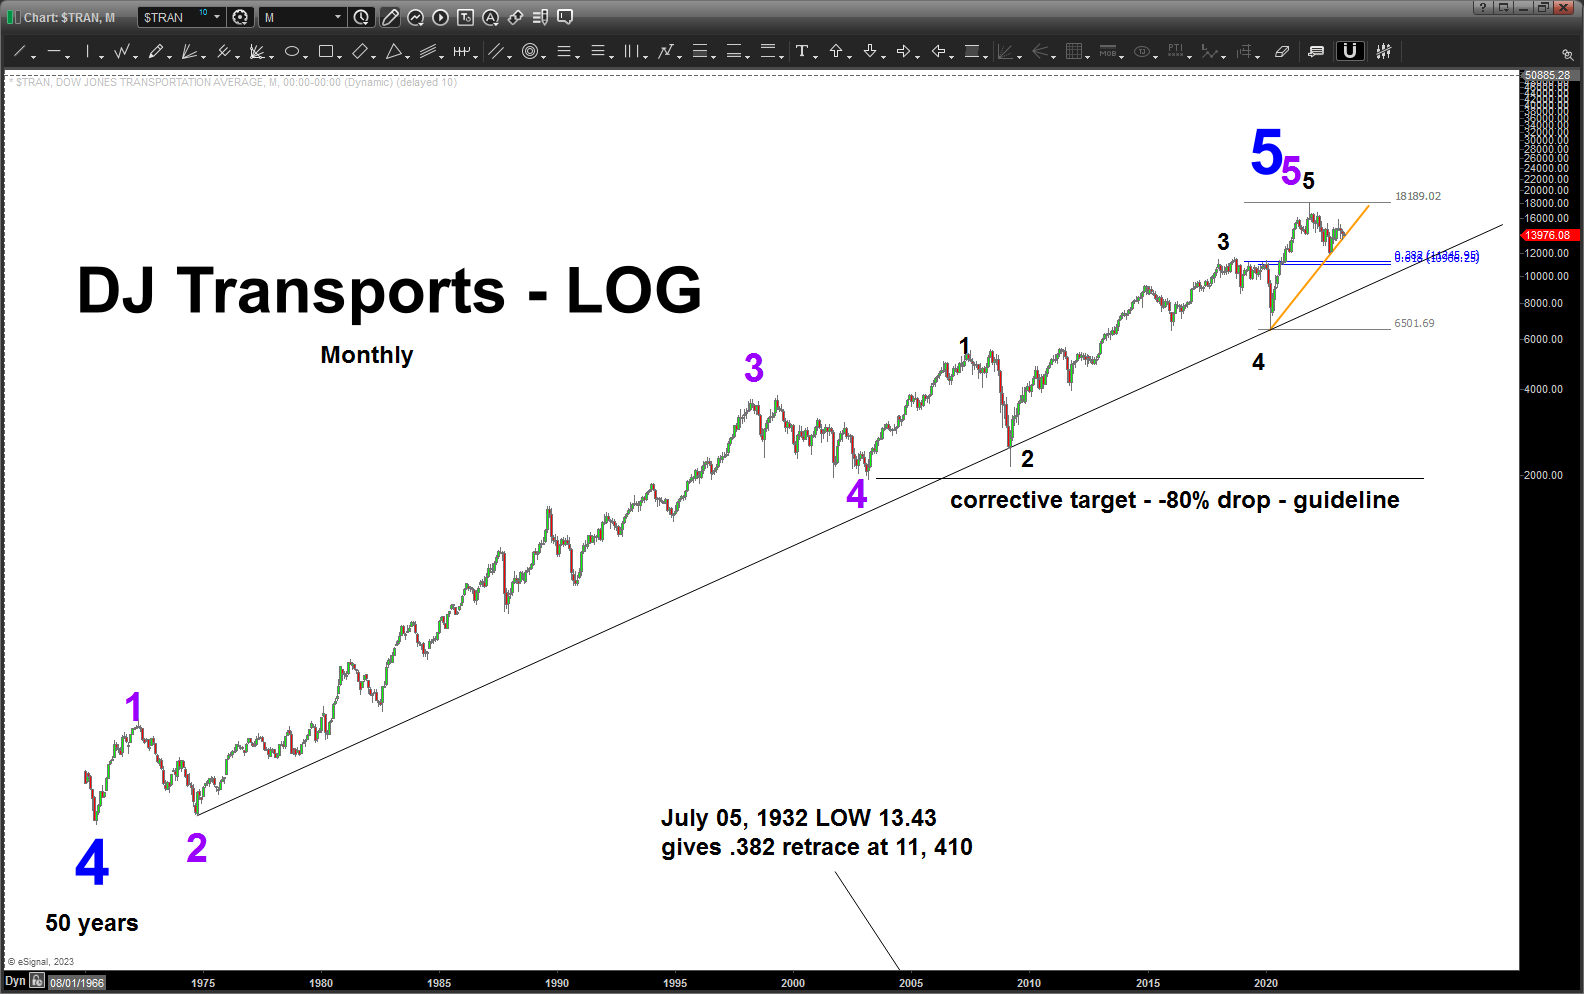
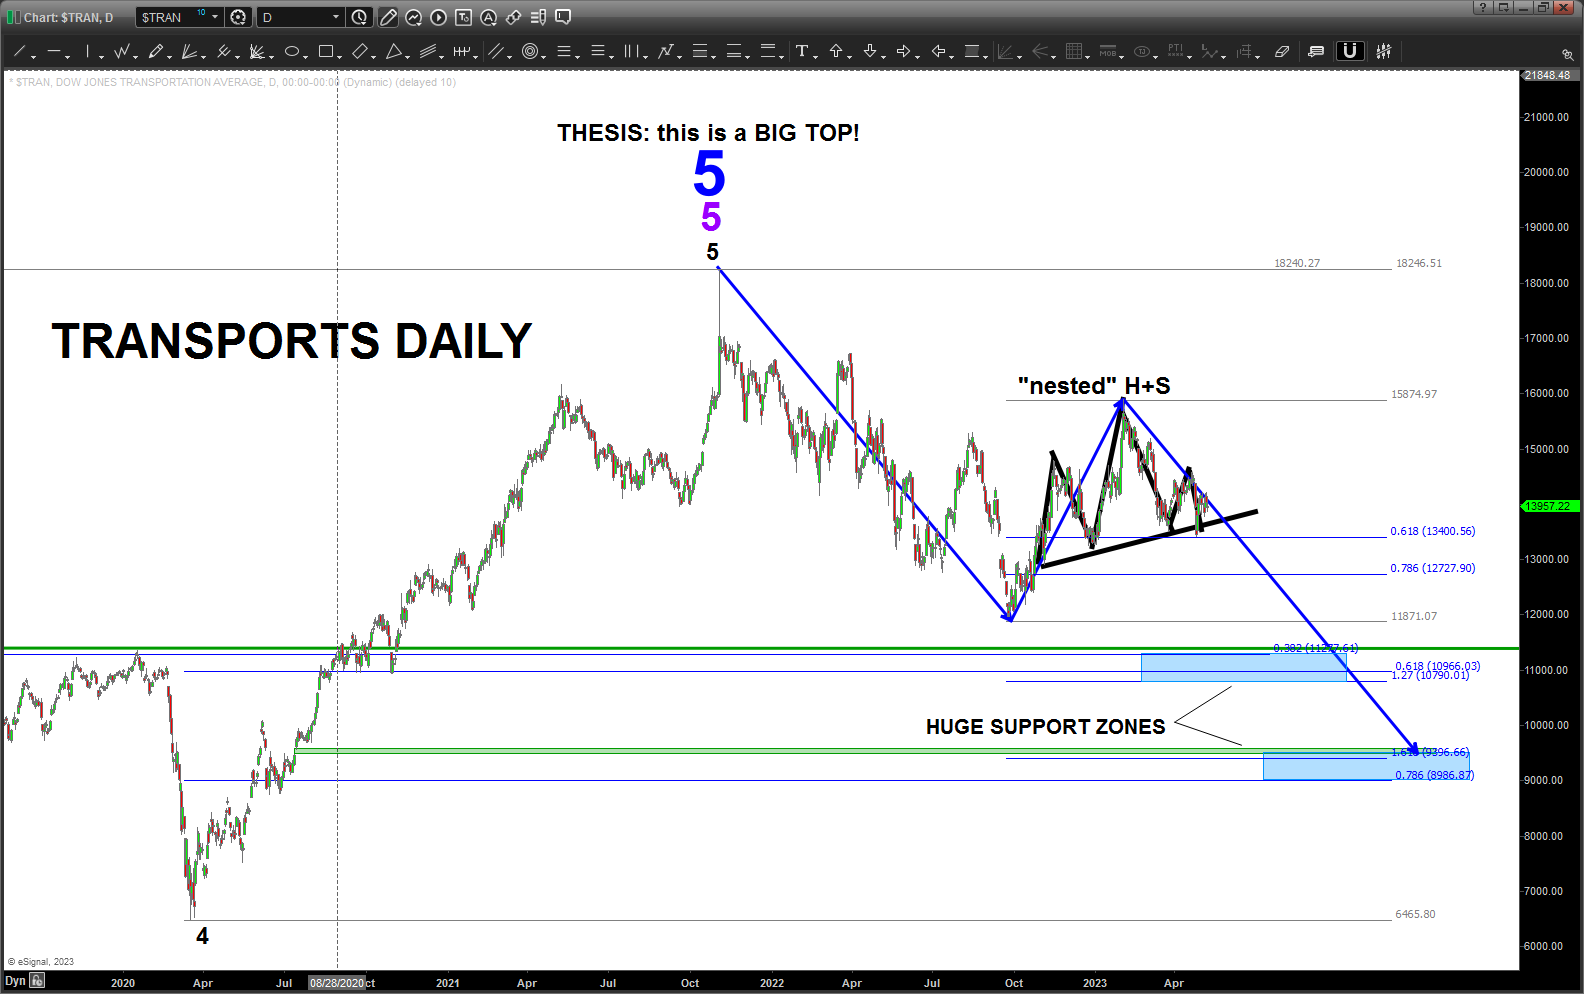
The thesis on the Transports is the ATH is a “BIG TOP.” Thus far, we haven’t really broken down that hard so only TIME will tell.
We like when .382 / .618 retracements are on top of each other and we have that a little lower in the high 10K’s and low 11k’s. This a HUGE target zone for the Transports. IF they slice thru that level then they “should” go down to the ABCD level and then attack the 50 year old trend line .. we break those levels and the corrective drop target (likes to target the previous wave 4 of a lesser degree – guideline NOT a rule) into 2K is certainly a reality. I’m blogging about this now because I have no earthly idea what would cause such a thump .. let’ face it, that’s pretty much a breakdown of the transportation sector, probably globally.
I’m going to stick w/ this count, more than likely getting proven wrong – certainly hope so …
from a technical perspective pay attention to:
- obviously, the count …
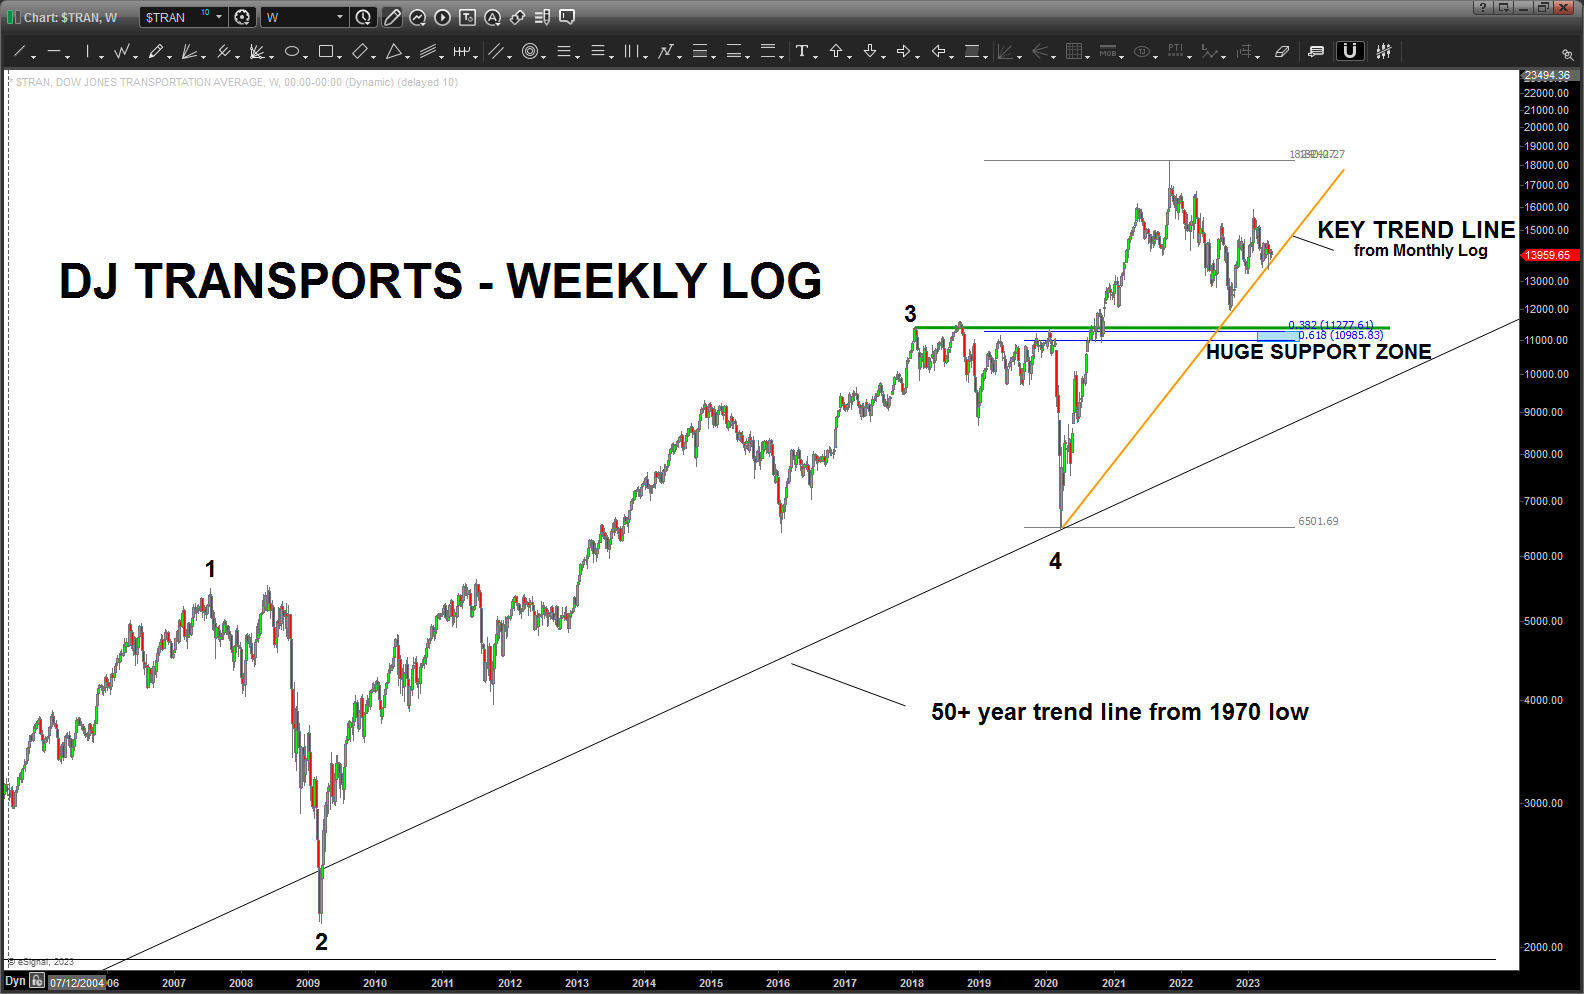
- the orange trend line (log) from the monthly, weekly – it appears that is what is holding it up
- the “nested” head and shoulders .. breaking the neckline AND the orange log trend line should start this lower
- .382 from the 90 year low 0f 13.43 is 11,277
- the BUY pattern is down around 8986-9396 –
- net, net we have two very important zones of support and then the looming trendline from 50 years ago.
hope, being a strategy, this analysis is COMPLETELY WRONG
JPM – May 04, 2023
Posted on May 4, 2023 2 Comments
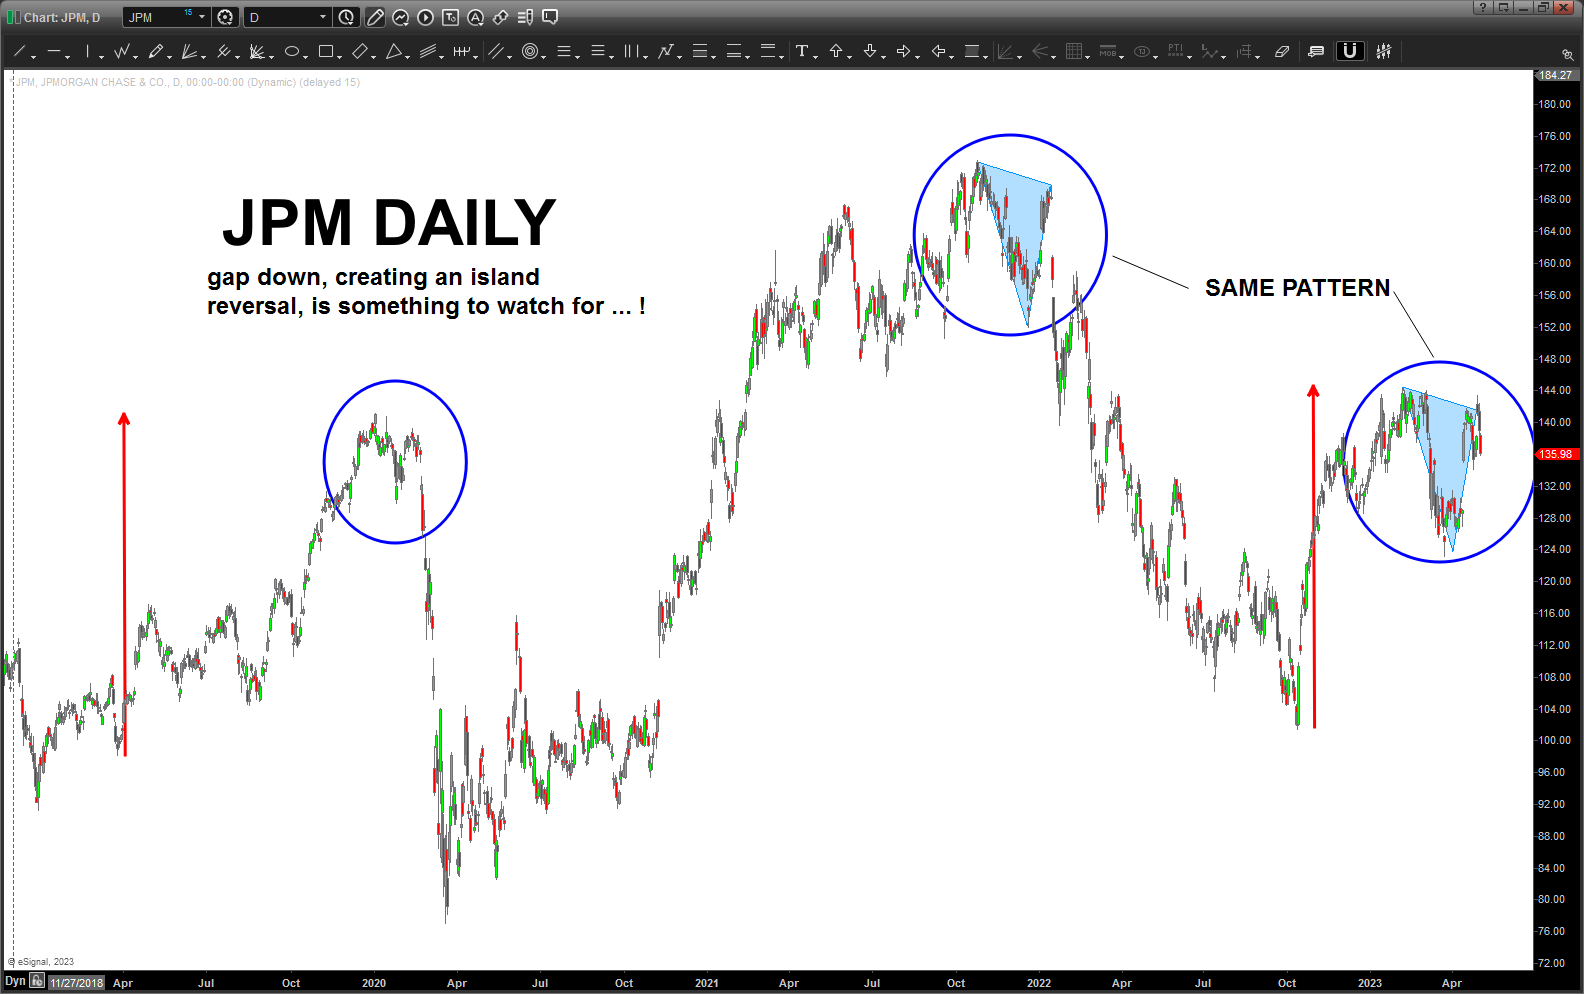
Pay attention to this PATTERN on JPM daily. The past 3 major tops have gapped down and the last two have created island reversals. IF (the BIG IF) we gap down today and leave and “island” then this could be very troubling for the banks and, historically, has led to a pretty big down move in JPM.
No idea if that will happen in the coming days but, again, the TIME is perfect in it’s relation to the the all time high PATTERN and the price is off just a wee bit .. essentially we have the same exact same set up as the high .. now, TIME will tell.
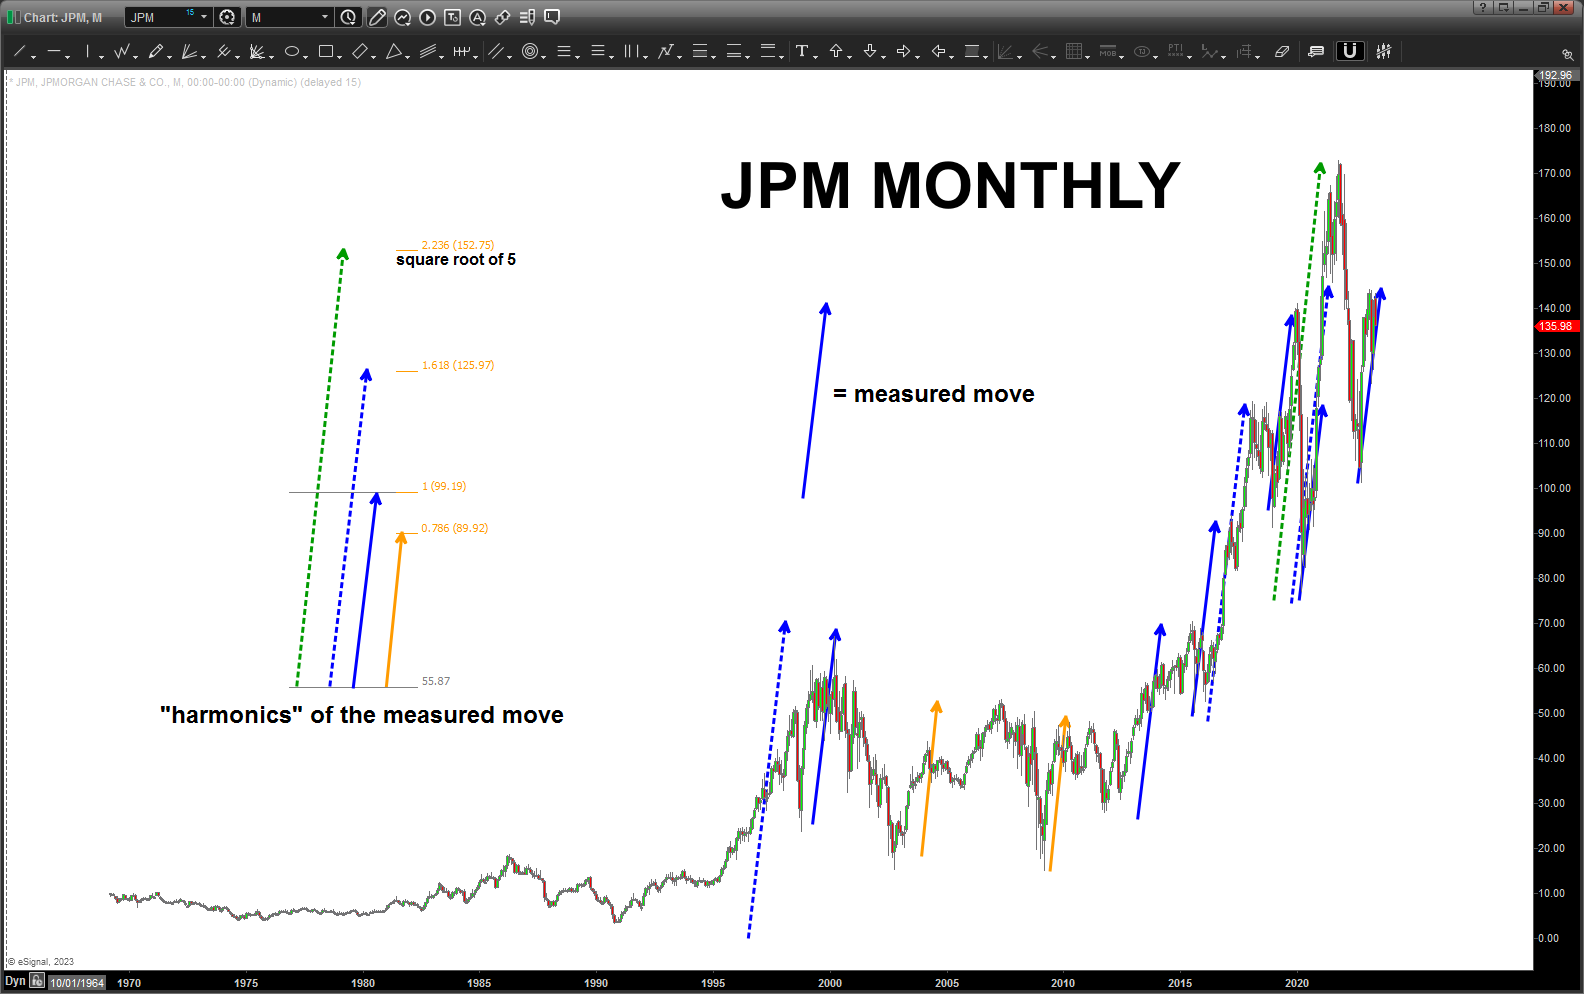
on a monthly level, the “blue measured move” certainly looks to be harmonic w/ JPM. the most recent high in/around mid 140’s was exactly equal to the blue measured move … again, keep an eye on JPM as it’s appears to be the big dog helping out the troubling regional and smaller banks.
If (again the BIG IF) we gap down in JPM to create an island then this big dog could be signaling a much bigger credit crunch on the way.
LIBOR Rate – April 30, 2023
Posted on April 30, 2023 Leave a Comment
The LIBOR rate is an important gauge … for a better explanation that I can provide please see: https://www.investopedia.com/terms/l/libor.asp
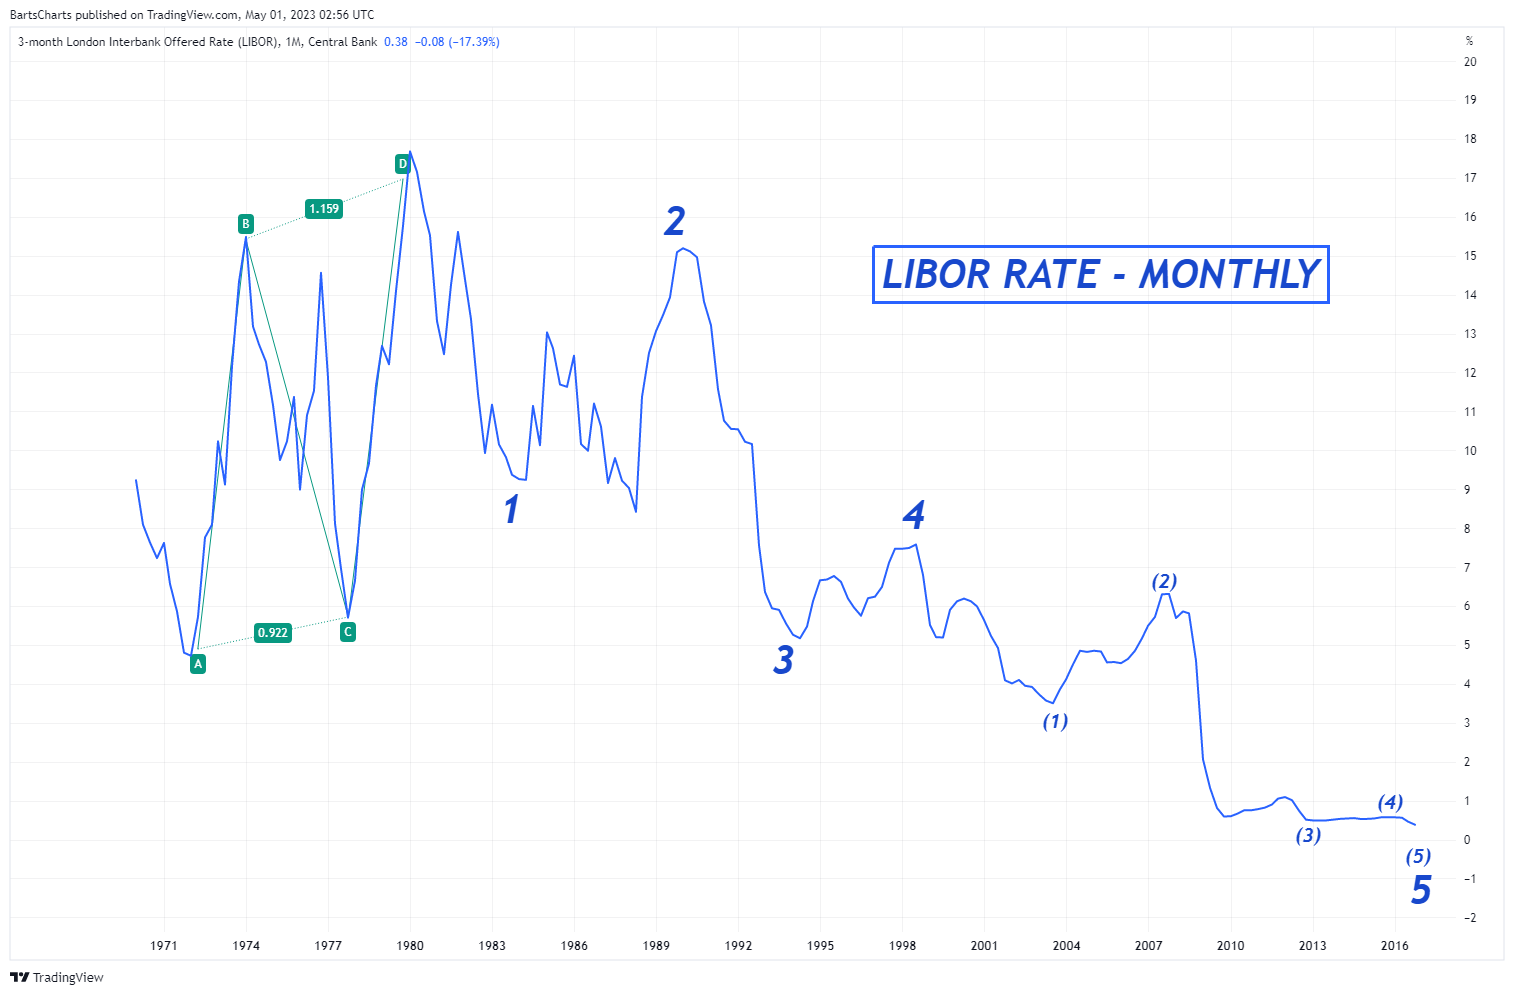
Basically, it’s the rate that banks charge each other to move a “shi&t ton” of money around overnight. It’s HUGELY important .. in fact, Mr. Martin Armstrong picked up some LIBOR issues around August before COVID and it was fascinating to watch this play out – these banks are truly the gorillas juggling dynamite in the cage we jump into trading the financial markets. Oh, forgot to mention, the dynamite is lit!
I just decided to play around w/ the LIBOR chart and just started counting … now, as many of you know, my EWT counting is truly like my golf game. Sometimes, smacking it right down the middles and other times, the ball is simply no where to be seen or found. My swing (and counting) can get that bad … also, just like when you ask someone their score and they look back and start counting w/ their finger you know they are giving you a “fake news” score! So, if I get a sub wave of a sub wave of a sub wave into the counting then I’m probably just making it up. With all that being said, I really just try not to break any rules and get on the side of the MAIN wave. I LOOK for corrective patterns as they are the most reliable way to enter into a position. When we have a PATTERN and an EWT count that fits then probability does become quite high. But, you simply never know …
NO rules are broken below … sure looks like the LIBOR RATE has/is bottoming and that means, eventually, the rate the banks charge each other is going to get a LOT more expensive … could be tomorrow, could be years from you but I think this is showing a pretty clear 5 waves down so the next “trending” move is going to be: UP.
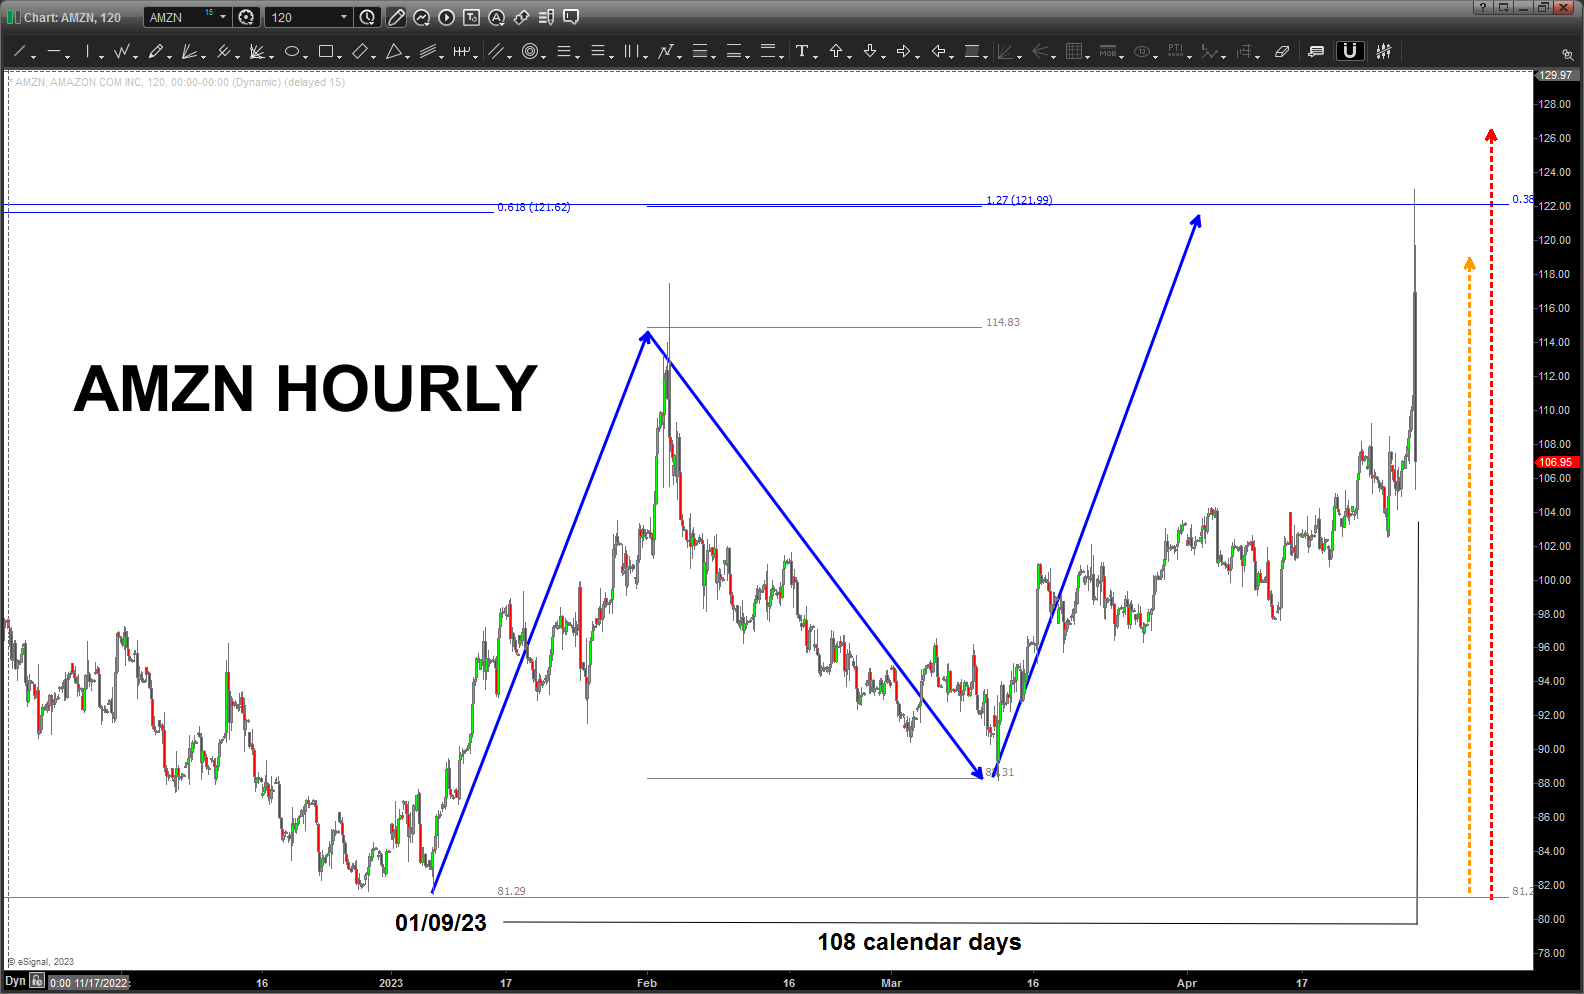
AMZN – April 27, 2023
Posted on April 27, 2023 2 Comments
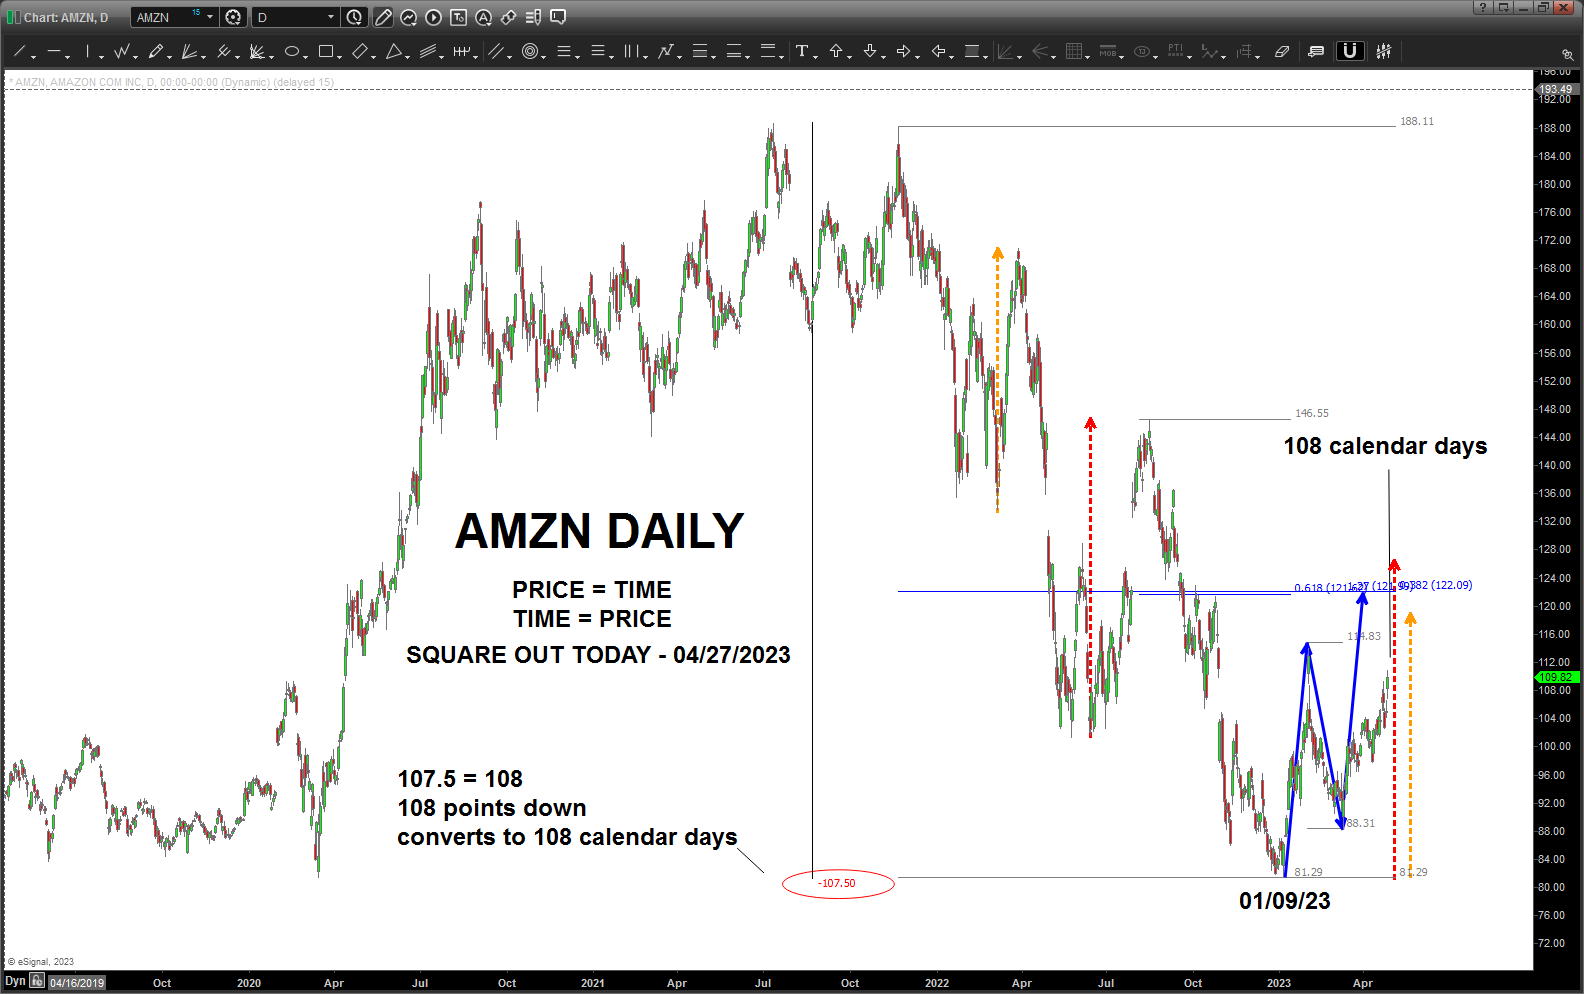
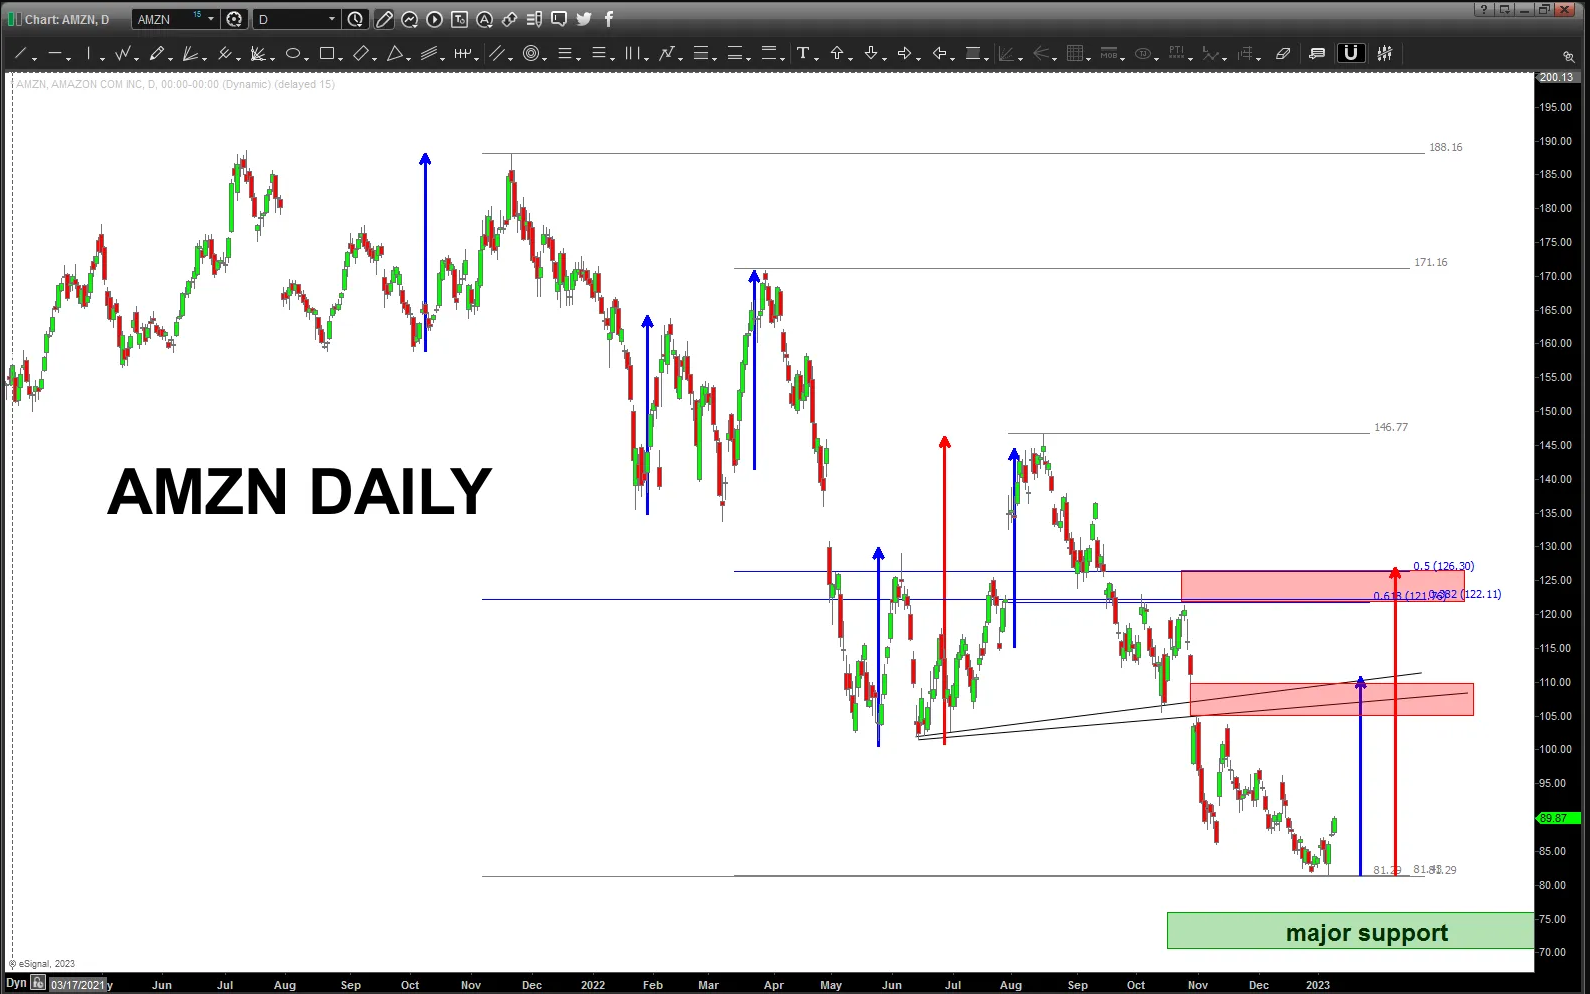
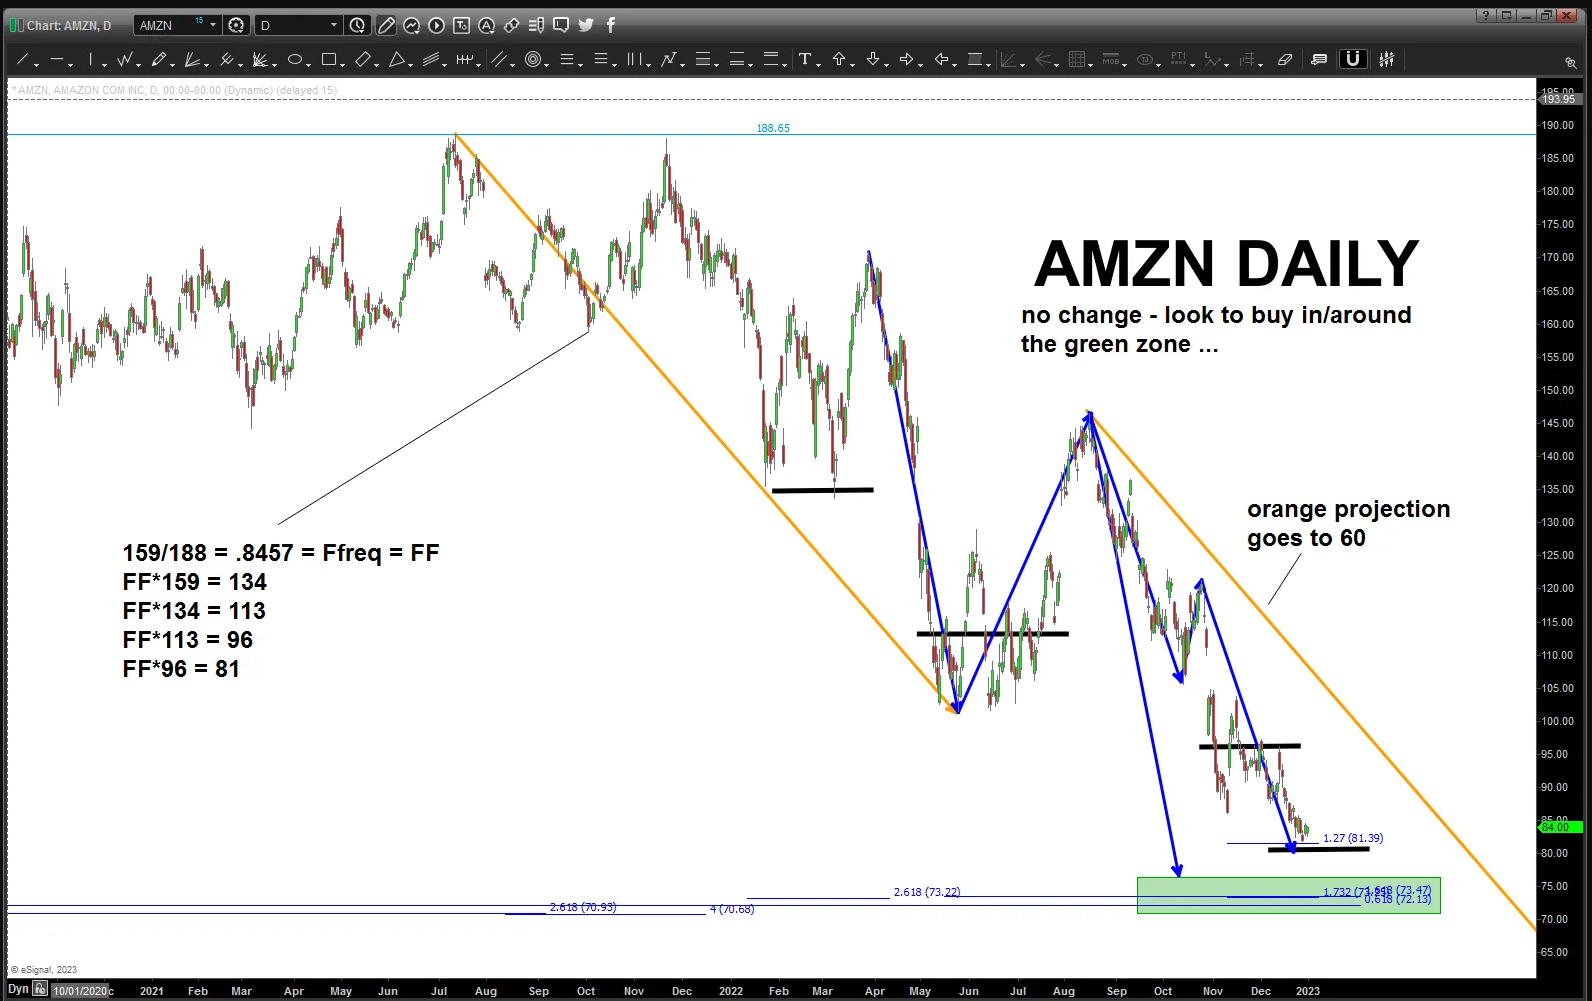
hard to believe that I derived the targets shown above below in January. pretty crazy.
what was important about today was AMZN performed a calendar day square out. in the world we live in (i.e. if your reading this blog) PRICE and TIME are the SAME THING. PRICE=TIME and TIME=PRICE. So, a PRICE of $50 dollars will spin off TIME cycles of 50 minutes, hours, weeks, days, etc. etc.
the famous WD Gann said you can square out a HIGH, LOW or a RANGE. In this case, the RANGE from the ATH to the most recent January low was 108 points. We take 108 points (note – you can move planets helio or geo based on this square out and you might want to try it … 😉 and convert that to 108 calendar days. that was today …. from the low on January 09, 2023 we add 109 calendar days and that day was today.
My issue (we all have them) is I found the square out but the pattern was SO FAR AWAY that I was a little confused. WE LIKE TO SEE SQUARE OUTS IN TIME WITH CORRESPODING BUY OR SELL PATTERNS…. so what to do.
Well, well, well … today was an earnings call for AMZN (had no idea) and guess what after hours it went up and tagged the pattern on the day of the square out.
GO FIGURE … no idea what the earnings were or weren’t.
Be short AMZN below 122.
TSLA – April 27, 2023
Posted on April 27, 2023 1 Comment
Last post on TSLA: https://atomic-temporary-44460632.wpcomstaging.com/2023/04/05/tsla-update-april-5-2023/
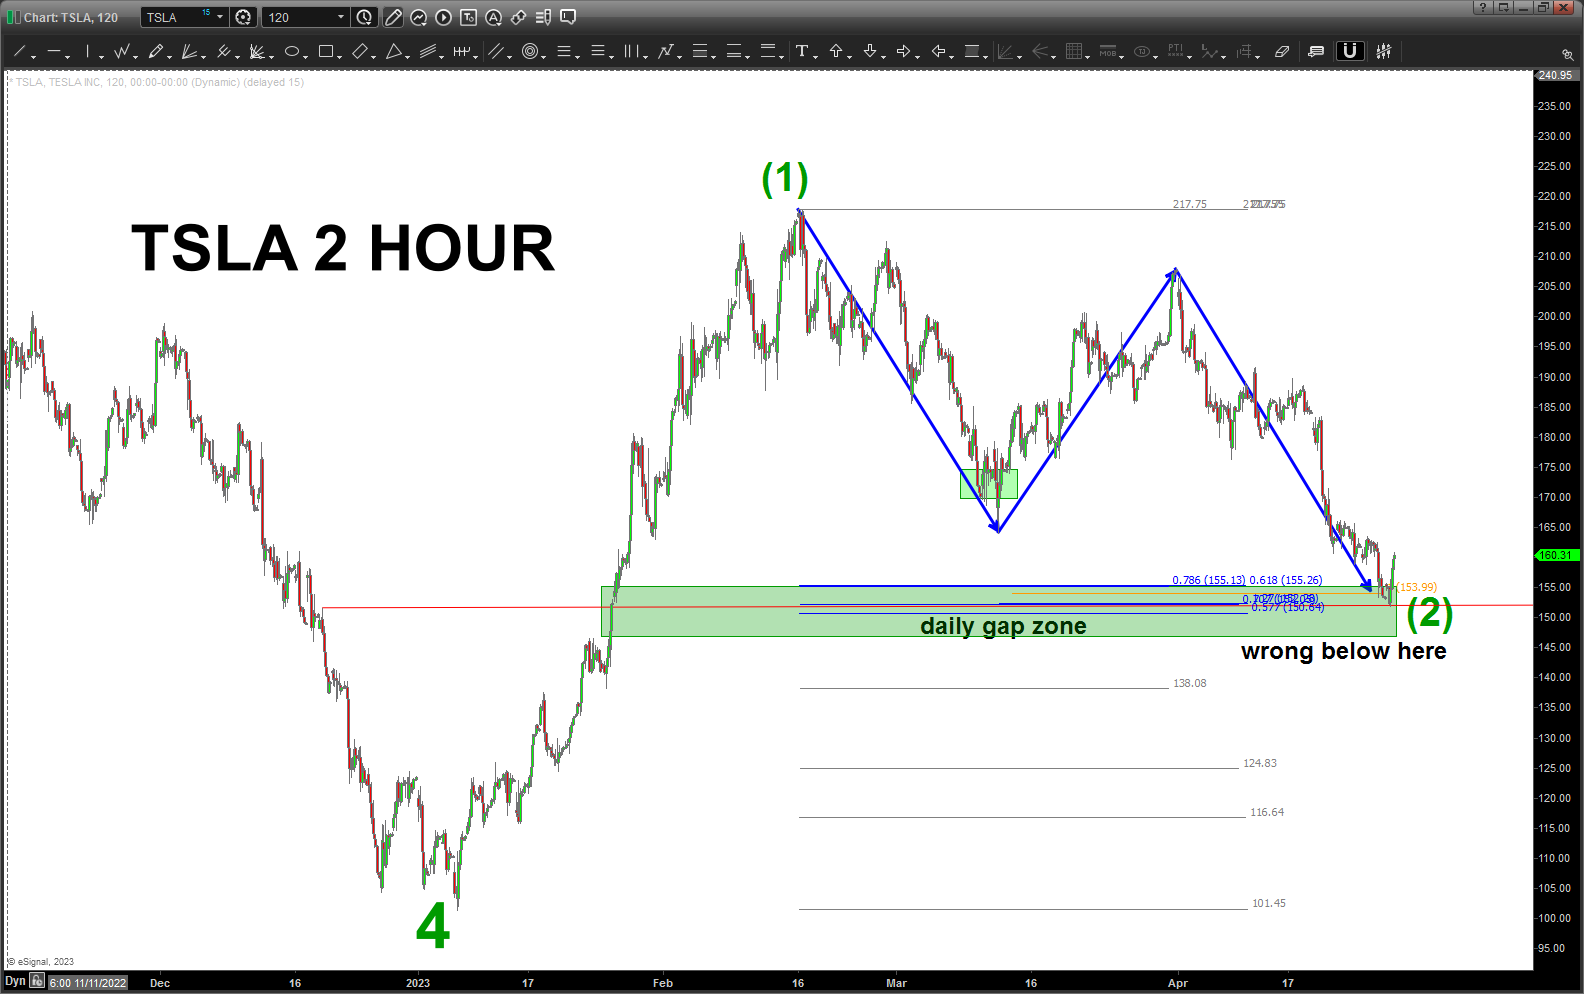
If correct, TSLA is off to new highs. Stops to remain below the lower green gap area ~145.
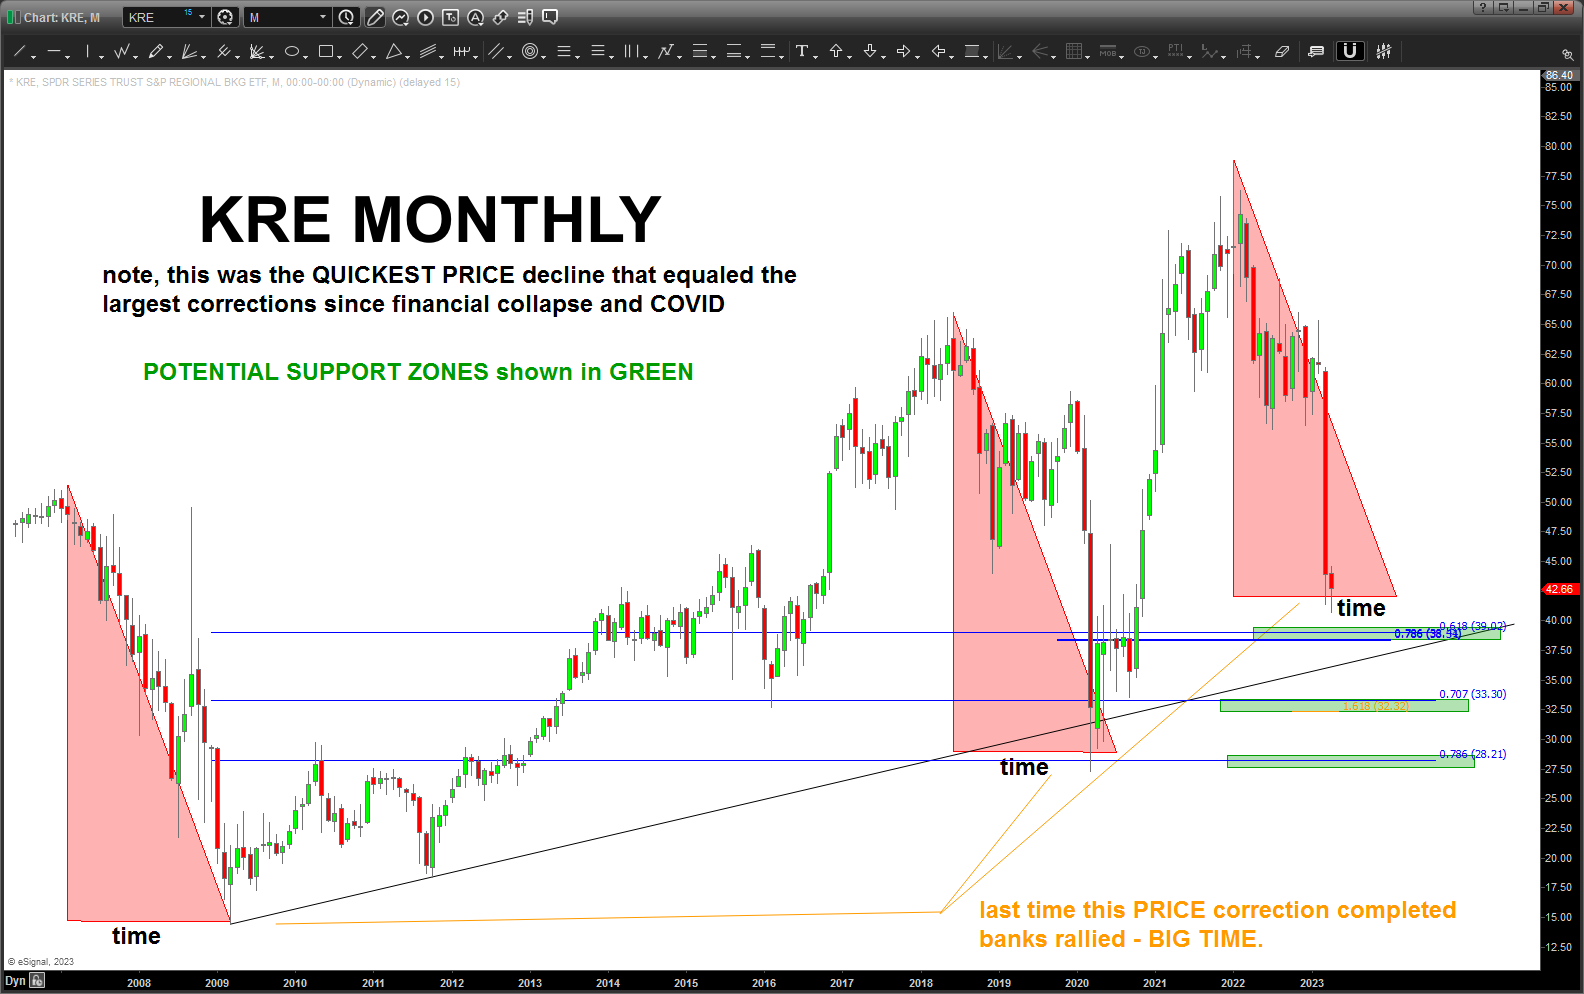
Banking Index – April 24, 2023
Posted on April 24, 2023 1 Comment
Last post on the Banking Index: https://wordpress.com/post/bartscharts.com/21122

Well, guess you can say “here we go” or “lets get it on” (cue UFC John McCarthy) …
Banking index has complete the ABCD from the low and the “scary” times … it’s all good, correct? Well, guess we will just have to wait and see.
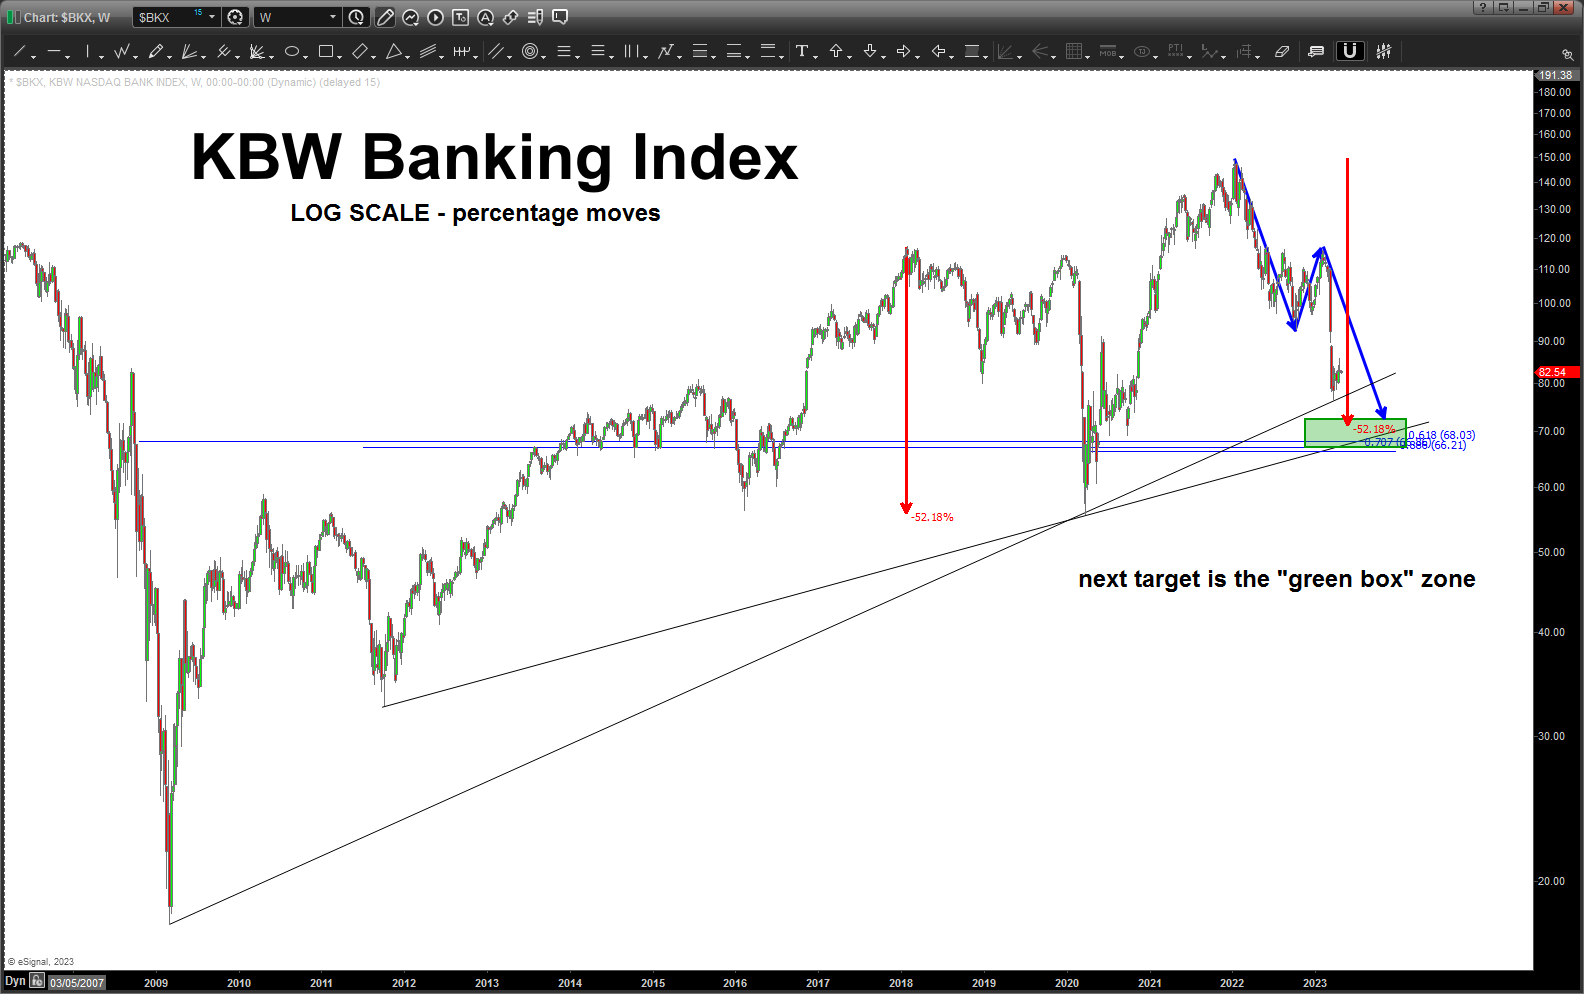
Next stop: 66-68 or lower. Guess we’ll just have to wait and see, right?
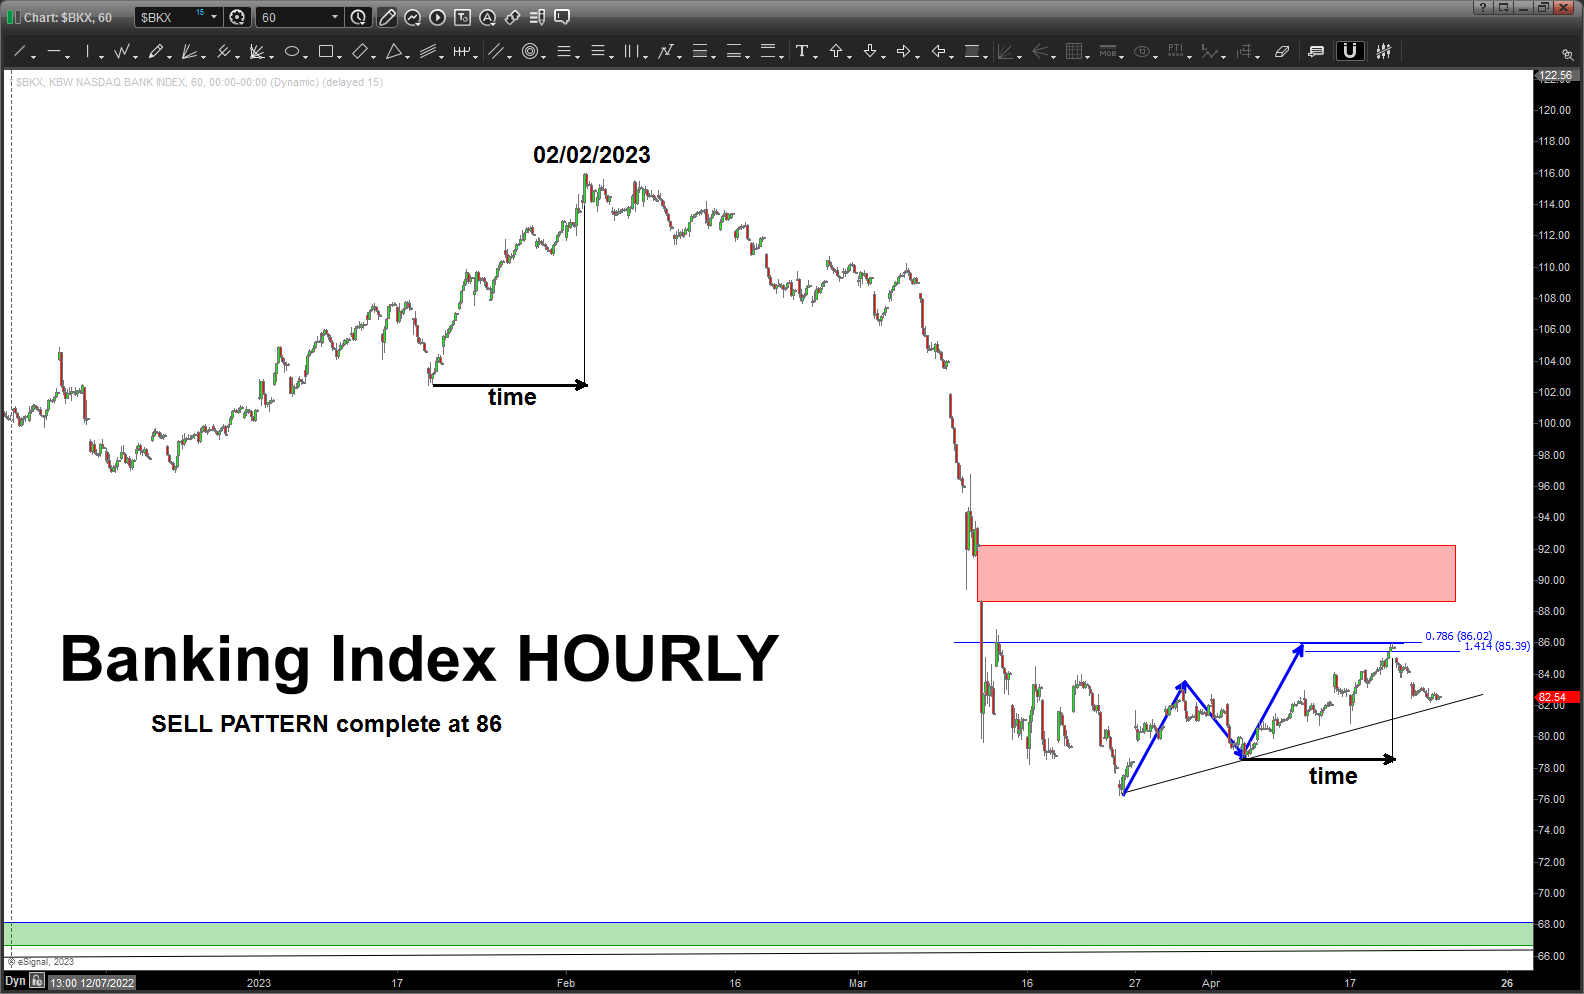
Longer term targets below …
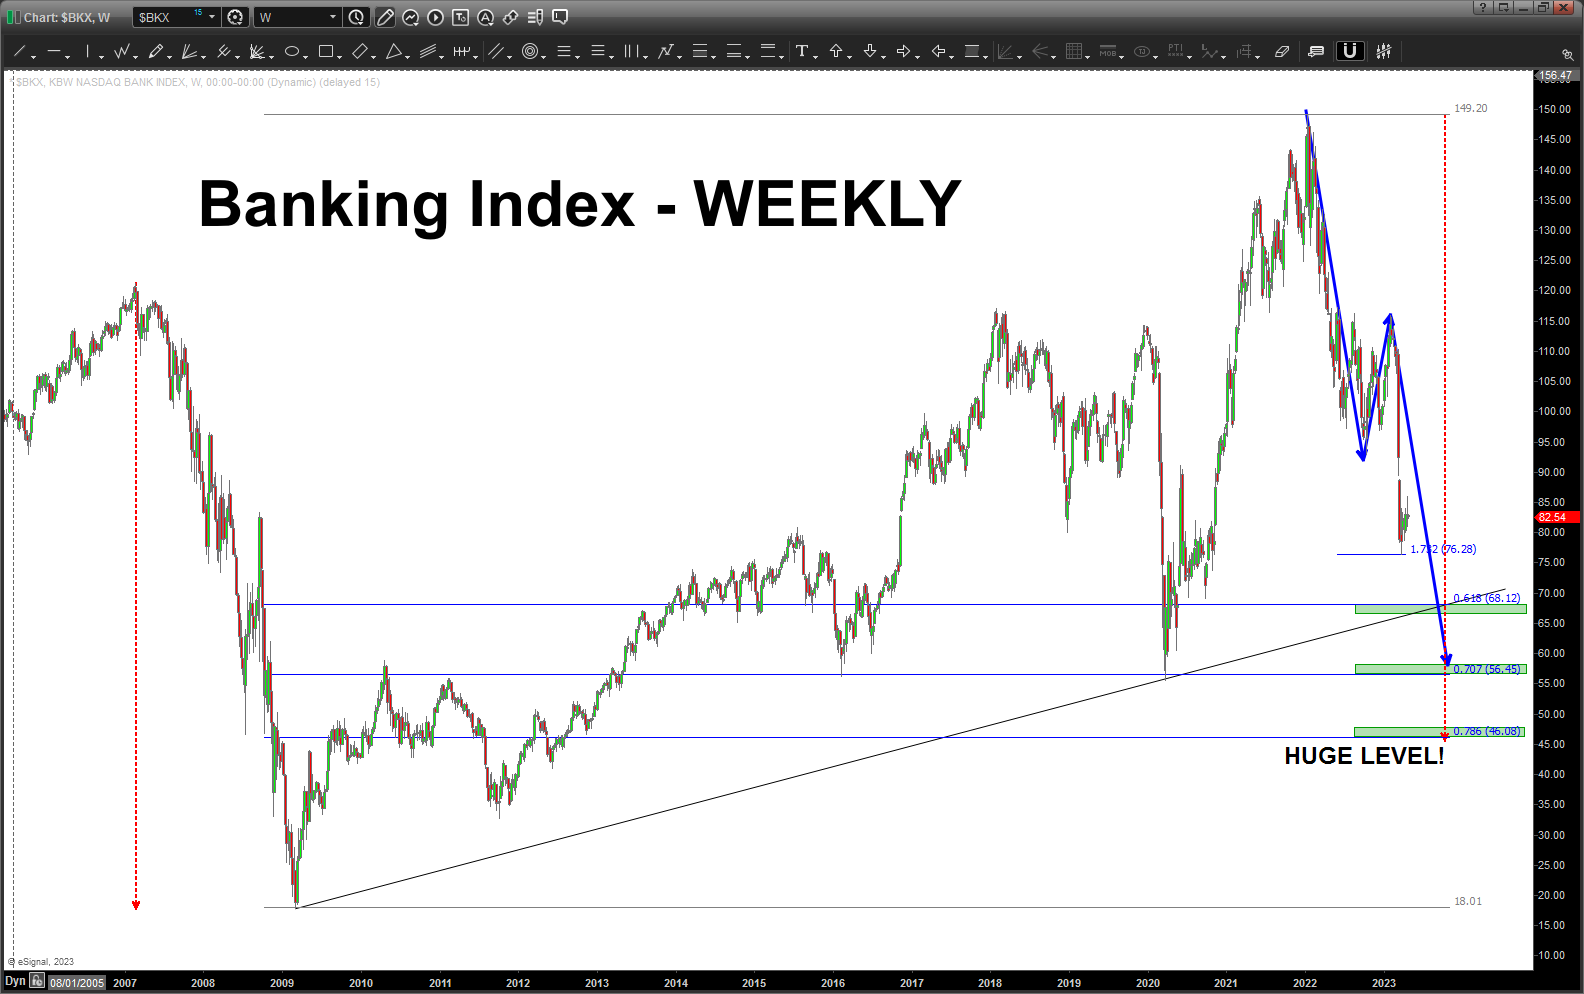
note, the next chart is LOG SCALE
VIX – April 23, 2023
Posted on April 23, 2023 Leave a Comment
Last post on the VIX: https://atomic-temporary-44460632.wpcomstaging.com/2023/01/20/vix-january-20-2023/
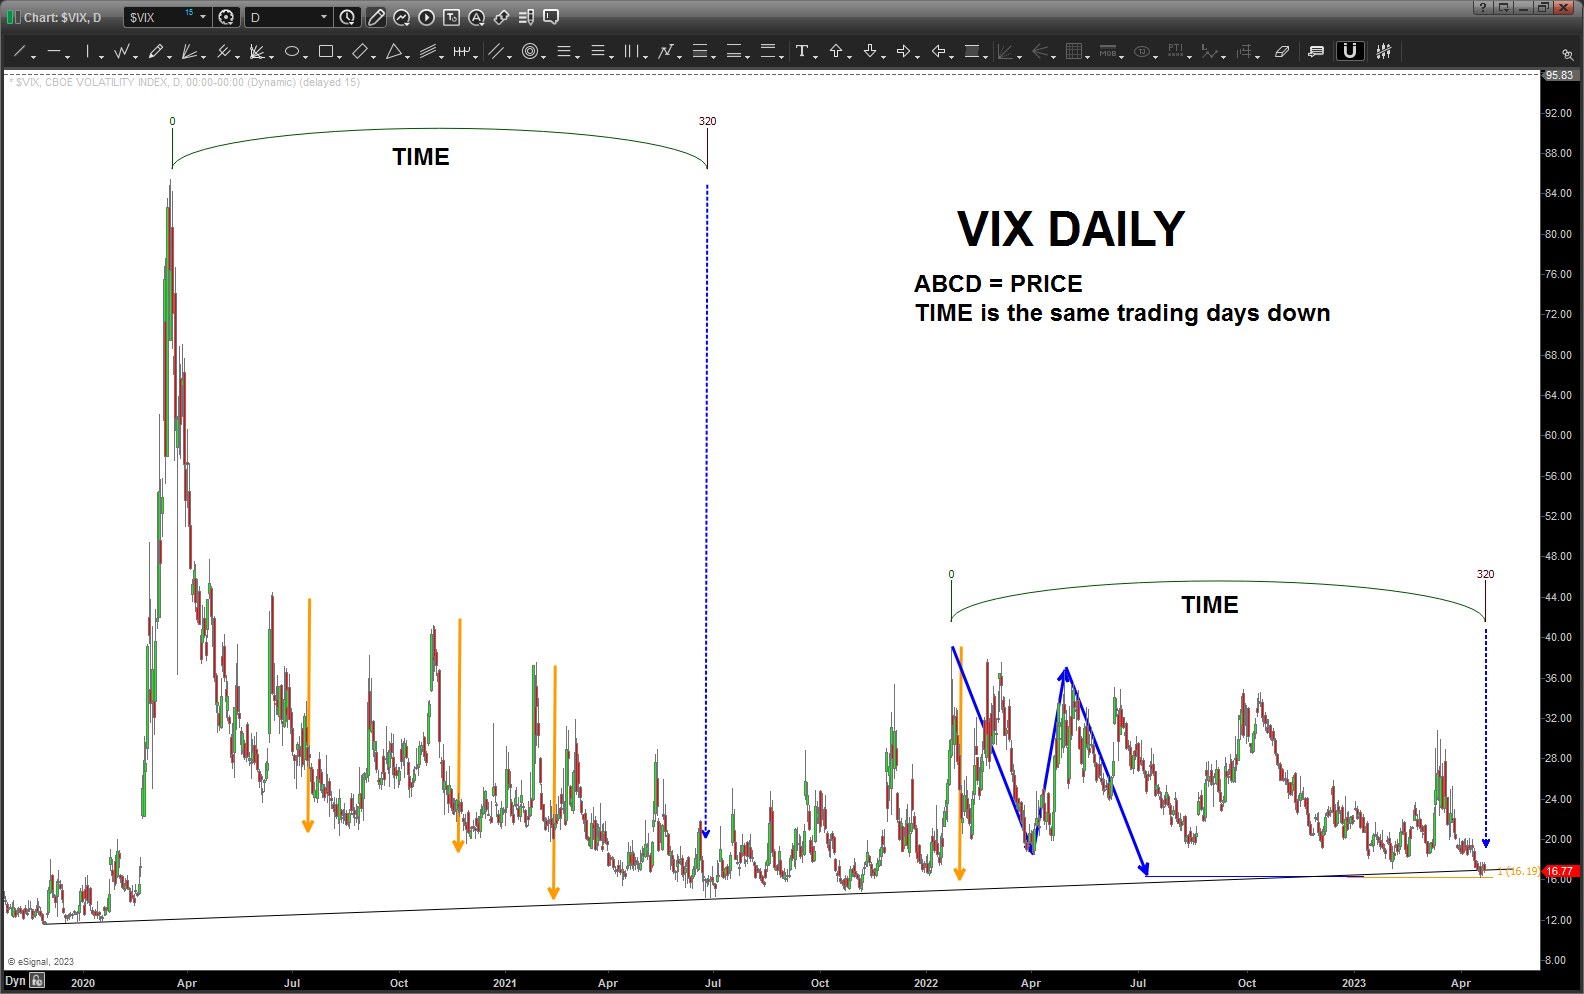
The VIX reacted to the first ABCD in/around 17 but that “bigger” ABCD laid in wait. It has been hit ….
I just got back from my SUP Veterans Retreat and have been completed off the grid for a week. DO IT – just like Mikey, you will like it.
Anyhoo, always great to see things w/ VERY fresh eyes and … check this out.
The TIME down from the 2020 spike in the VIX is equal to the TIME from the spike high in 2022.
Throw in the ABCD and you have a VERY important level to watch on the VIX.