Island Reversals
Posted on July 6, 2023 Leave a Comment
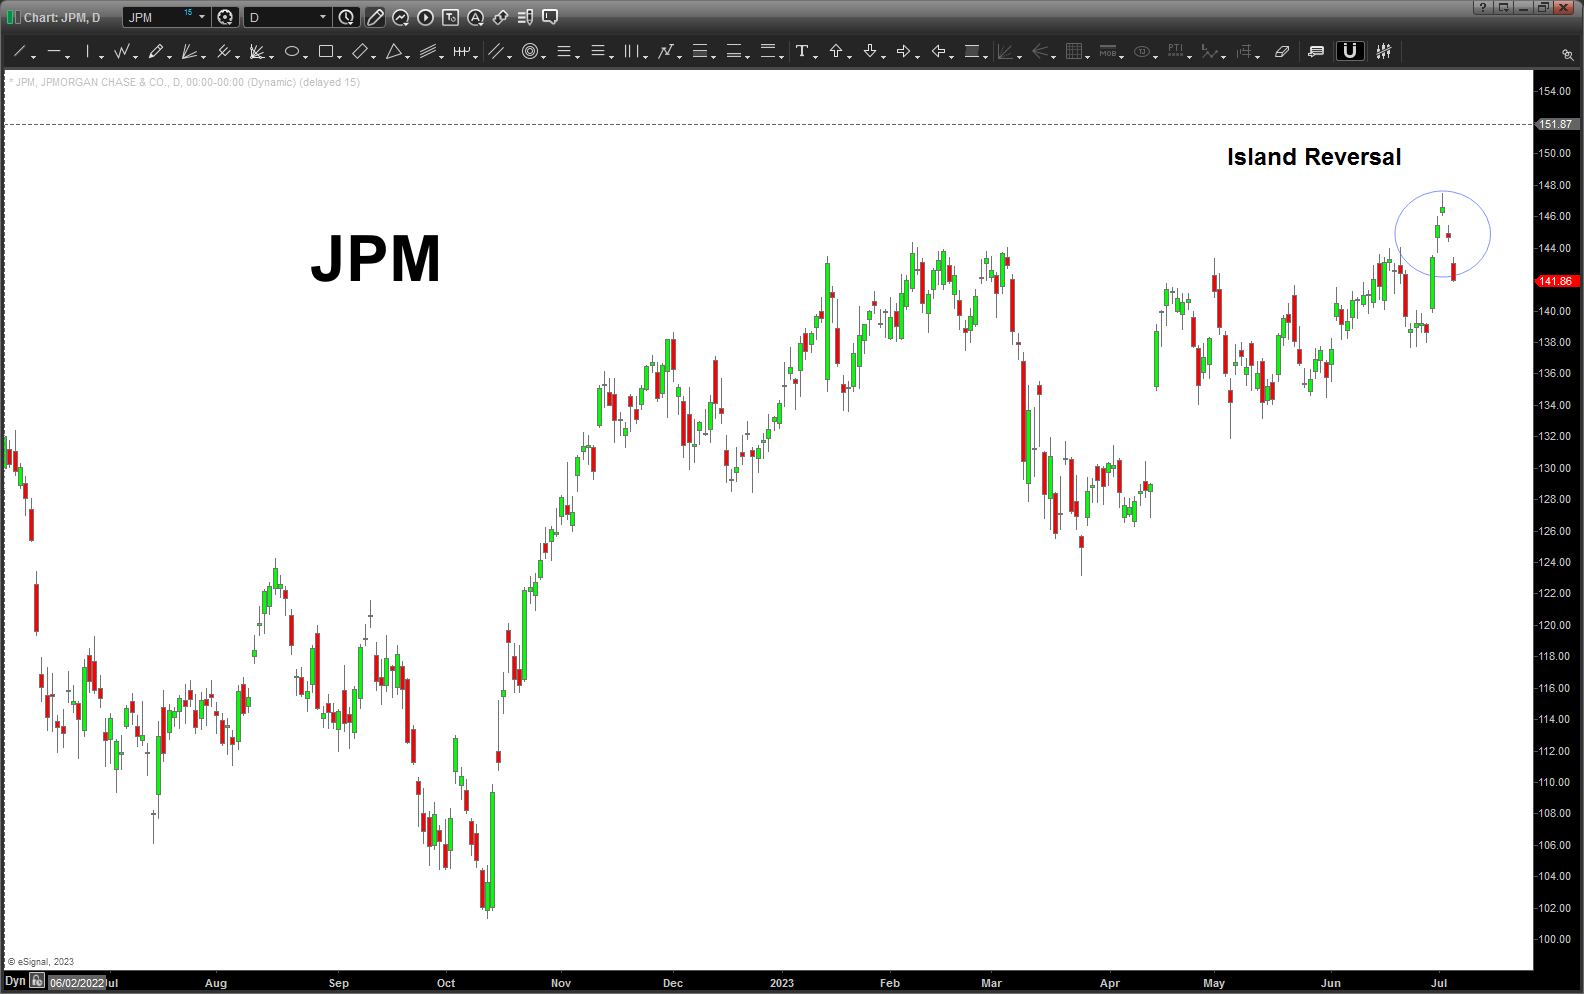
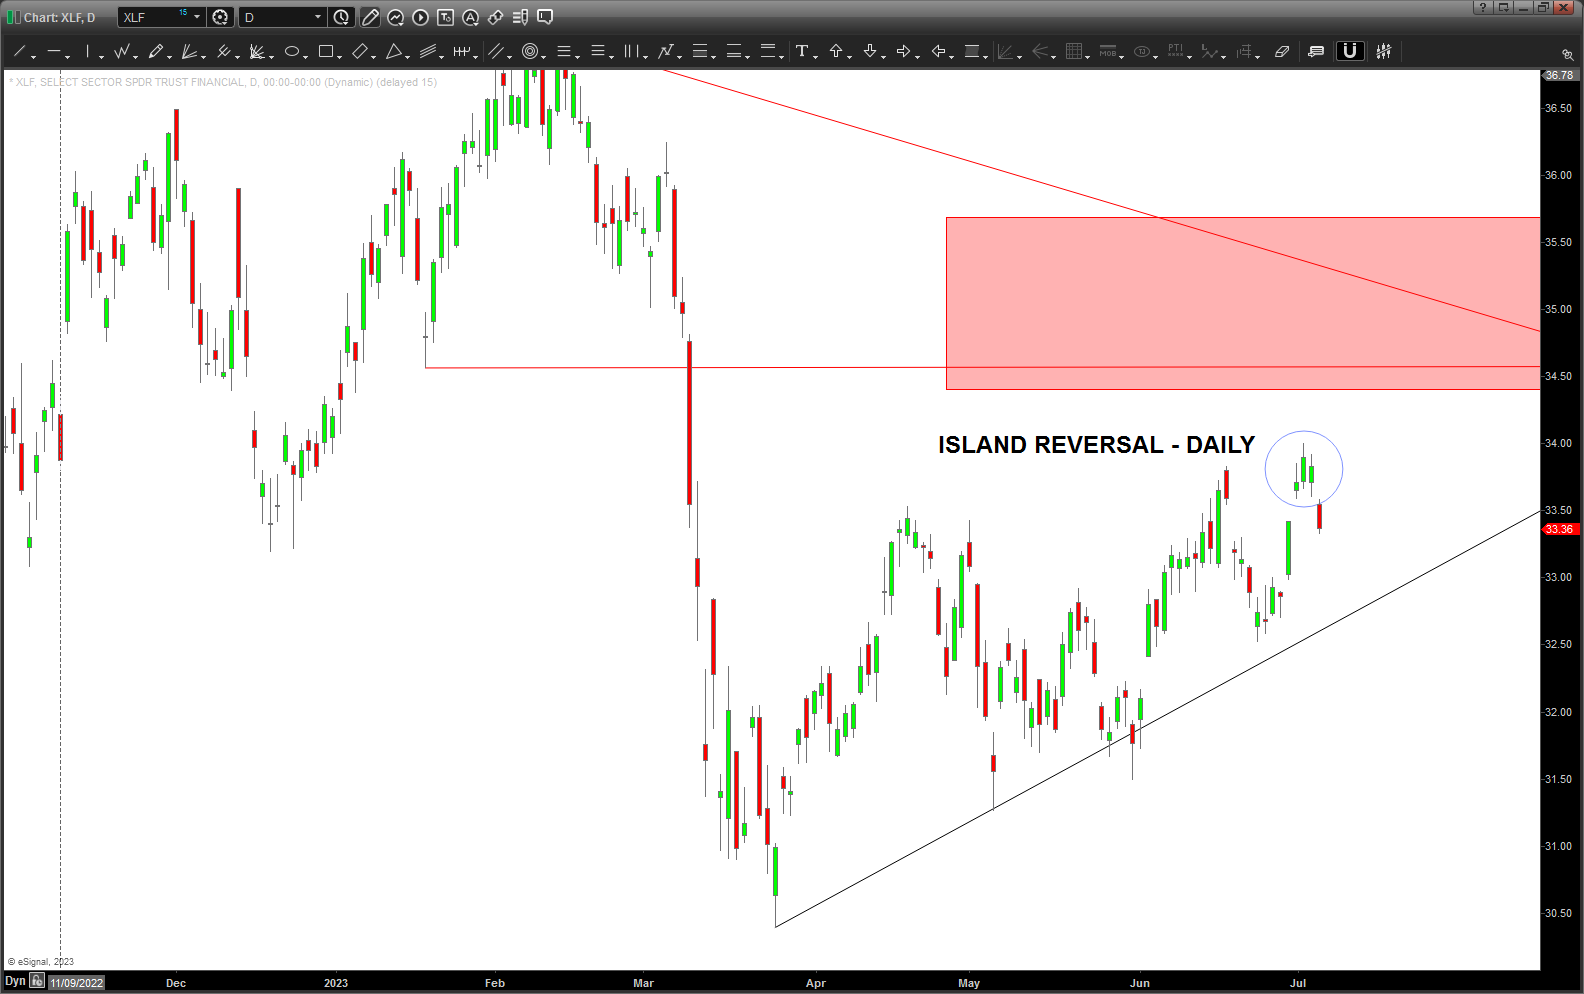
I’ve been watching the financials, junk bonds and other important stocks …depending on the closes today. Here’s some important island reversals …
WATCH THE CLOSE:
PFE – July 05, 2023
Posted on July 5, 2023 2 Comments
Last post on PFE: https://atomic-temporary-44460632.wpcomstaging.com/2021/08/04/pfe/
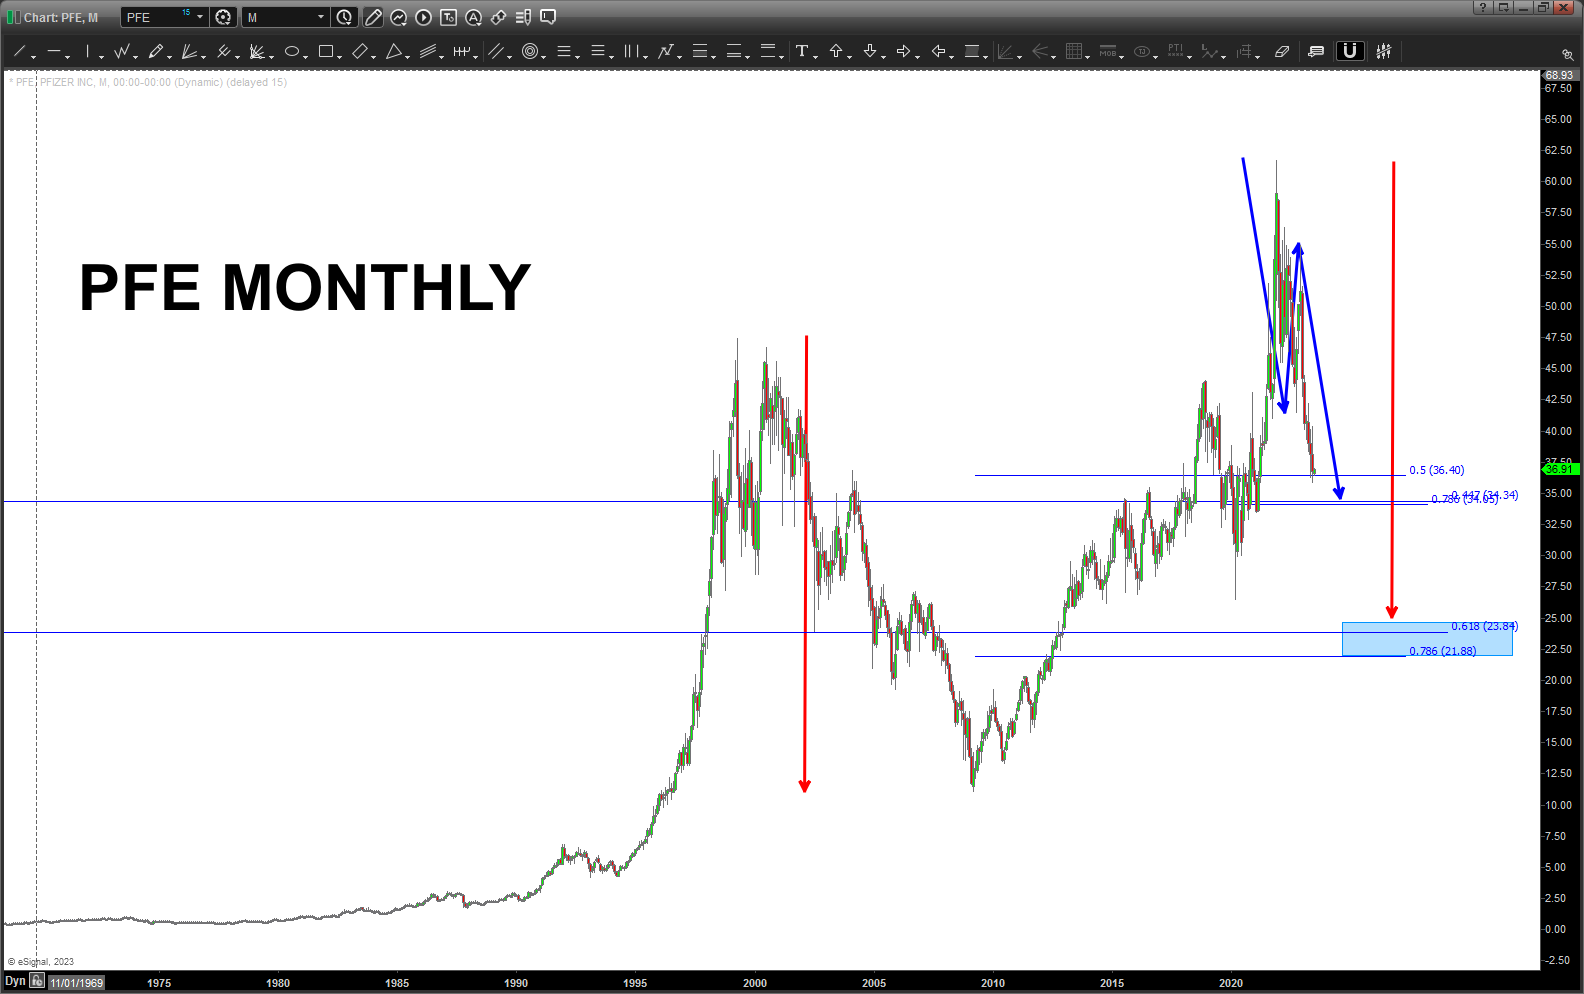
As shown above, the market took PFE up to the monthly ABCD and since then it’s been straight down for PFE.
That being said, looks like some pretty strong support for PFE in/around the 34-36 level.
If / when we lose that level, it appears the next “real” support is 21-23 zone.
NYSE Index – July 03, 2023
Posted on July 3, 2023 1 Comment
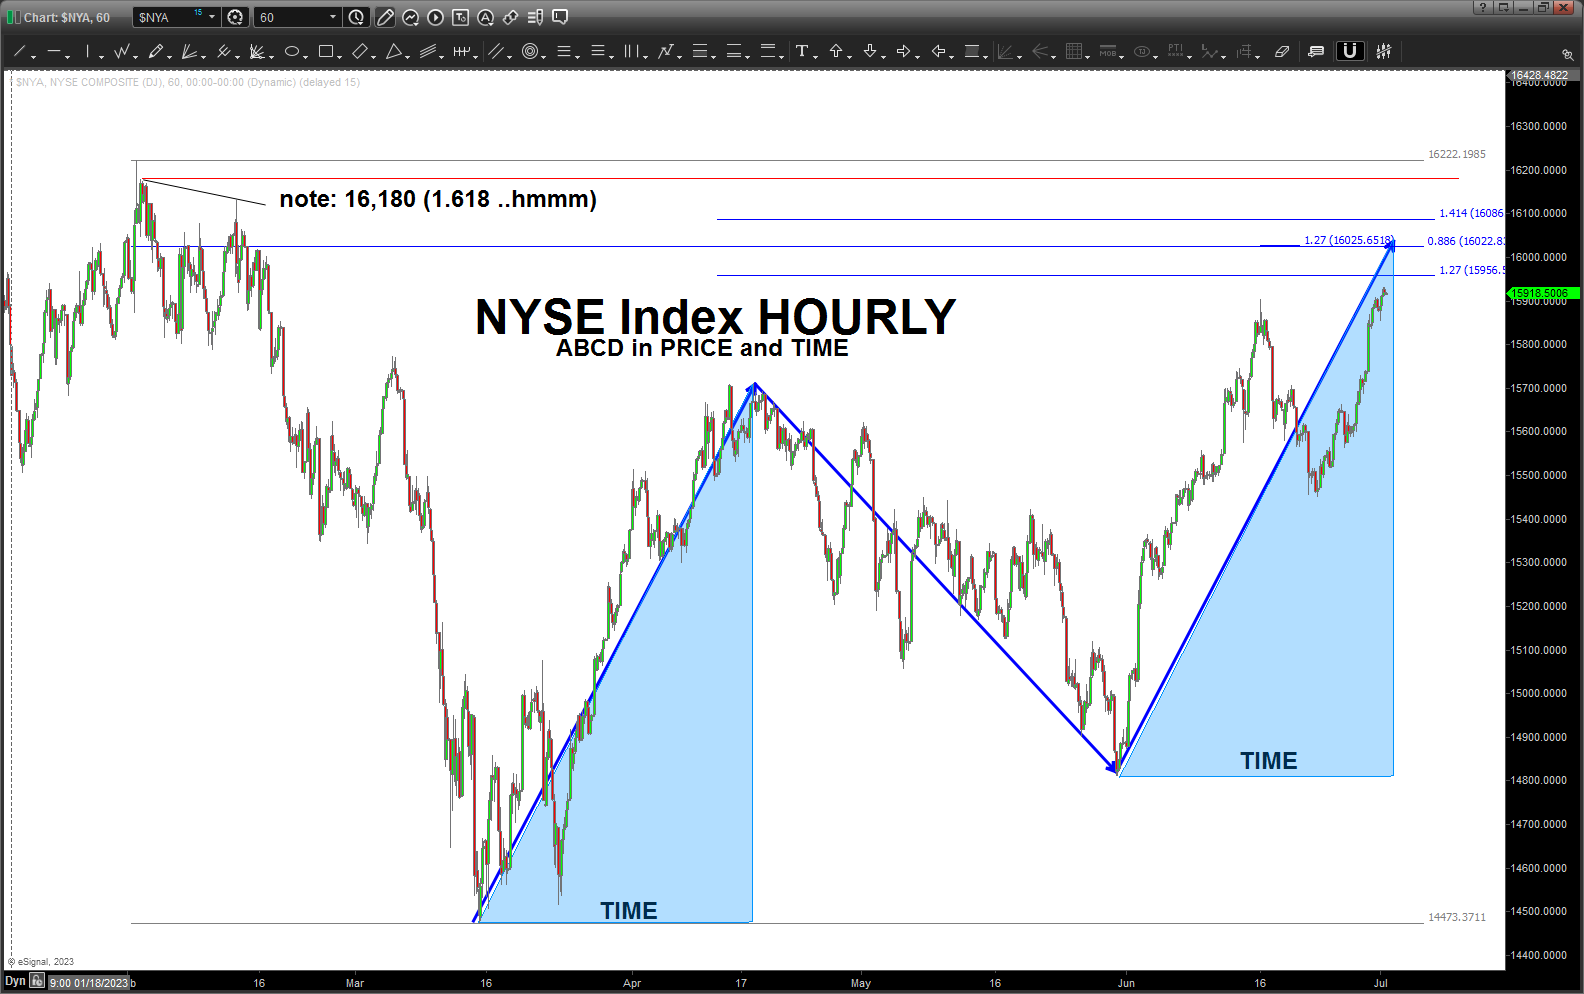
Just like the last post on the Banks ( https://atomic-temporary-44460632.wpcomstaging.com/2023/07/01/xlf-financials-july-01-2023/ ) the NYSE Index – an index composed of all the stocks traded on the NYSE (~5000 securities) – is tipping it’s hand and showing a VERY important SELL PATTERN.
In this case, we have ABCD in PRICE and TIME.
If this market is bearish, this sell pattern will work …
If this market is bullish, this sell pattern will fail and the band will play on …
The PRICE AND TIME aspect of this PATTERN make this one VERY important …
XLF – Financials – July 01, 2023
Posted on July 1, 2023 1 Comment
Trust that everyone enjoys the long weekend enjoying the Birth of our Republic.
Question, when is the last time you hear a politician refer to the United States as a Constitutional Republic?
I pledge allegiance to the flag of the United States of America and to the _______ Republic or Democracy for which it stands? We know the answer …
Anyhoo … enjoy the weekend and the amazing country that we live. Be safe out there!
Financials .. the banks lead us UP and the lead us DOWN.
I really have not idea where we are as in a BULL or BEAR market. I am probably the last dude out there thinking we have another wave down coming. I think that for one reason: the Leading Diagonal pattern. The low in October 2022 was either a 1 or an A. If it was an A, then the B wave could go up and make new highs and then a smashing C wave. Else, we are going up in a wave 2 …
How can we figure out where we are going? New highs or another move lower …?
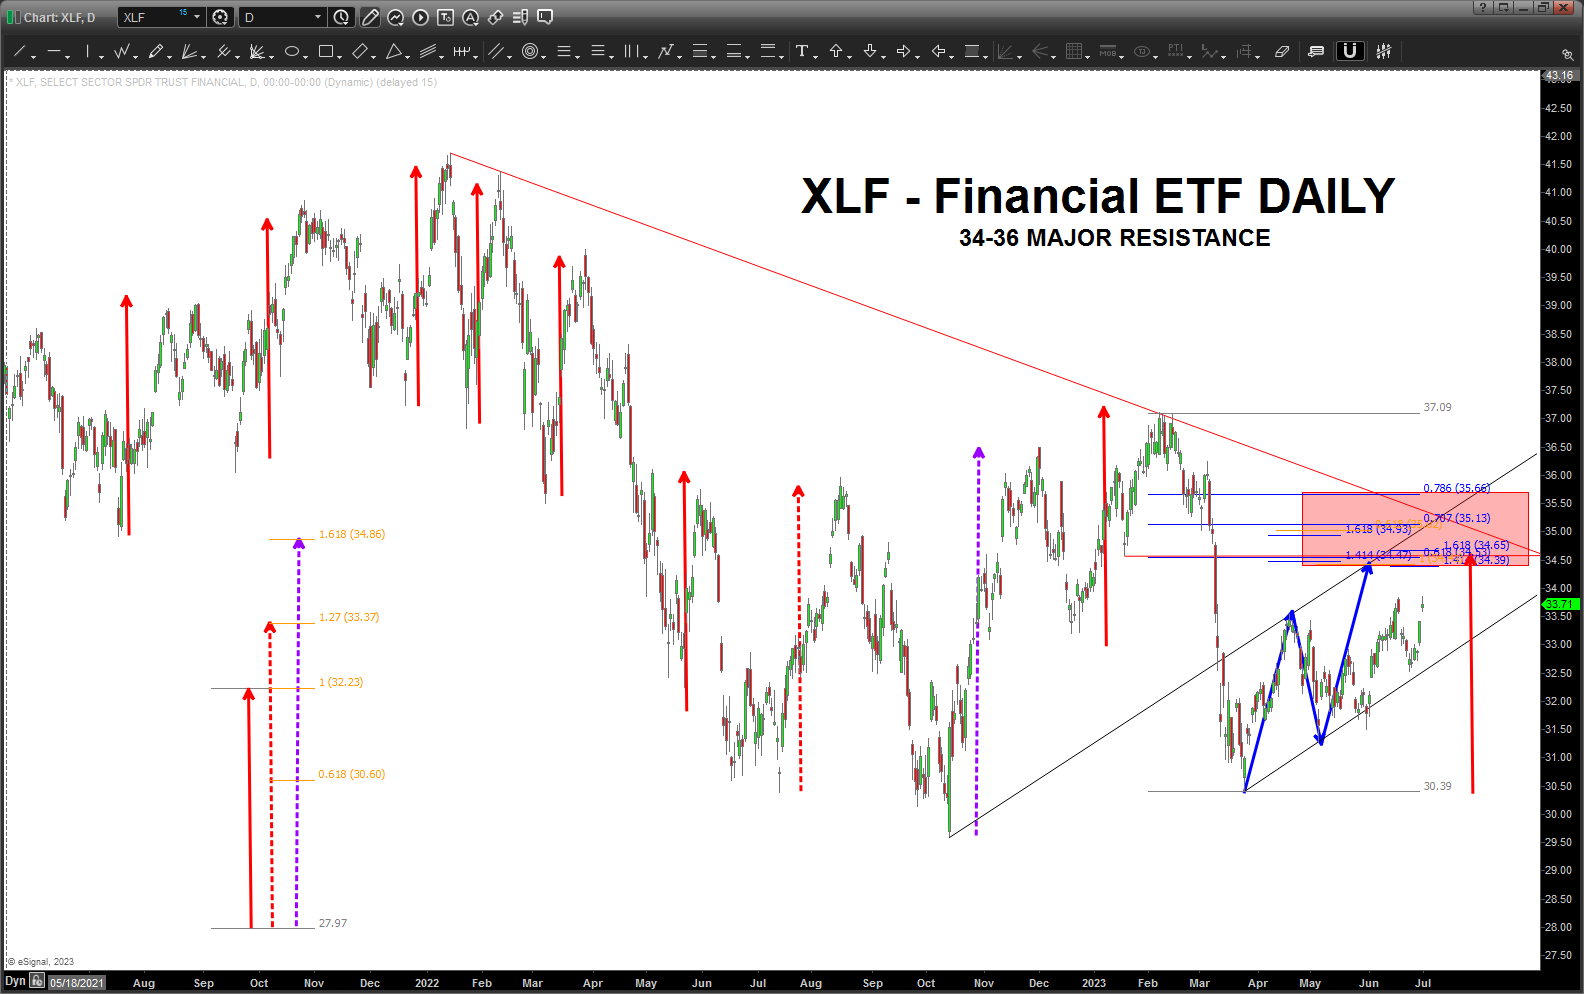
I like to use a PATTERN THAT FAILS or a PATTERN THAT WORKS and here we are .. a VERY NICE GARTLEY SELL PATTERN ON THE BANKS.
IF IT HOLDS AND WORKS AND THE BANKS START DOWN THEN … I suspect a move down will be coming.
IF IT FAILS AND THE BANKS CONTINUE TO GO UP then I think this will add fuel to the upward move.
34-35.66 on the XLF.
One last, note the measured moves …almost all of them (red arrows) are exact. Those that went a little higher were harmonic w/ 1.27 and 1.618 of the measured move.
PAY ATTENTION TO THIS LEVEL ON XLF
Ratio Analysis Time – June 28, 2023
Posted on June 28, 2023 Leave a Comment
Was over on the Top Gun options group chat working some NVDA charting and I decided to pull out some ratio analysis on the XLP and NVDA.
XLP/NVDA
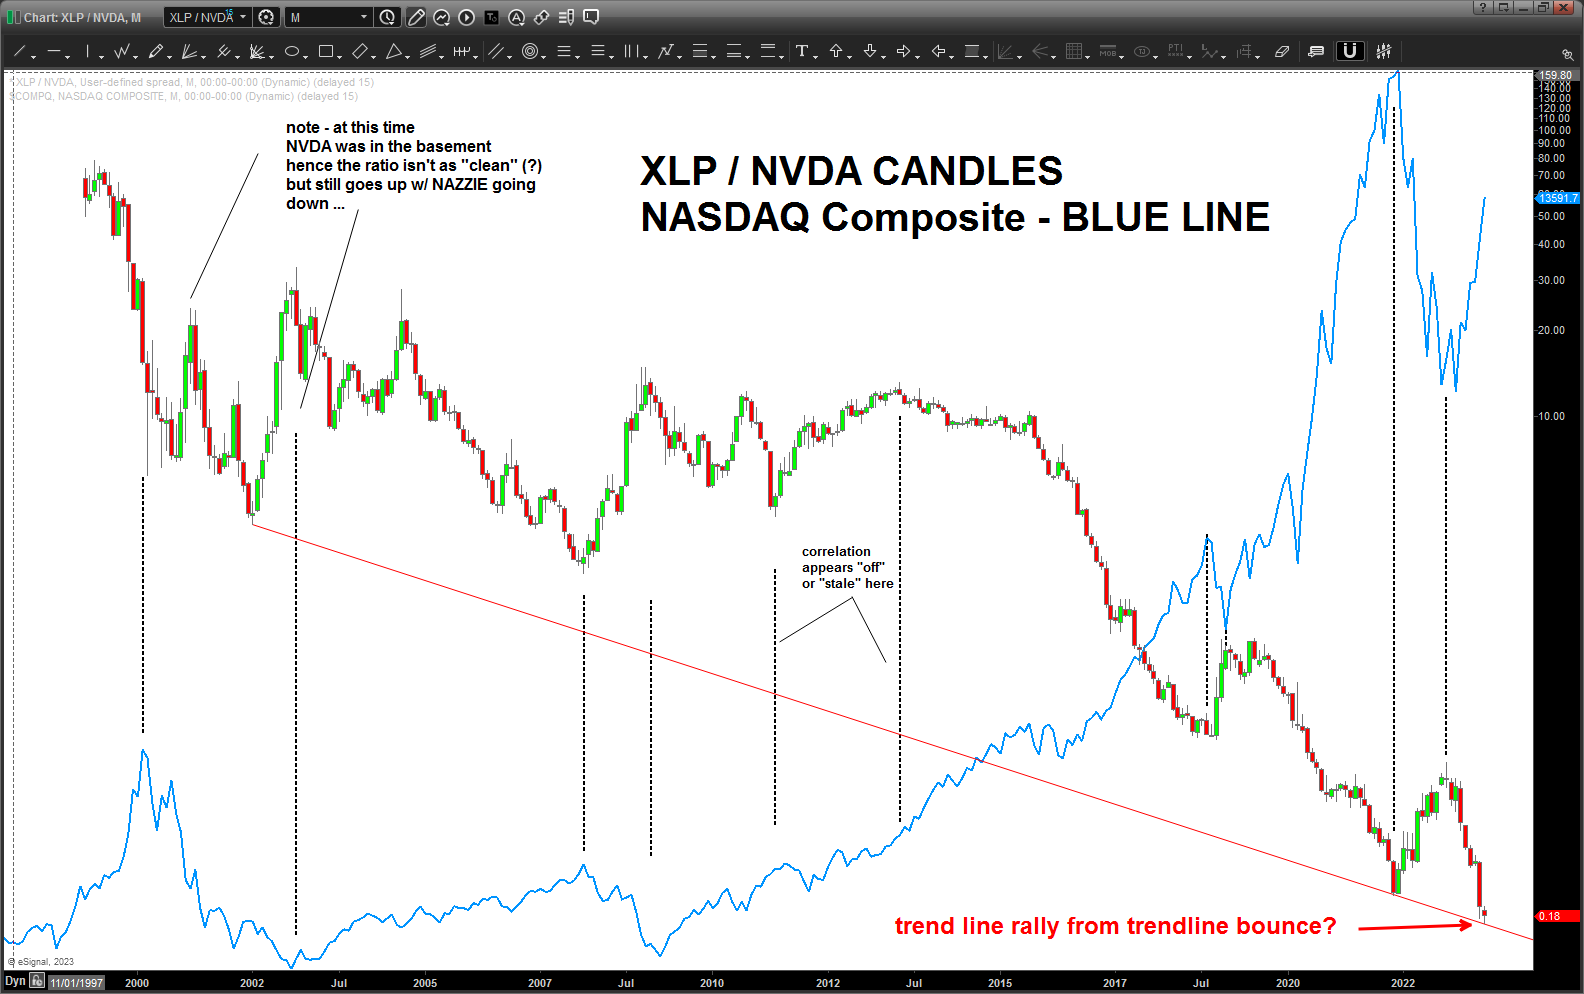
Some stuff we need to consider:
- Note the red trend line connecting the lows .. it’s a perfect fit. Certainly suggests the “ratio” is about to rise which means, in the past, some heavy weight for the NASDAQ and I imagine the overall market. Hmmmm …
- Overlaid on top of the ratio (blue line) is the NASDAQ composite … take a peak at how it reacted when the ratio rose … except for one time during the 2010-2012 timeframe, it rose and so did the market. That’s pretty much it … of late, it’s “timed” the NASDAQ pretty well.
When we add up the 20 year trend line support that sure looks like it wants to hold and the ratio starts rising – the NASDAQ hasn’t necessarily been bullish during these times now, has it?
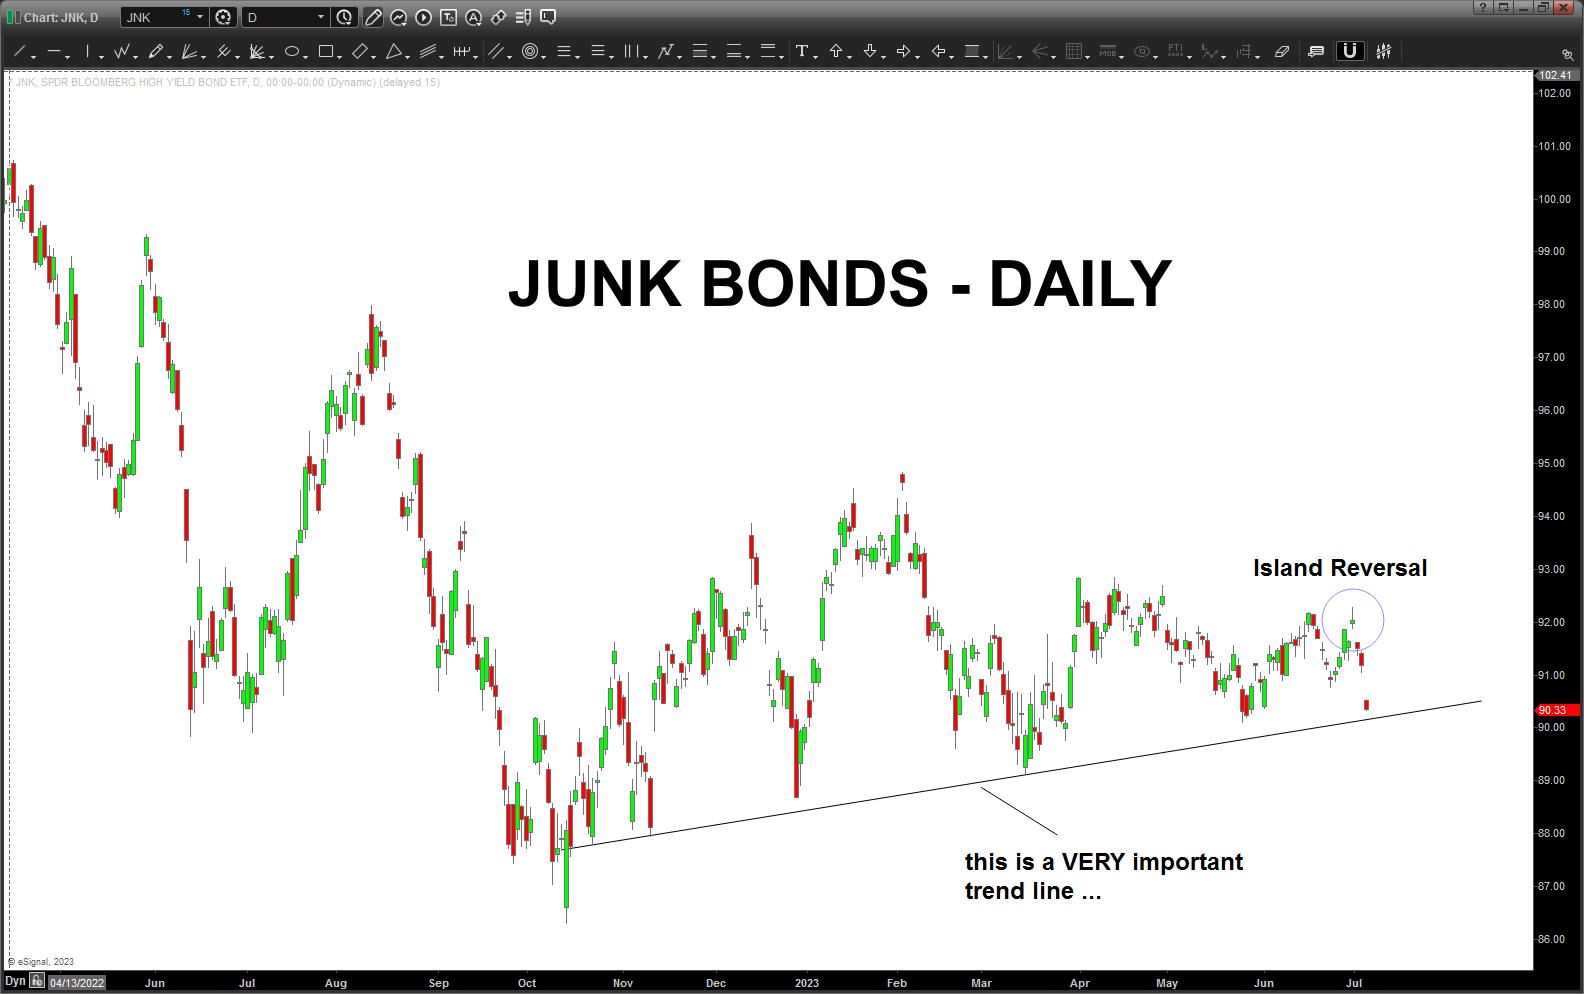
JNK Geometry – June 27, 2023
Posted on June 27, 2023 1 Comment
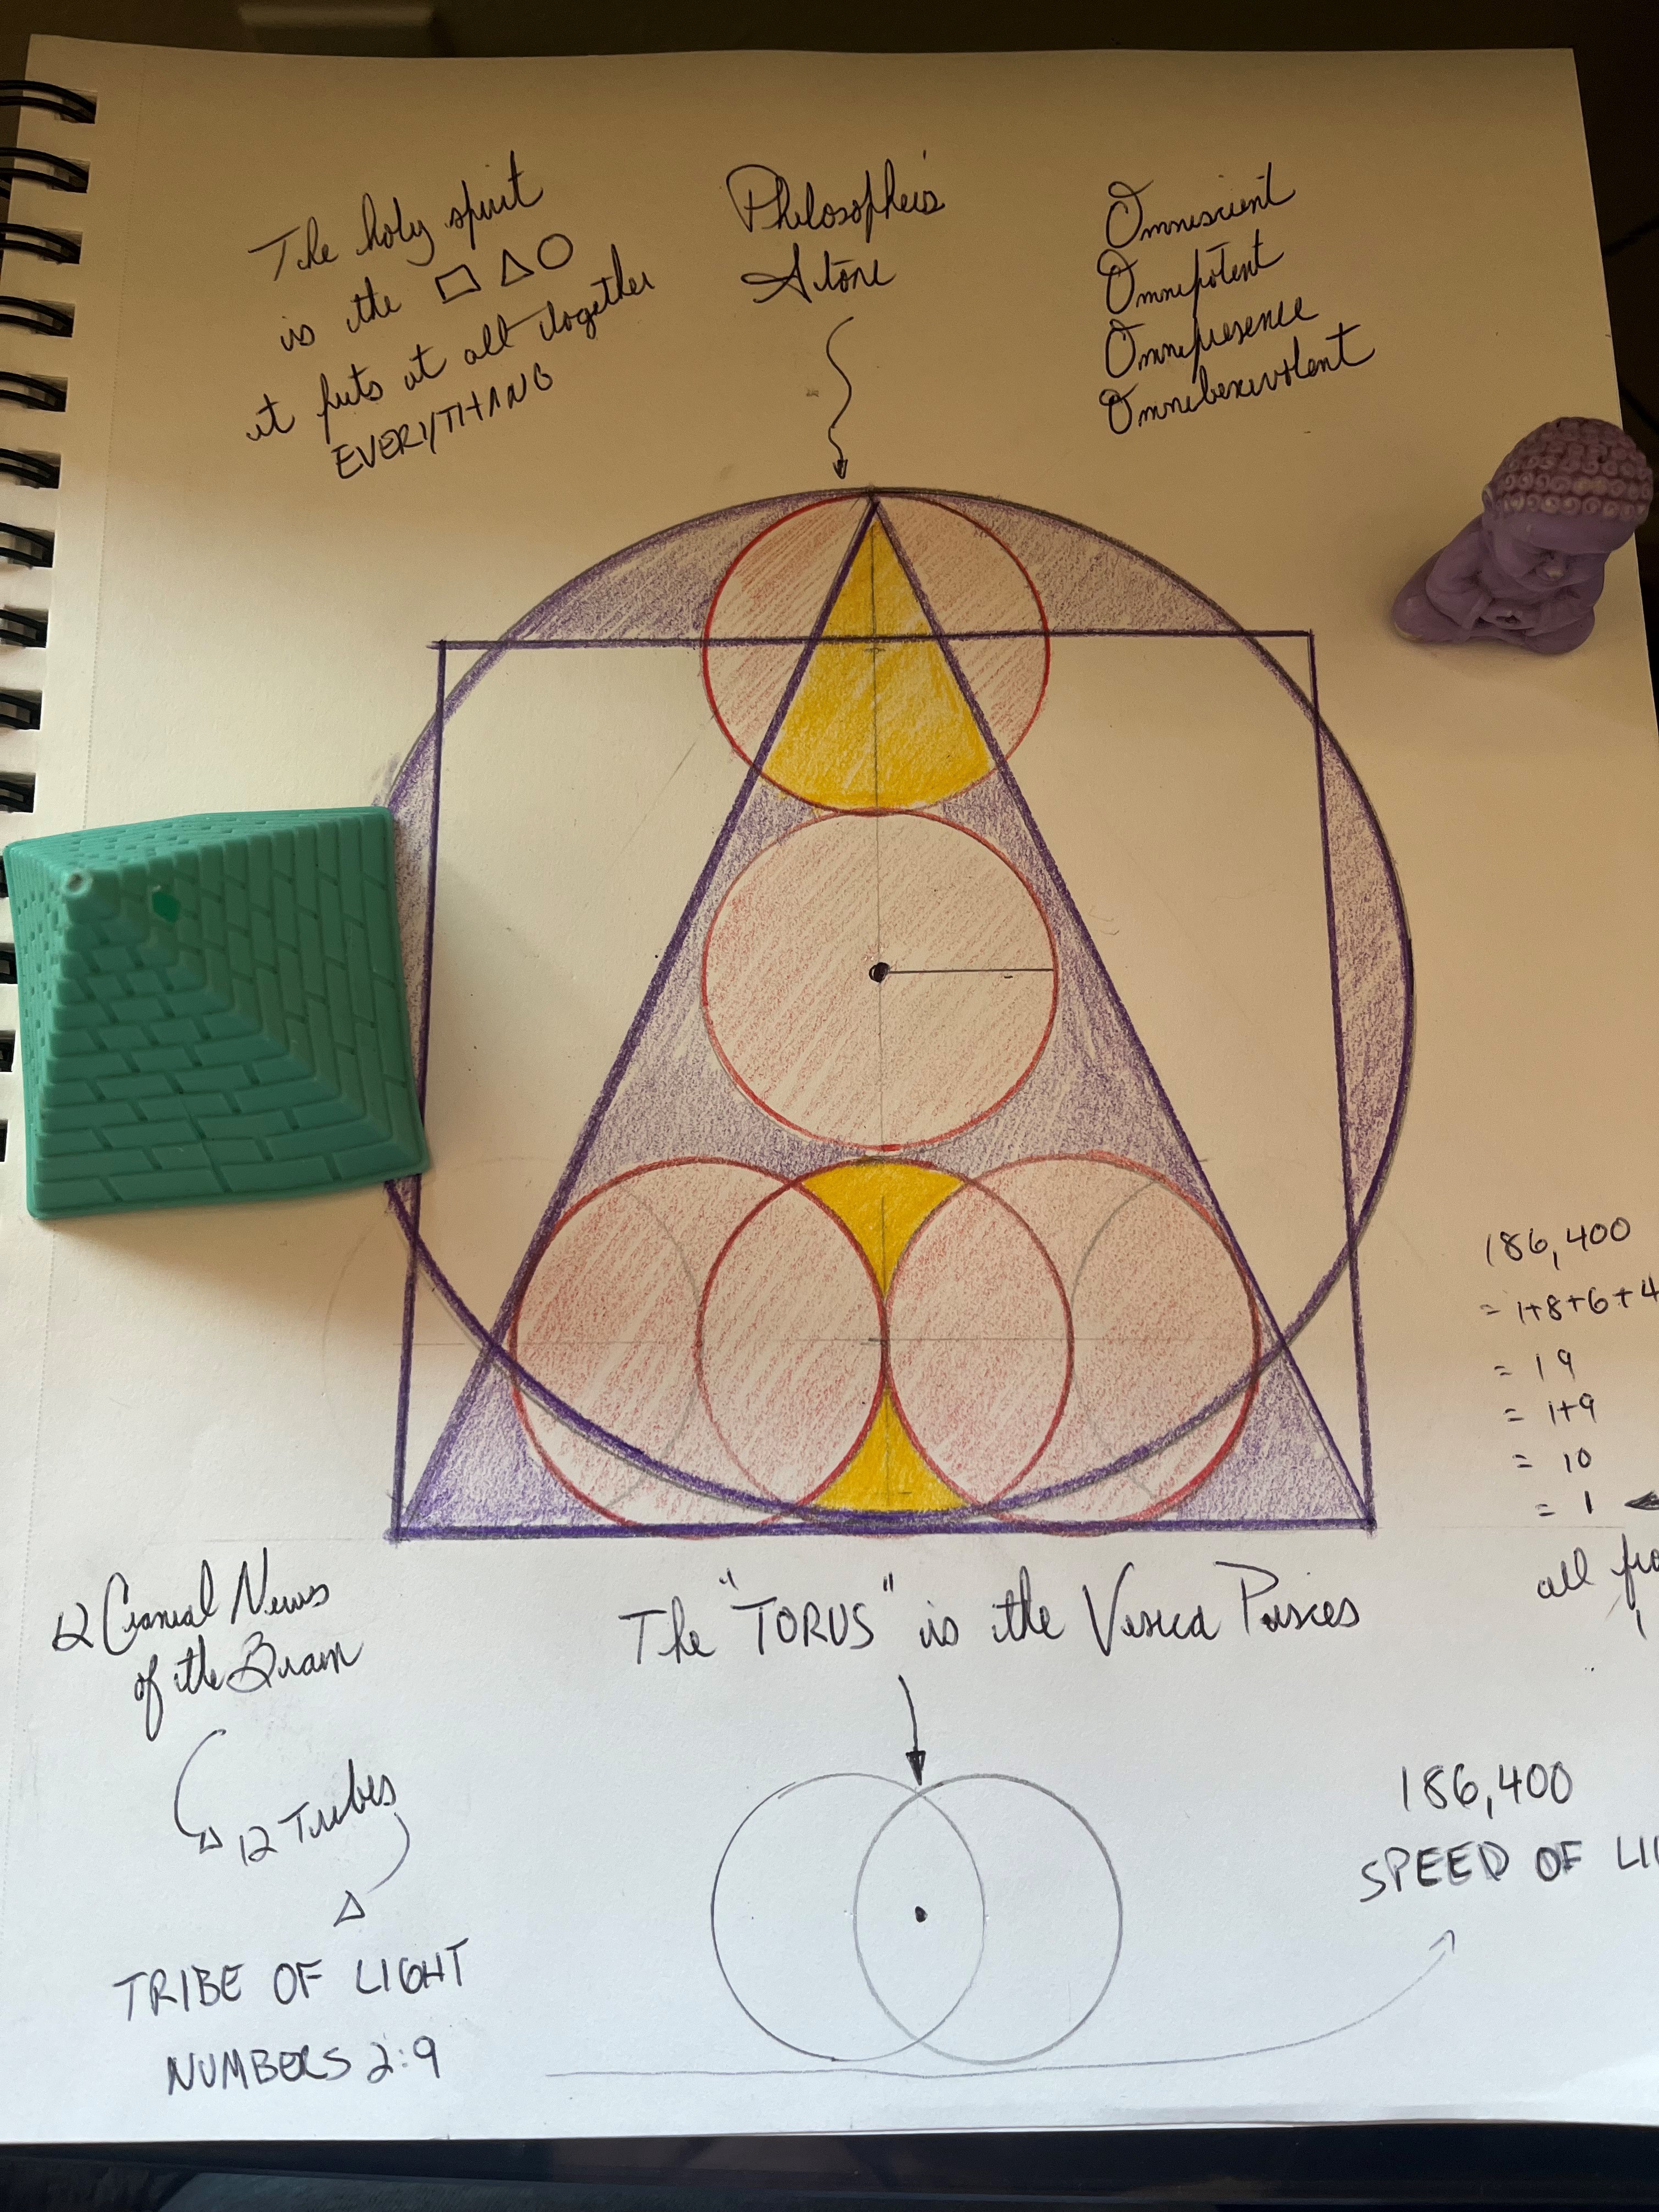
Spent some time on JNK today/tonight and tried some square outs in both calendar days and planets and blah blah blah. Even pulled out the Pythagorean ABC^2. To no avail .. then, I thought I’m “curve fitting it” so I just started to do some geometry.
I’ve been sketching before I meditate based on Robert Edward Grants recommendation .. it’s pretty trippy. As you square the circle and then step back and throw some flower of life on top and then, what the heck, throw Metatrons Cube into the mix and … well … you start to see creation in an amazingly beautiful way. The perfect – form, balance and proportion.
So, using the dark blue arrow and the orange arrow near the bottom – that’s it – we were able to create a time cycle … that was from the Vesica Pisces. Then, we were able to create the “past trend channel.” I didn’t work from left to right .. I went from the Orange Radius, the Orange Circle and then created the first triangle that is too the far right. And, that’s when the trend lines/boxes were created working back up right to left. And, I’ll be darn … it WAS THE TREND CHANNEL and just follow the market in the trendlines that were created from simple squares … amazing.
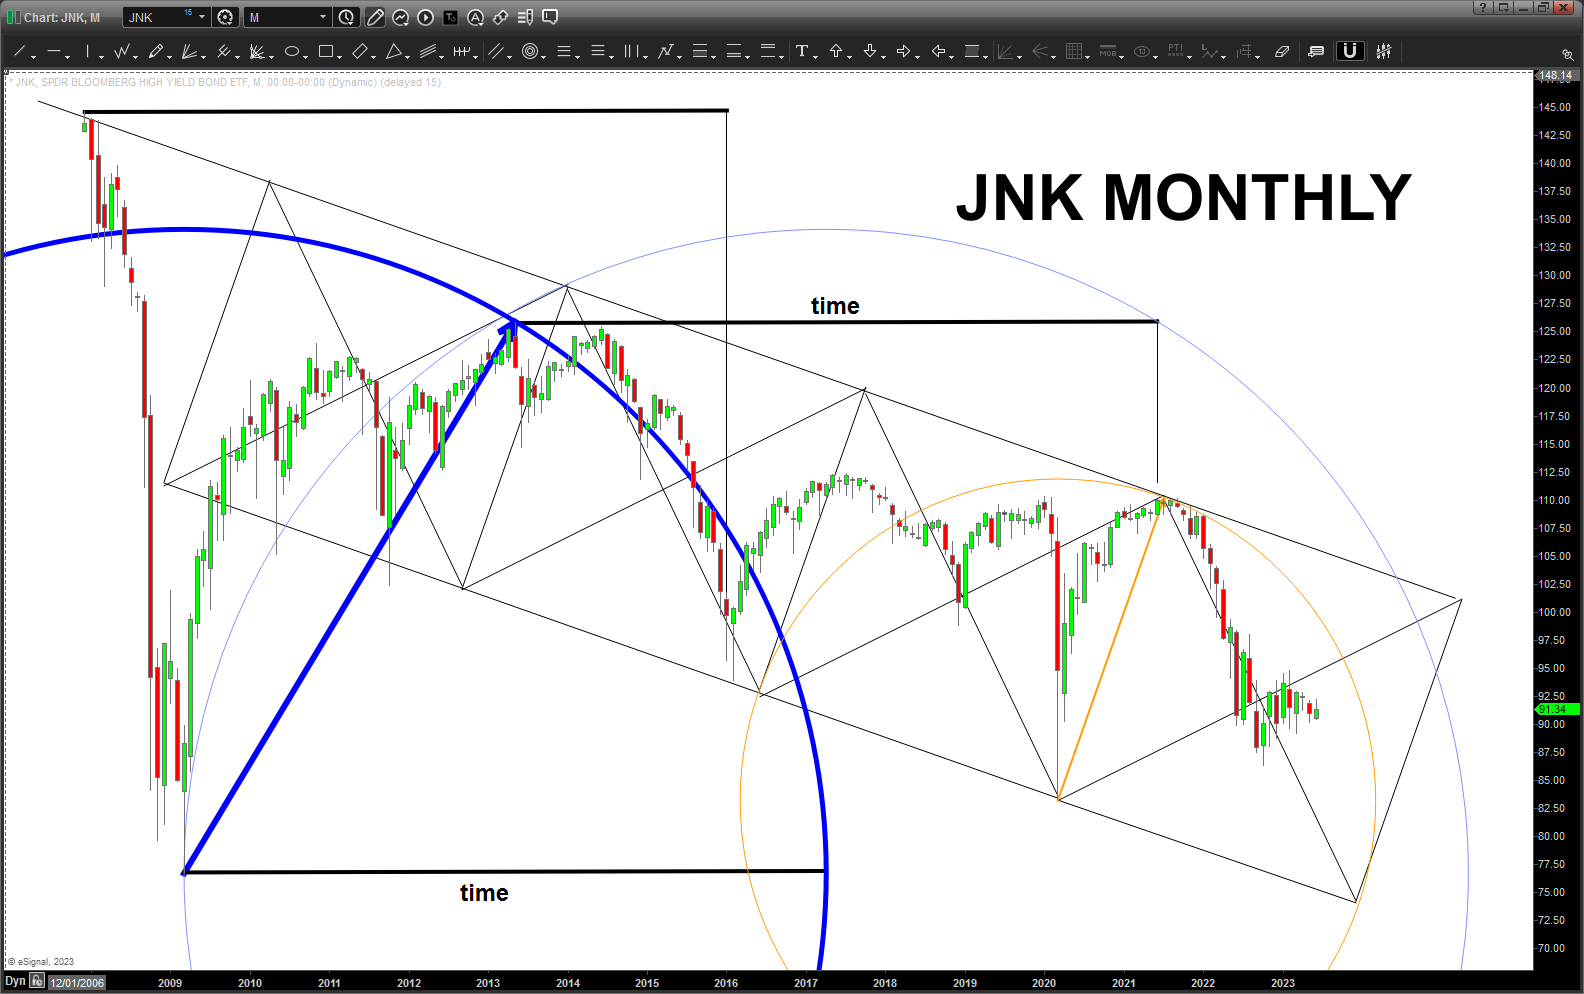
Why is this important?
As I’ve blogged before – we can make a comparison to JNK BONDS GOING UP UP UP to “risk on” and JNK BONDS GOING DOWN TO “risk off” and the risk is minimized by the institutions. I monitor them … they are very important.
So, here’s the daily (artistry removed 🙂 )
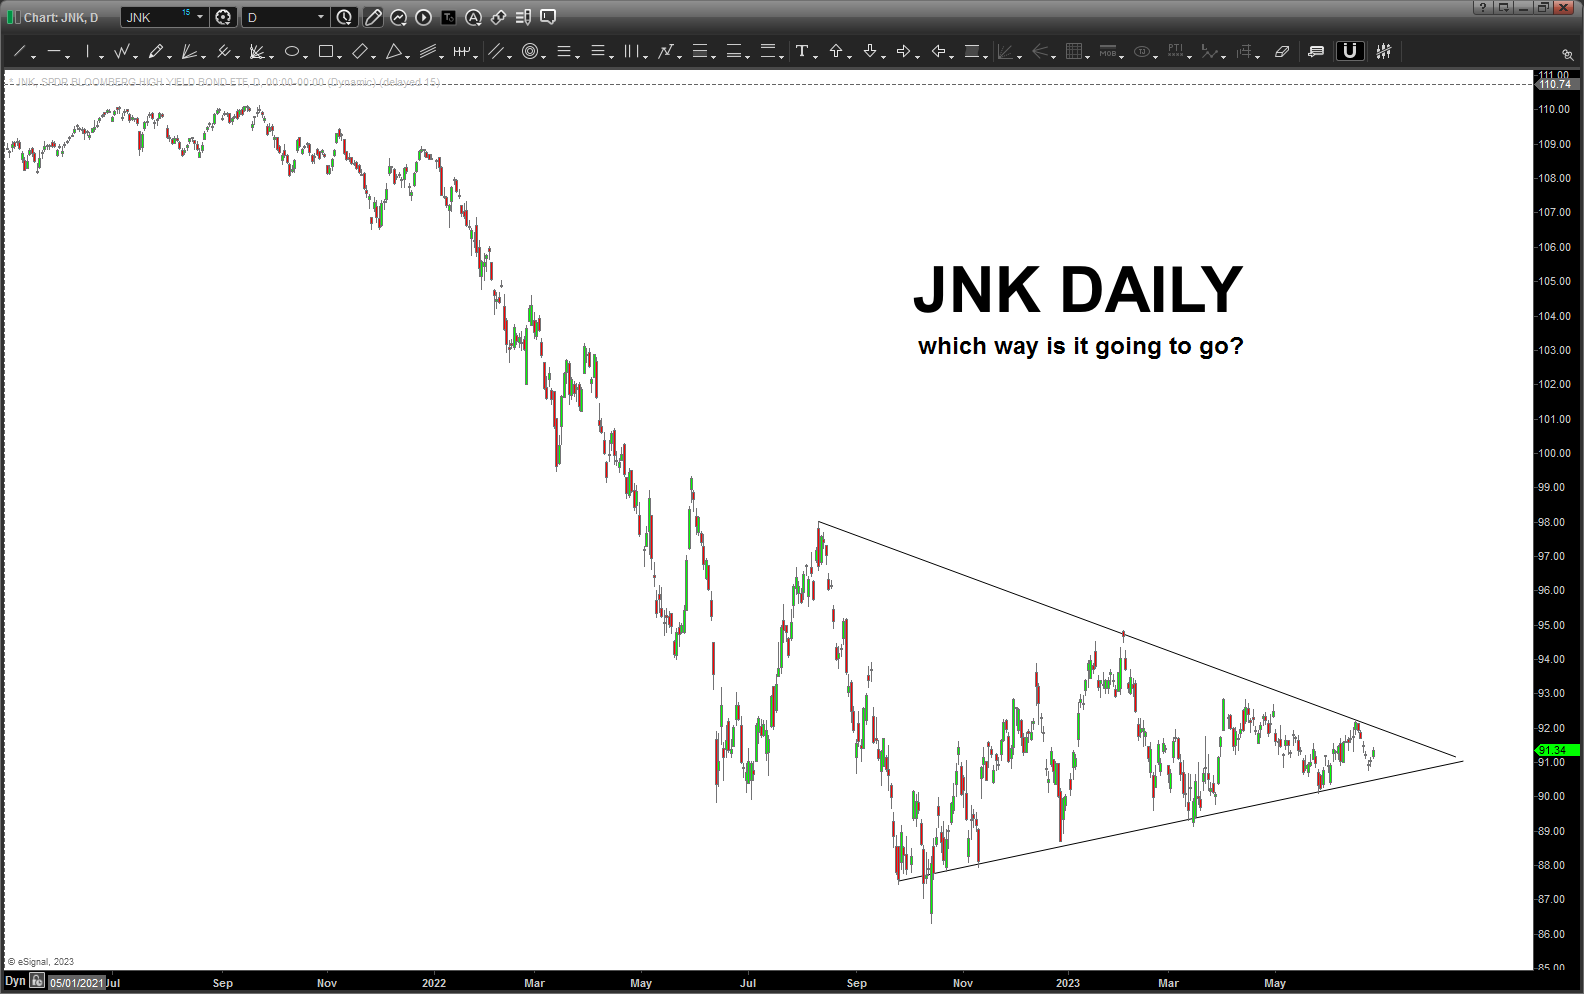
it’s showing a pretty important set of trend lines …for sure. but, as I state on the chart, which way is it going to blow?
now, interestingly, take a peak of JNK w/ the S&P 500 overlaid on top of it:
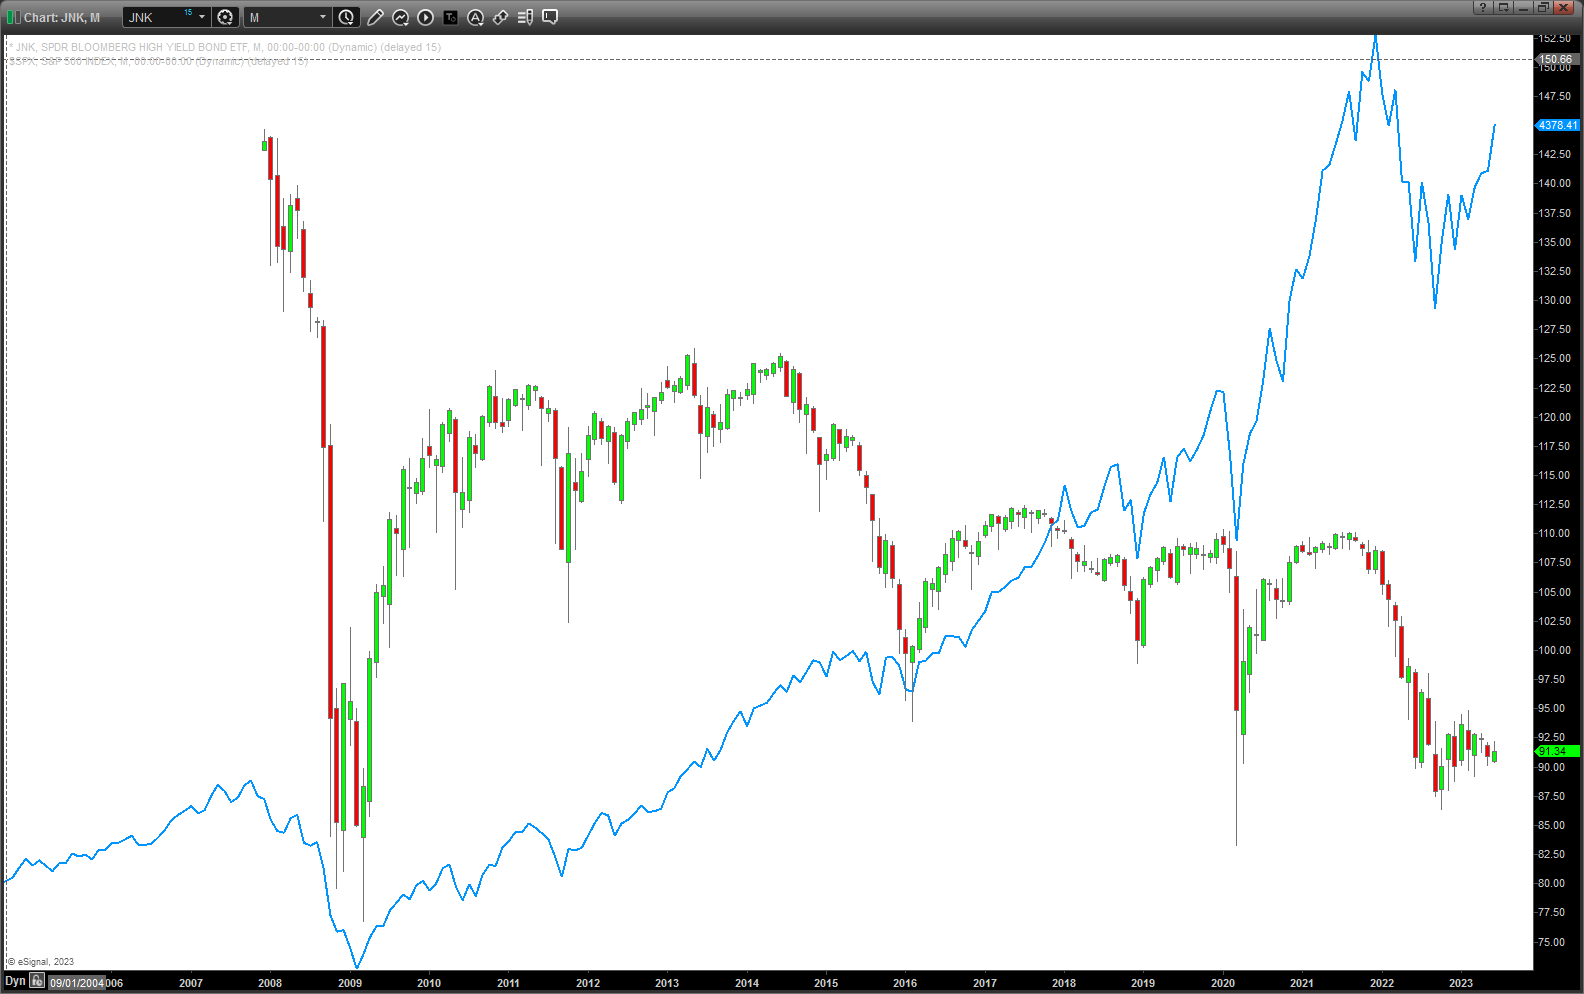
not immediately obvious .. but if you look at times when junk bonds were topping you would see some resistance or bumps and the market could continue higher, the junk bonds would kind of stall and shuck and jive BUT when they sold off, the market was soon thereafter.
So … what I don’t like is that the JNK bonds have not rallied like the others times and, in fact, “most” of the time, when they rallied there was a big monthly “spike” or “wick” from a candlestick perspective. Seriously, I think this is an important point. If we take at look at the first low on the chart to the far left you will see multiple monthly candles leaving a wick/spike before pretty strong rallies .. now just work left to right as we see the monthly wicks that resulted in a rally for the Junk Bonds .. allowing the market to relentlessly drive higher. But, this time … just saying .. where is the wick? where is the rally? if we take a look at how ALL the rallies started you will see the wick present and the subsequent rally. Not this time.
Certainly looks like JNK BONDS should get going pretty quickly to keep the party rolling. Else, we break that daily neckline I think it’s going to hard pressed to be long equities.
So, just keep watching that daily trendline convergence on JNK bond if you want an “outside the squawk box” objective look at the health of the market.
PS – Technical Analysis 101. This chart has lower highs and until this last “bounce” it had lower lows since 2010.
PUNCH LINE: does the S&P 500 have enough gas in its tank to explode higher and bring it’s pal, the JNK BONDS, with em’? Or, do they both look like it’s been a great run and they are just going to roll over and go blehhhhhh ….
I think we’ll know, pretty soon.
THEN RIDE THE WAVE!!!!!
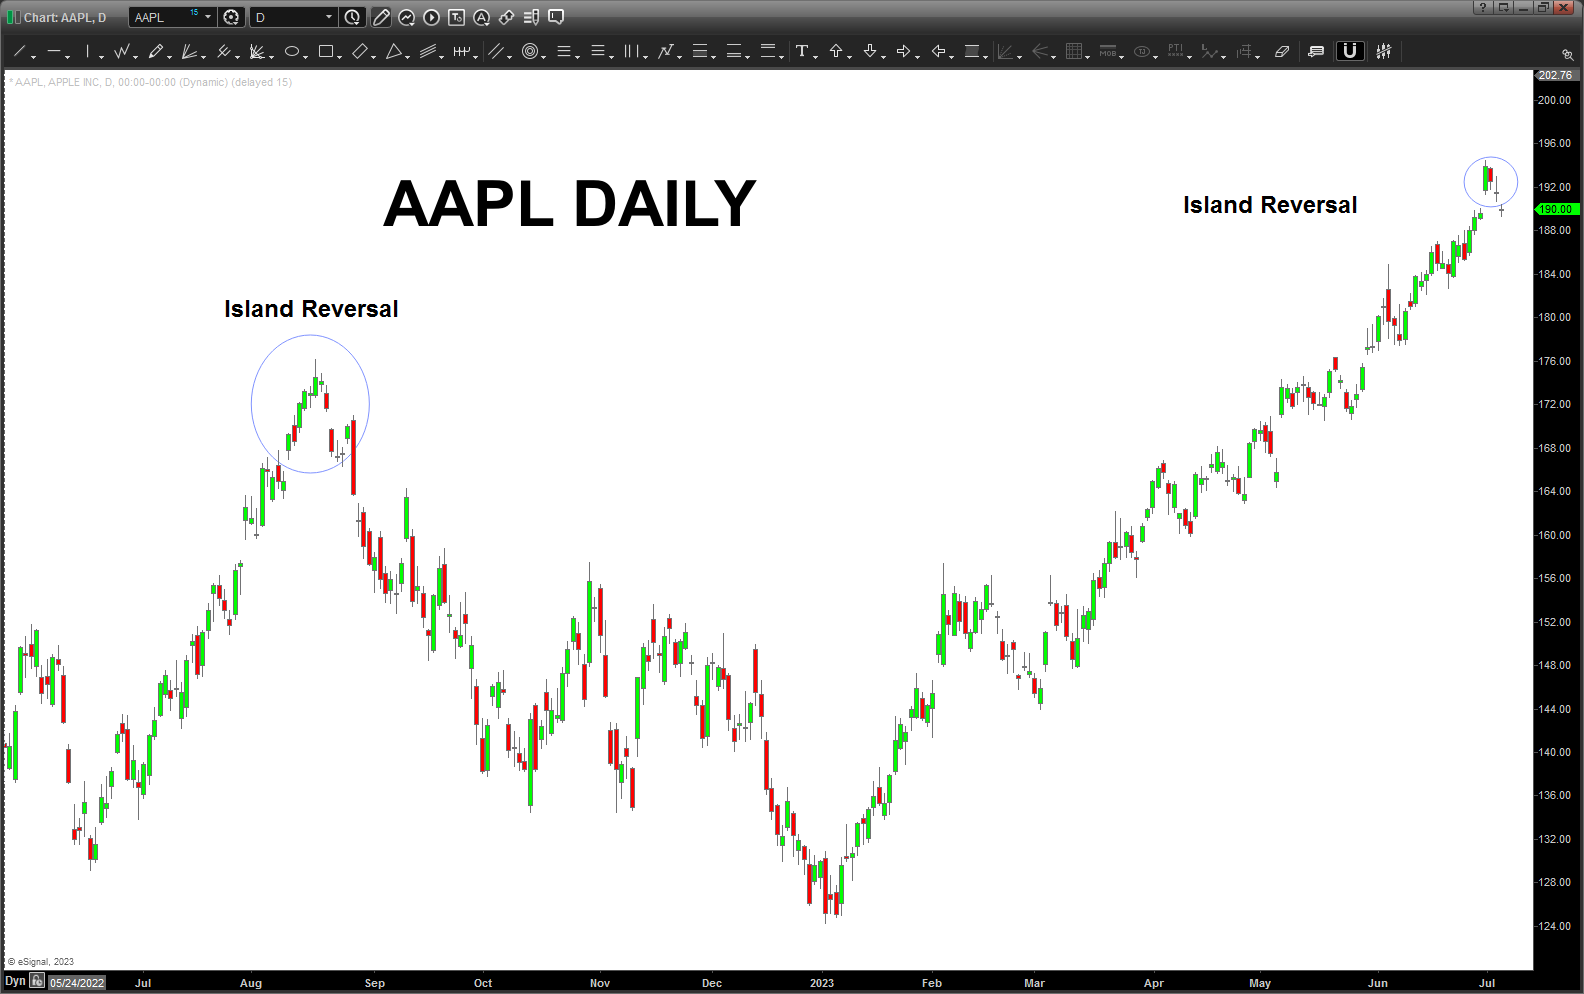
AAPL – June 27, 2023
Posted on June 27, 2023 5 Comments
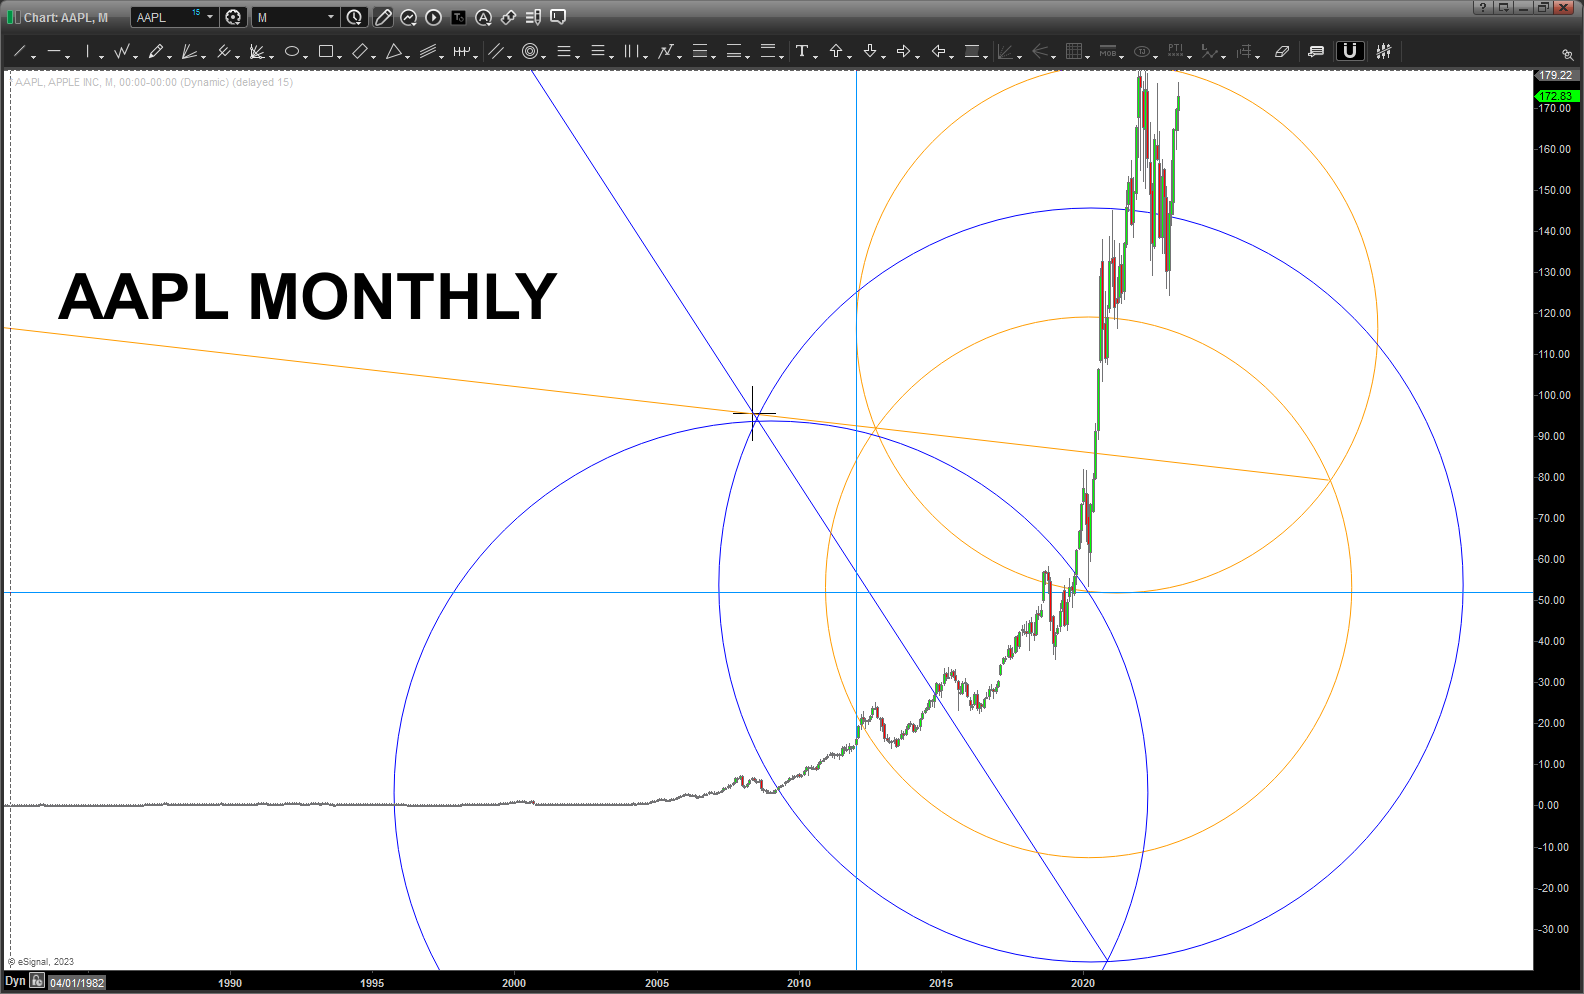
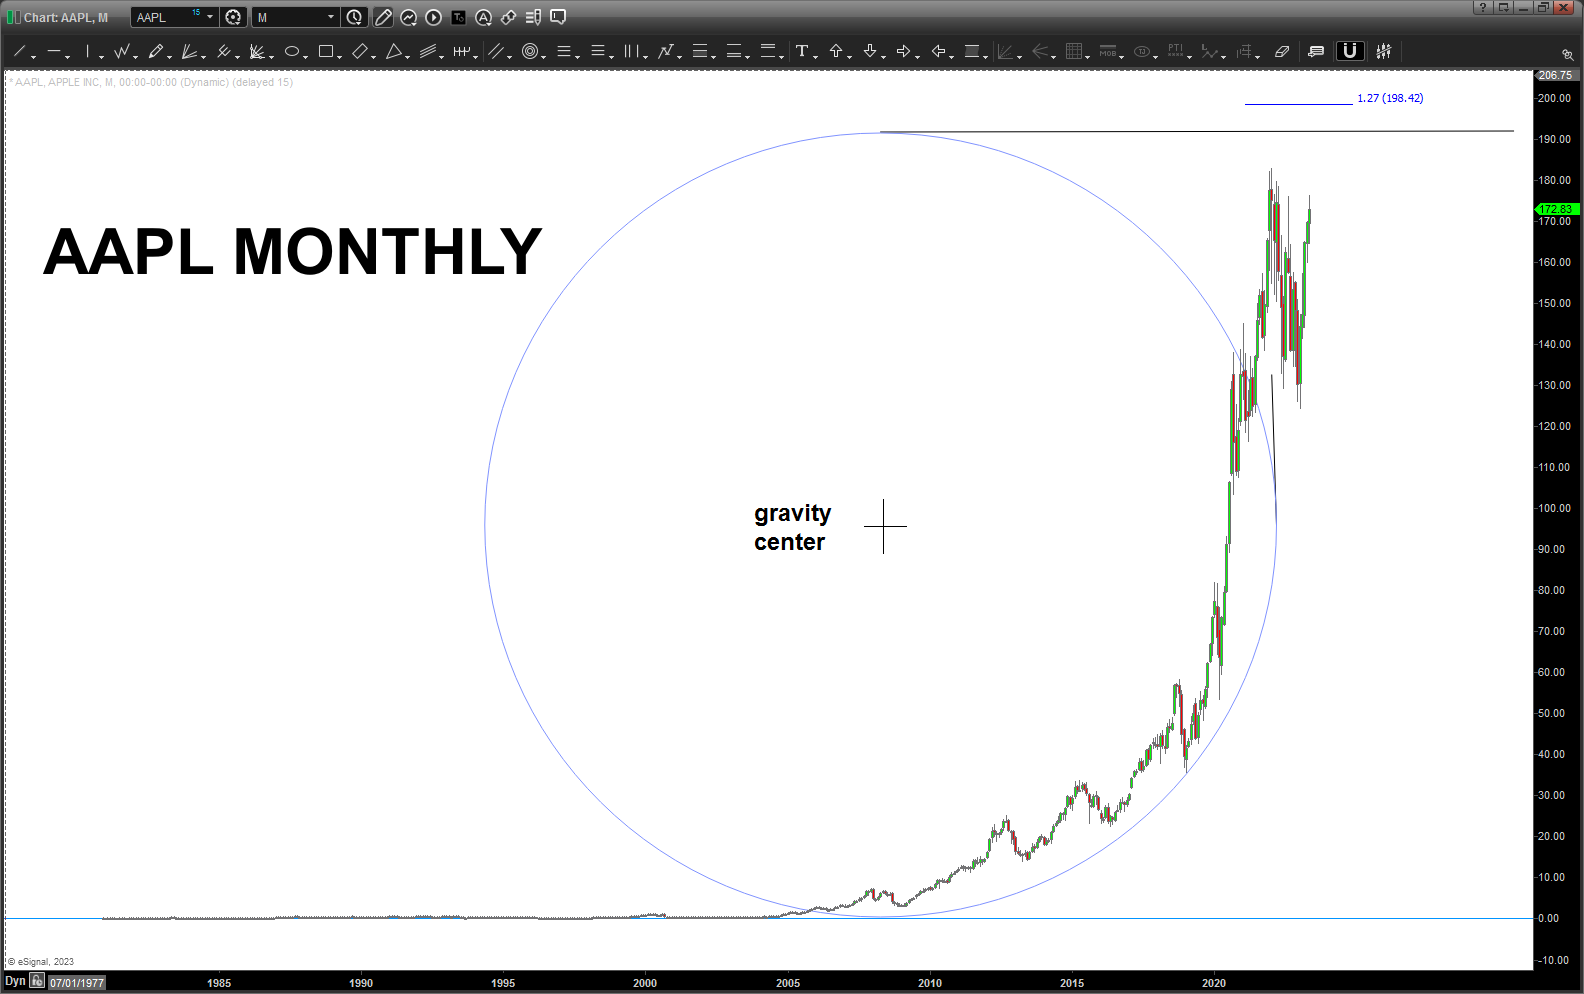
Been holding onto these AAPL charts for a while until they approached the level. This certainly looks like a freight train for higher BUT you know, nothing like the top of a circle to pause / stop it in its tracks.
I will not be shorting AAPL at this level but will find it interesting to see if this stops this freight train. If/when it blows thru the top of the circle, the 1.27 extensions looms …
Some fun waves this AM … that’s really all that is important. 🙂
Crude Harmony – June 20, 2023
Posted on June 20, 2023 6 Comments
Finished – somewhat – moving into the new rental out here in San Diego. (I REFUSE TO BUY OUT HERE) … little bit brain dead but “something” told me to take a look at crude oil futures and that bizarre low of -40 bucks. Could that low be harmonic?
Of course not .. well, shoot, it was:
So .. what the heck are we looking at:
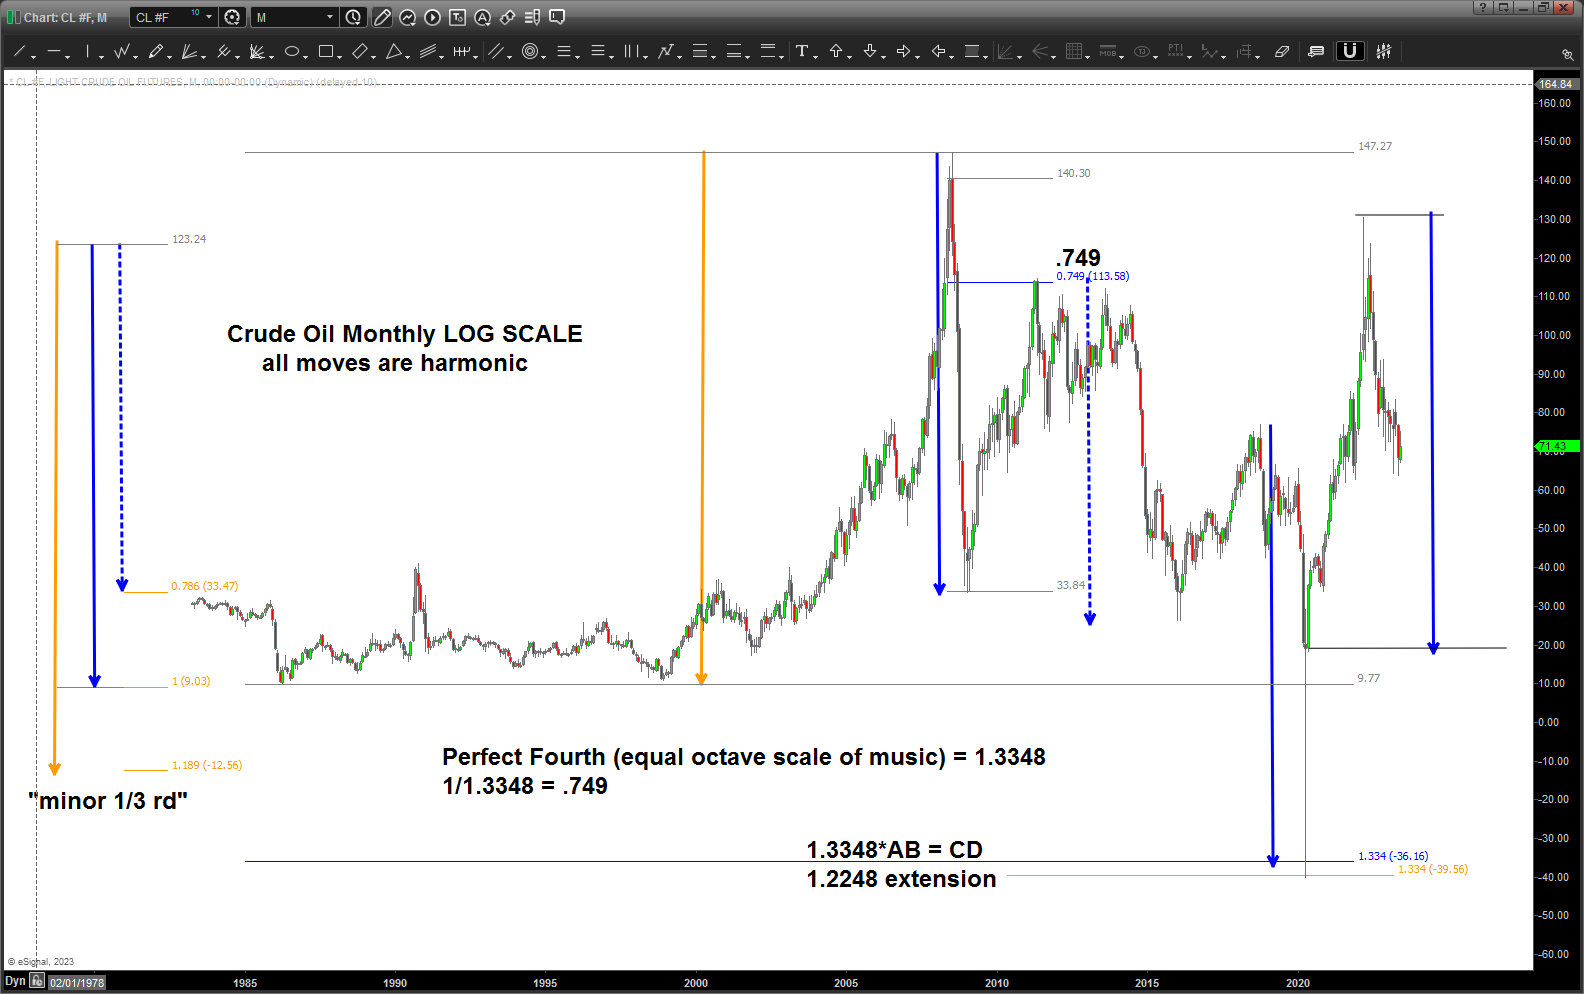
- Crude Oil Monthly – LOG (key, these are percentage moves) since 1984. Couldn’t get anymore data that that.
- The 1.3348 is a ratio (Perfect 4th) for the equal octave scale of music.
- 1.3348AB = CD and the extension from the “old” all time low was, yes, 1.3348.
- A good technique to use is to look at the last MAJOR retracement and see what that number was … in this case .749. TILT … well take 1/1.3348 and we get .749. The market did, in fact, give us a clue. Pretty wild …
- The dashed blue move down? .786 the blue measured move …
- The move up to the old all time high? 1.1892 which is the ratio for the “minor 3rd”
- Last, and this was the “kicker” for me … using the open/close after the negative spike low … the high at 130 was exactly equal to that measured move. Nice …
Anyway, just bored so thought I would cruise the charts.
I’m looking to get long Crude OBTW …
Bart
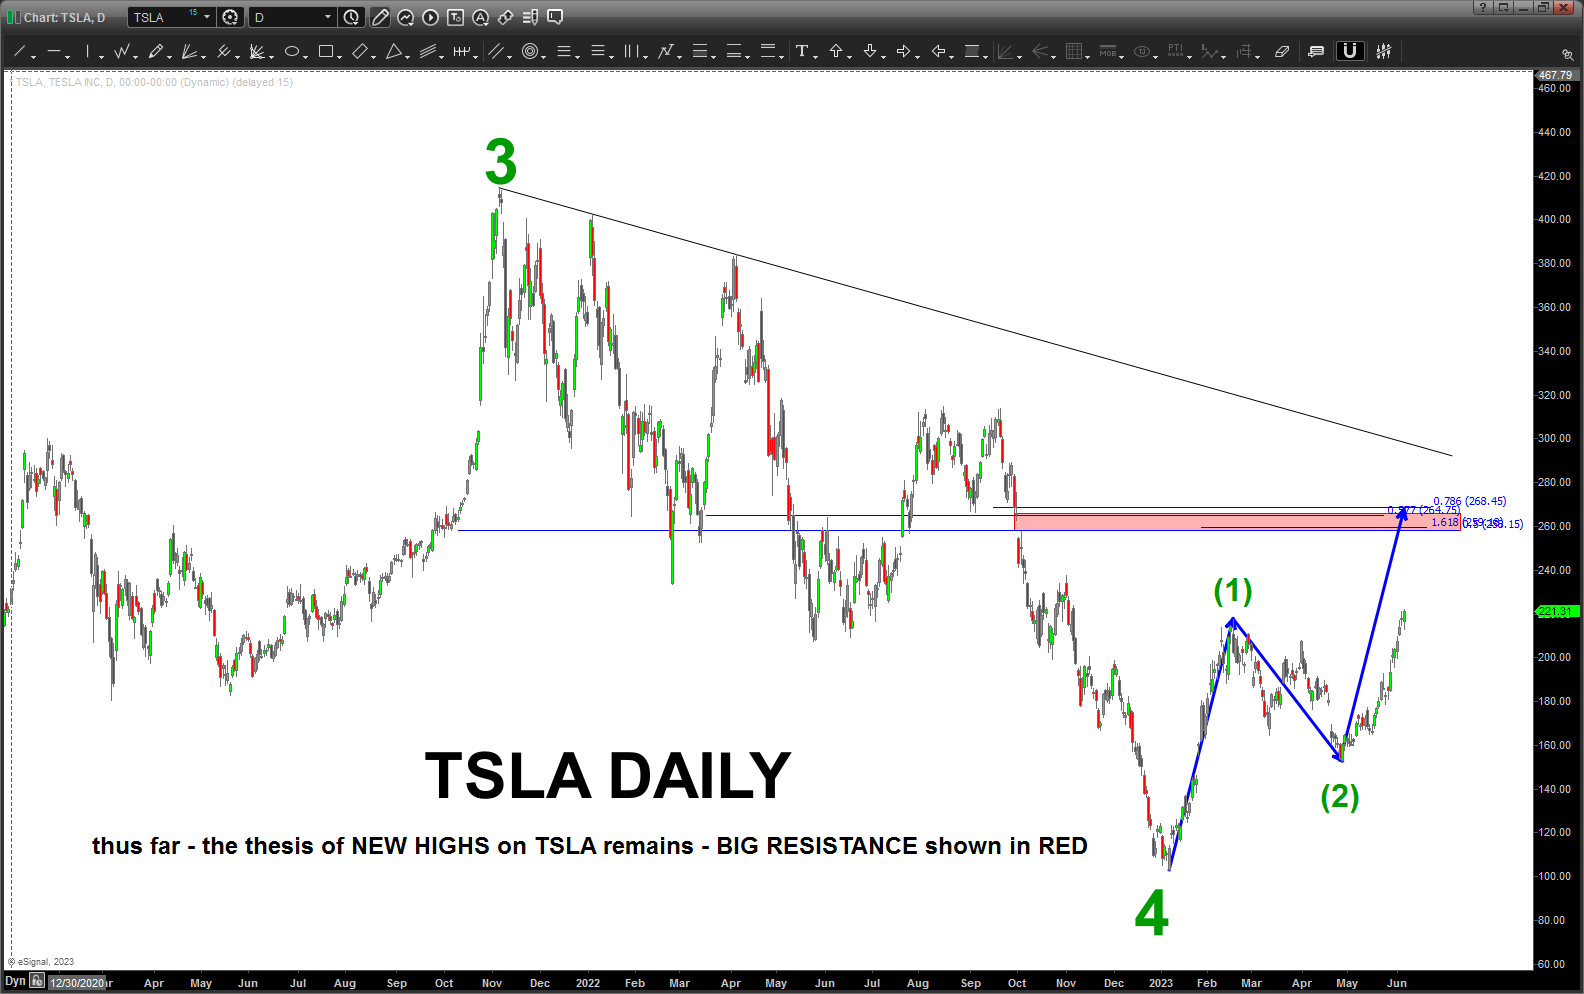
TSLA – June 07, 2023
Posted on June 7, 2023 1 Comment
January 2023 low:
April 27, 2023 low:
- https://atomic-temporary-44460632.wpcomstaging.com/2023/04/27/tsla-april-27-2023/
- https://atomic-temporary-44460632.wpcomstaging.com/2023/04/05/tsla-update-april-5-2023/
- https://atomic-temporary-44460632.wpcomstaging.com/2023/03/08/tsla-update-march-08-2023/
As we have discussed on this blog – I don’t track nor do I know ANYTHING about the fundamentals driving the EV market. I probably should as I have my hands in a “data norming” technology that is using Unreal Engine 5 to create the “EV Metaverse” but, other than I really don’t.
That being said – the thesis – TSLA IS GOING TO NEW HIGHS remains intact.
What will stop it .. MAJOR RESISTANCE 257-268.
Other than that .. IF (the big IF) TSLA respects that level and pulls back THEN we need to think of adding and getting long.