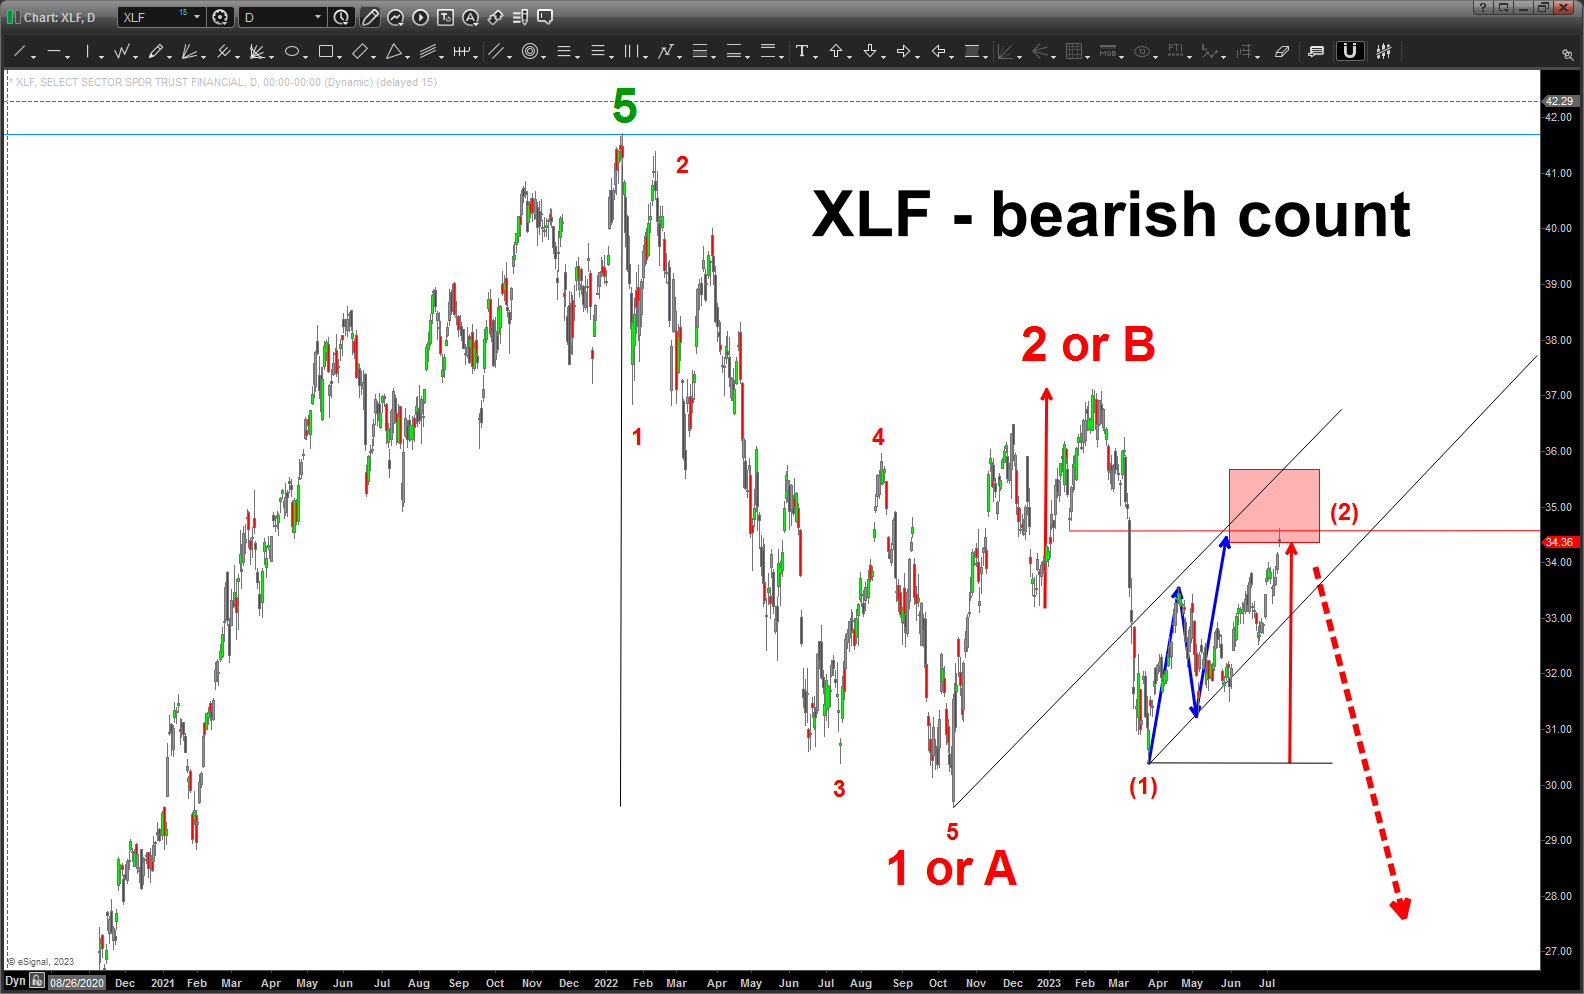
XLF – July 13, 2023 !
Posted on July 13, 2023 Leave a Comment
Well folks, we are at a pretty big fork in the road. The SELL PATTERN on the SPX is “close” and pretty much hit and then the XLF went up and tagged the lower end of the sell zone … gapped up and then closed at the lower end. One can see a couple small laborious machinations up and down before the SPX target is hit so we can sneak into the upper half of the sell zone before really calling the PATTERN complete and the selling to begin – or not.
If this pattern fails, it might to be early to back up the truck, but the melt up will certainly continue …
But, don’t get too excited for that to happen. SOME STIFF RESISTANCE/SELL PATTERNS PRESENT in XLF aka FINANCIALS.
S&P 500 – July 11, 2023
Posted on July 11, 2023 Leave a Comment
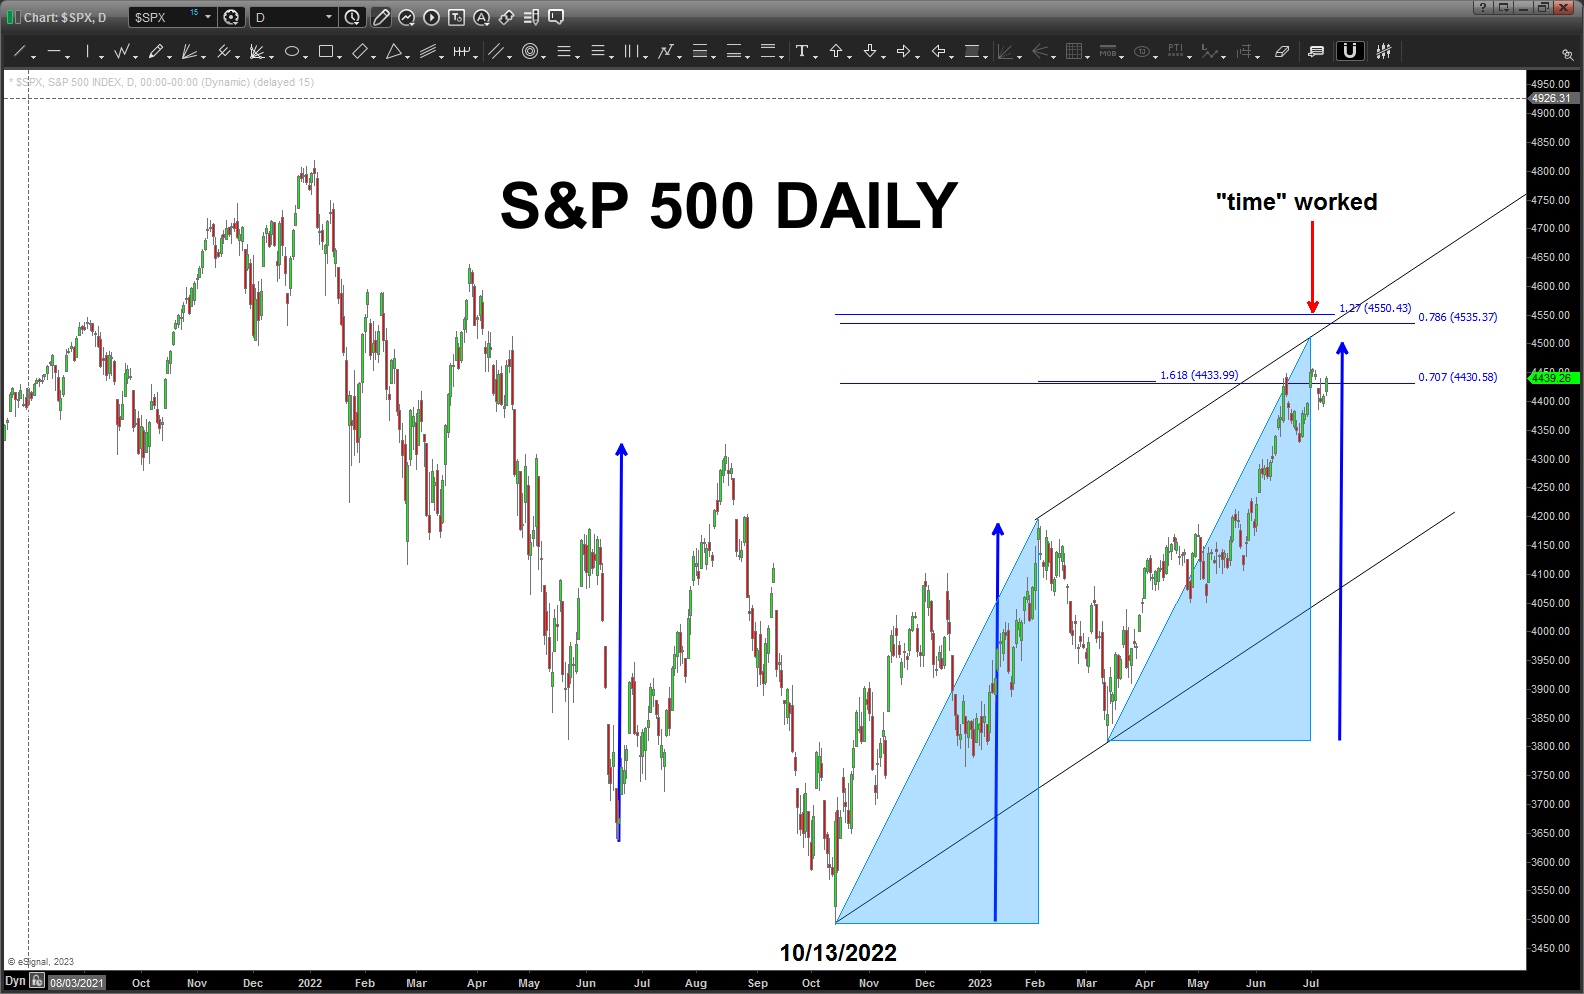
VERY important level approaching in/around 4500 and hen 4525-4550. Frankly, these levels are the last gasp hope for the bears.
Note, the time worked out very nicely but the PRICE was not hit and we’ve held support. Doesn’t look to inconceivable that the targets above won’t get attacked in the coming days?
Geometry – July 11, 2023
Posted on July 11, 2023 2 Comments
Birthday today .. so spent some time listening to Zen music and just using the crayons.
One purple (crown chakra) line that defines a radius of a circle and then … every turning point thereafter.
Yes, it’s “past tense” but we can use this forward … I try (as you all know) to make my charts “present” or “near real time” and not in the past but for this drill I was just enjoying the geometry …
work w/ me …
cheers – B
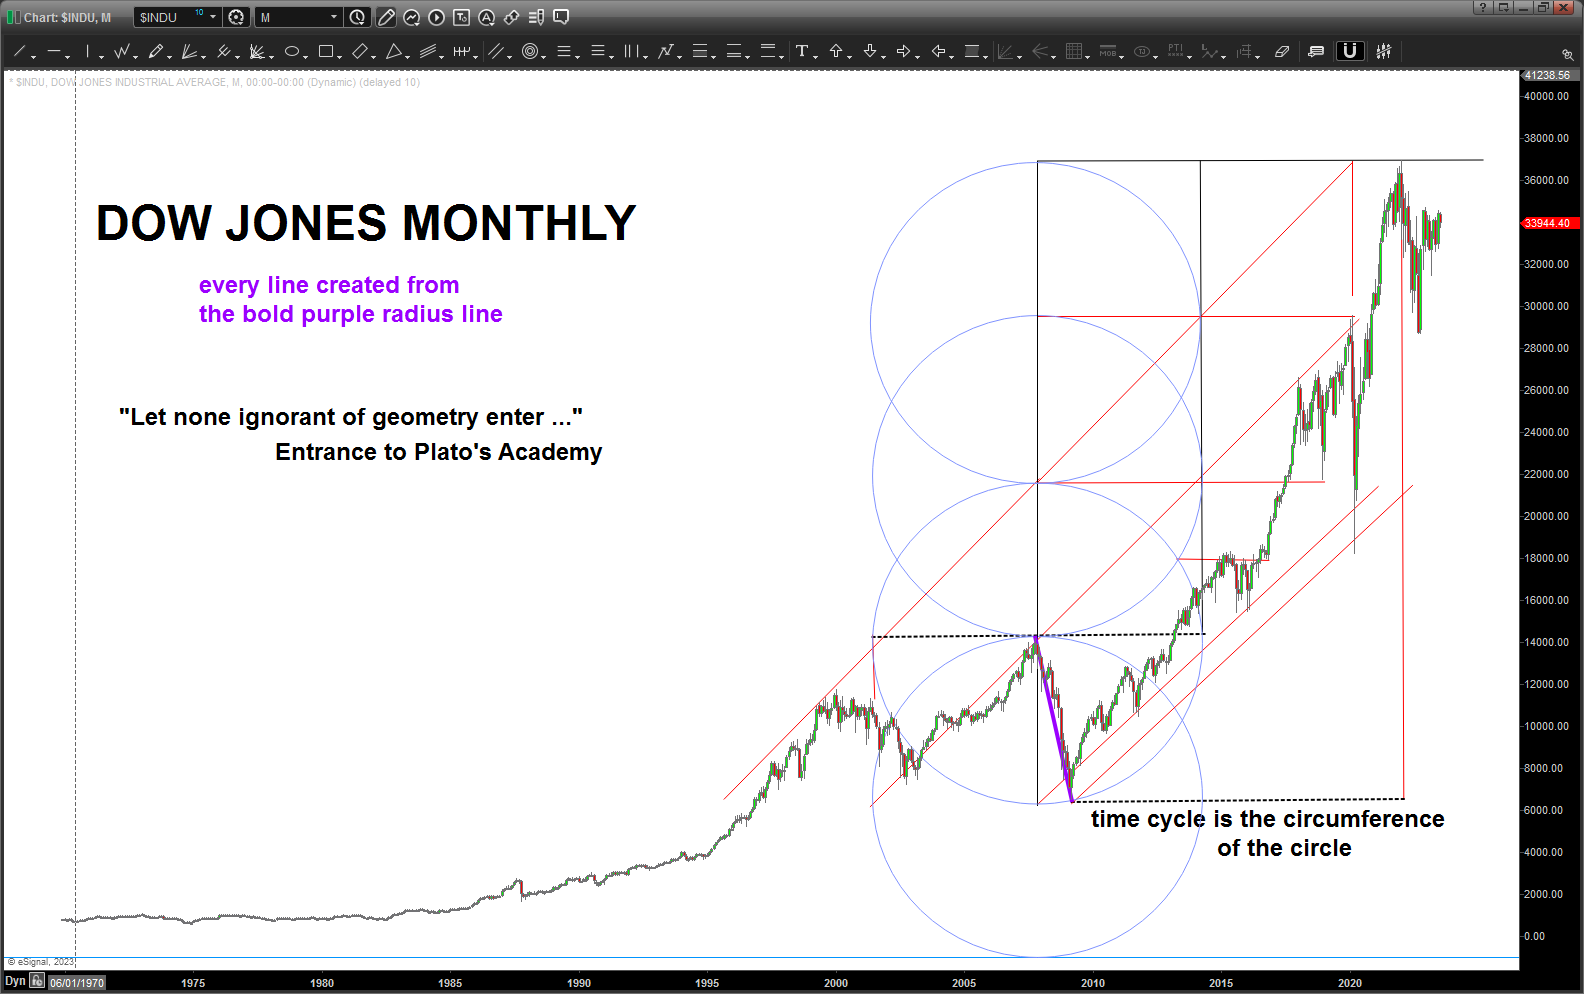
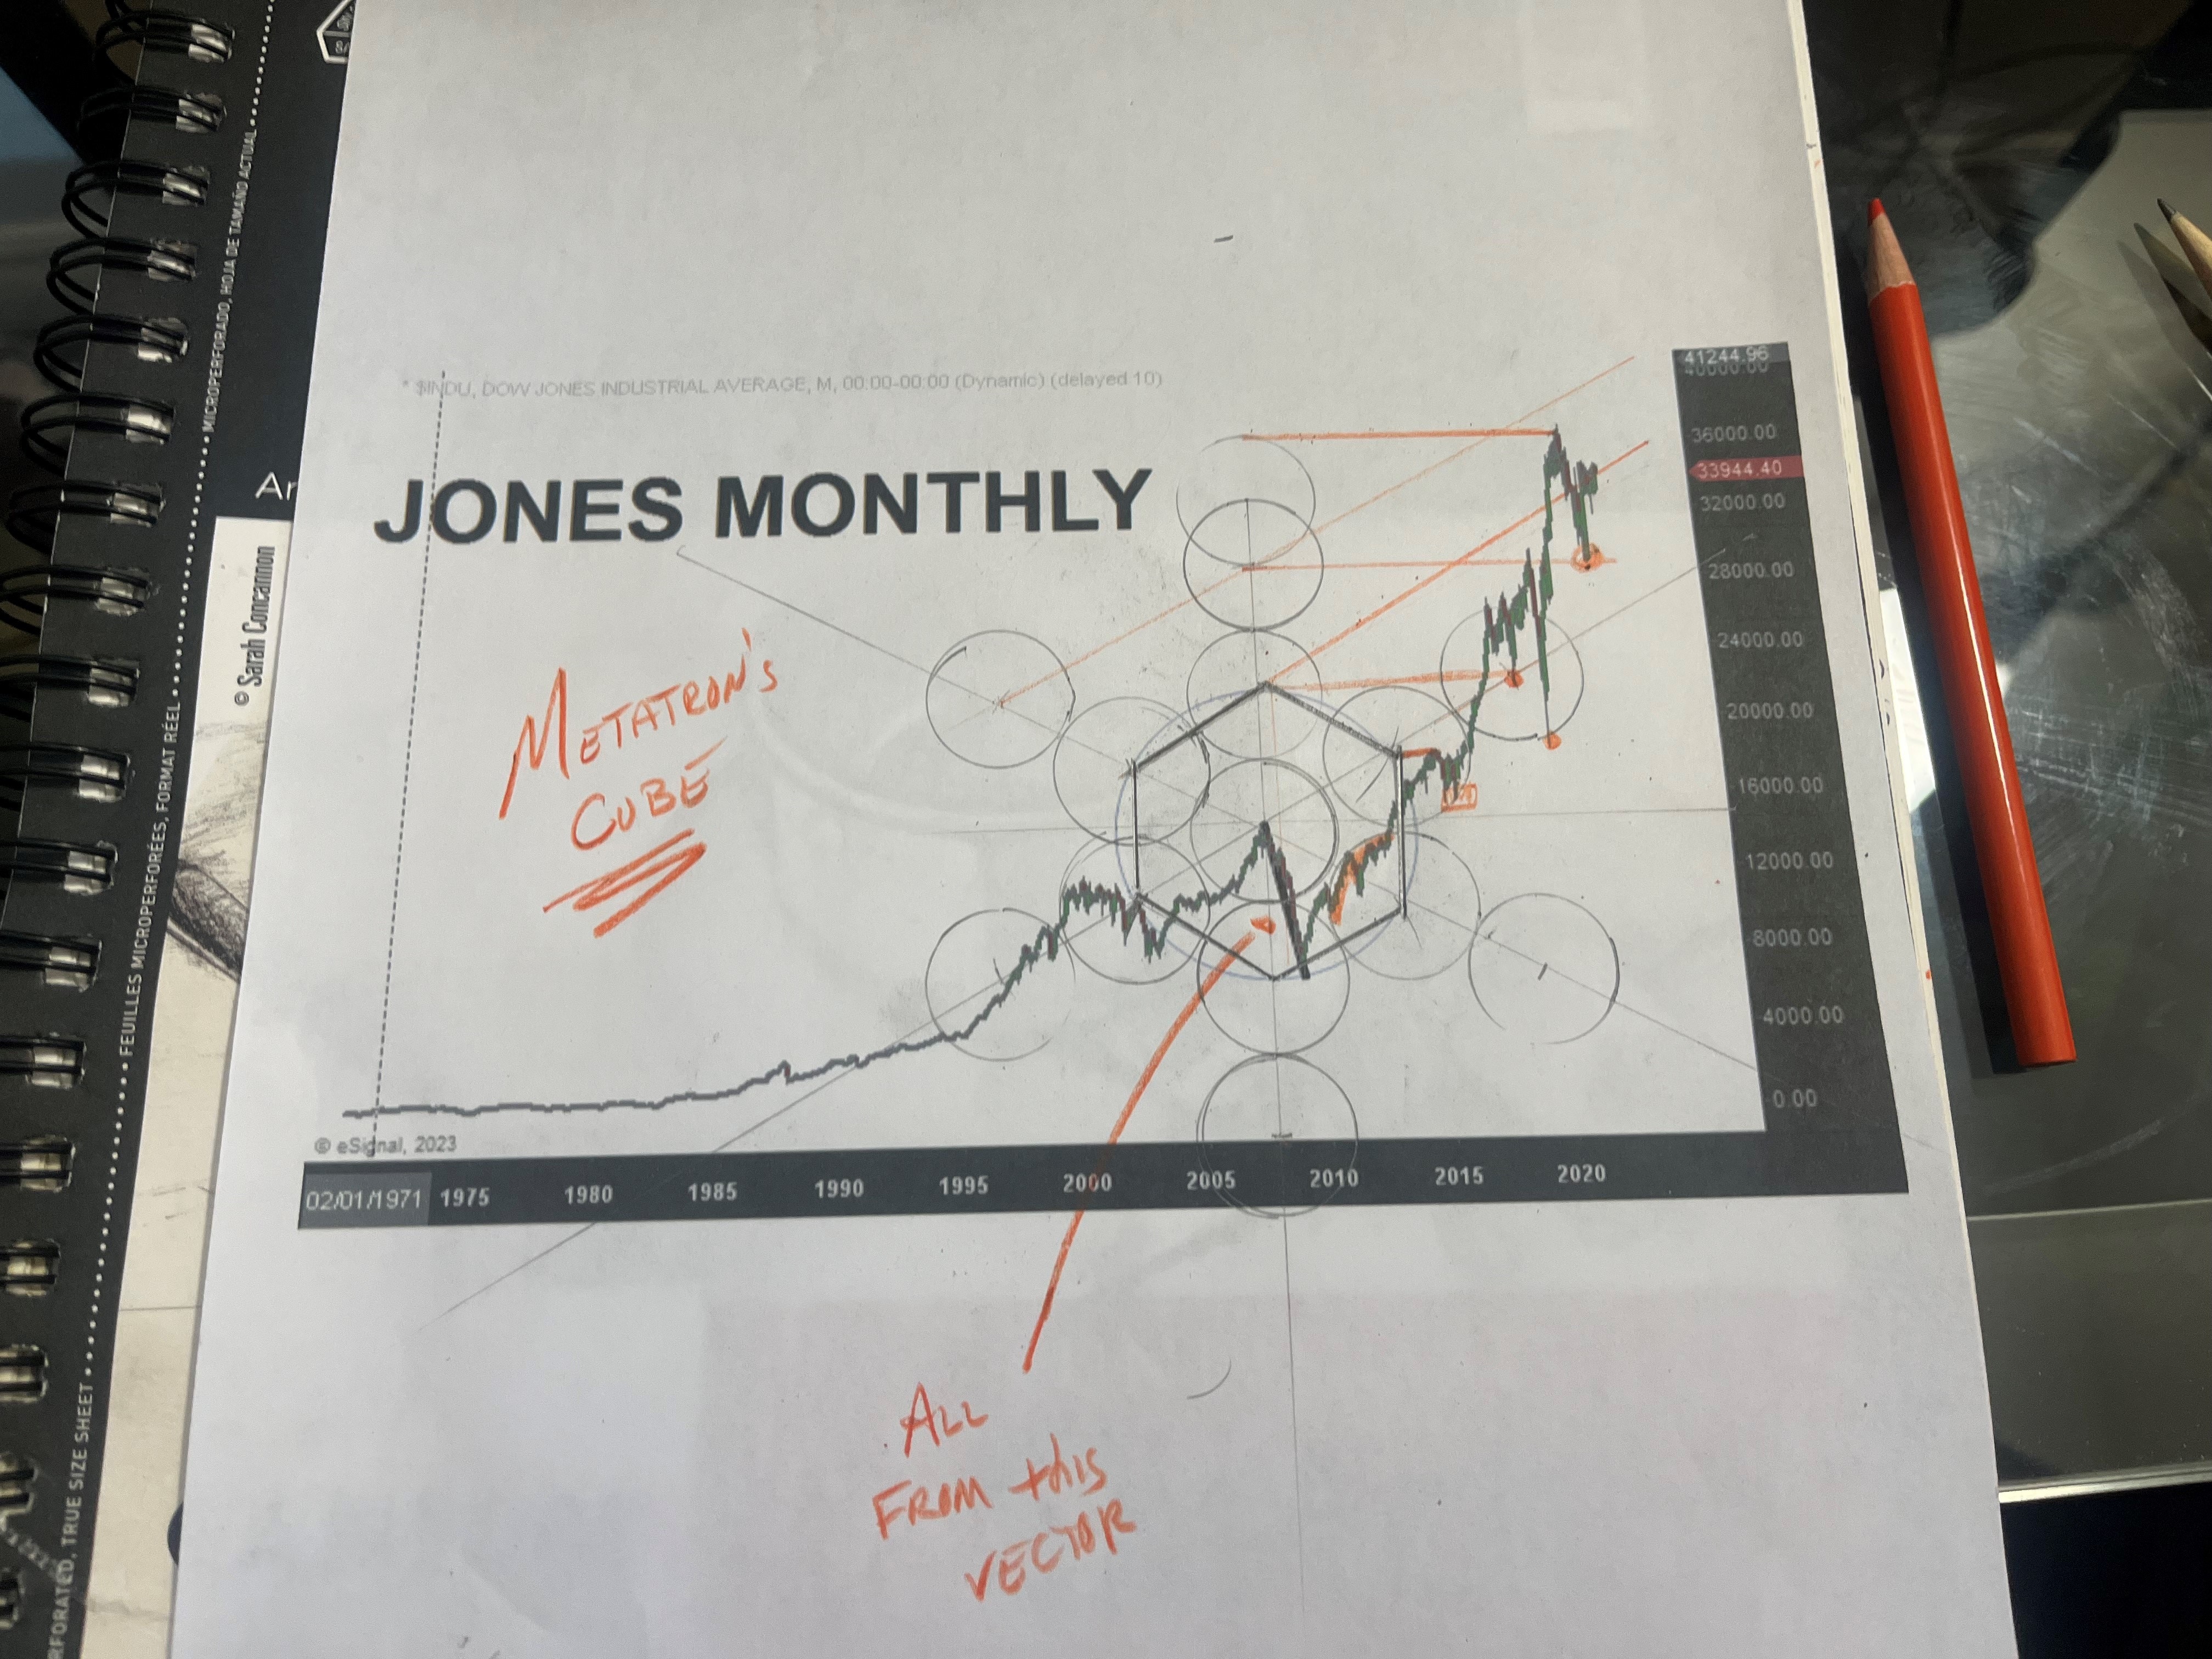
Here’s Metatron’s Cube and the DJIA … go follow Mr. Robert Edward Grant. He’s doing amazingly powerful work around the geometry and ratio’s that we use w/ the patterns …I just printed out the DJIA w/ the purple radius and then free handed and used a compass. It might be off a little bit BUT you get the picture … Metatron’s cube, in historical spiritual texts, is responsible for ALL of creation in this 3rd dimension. So, why wouldn’t it work w/ the stock market … right? 😉
USDJPY – July 06, 2023
Posted on July 6, 2023 3 Comments
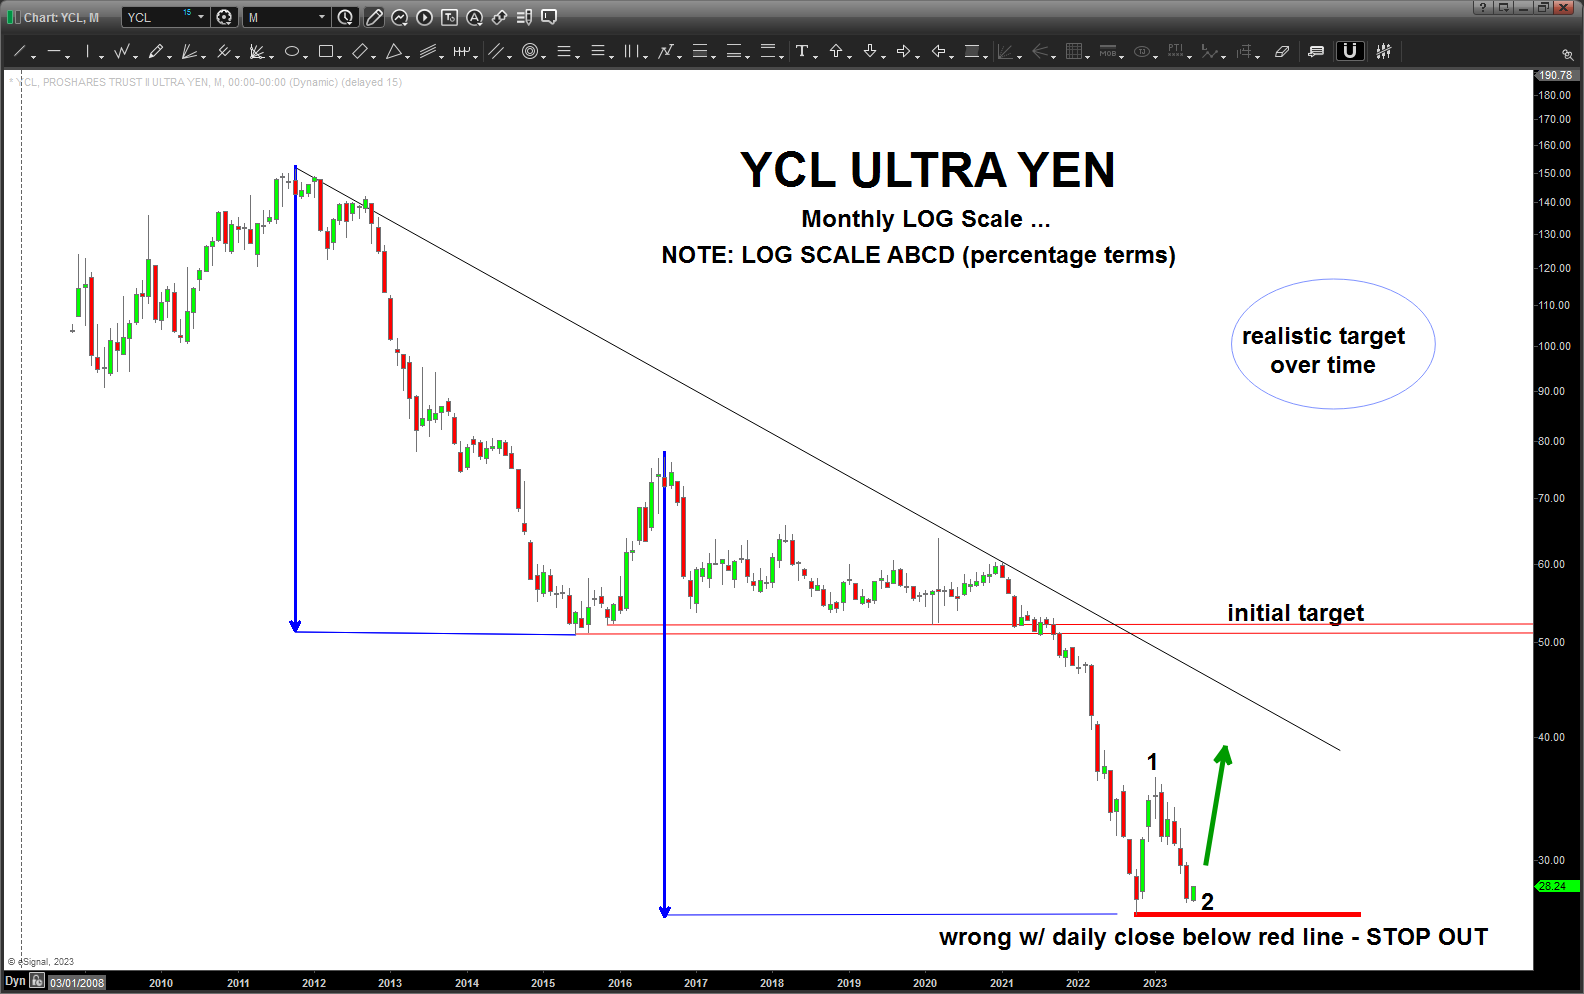
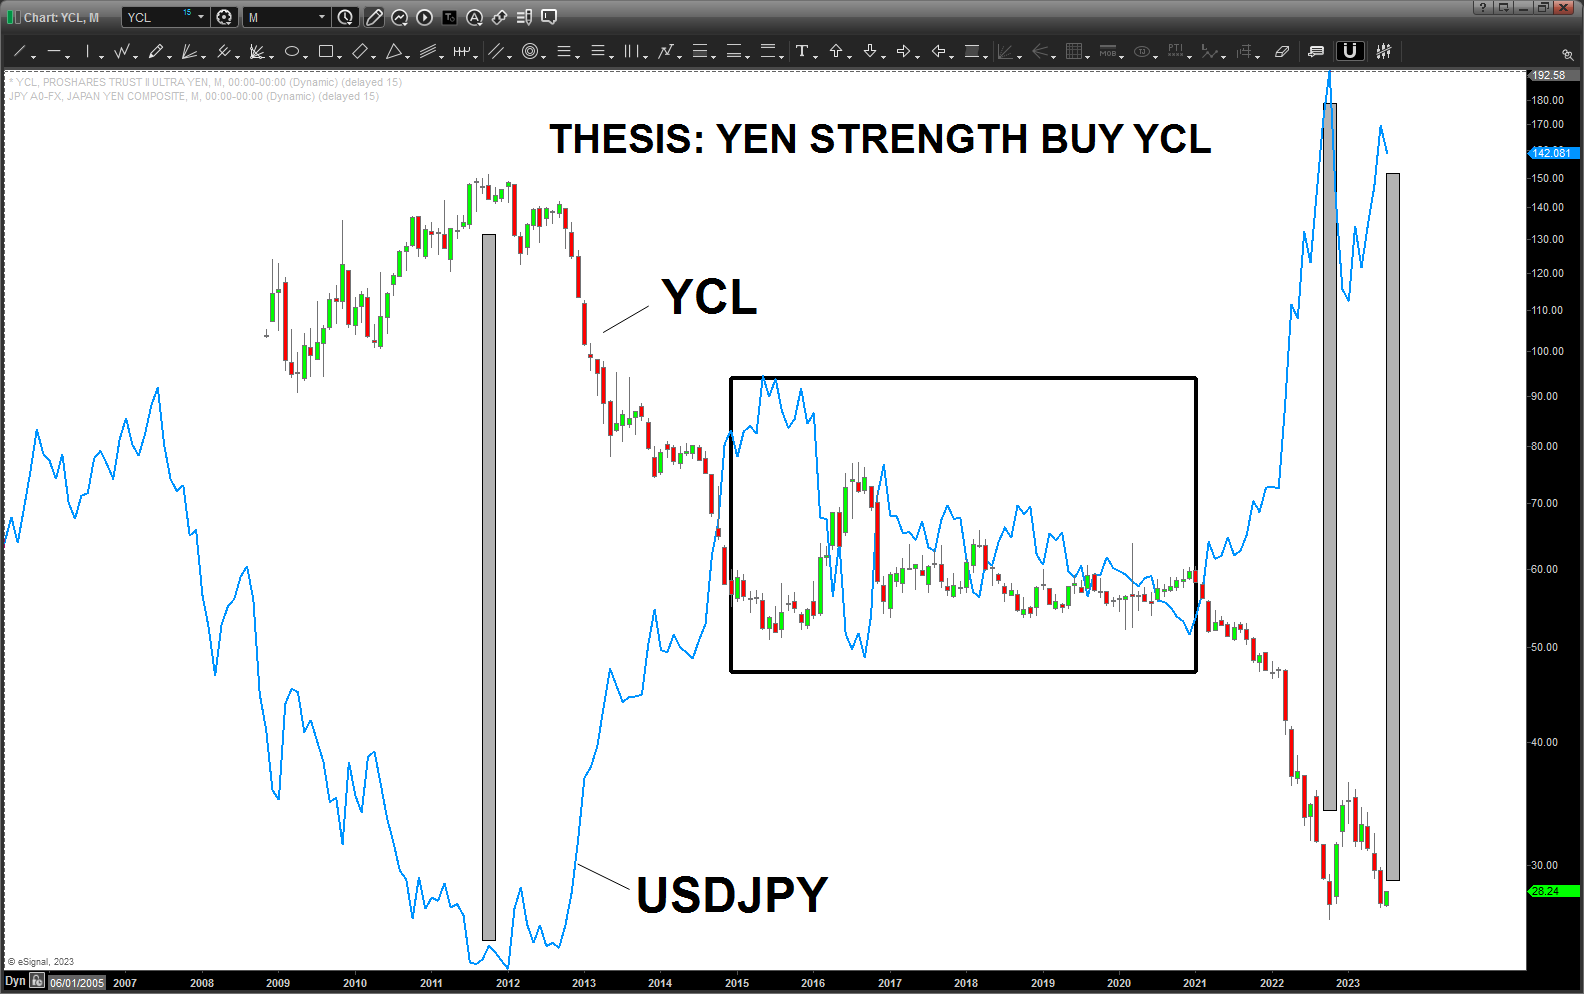
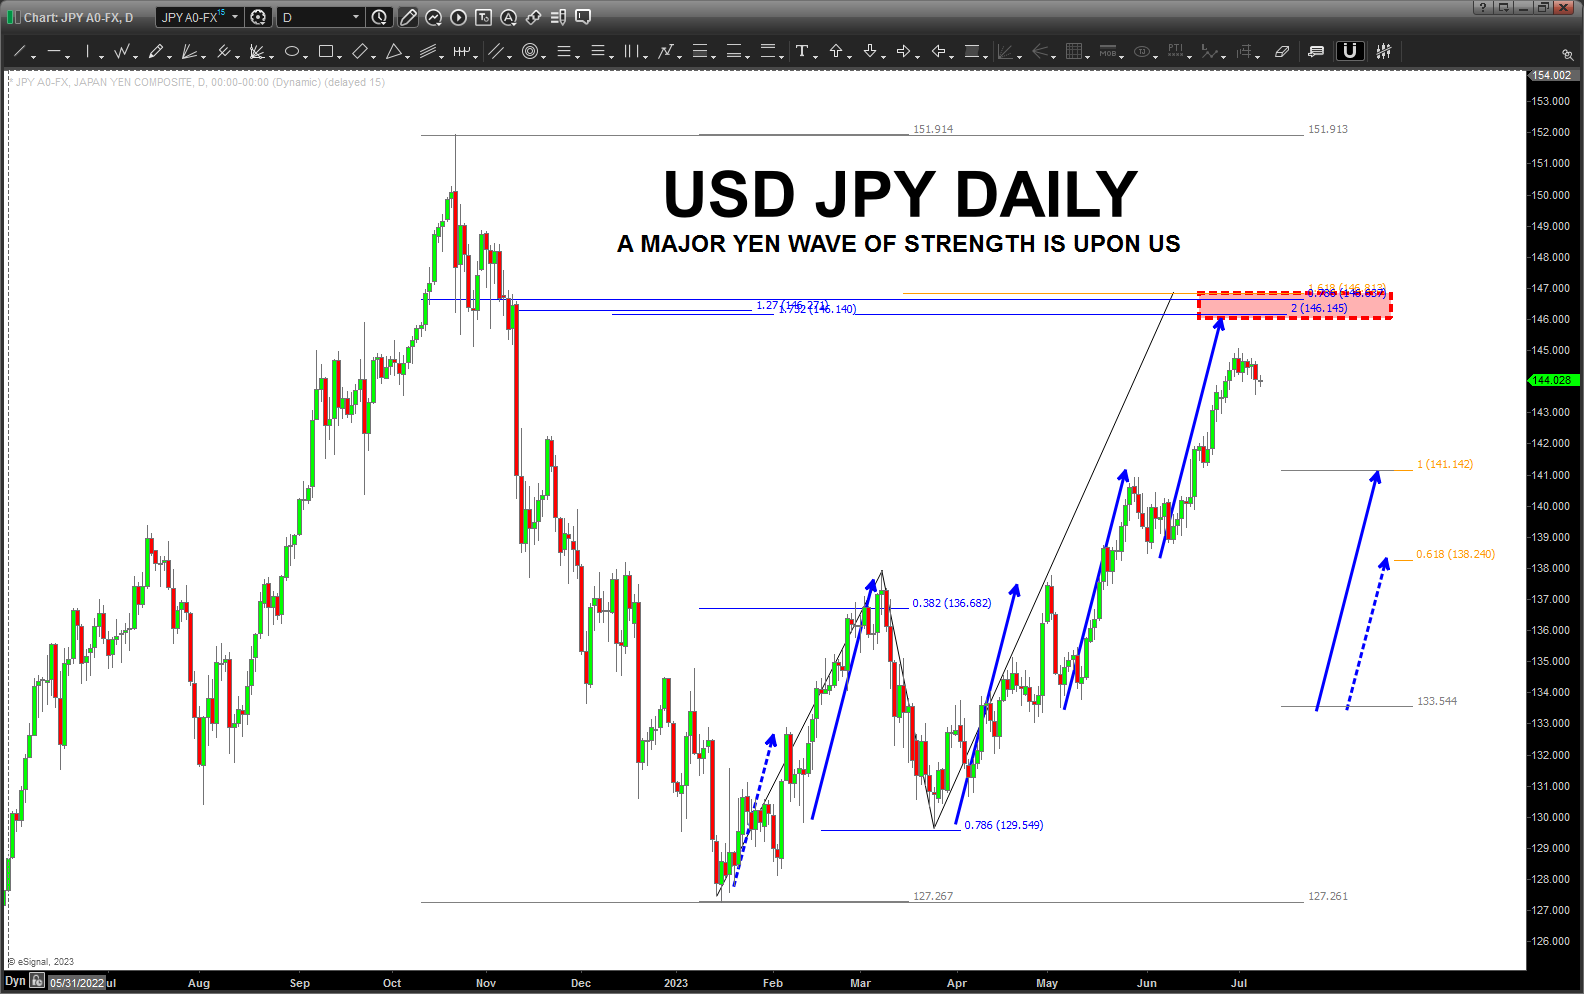
Well, this is one of those that you wait, in this case almost 9 months, for the pattern to appear. I almost tried it at the ABCD but something just told me to wait. Now, we have a 1.618 price projection right on top of the lovely .786 and a bunch of other ratios.
Why is this a big deal? Because the top up at 151 was a major top. Thus … for us Fx Junkies, we need to short USD vs JPY at 146-147 and if I’m right this is going to be one heck of a ride down.
XLE – July 06, 2023
Posted on July 6, 2023 2 Comments
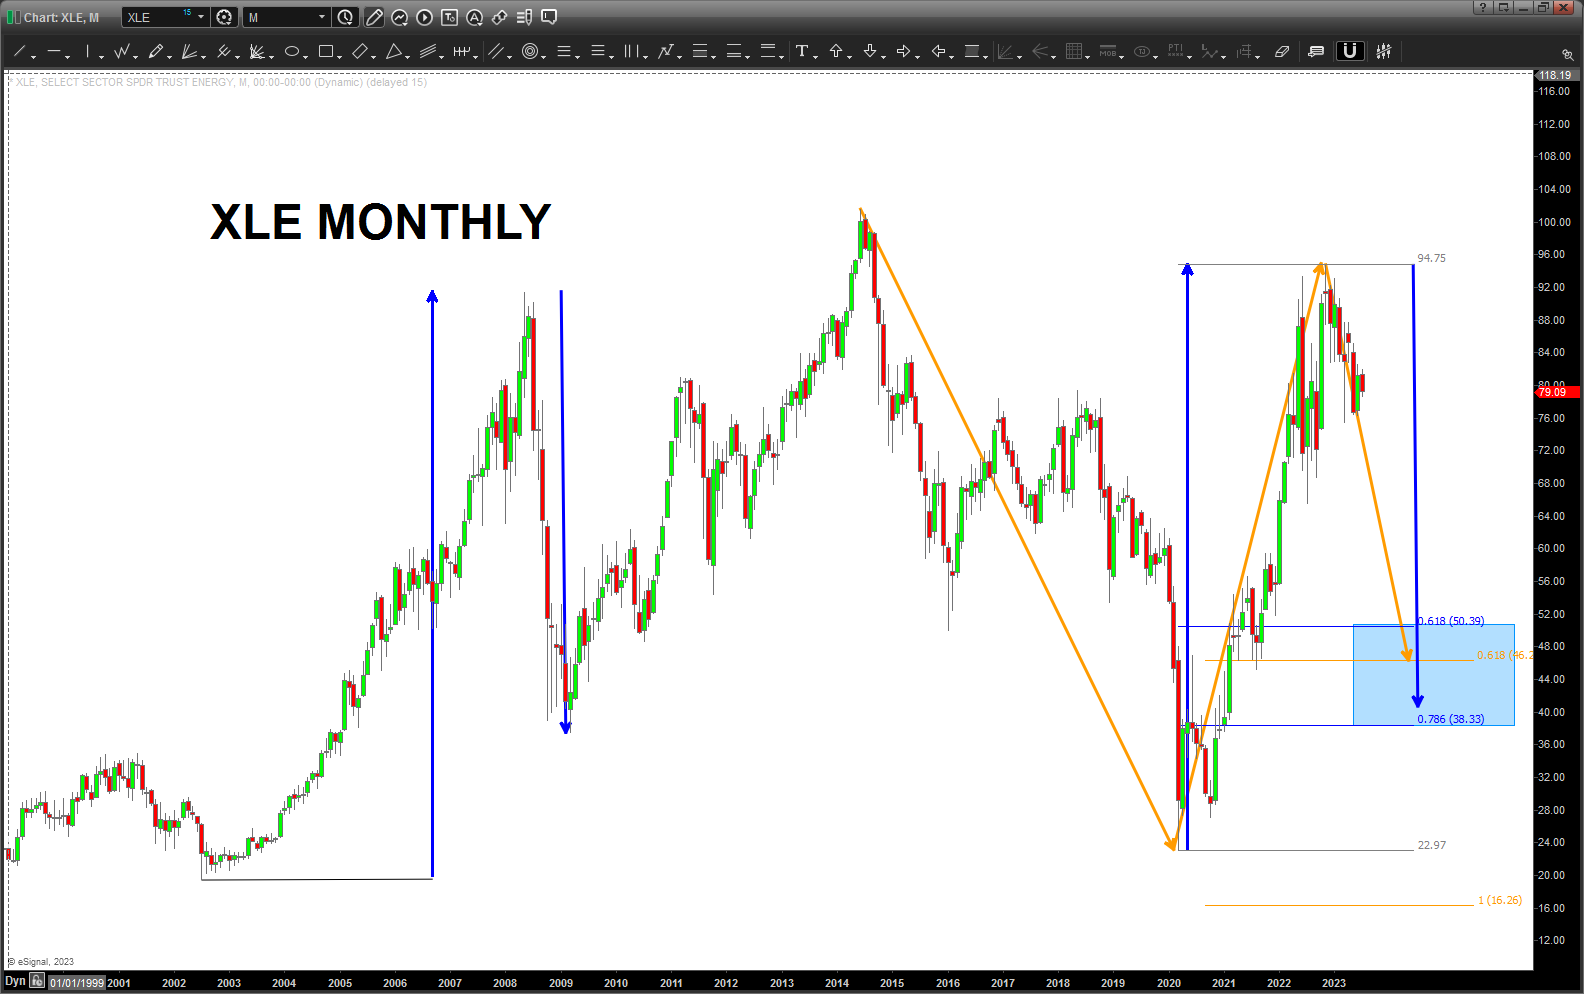
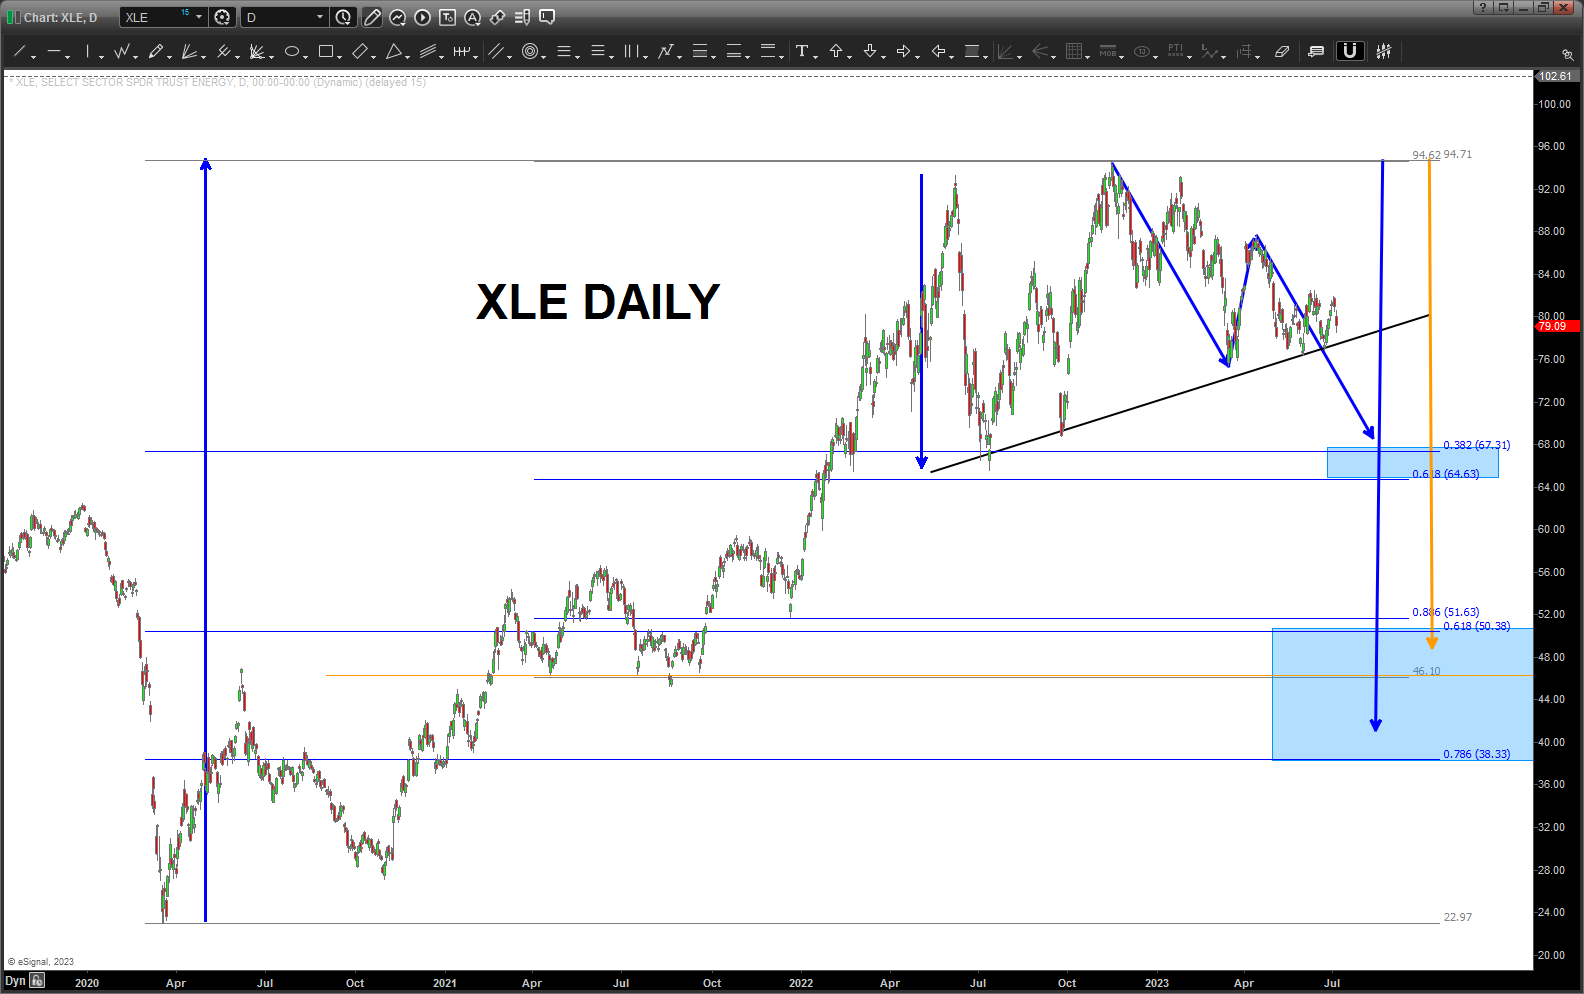
I’m a tad perplexed on this chart as one can make the case for some bullish action BUT I’m not even to try and count the different machinations and I don’t want to “could have would have should have” when it comes to my wave counts …
I’m picking lower simply because of the last time it did the same measured move .. it corrected about down to the blue box. That’s my kind of investing – as many of you know – I WAIT and STALK a chart for a long time before entering. So .. seems reasonable to me.
Obviously, out black neckline of the H+S present is “crucial” for the bulls as I don’t want to see a weekly close below that line or – that opens up the first target of 64-67.
From there I see the blue zone as MAJOR support and a BUY if you can wait that long …
Interest Rates – July 06, 2023
Posted on July 6, 2023 1 Comment
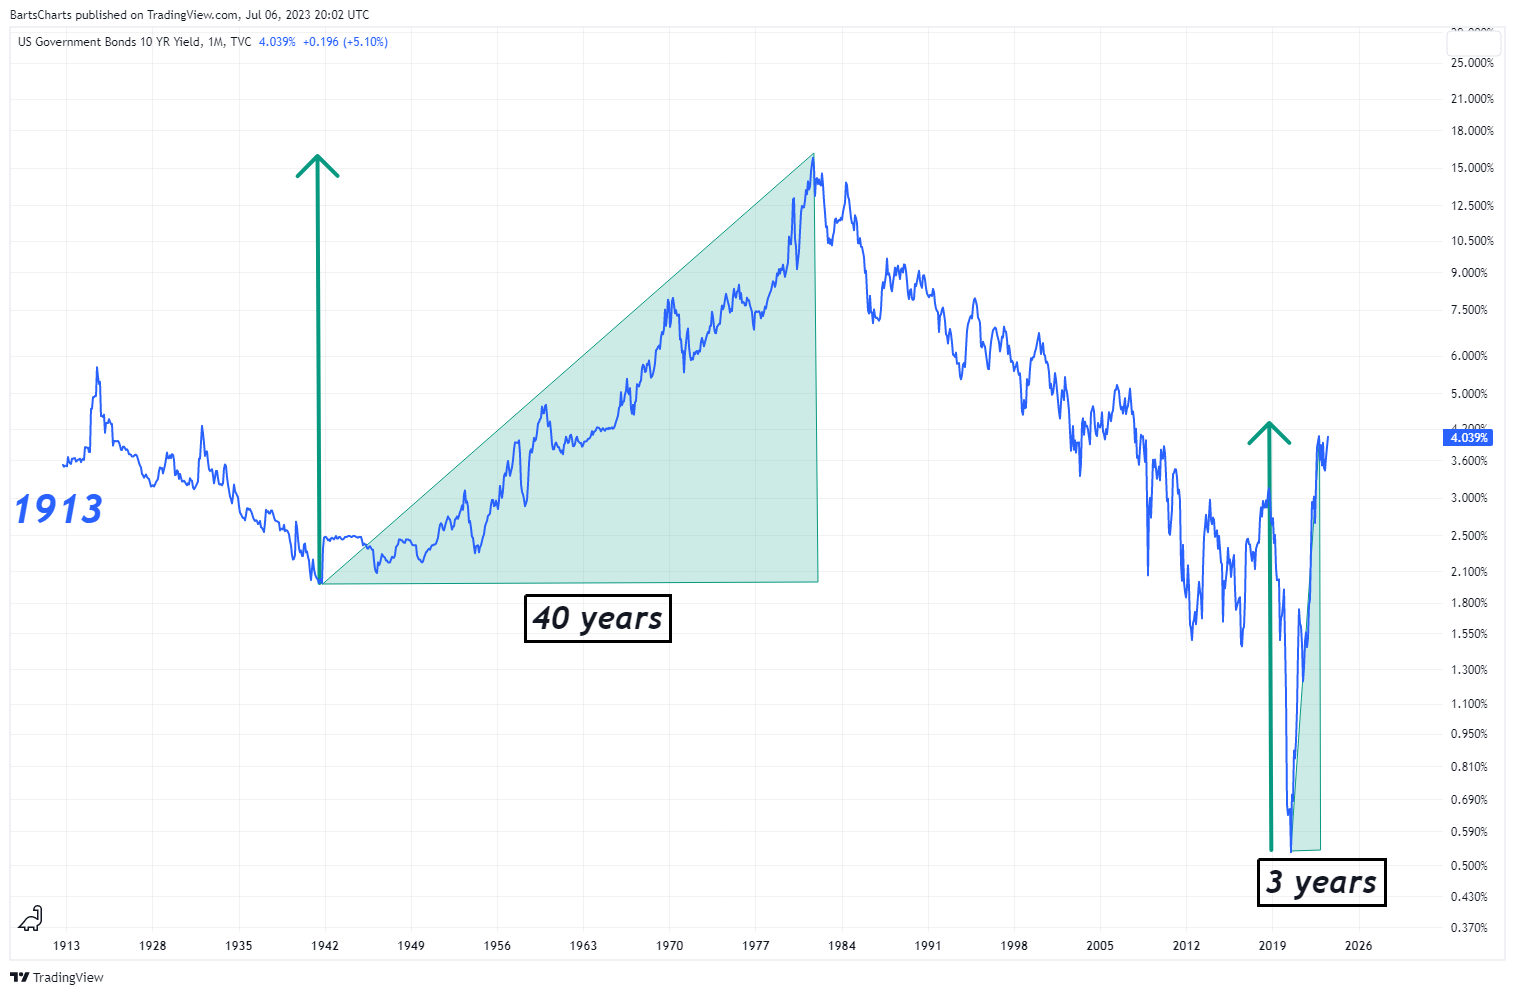
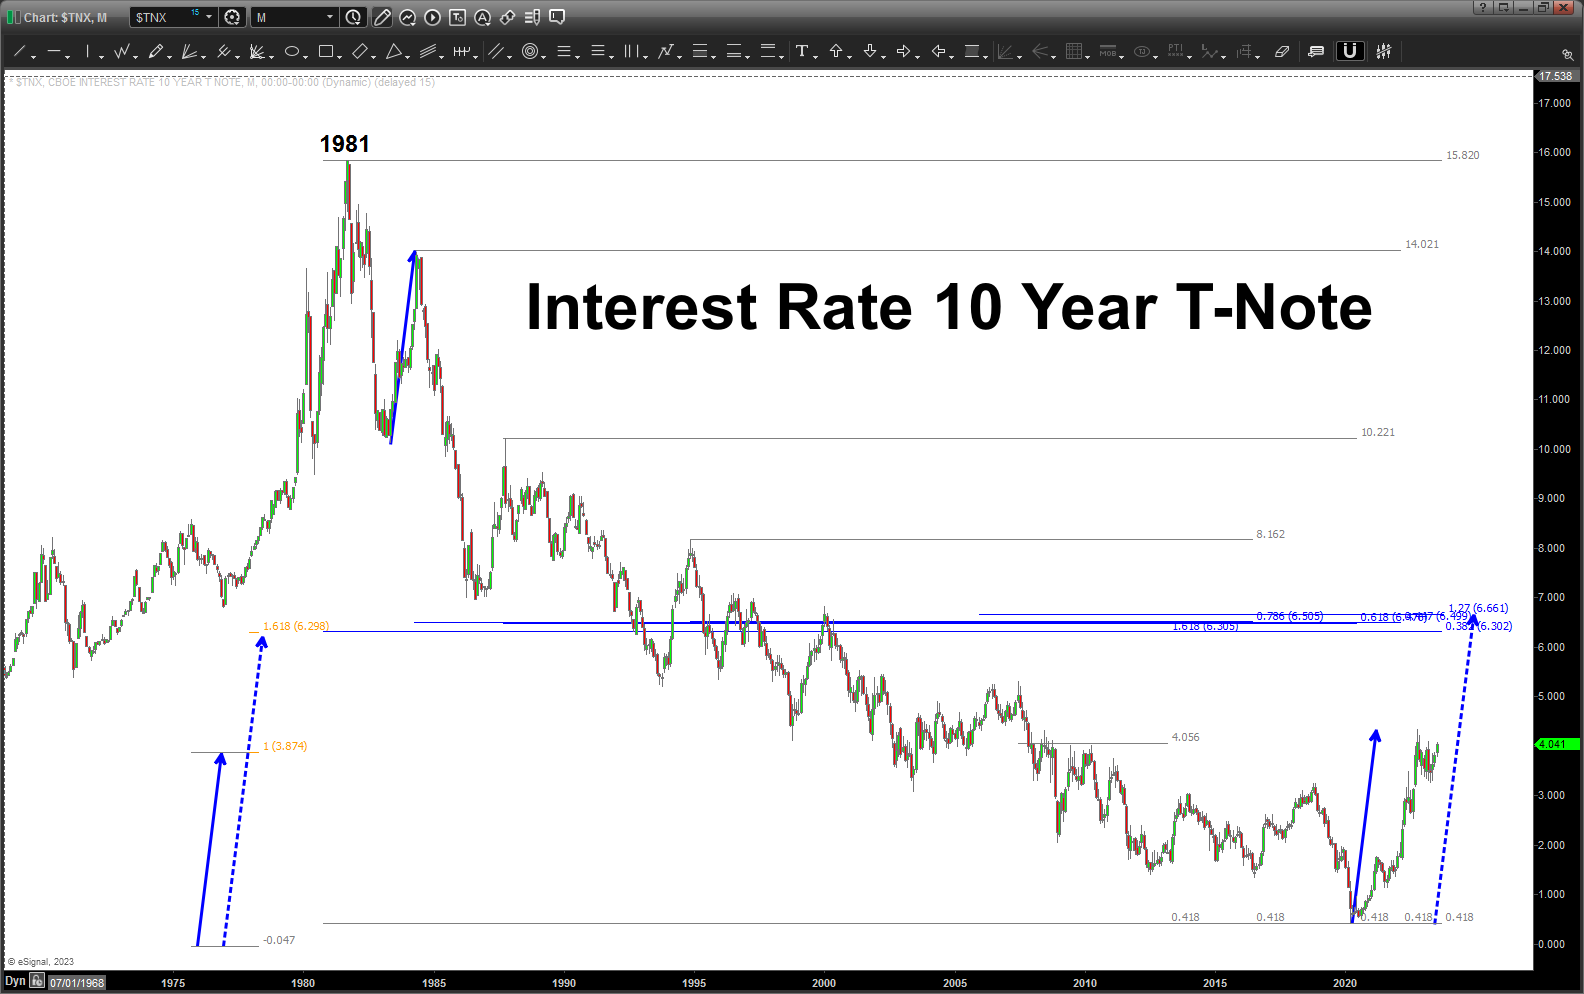
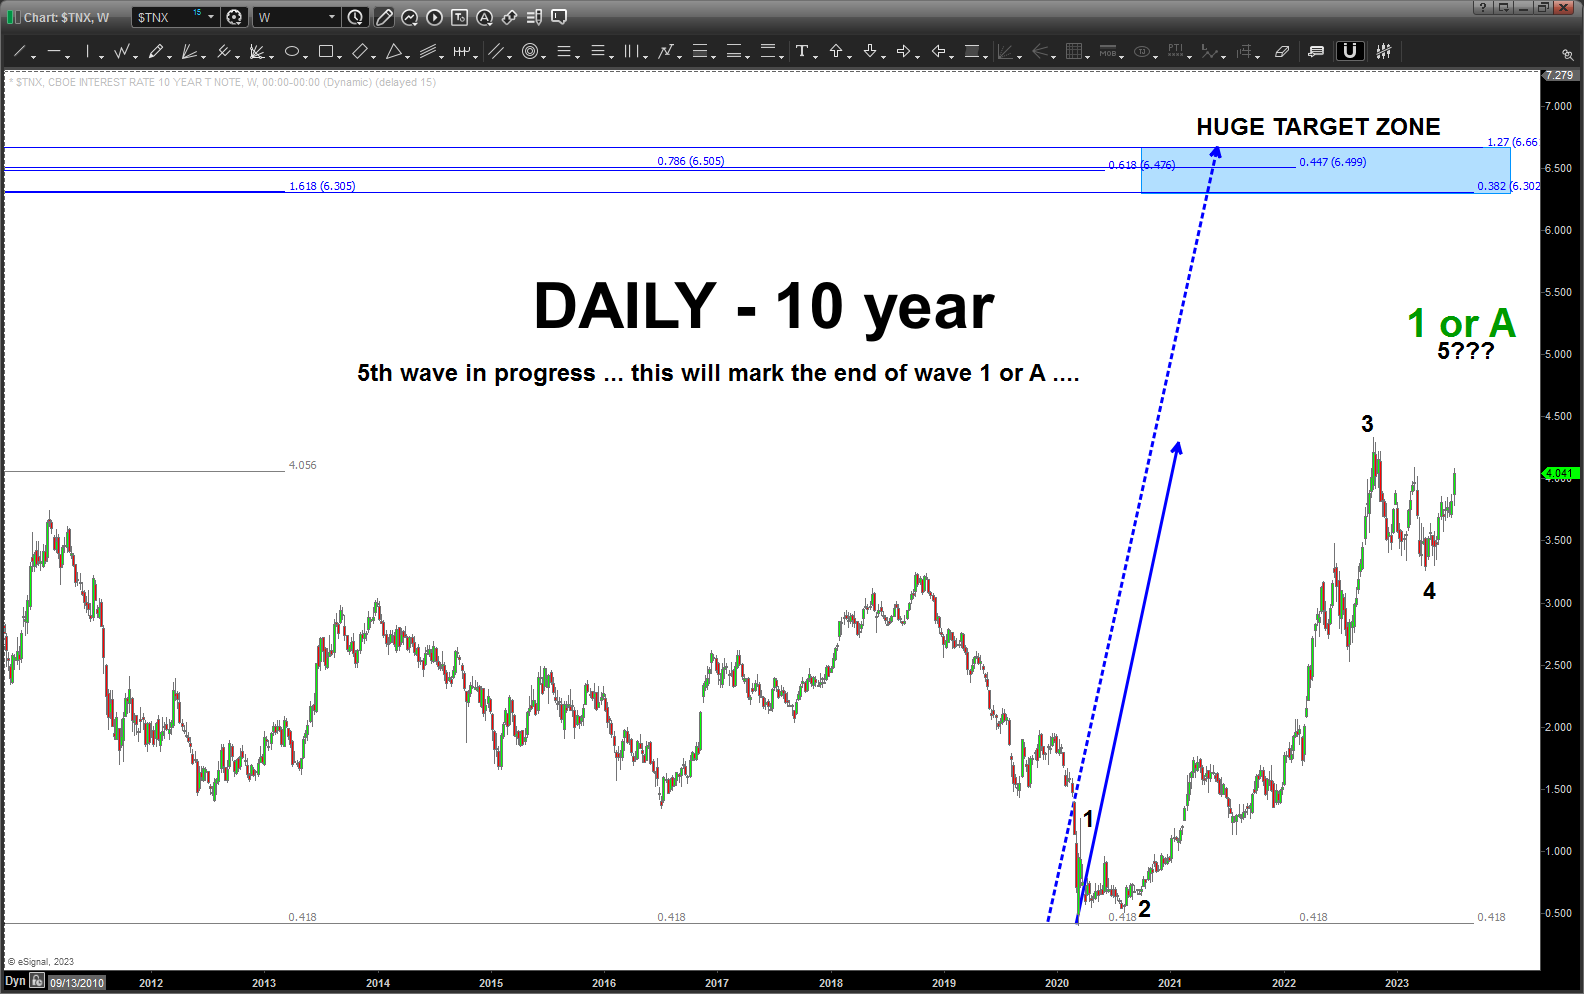
I posted the chart below a little while back … it’s a chart of the ten year interest rates and what I’m trying to show is that, yes, banks and a lot of people got caught w/ the rising interest rates.
Folks, it took 40 years to rise the 700 ish % .. we’ve done it in 3 and we are not done. I’m counting this as wave 5 of 1 or A. So, in the short-medium term expect interest rates to continue rising. Then of course we will get wave 2 or B and everyone will think the Fed is done tightening and that’s when the real smash will occur – a C wave or wave 3 higher? What if this is a new “bull market” in rates…? Wave 3 can’t be the smallest SO … interest rates are rising folks. Ugh.
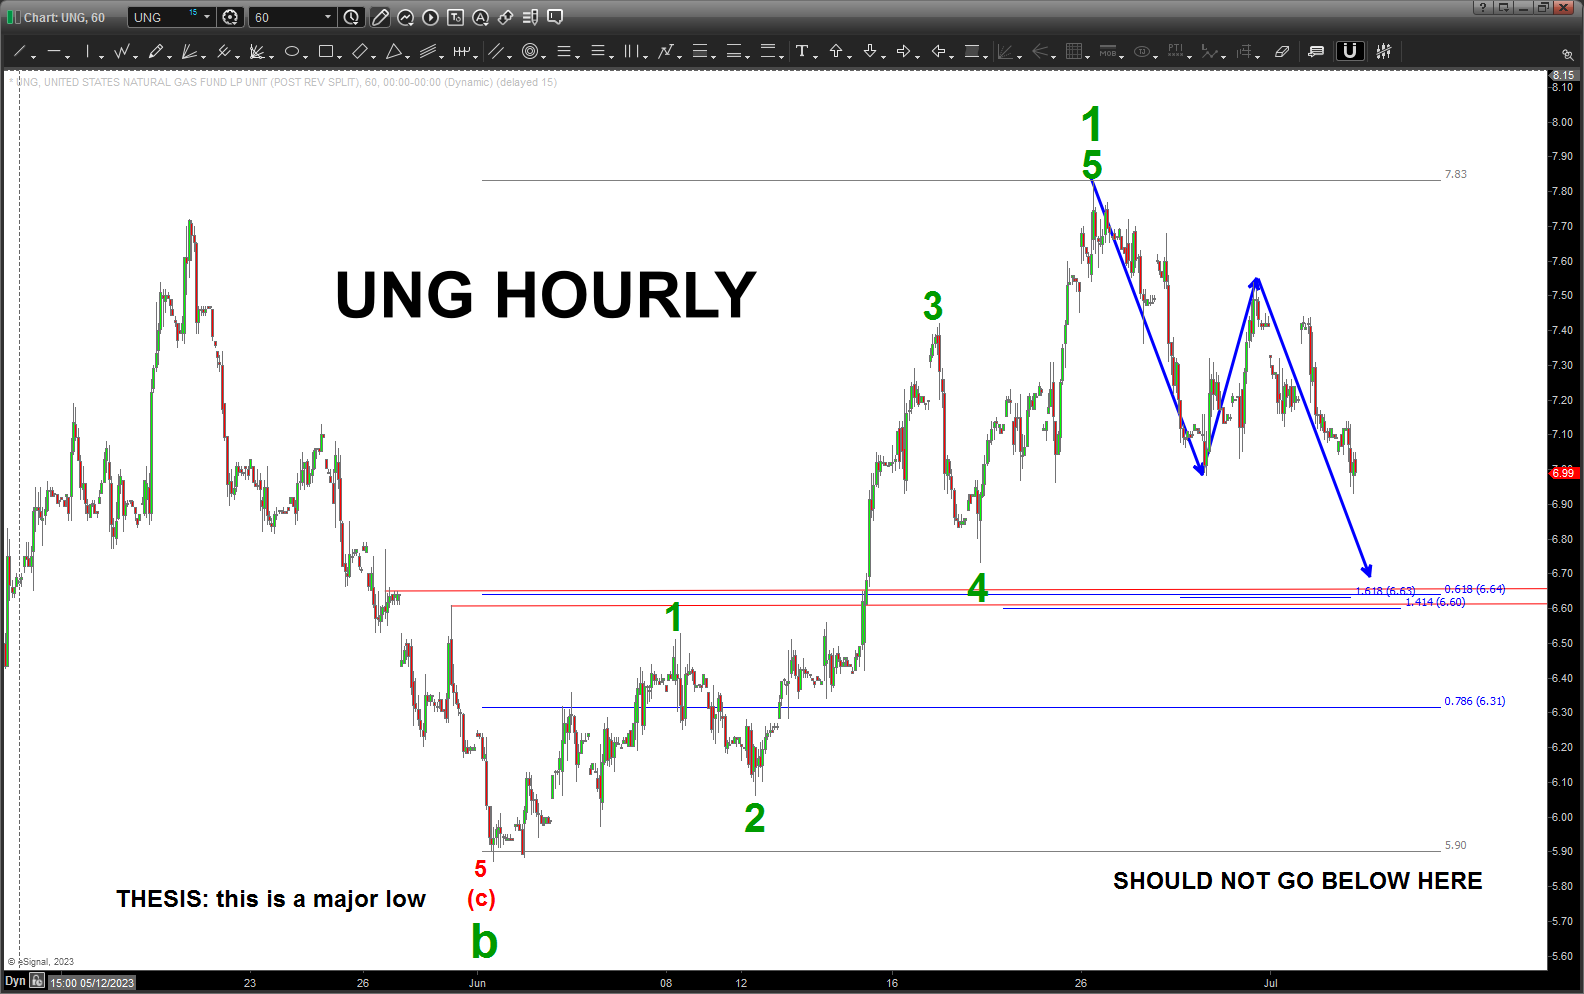
UNG – July 6, 2023
Posted on July 6, 2023 Leave a Comment
Last post on UNG/Nat Gas: https://atomic-temporary-44460632.wpcomstaging.com/2023/04/04/natural-gas-ung-april-4-2023/
Looks like a pretty clear 5 waves up that doesn’t break any rules … and now a nice 3 wave correction for the buys zone in the 6.60 “area.”
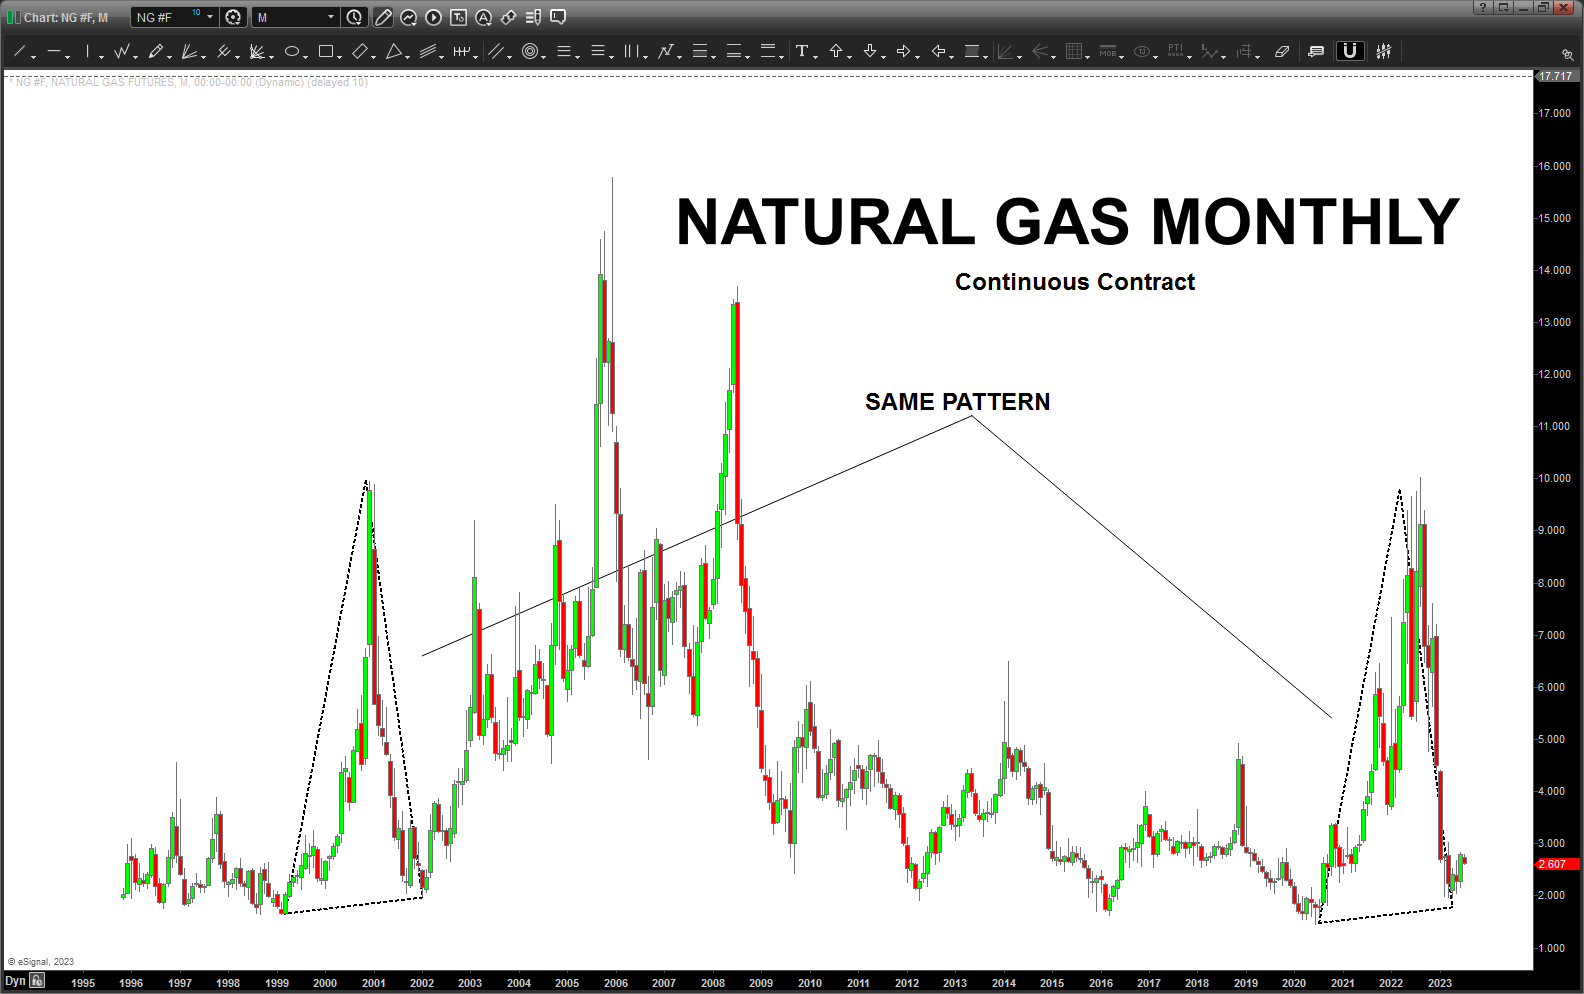
Again, this entire thesis is predicated on the long term MONTHLY PATTERN of the Natural Gas Futures below.
We “should” stay above 5.90 … I’m staying long until that low on NAT GAS is broken.