Eggs – August 17, 2023
Posted on August 17, 2023 Leave a Comment
Last post on Eggs: https://atomic-temporary-44460632.wpcomstaging.com/2023/02/14/eggs-february-14-2023/
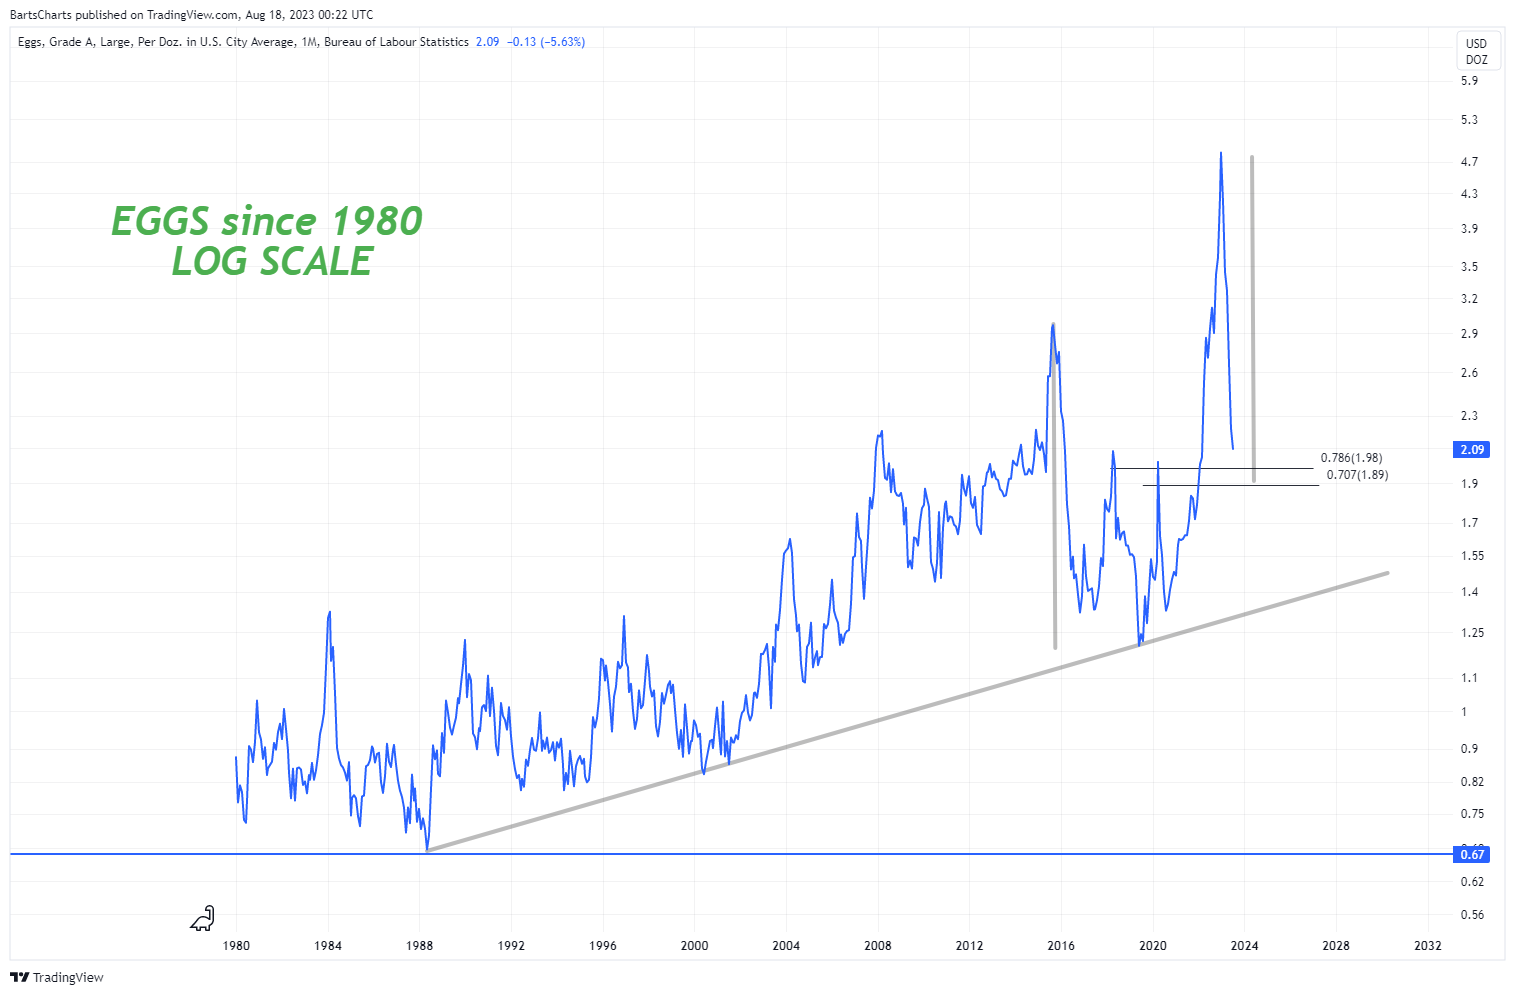
Might want to buy up some eggs … if still bullish believe this measured move will be a low for eggs and then off to the races higher?
If we blow thru these levels to the downside then a larger correction is ensuing … for now, watch the .786 and the measured move.
JNK – August 16, 2023
Posted on August 16, 2023 1 Comment
Last post on JNK: https://atomic-temporary-44460632.wpcomstaging.com/2023/06/27/jnk-geometry-june-27-2023/
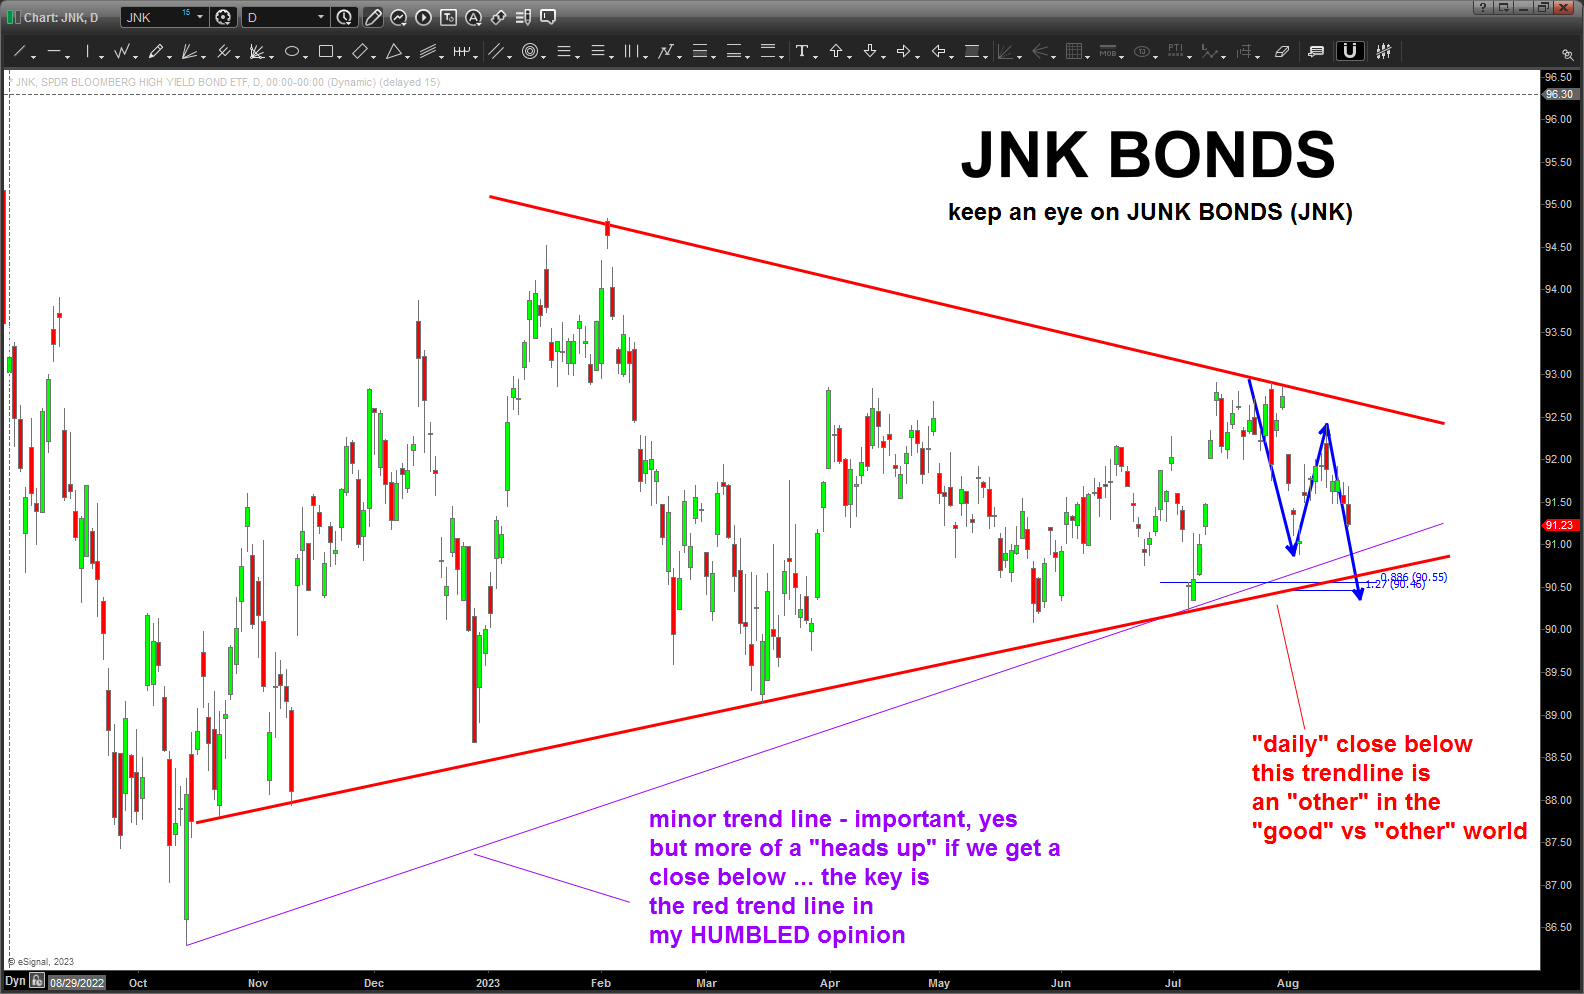
Well, we have a BUY PATTERN on JNK right around the “key” trend line … that’s been holding the Junk Bonds up for all of 2023 and the last quarter or so of 2022. It’s important .. doing “basic” trend line construction we can see the “minor” purple line will give us a heads up but I think Mr Red Trend line is the key … we lose that and I find it hard to get this market going higher for a while…but you never know, right?
US Dollar Index – August 14, 2023
Posted on August 14, 2023 Leave a Comment
One of my first teachers had an amazing saying and it’s one that has stuck w/ me for 15+ years. When your trading/investing – you might not realize it – but you truly are playing with giants. The amount of money flowing right now, not even while the NYSE is open is mind boggling. And here we sit, w/ our mouse at the ready and, basically, playing Cowboys and Indians as we click to enter here and then click to put the stop in … bang bang, you’re dead! LOLOLOL … man, wonder if the kids and even play that now? For those of you in the late 40’s to mid-50’s club – we had the LAST real childhood. Shoot, I STILL have my bigwheel scar on my knee. what a WRECK that was and one of my best friends, David R actually went UNDER a car as it was driving. Not a scratch … anyway, I digress.
So, I use PATTERNS to look for inflection points and then try and manage risk and put a position on …that’s my version of Cowboy’s and Indian’s …
But what Mr. Dinapoli said was “when you enter the markets you enter the world of huge gigantic gorilla’s … pause … and they are locked in a cage w/ you …pause…and they are carrying dynamite …pause …and they dynamite is LIT.
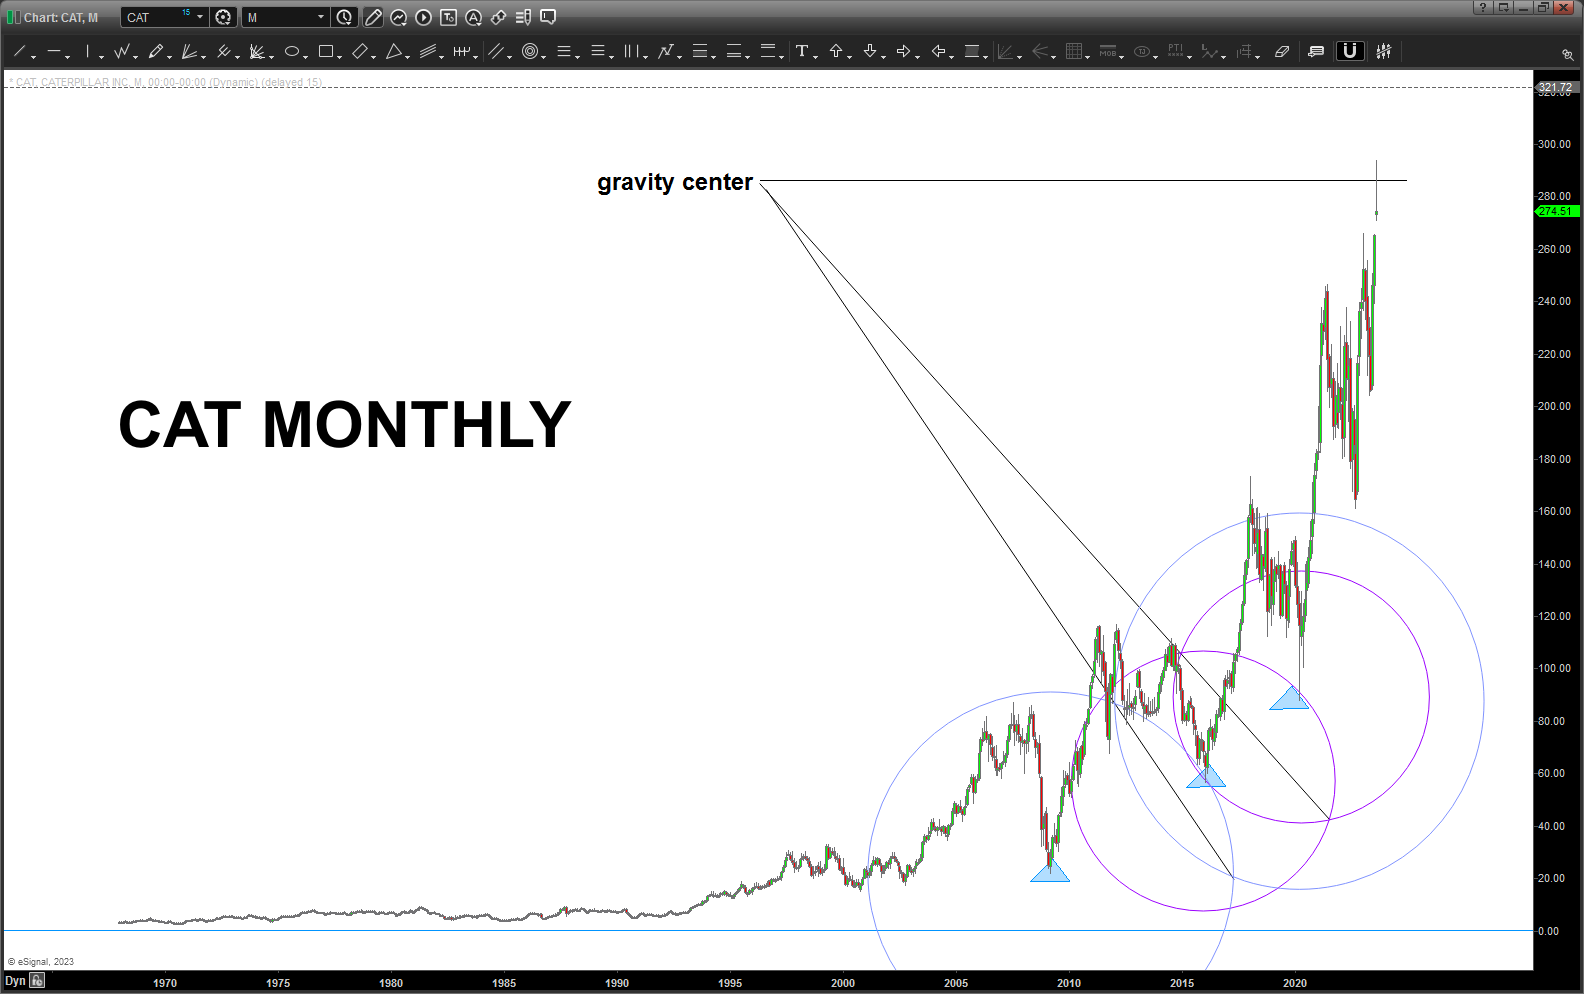
Below is my interpretation of Gorilla’s, in our cage (locked OBTW), carryingy lit dynamite:

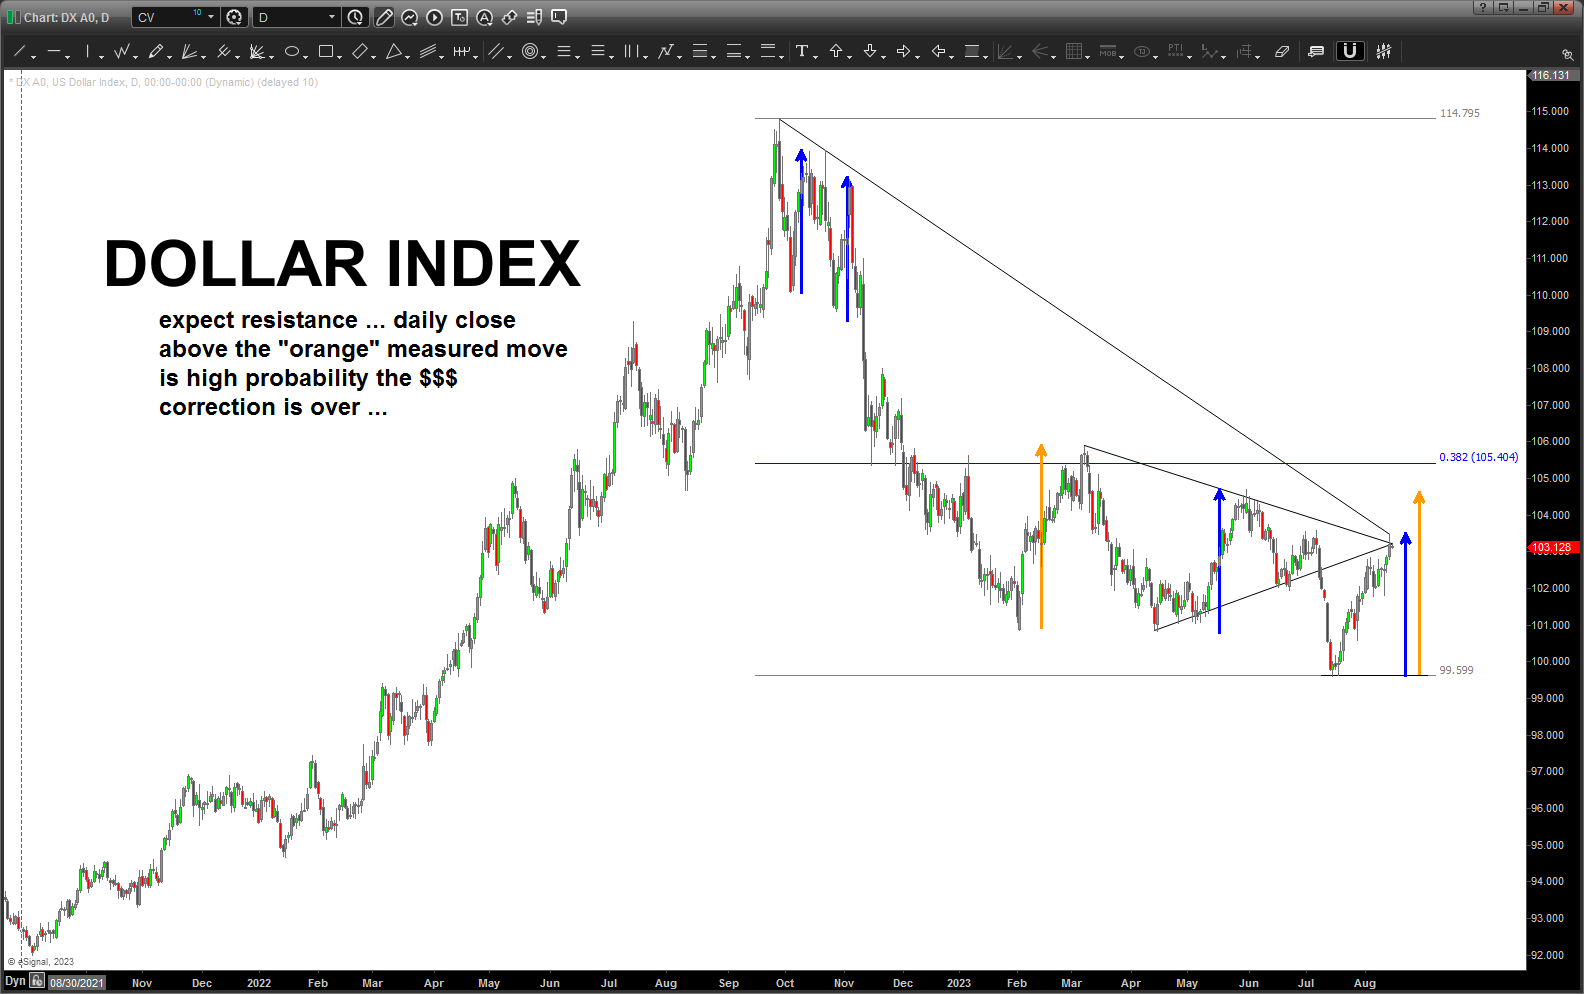
And we can also make note that China is DUMPING our bonds and blah blah blah. This is the backdrop folks. Until we have a PATTERN (remember: work or fail) then this is all just conjecture … but the USD is on the verge of a breakout that could get it soaring. I can see why it stopped today and I would like a nice orderly pullback to get short some EURO but I really don’t know if that will come.
I don’t think one billionaire is reading this blog right now (if you are, we could use some donations for the next SUP Vet retreat if you’re out there) so it’s mostly just you and I (Joe Retail) playing Cowboy’s and Indian’s.
Either way … might be time to tighten stops, ask yourself how much you want to be drawn down in your 401K and make some adjustments.
Or … not.
TLT – August 12, 2023
Posted on August 12, 2023 1 Comment
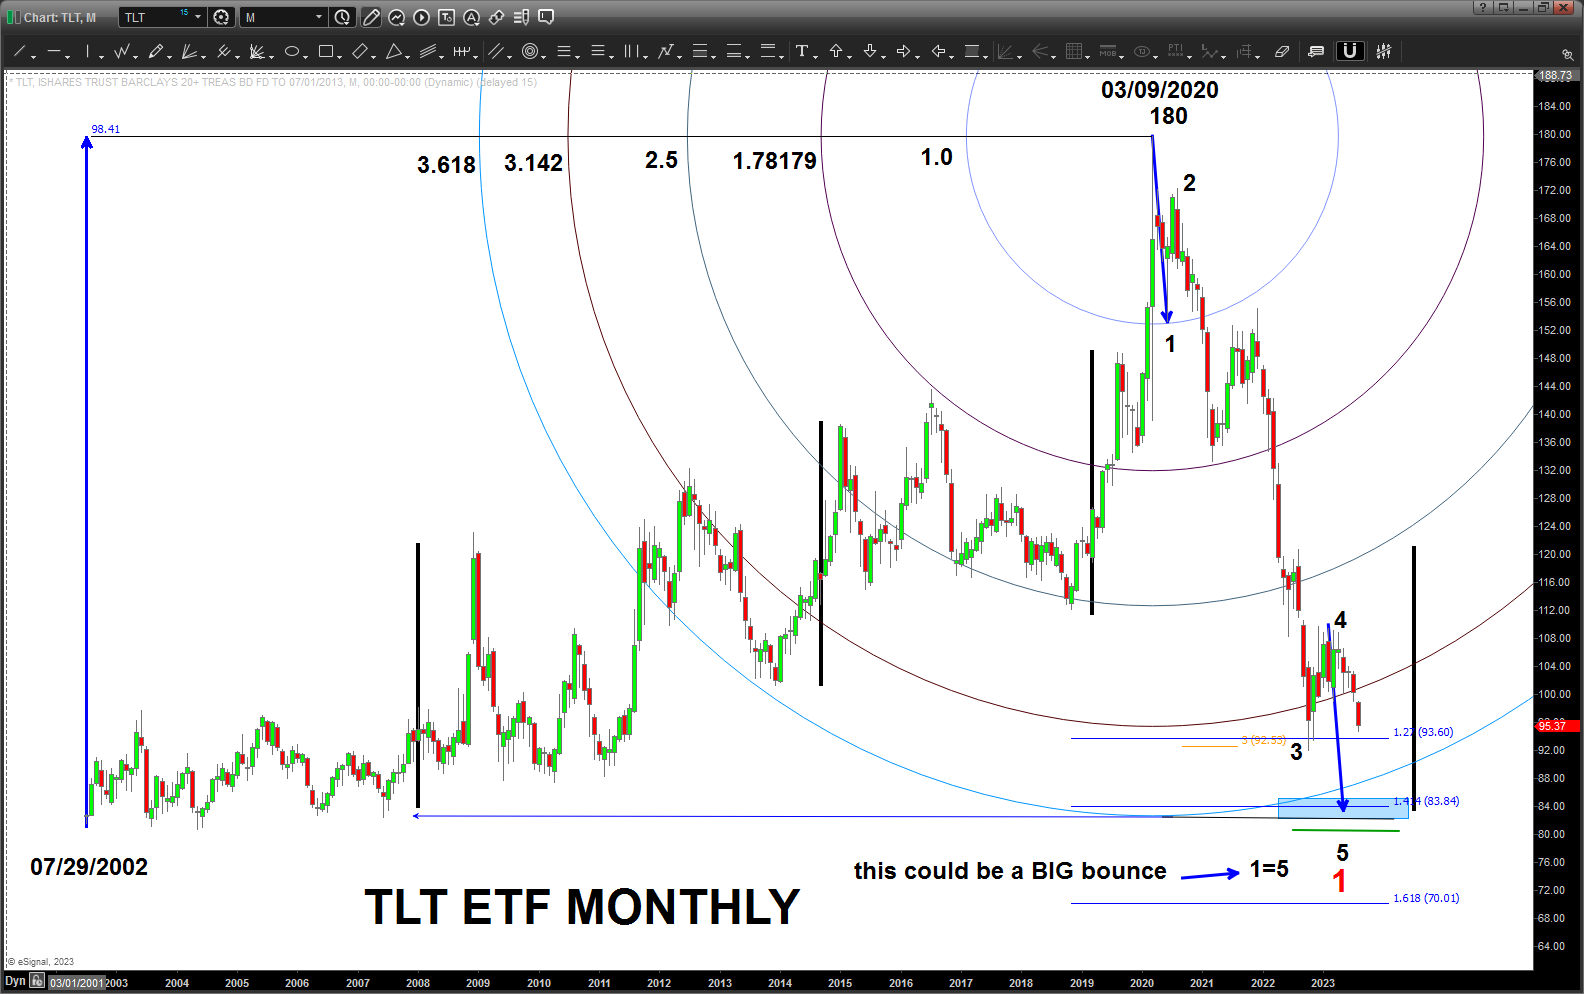
IF my count is right … (remember, my Elliott abilities are like my golf game 😉 then we have started another move down in bond prices but I do believe this is the 5th and final wave of just the first wave down … that being said, w/ all of the “noise” and “sentiment” w/in the market about “inflation under contorl” and the “Fed is going to Ease” and “blah blah blah” I believe this is a countertrend opportunity which could bounce PRETTY BIG just based on sentiment, alone.
For now, I have the 82-85 region as the first target to end Wave 1 down … multiple confirming but non-correlated techniques are showing this to be a very important zone.
I am long TBT (inverse of TLT) and plan on keeping that position open but will also go LONG TLT and have both a long TLT and long TBT position open at the same time. I sense that TBT will be held for YEARS as interest rates are not done for the long term, at least in my VERY humbled opinion.
I like this zone because, a lot of times when the wave 3 is extended you will find wave 5 = wave 1. (FWIW wave 3 was exactly 3 times as long as wave 1 down)
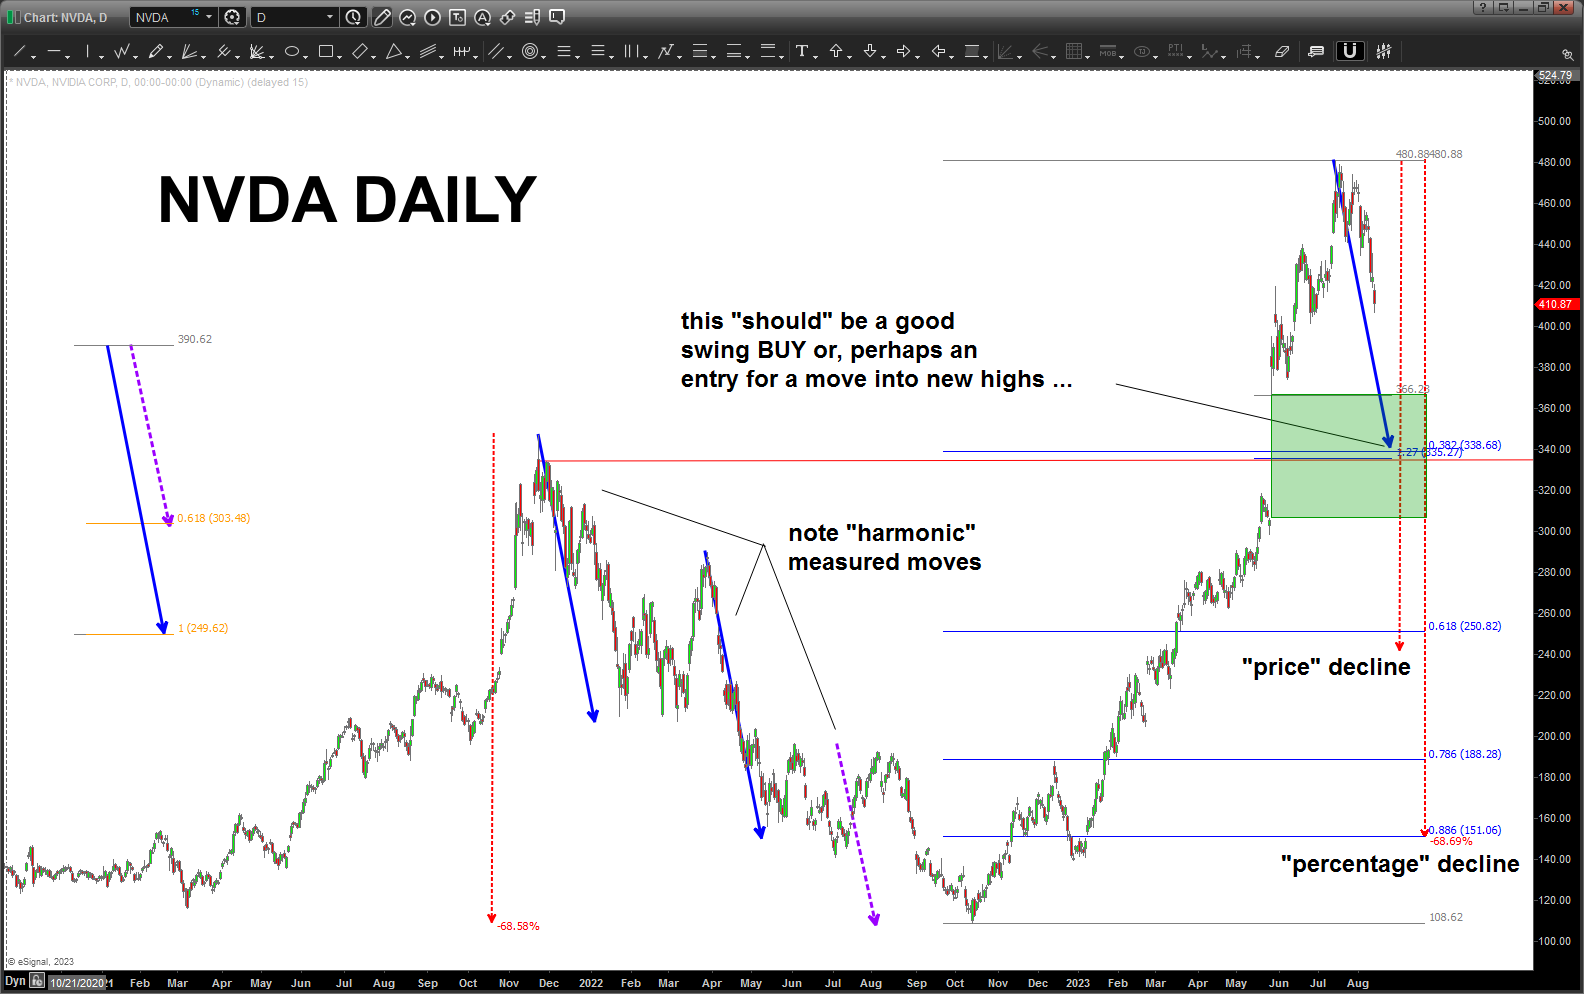
NVDA – August 11, 2023
Posted on August 11, 2023 3 Comments
Last post on NVDA: https://atomic-temporary-44460632.wpcomstaging.com/2023/07/17/nvda-july-17-2023/
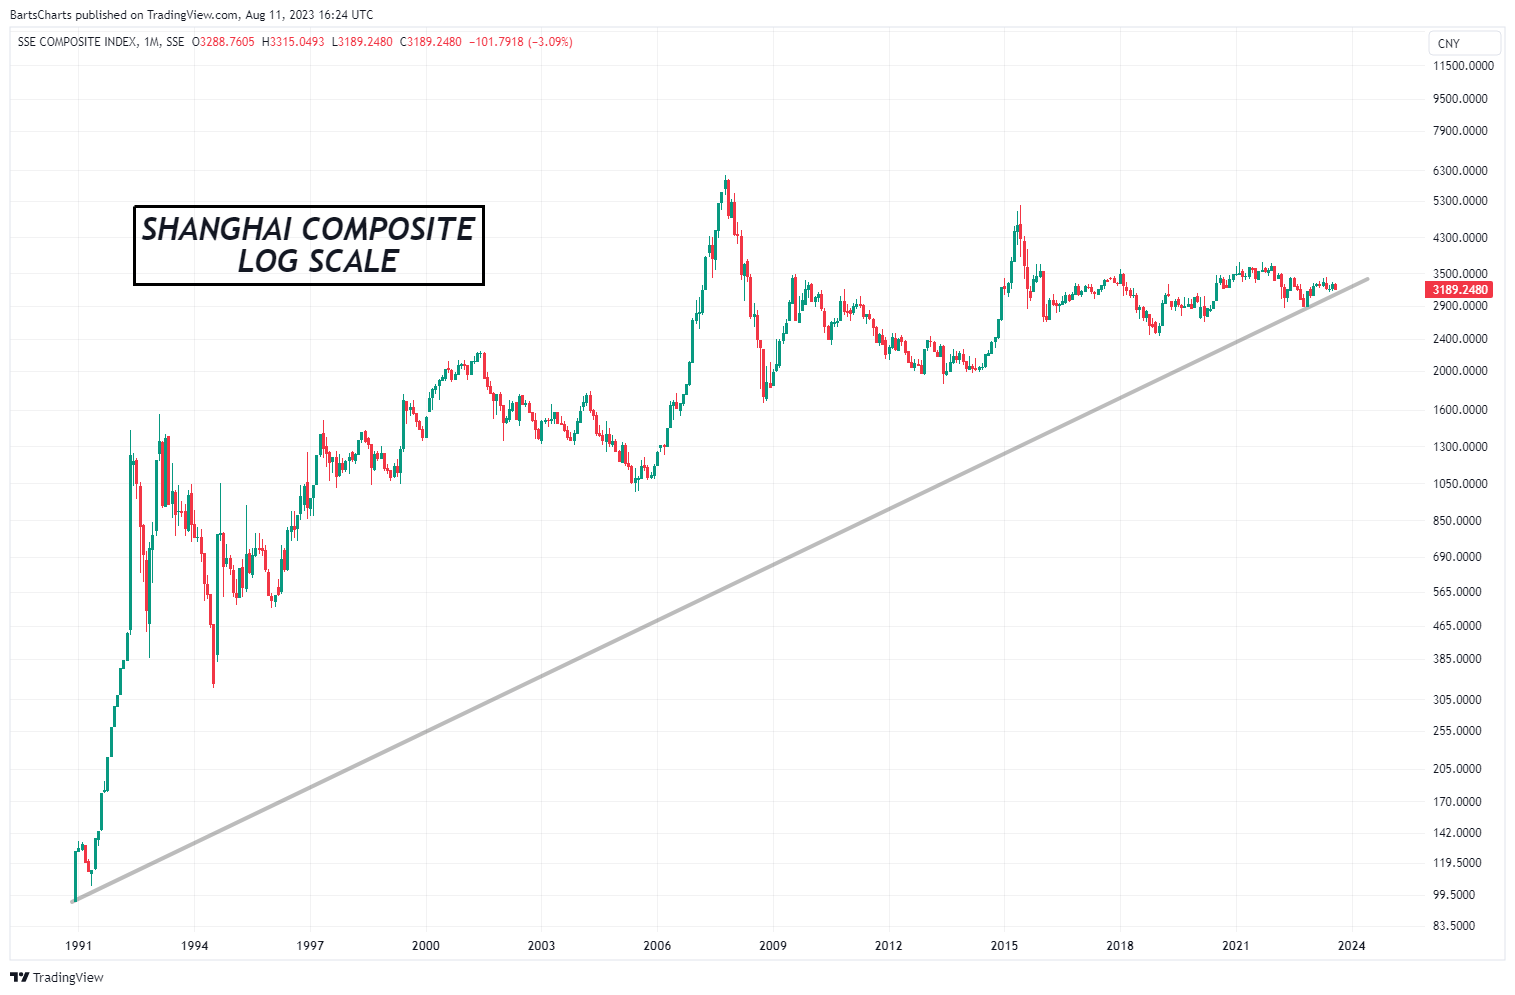
Shanghai Composite – August 11, 2023
Posted on August 11, 2023 Leave a Comment
Last post: https://atomic-temporary-44460632.wpcomstaging.com/2023/06/05/the-shanghai-dominoes/
As discussed in the last post, focused on China as they are one of the leading markets …
Down 2+% today and down 3% for the week.
Sitting right on the long term LOG trendline … believe if we break that trendline, most all else should follow.
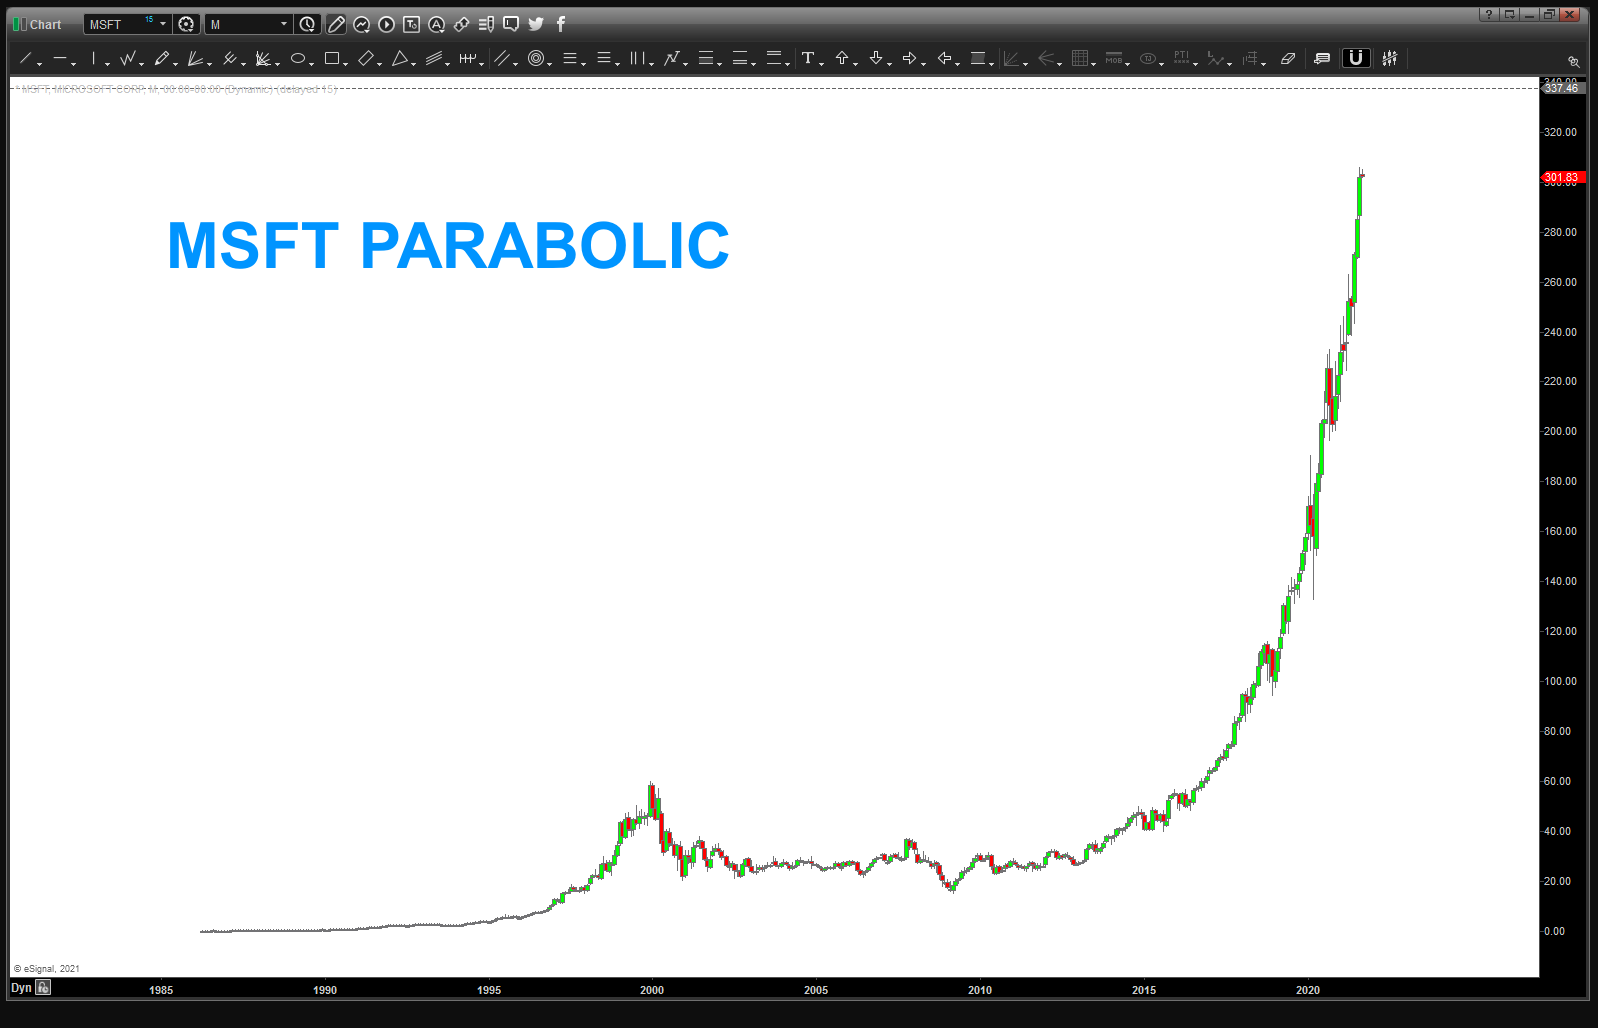
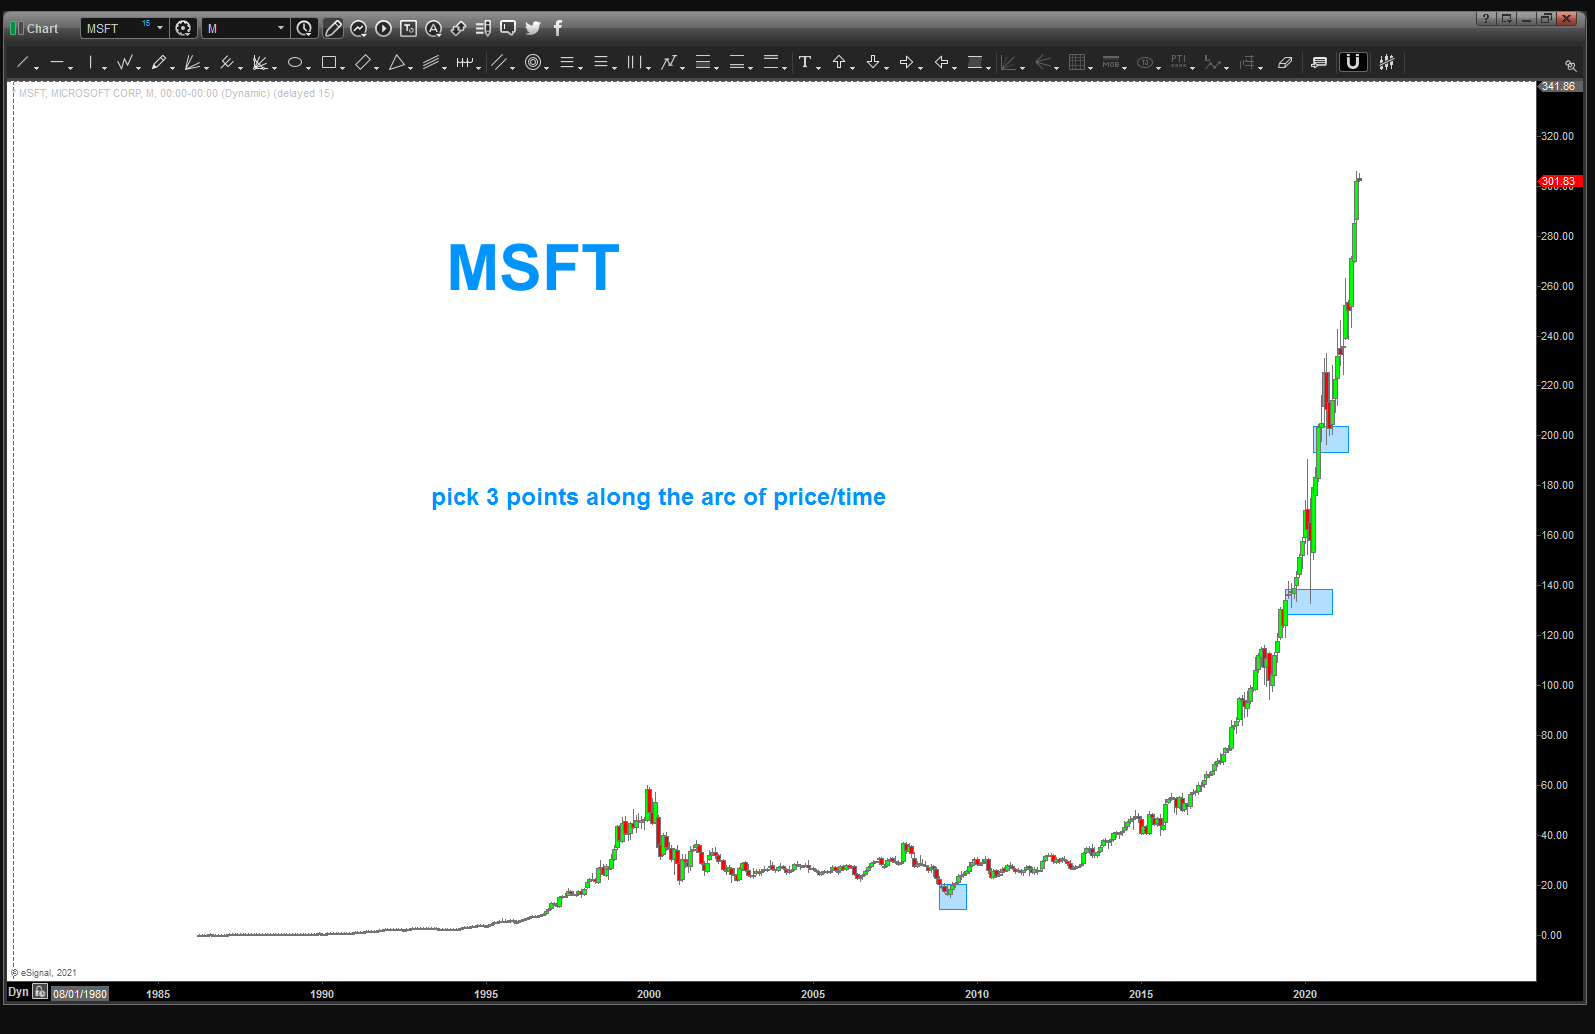
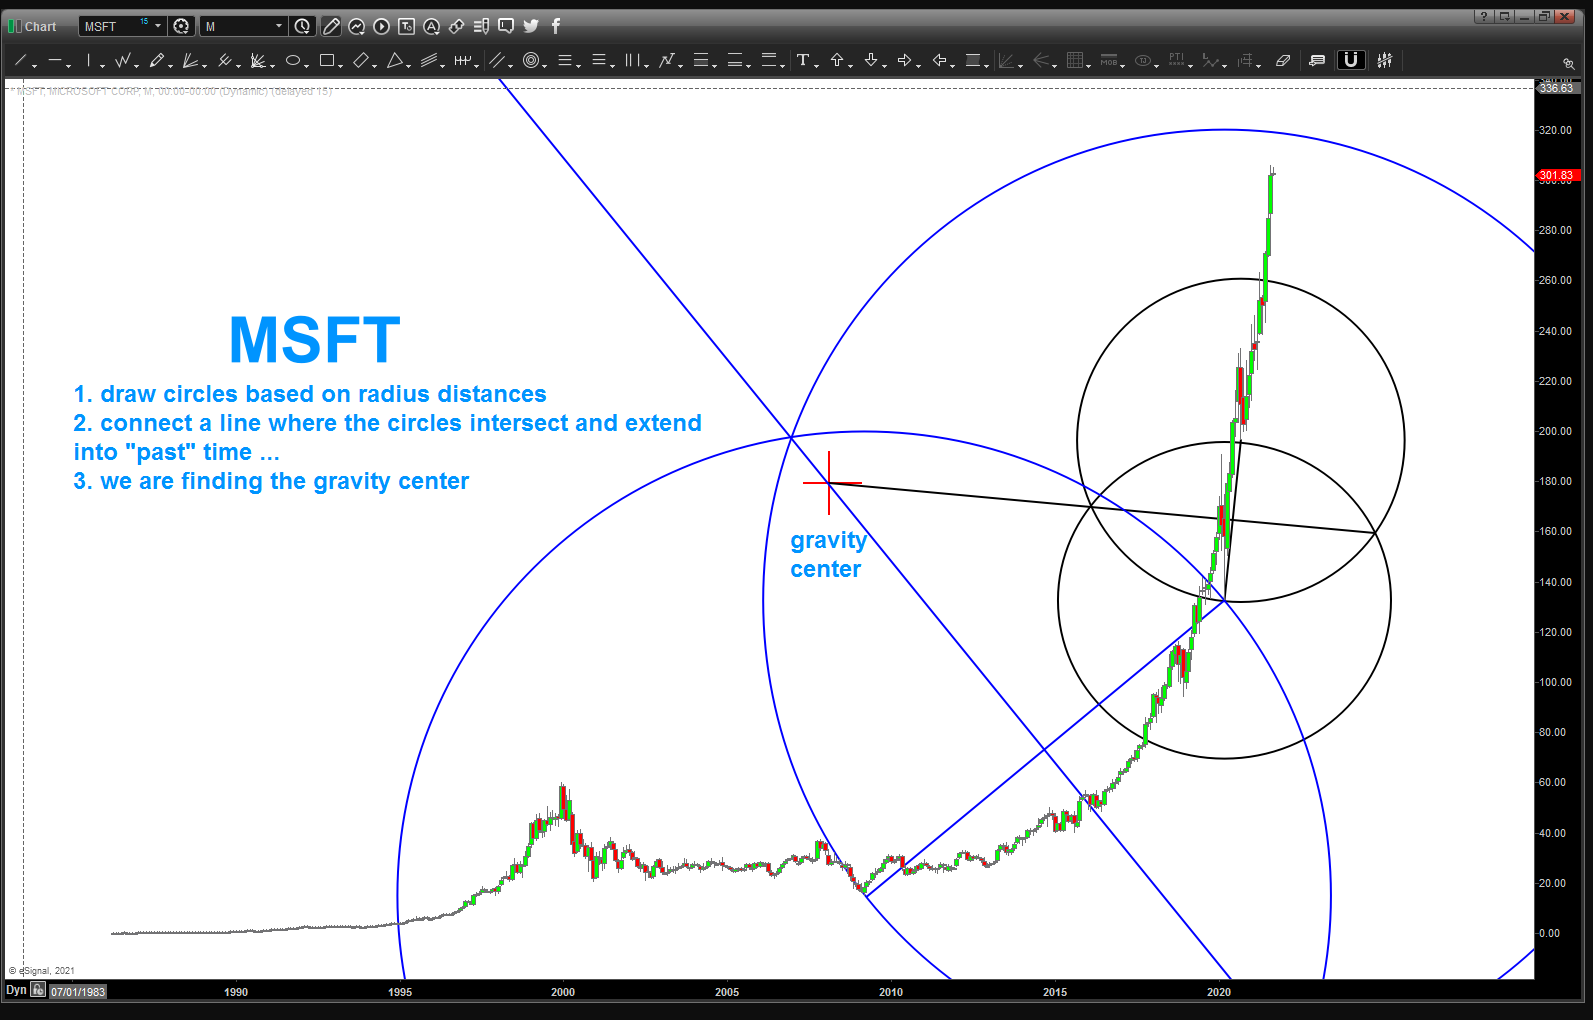
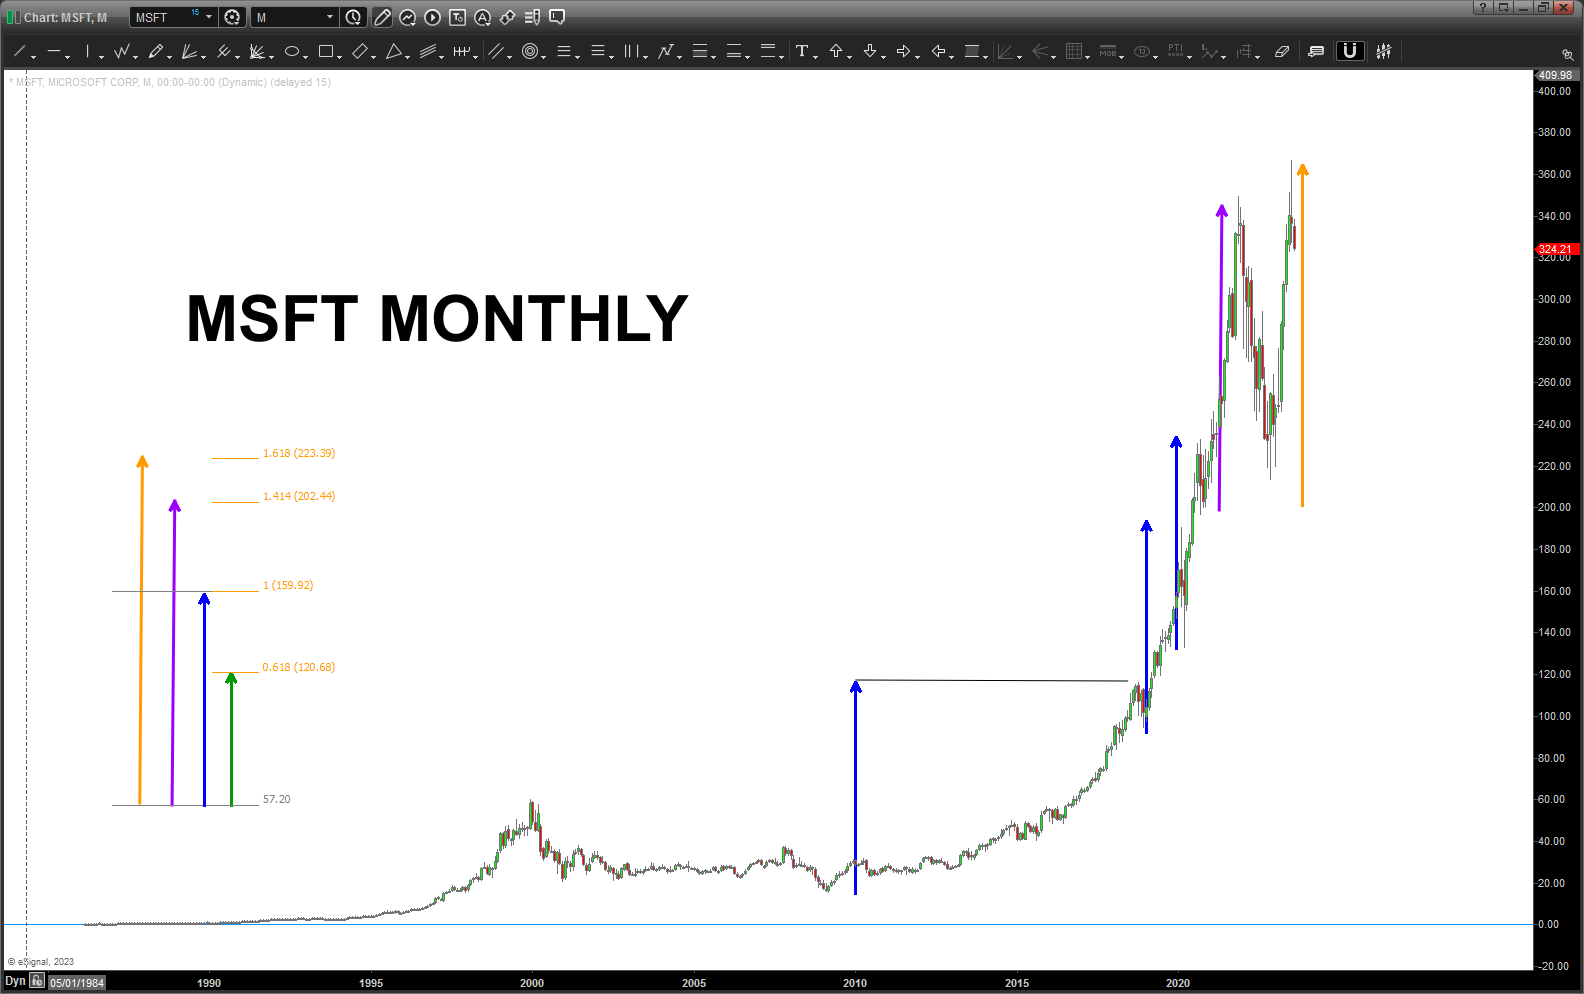
MSFT – August 08, 2023
Posted on August 8, 2023 1 Comment
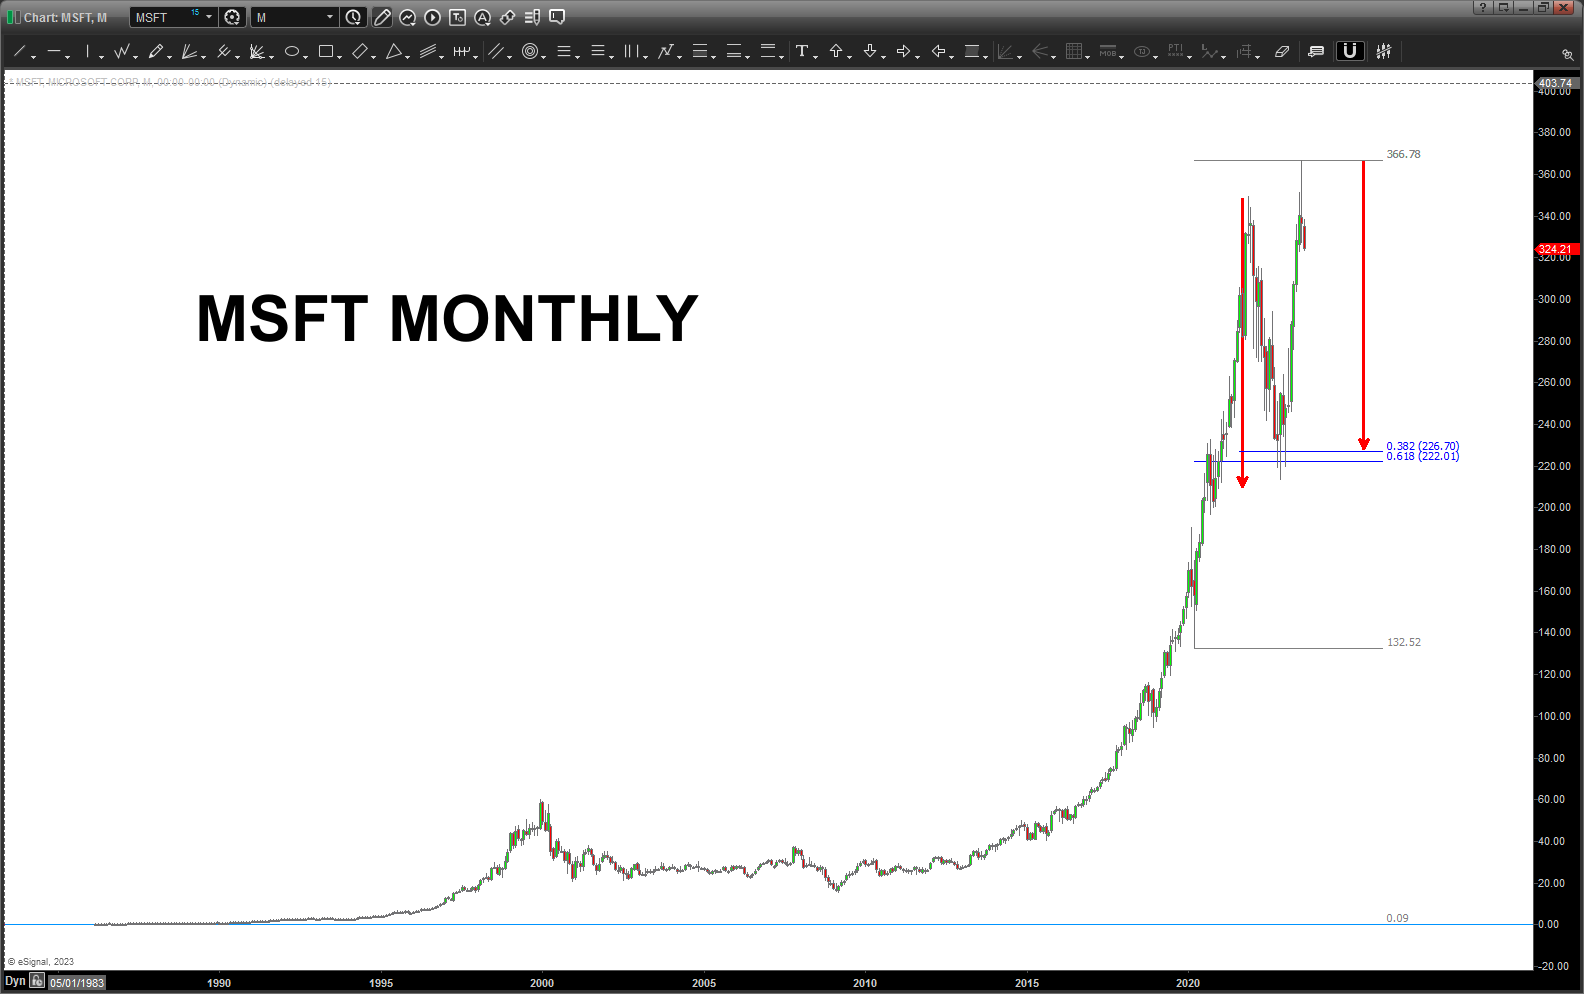
From the last post on MSFT: https://atomic-temporary-44460632.wpcomstaging.com/2021/09/01/msft-in-outer-space/
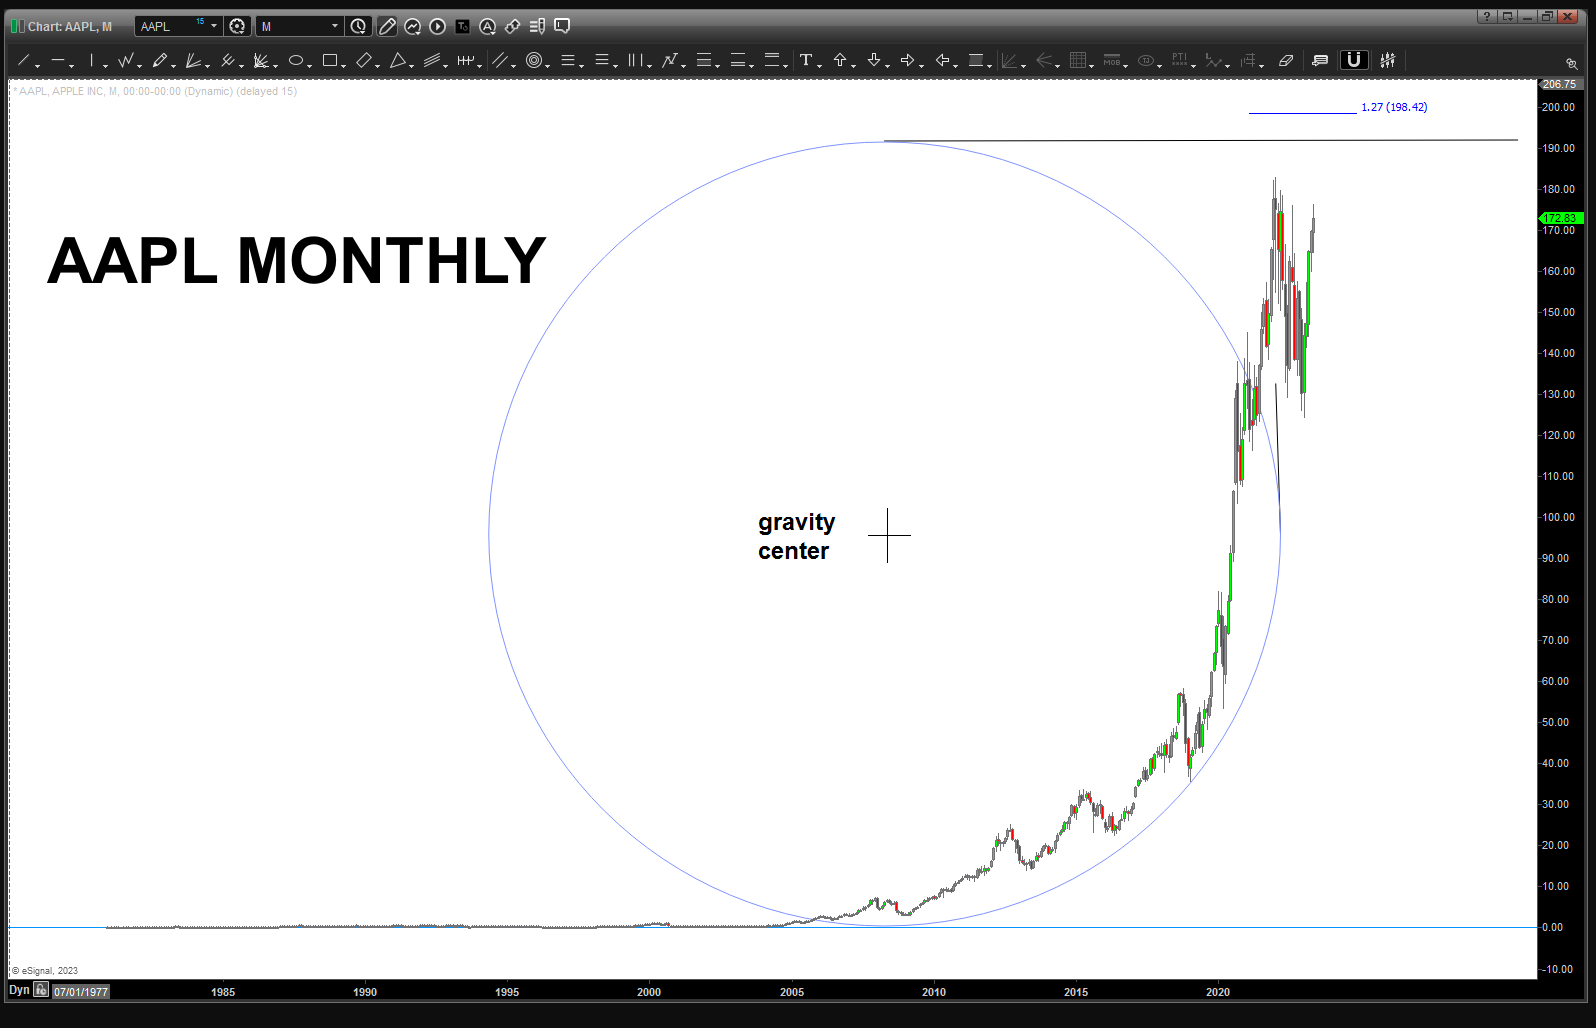
AAPL – August 7, 2023
Posted on August 7, 2023 1 Comment
Last post on AAPL: https://atomic-temporary-44460632.wpcomstaging.com/2023/06/27/aapl-june-27-2023/
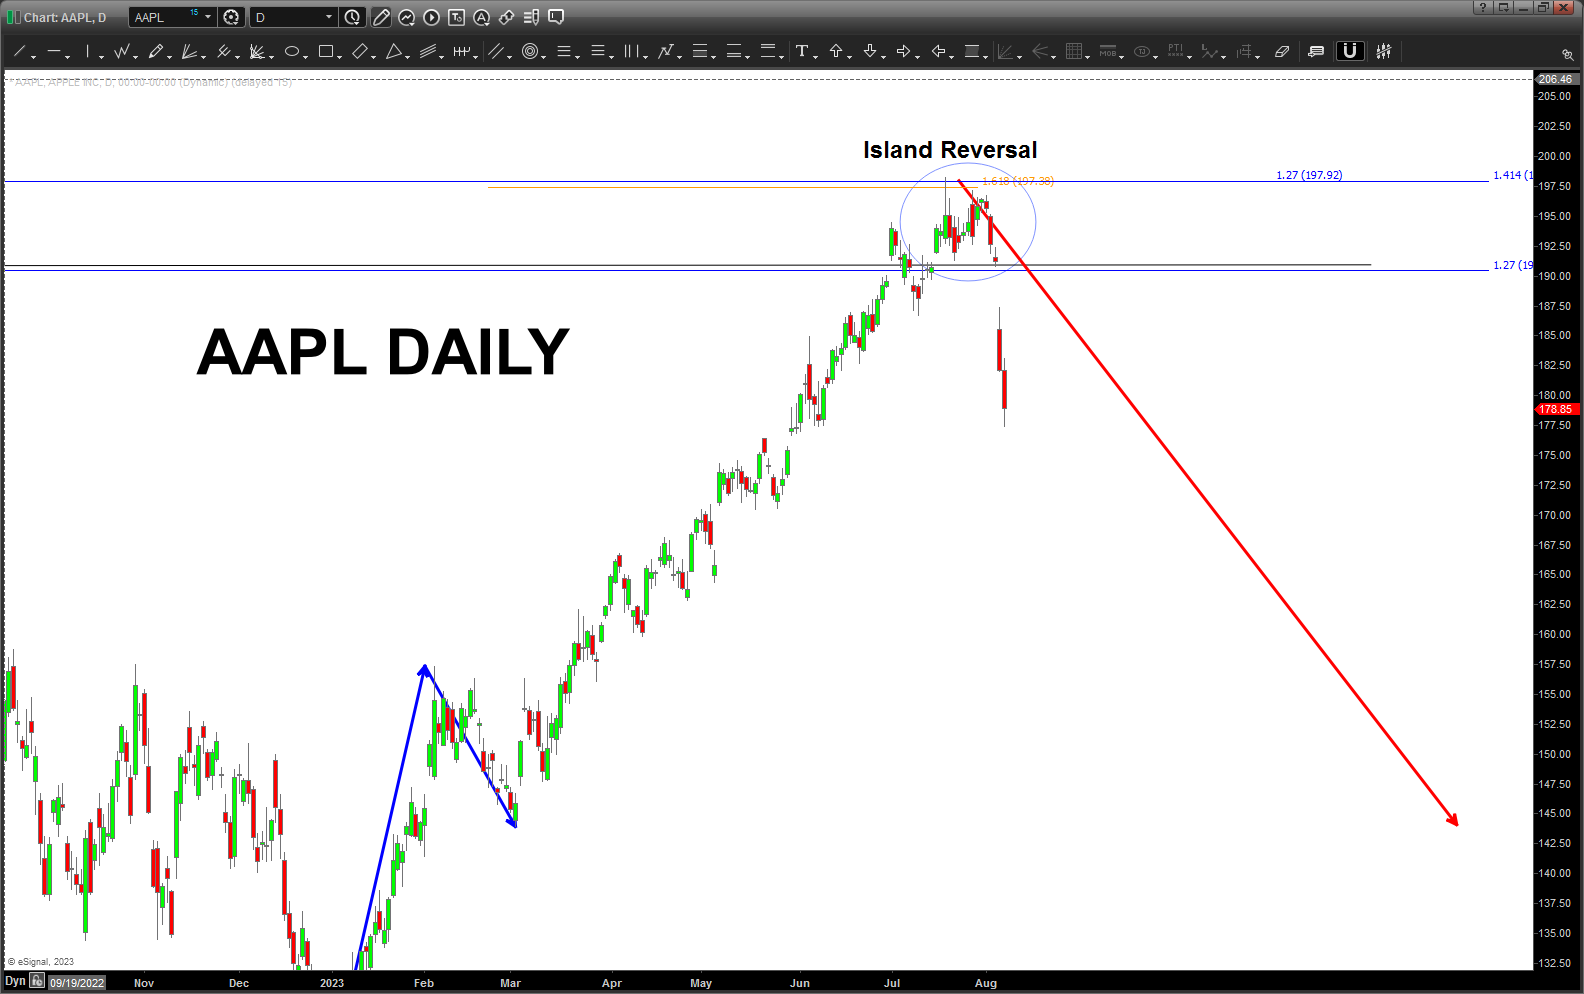
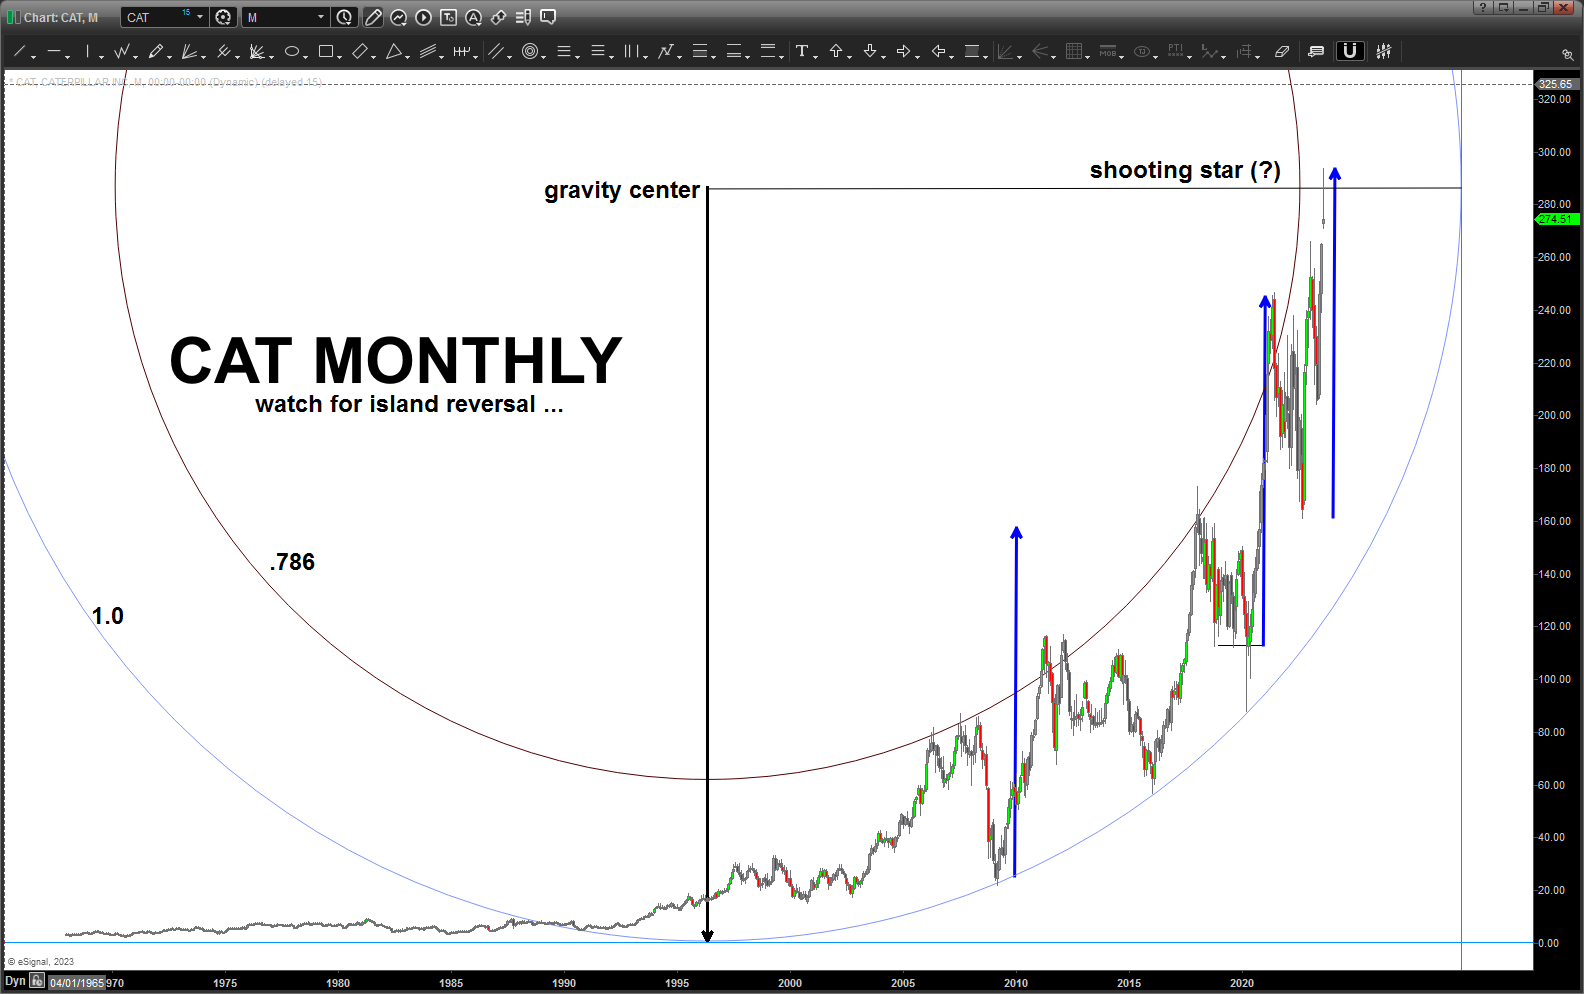
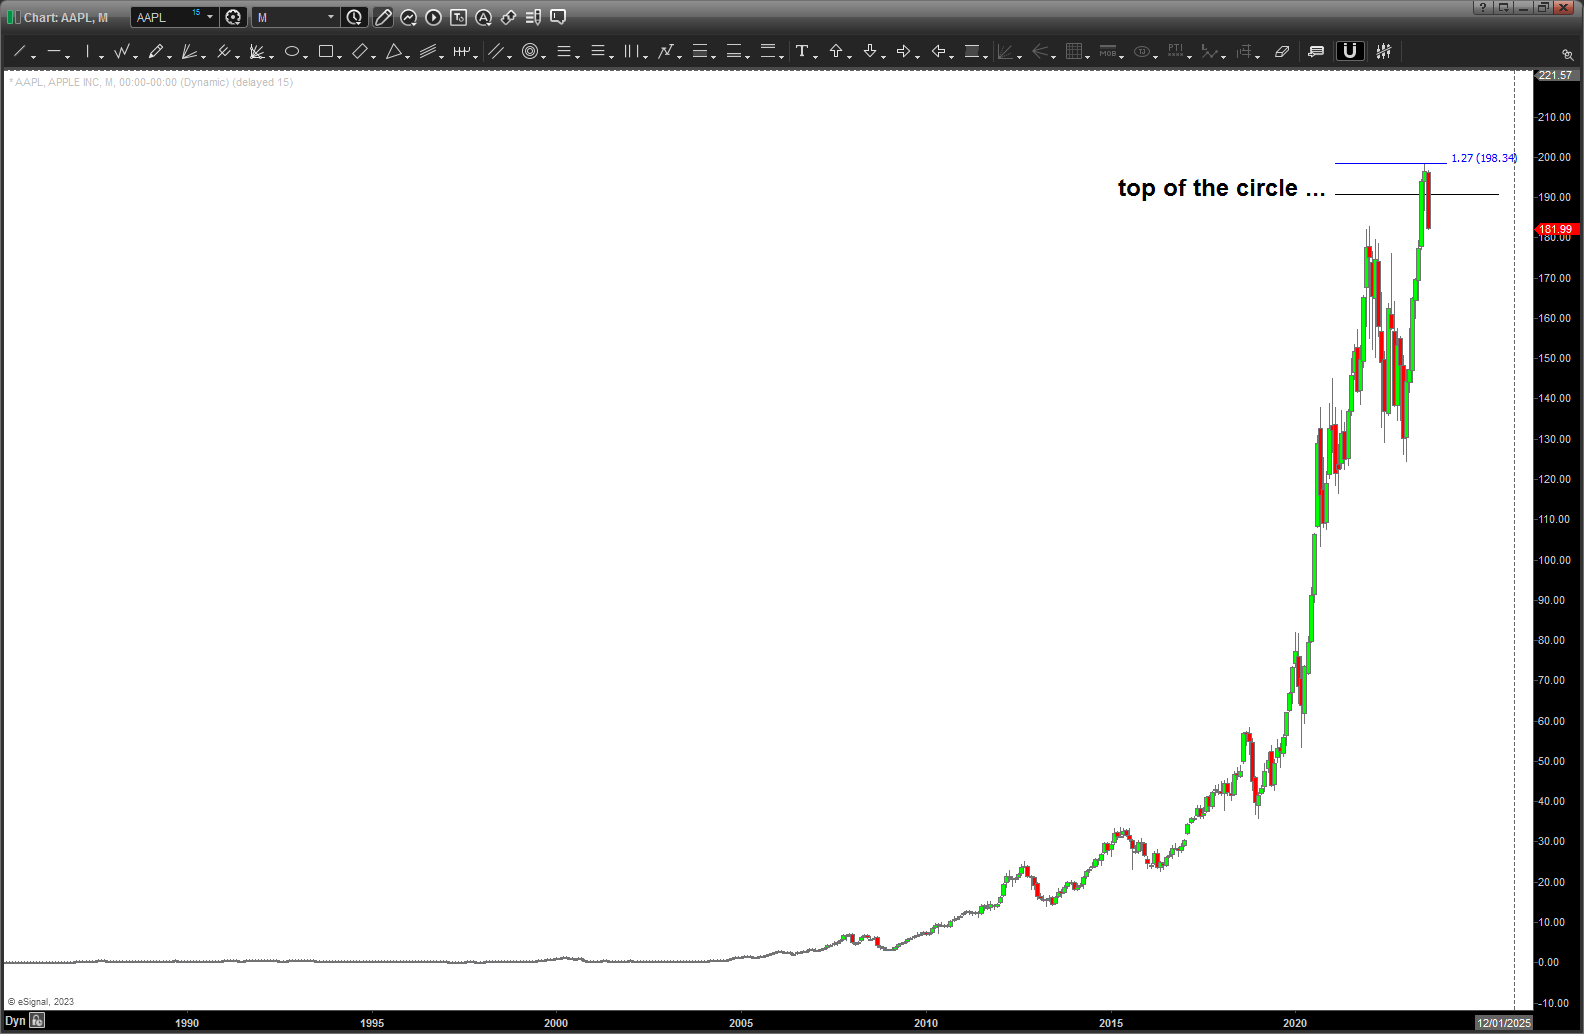
AAPL smacked into the 1.27 which was also a 1.618 price projection level and has broken down. In face, it has left an island reversal. An island reversal on AAPL .. who the what the?
This is a VERY interesting chart as I do think 2022-2023 was a corrective 4 … but I just don’t think AAPL is done yet so believe this pullback needs to be bought in the coming months but, for now, let’s watch the measured move area around 145.
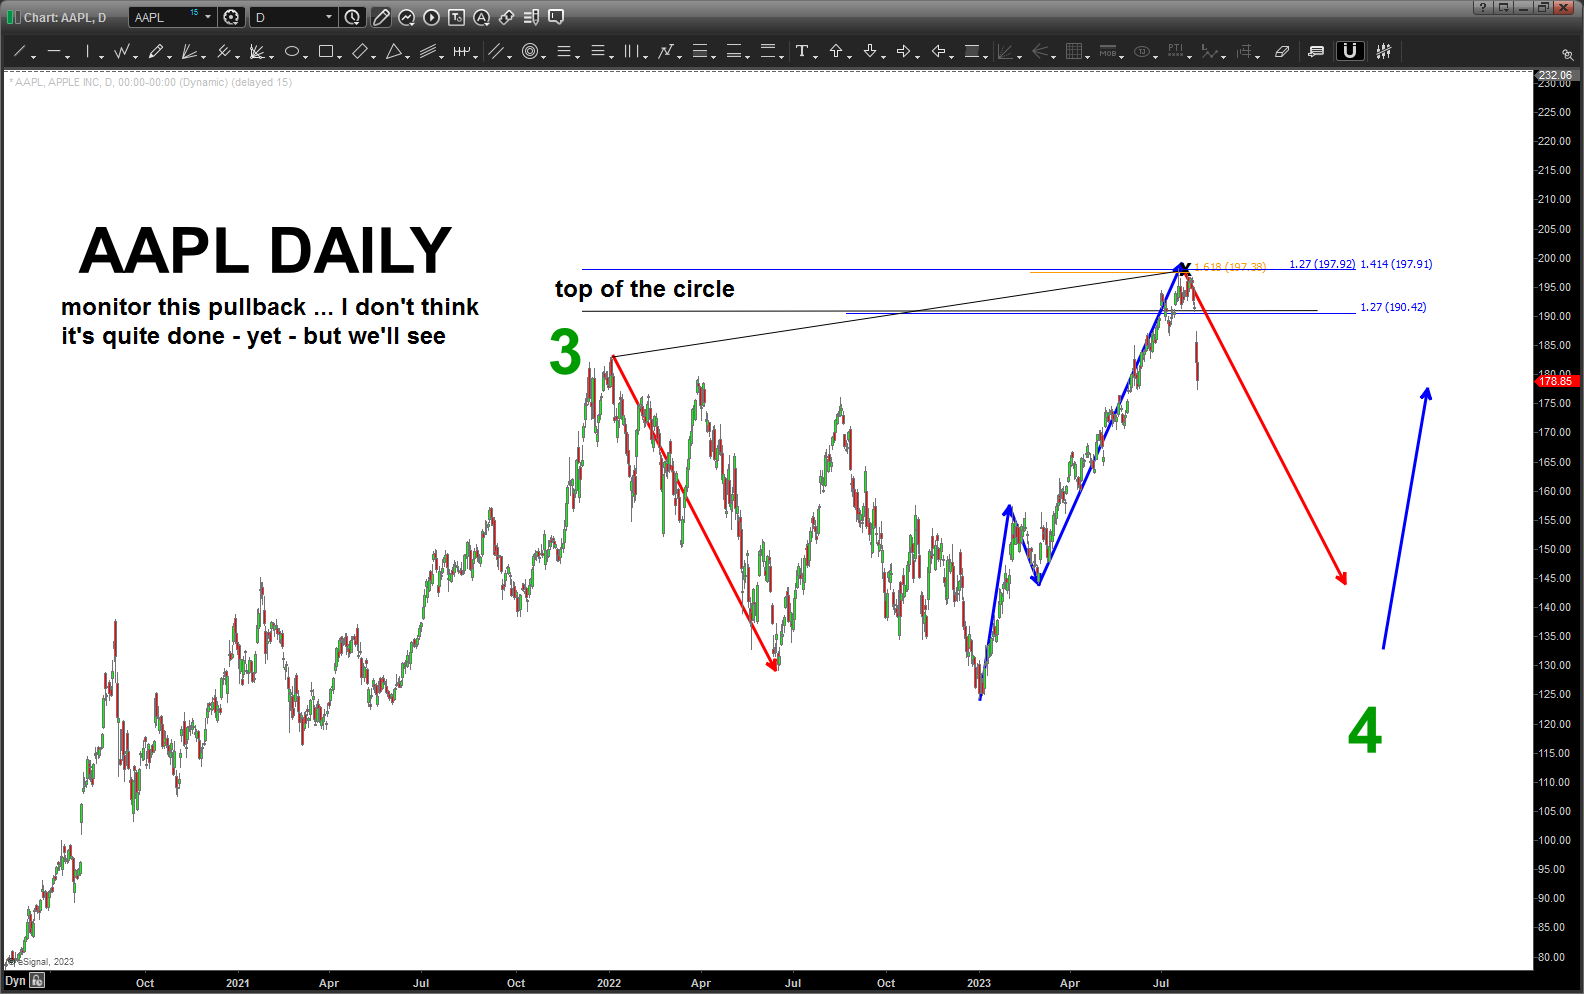
here’s a close up/zoom in of the Island Reversal: