NASDAQ 100 – January 21, 2024
Posted on January 21, 2024 Leave a Comment
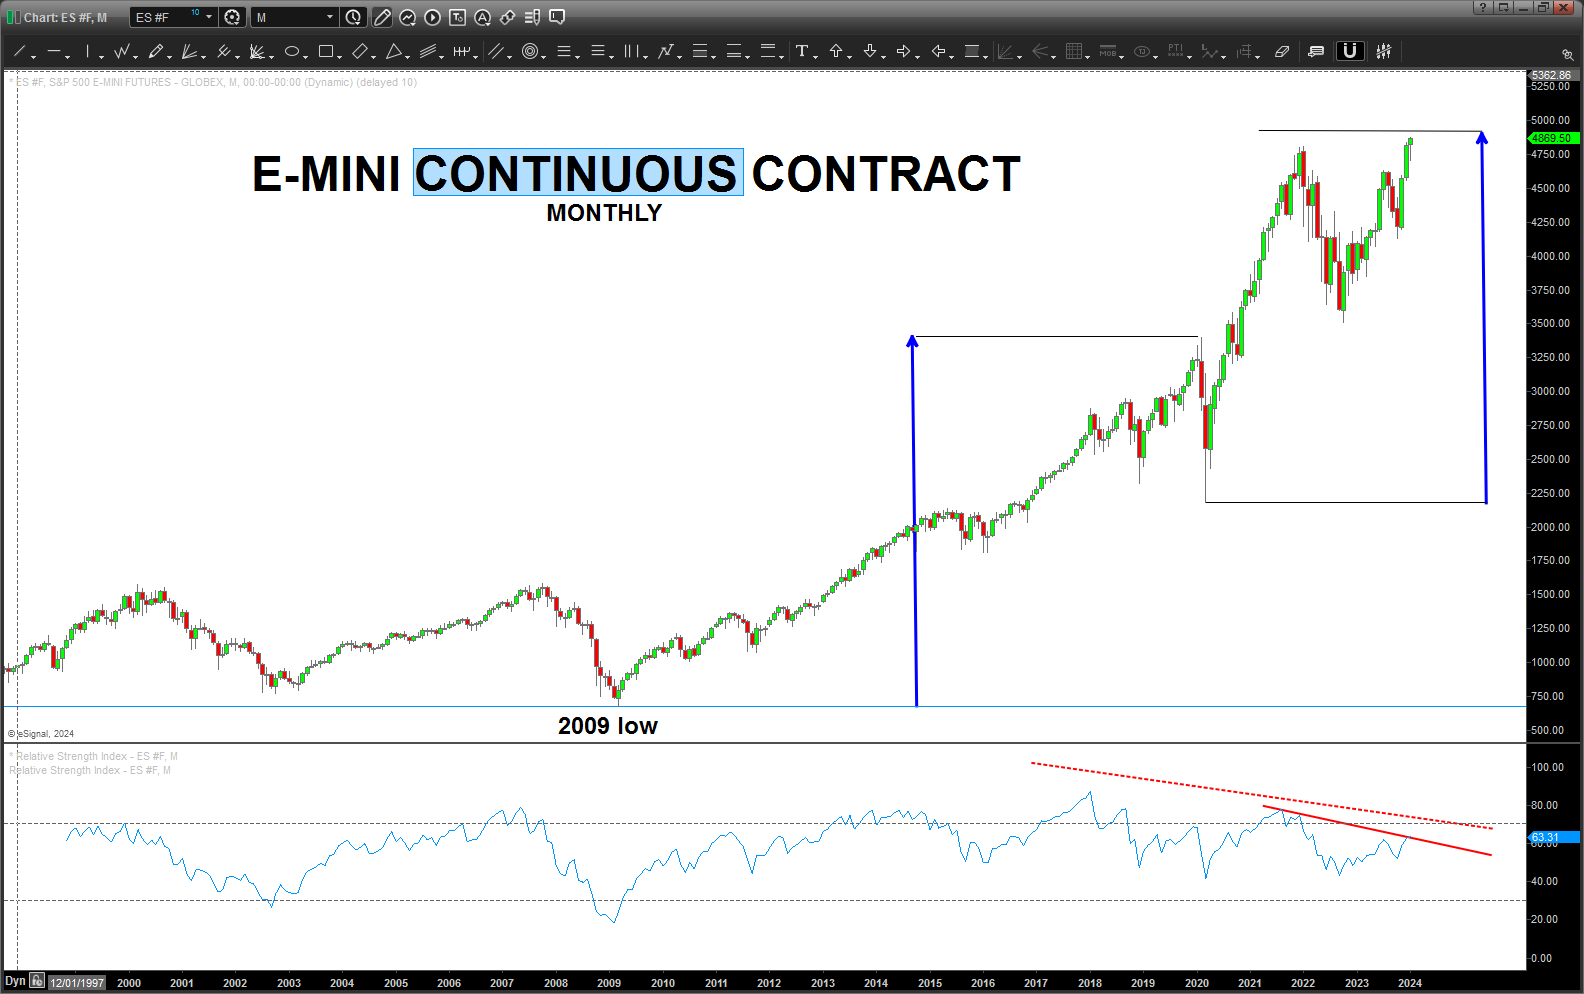
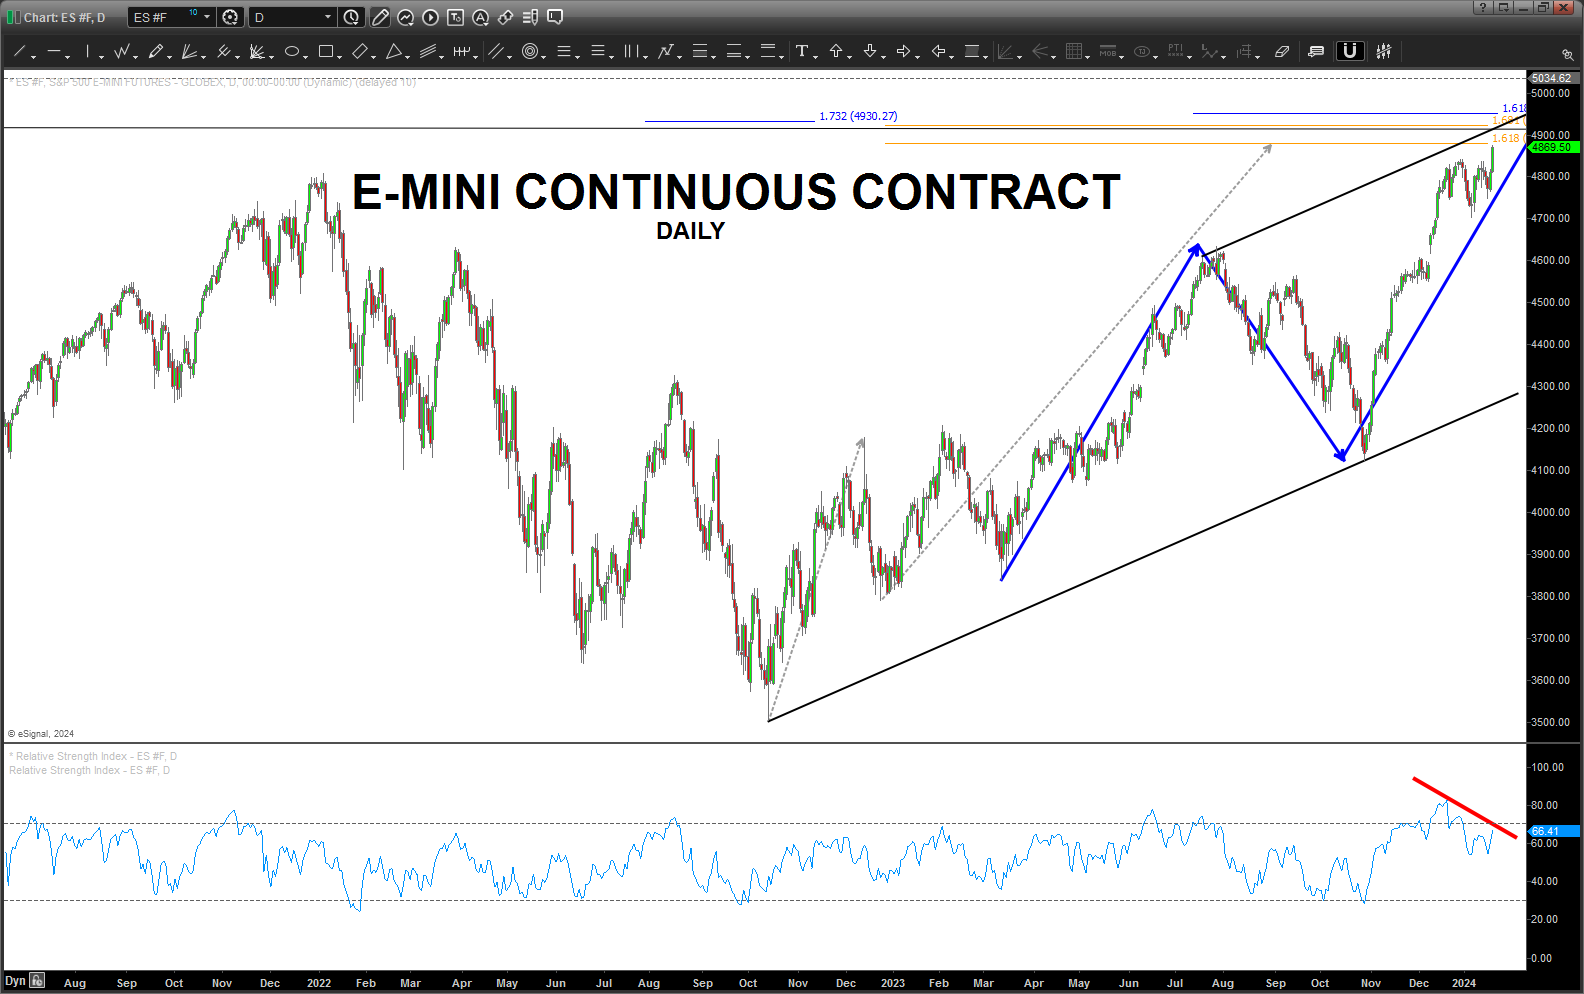
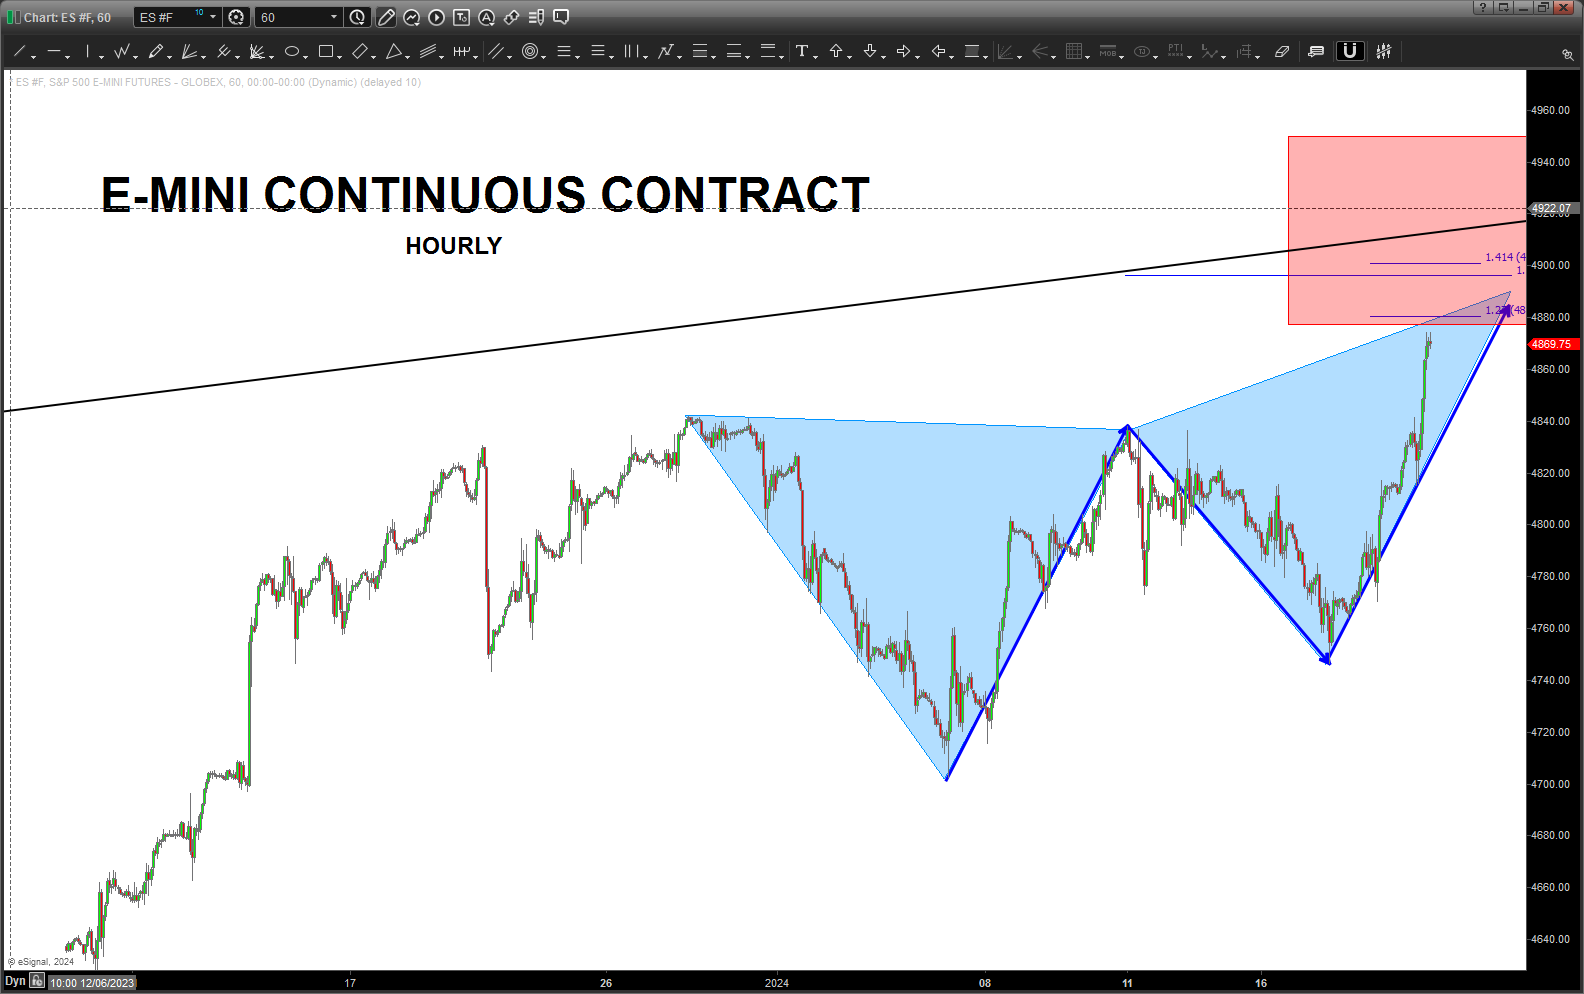
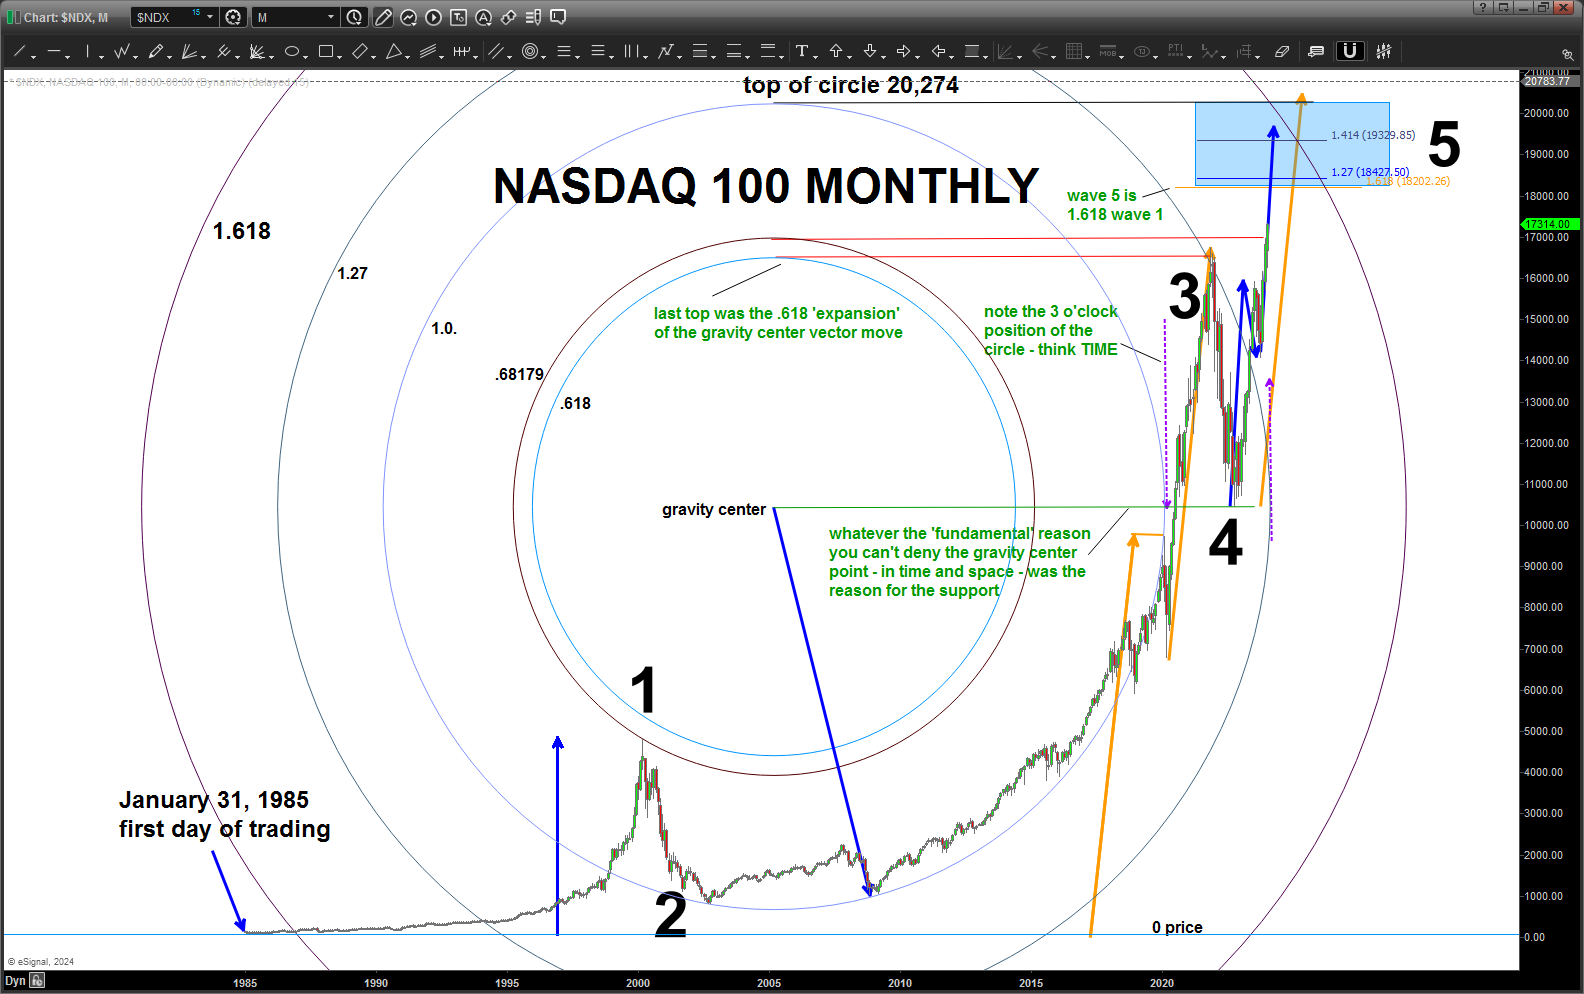
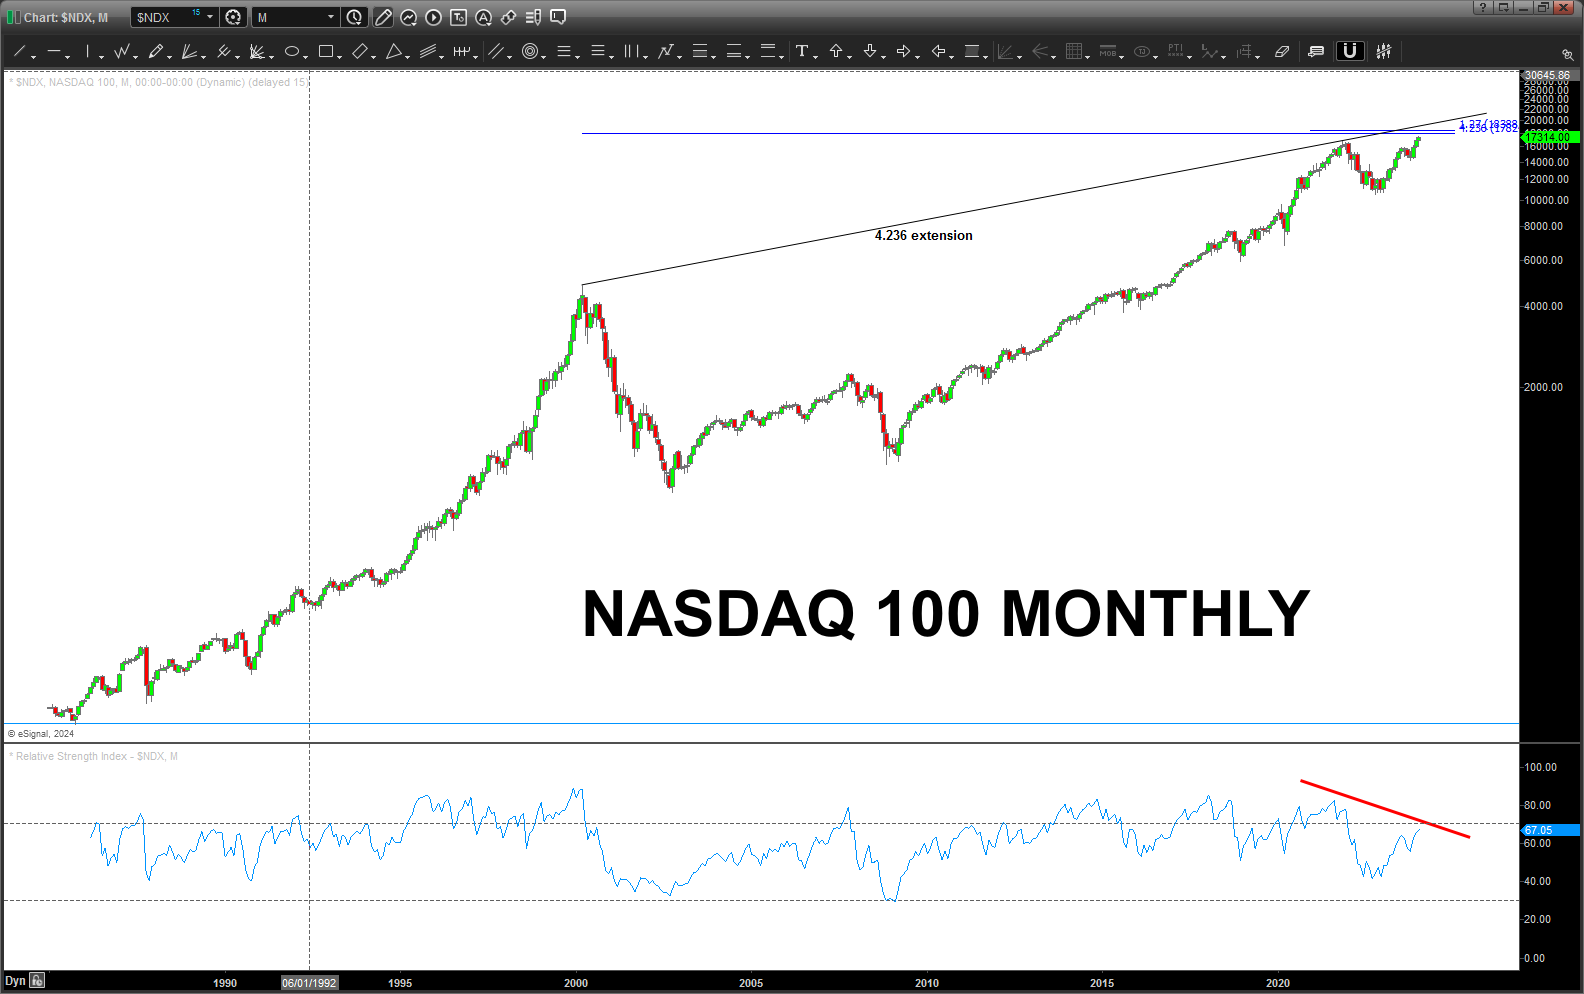
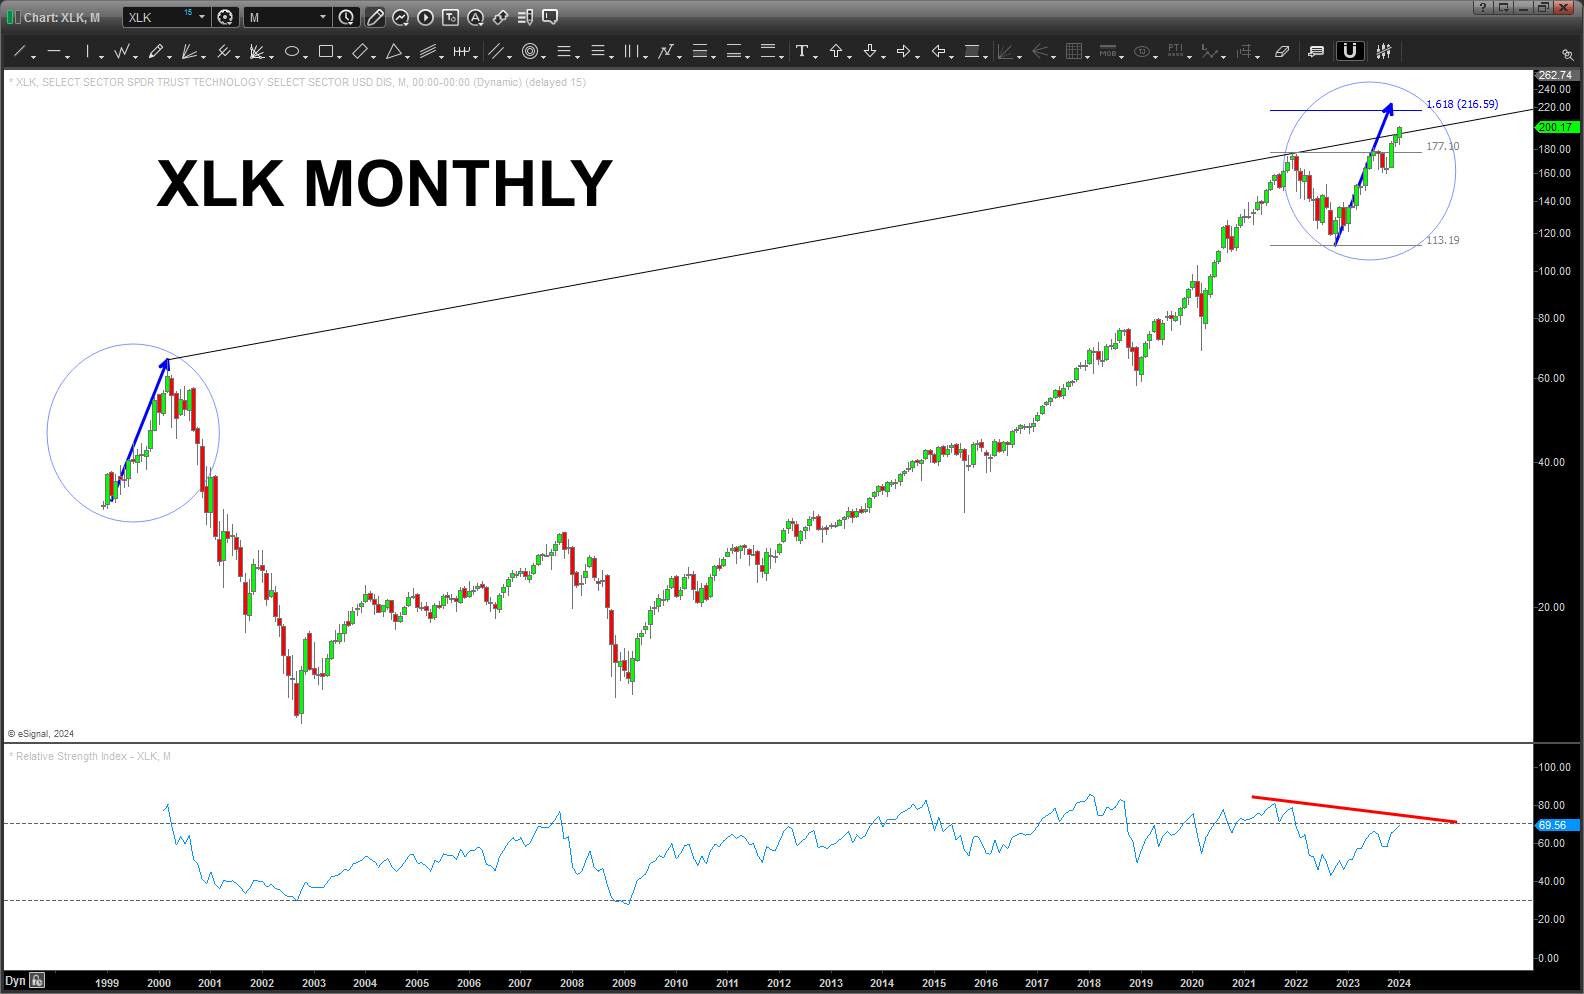
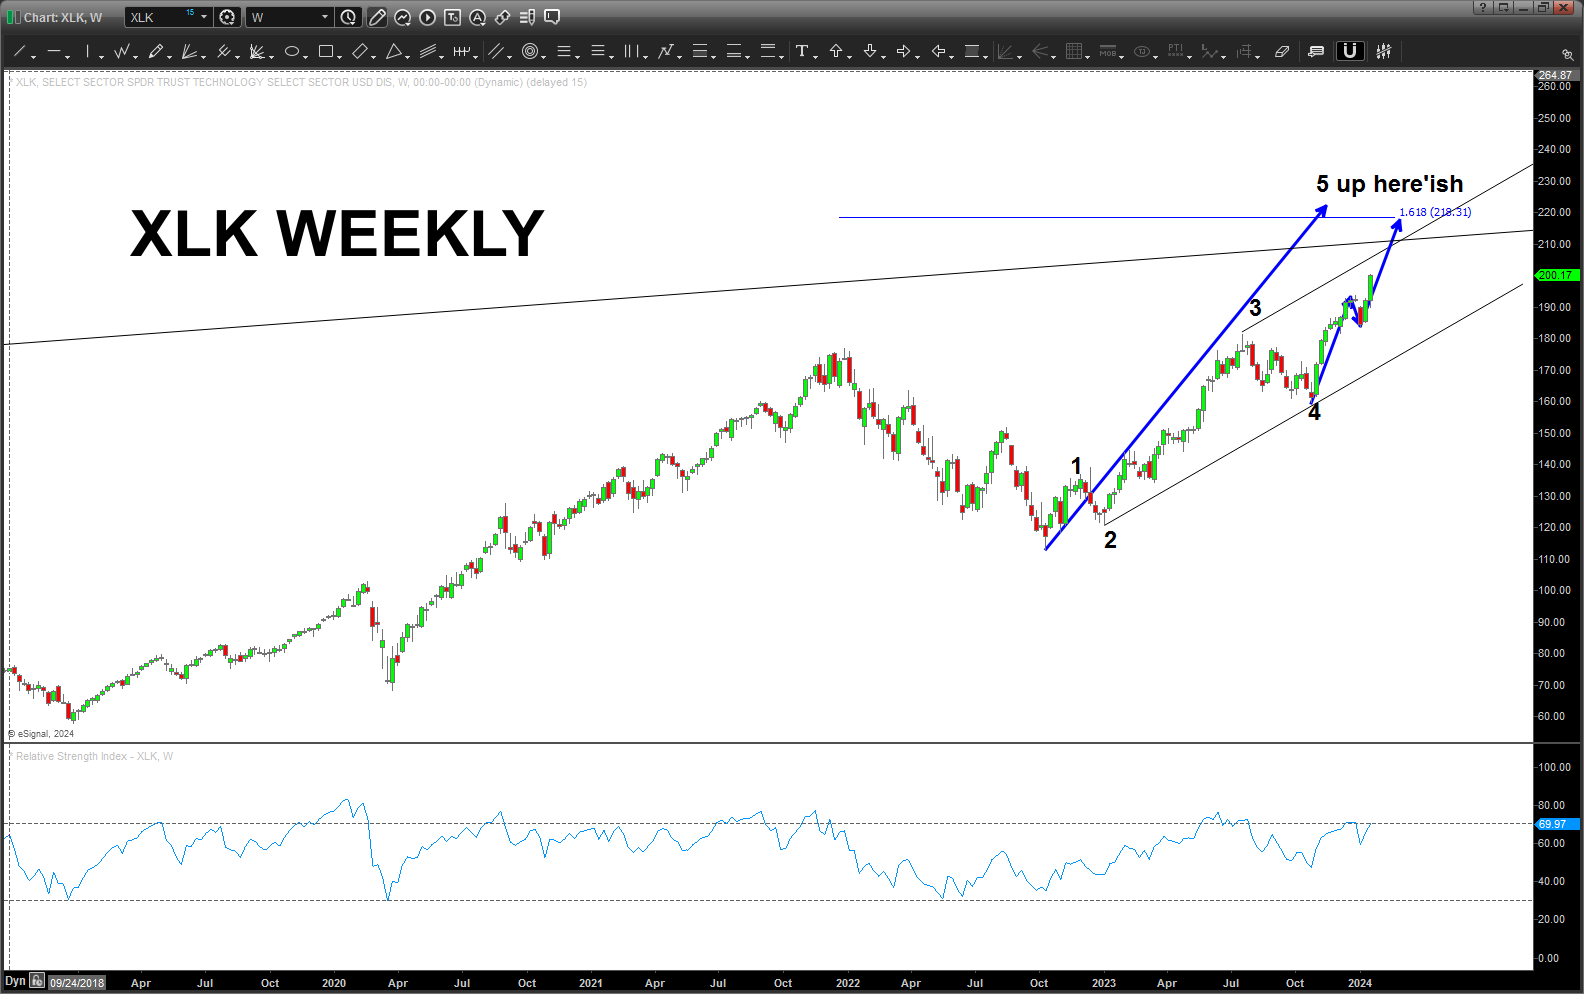
I’m still looking/watching for the Bank Sell Patterns to FAIL to get on board for the breakout to new highs. I’m suspect at this point … the JNK bonds haven’t broken thru the ABCD, either. The Russell is a dog …
Who knows, something just doesn’t feel right about this move …
Lithium (LIT) – January 18 ,2024
Posted on January 18, 2024 8 Comments
Last post on LIT: https://atomic-temporary-44460632.wpcomstaging.com/2023/09/16/lithium-lit-etf-sept-16-2023/
Well, look at that, sure looks like we need to get ready to deploy some capital and buy LIT …. it’s been getting hammered pretty good, so wait for a SRC on the weekly. Conservatives (me) can go for a close above 52 and then look to hold into the high 90’s and perhaps above 100. Not a bad risk – reward.
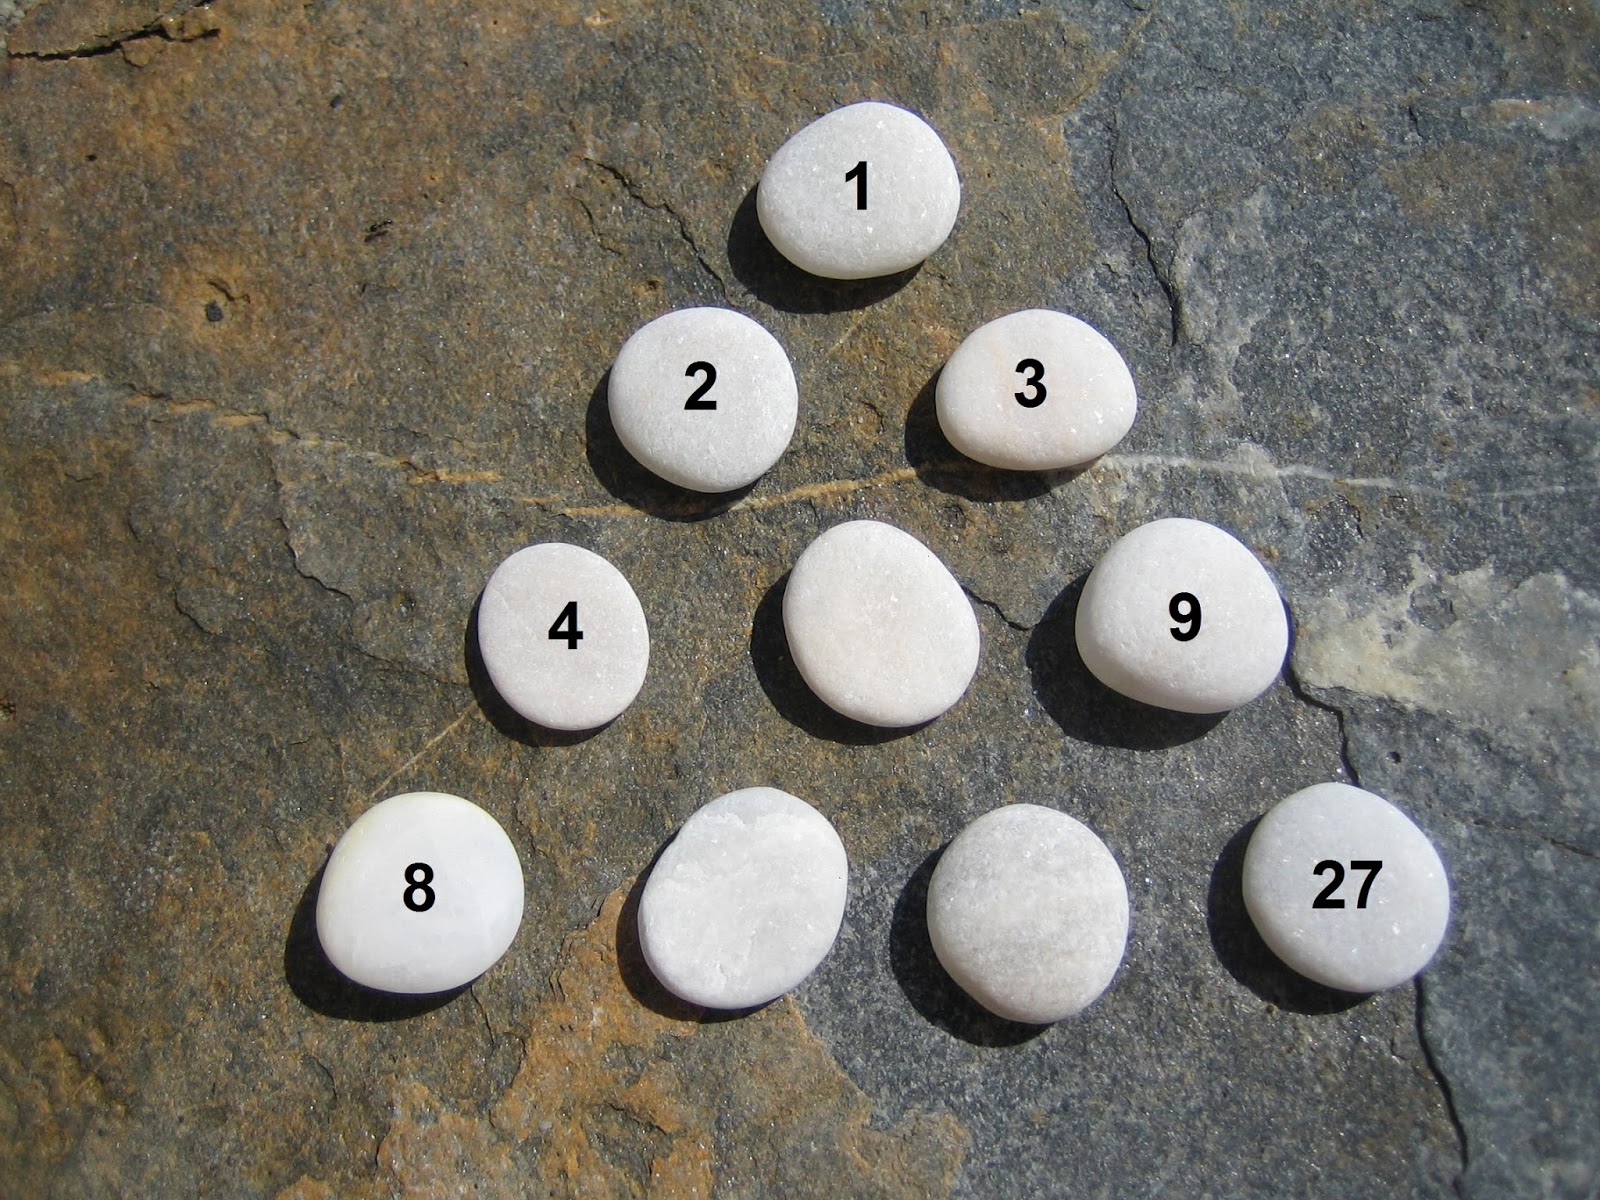
Had to post this here. This simple arrangement of rocks pictured below, based on Plato’s World Soul displayed as Lambda by Nicomachus, explained to me in the book “The Plato and the Quran” is just mind blowing important in the reality we live in … and sometimes these PATTERNS and the numbers are “easier” to see when I just kick back and relax and read.
Taking a look at LIT, I just “saw it.” All the following mumbo jumbo means nothing because PRICE is king and we stop out below 40 either way. Discipline Bart, Discipline.
I’ve been a road warrior that past couple weeks and I have spent pretty much every moment, when sitting in my window seat (broad shouldered), playing very spiritual music, along with Brain Tapping(sometimes twice a day) and also journaling– READING. I believe it opens you up to “see” stuff.
I’ll just leave it at …
How many books are there in the bible?
I used to think this all the time, the more you are around numbers as I am :), you realize NOTHING is random and especially the ancient texts that define our humanity. Finished the “Epic of Humanity” on this trip also, and, let me tell you, when read together in such a short time — WOWZA.
To get back to the question:
There are 39 in the old testament and 27 in the new testament.
Those numbers IMMEDIATELY pop out at ya down the right side of the rock formation.
“Even the very hairs on your head are numbered. ” Hmmmm …
An example:
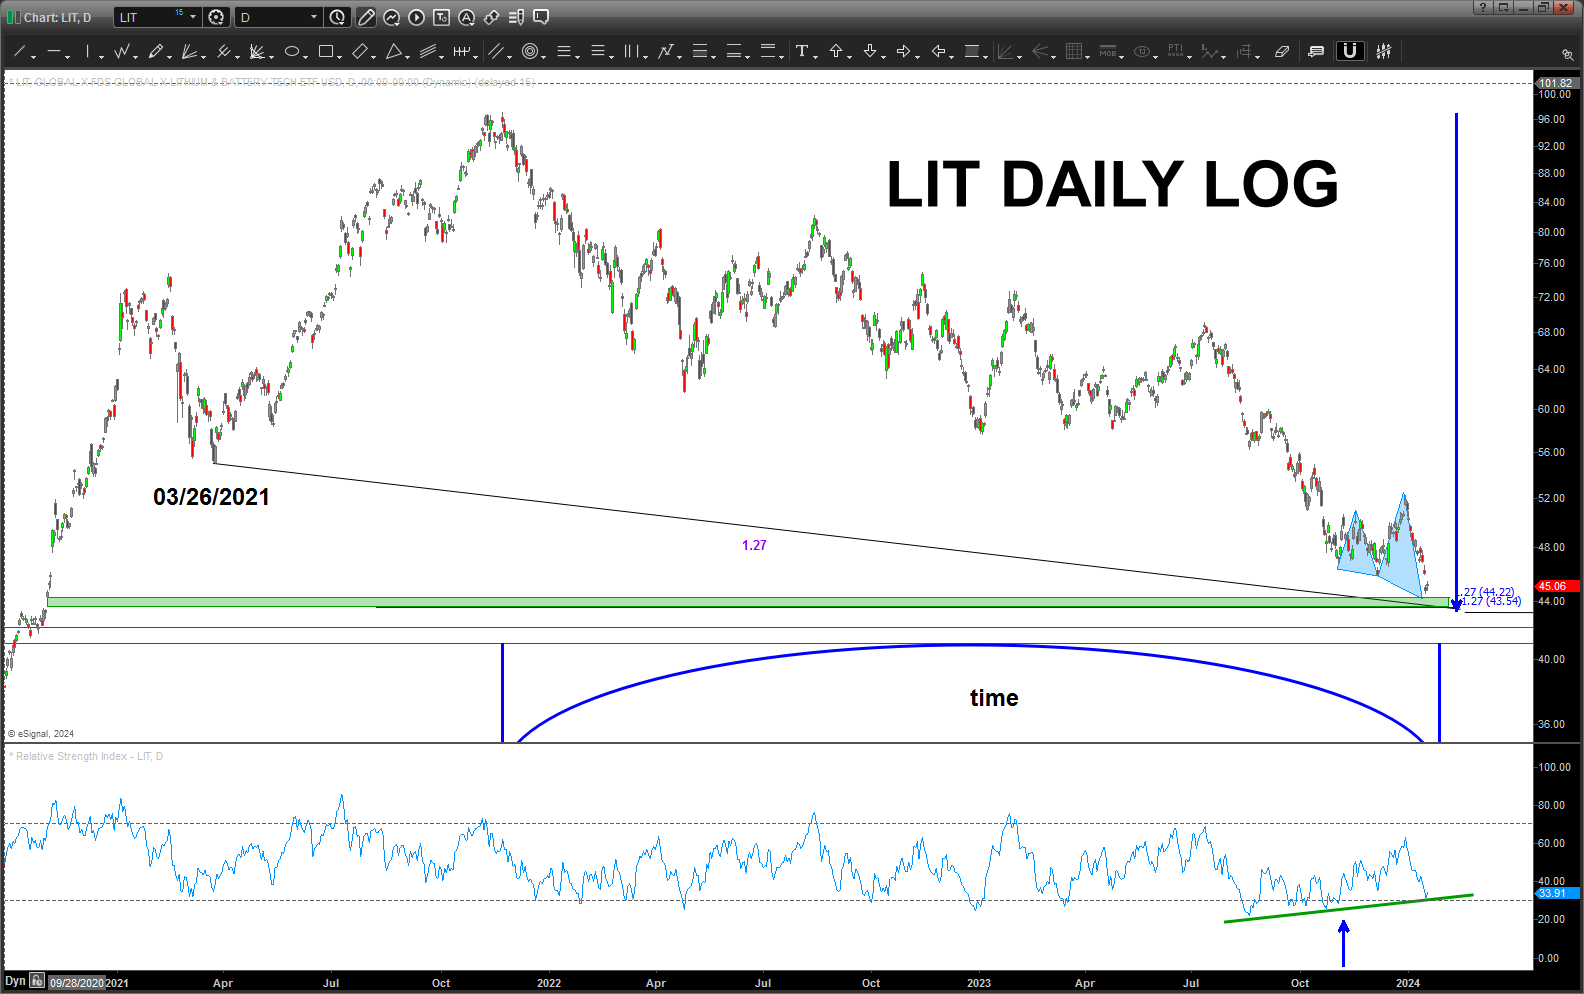
1.618, the Golden Mean, arguably one of the most important numbers in the universe, is incredibly important. And, if you look at the chart below, you will see the purple 1.27. That’s the square root of 1.618.
So …we use square roots and the inverse of those square roots and we are going to deploy capital on that “number” (vibrational intersection based on numbers) so anything “harmonic” w/ that is also IMPORTANT.
Take this number (3927) and MAKE THE OUTWARD NUMBER (7) THE INWARD 37 and the INWARD NUMBER OUTWARD (29).
We now have 3729 which signifies to GO INWARD and MAKE YOUR INWARD THE OUWARD MANIFESTIONS OF YOUR REALITY.
“As above, so below” ….merge the two numbers (divide the into each other), which represents the marriage of the divine feminine and divine masculine, the polarity balances of forces in this 3rd dimensional plane or yin/yang and we get:
37/29 = 1.27
It’s TIME folks, it’s really really really time to GO INWARD!
And, anyone wonder why the 27 is on ONE Rock? It’s a representation that we are ALL ONE the POLARITY that represents this 3 dimensional existence is what we experienced during the, amazing, Age of Aquarius. Hence, it’s the ONLY rock to have two numbers. Old Testament and New Testament. WOW.
How about the left …?
1176+248 = wait what? come on now …
2024
To the charts … !!!!!
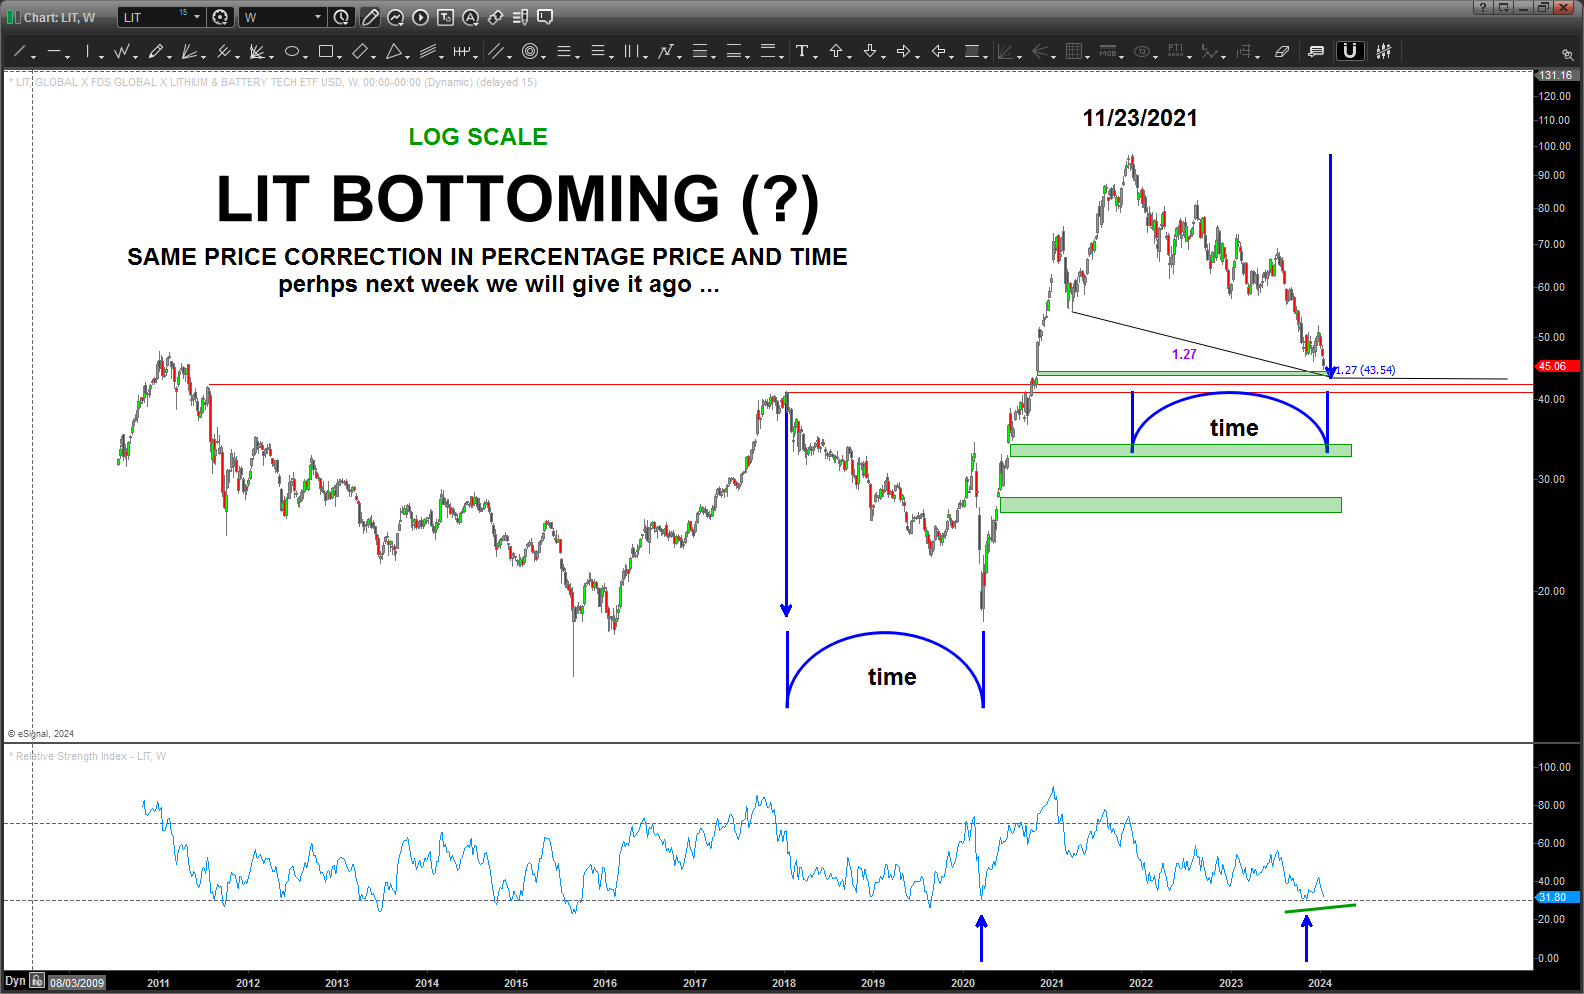
Note we have BOTH PRICE (PERCENTAGE) and TIME (same time as last major correction) EQUAL a little lower and perhaps next week.
Note the RSI support level and on this last swing we have created weekly bullish divergence … same w/ the daily.
And, a key low node, which created a very clear 5 waves into the high, is a 1.27 extension price target right at the measured move price.
This one is looking might tasty …
Nice “standard” red parallel horizontal (polarity) support lines that provide a nice level to manage risk and BAIL if we get a close below this level, on a weekly basis, make this a pretty nice opportunity .
Banks/Financials – January 7, 20224
Posted on January 7, 2024 Leave a Comment
Last post on Banks/Financials: https://atomic-temporary-44460632.wpcomstaging.com/2023/12/04/banks-financials-december-4-2023/
Update …
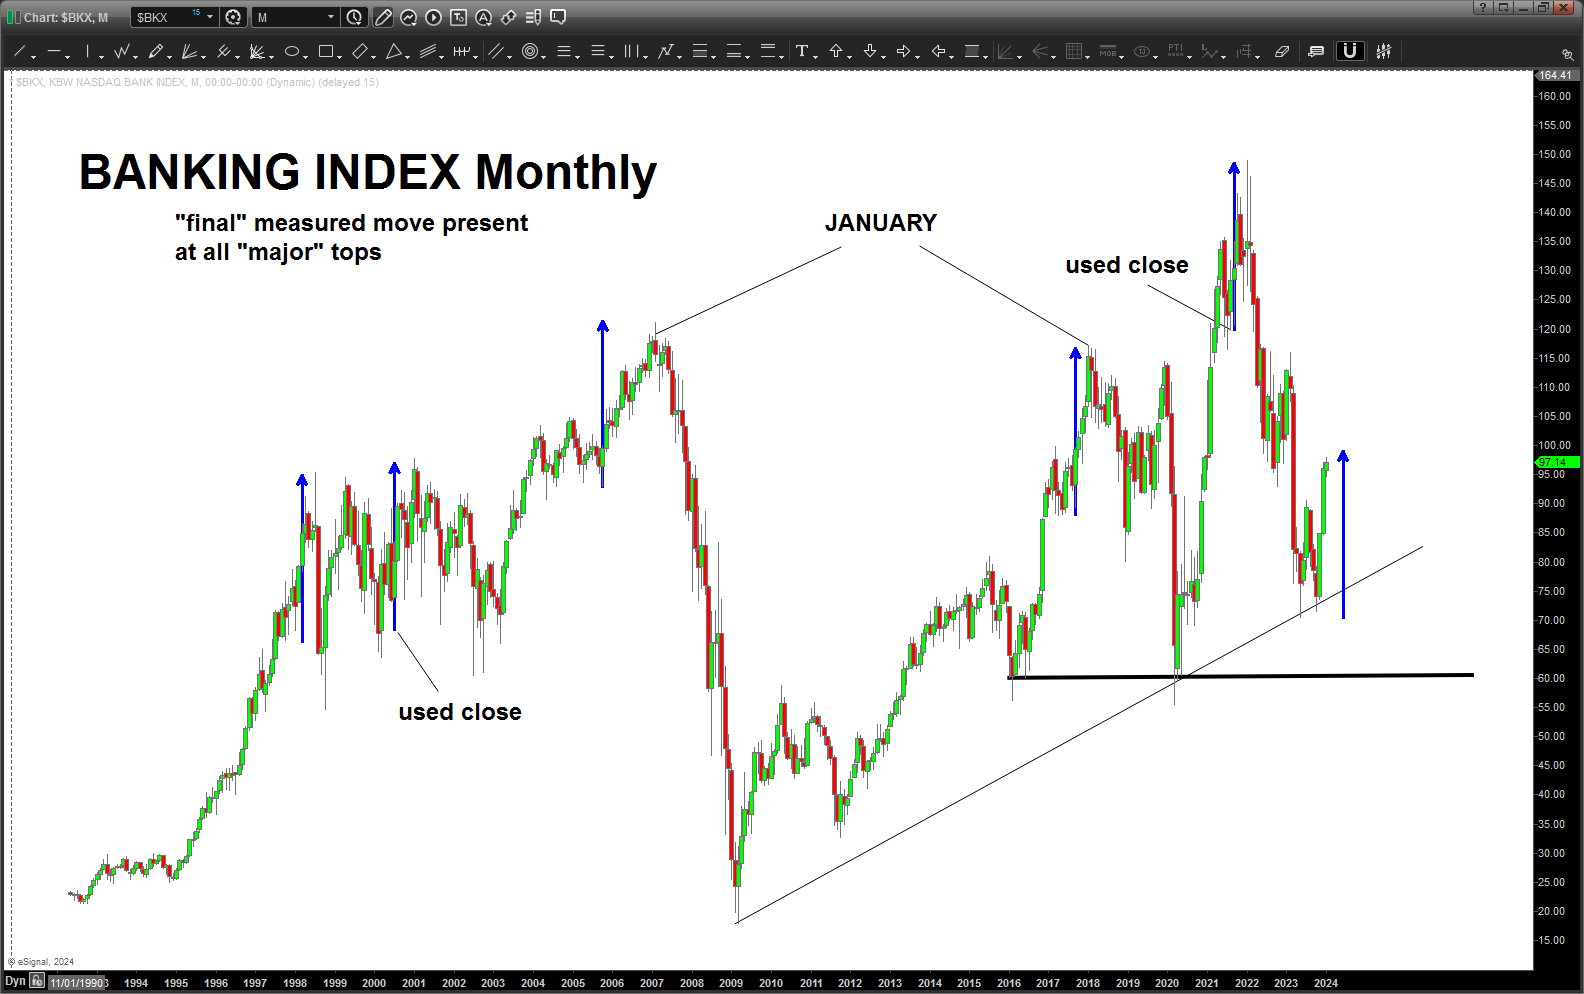
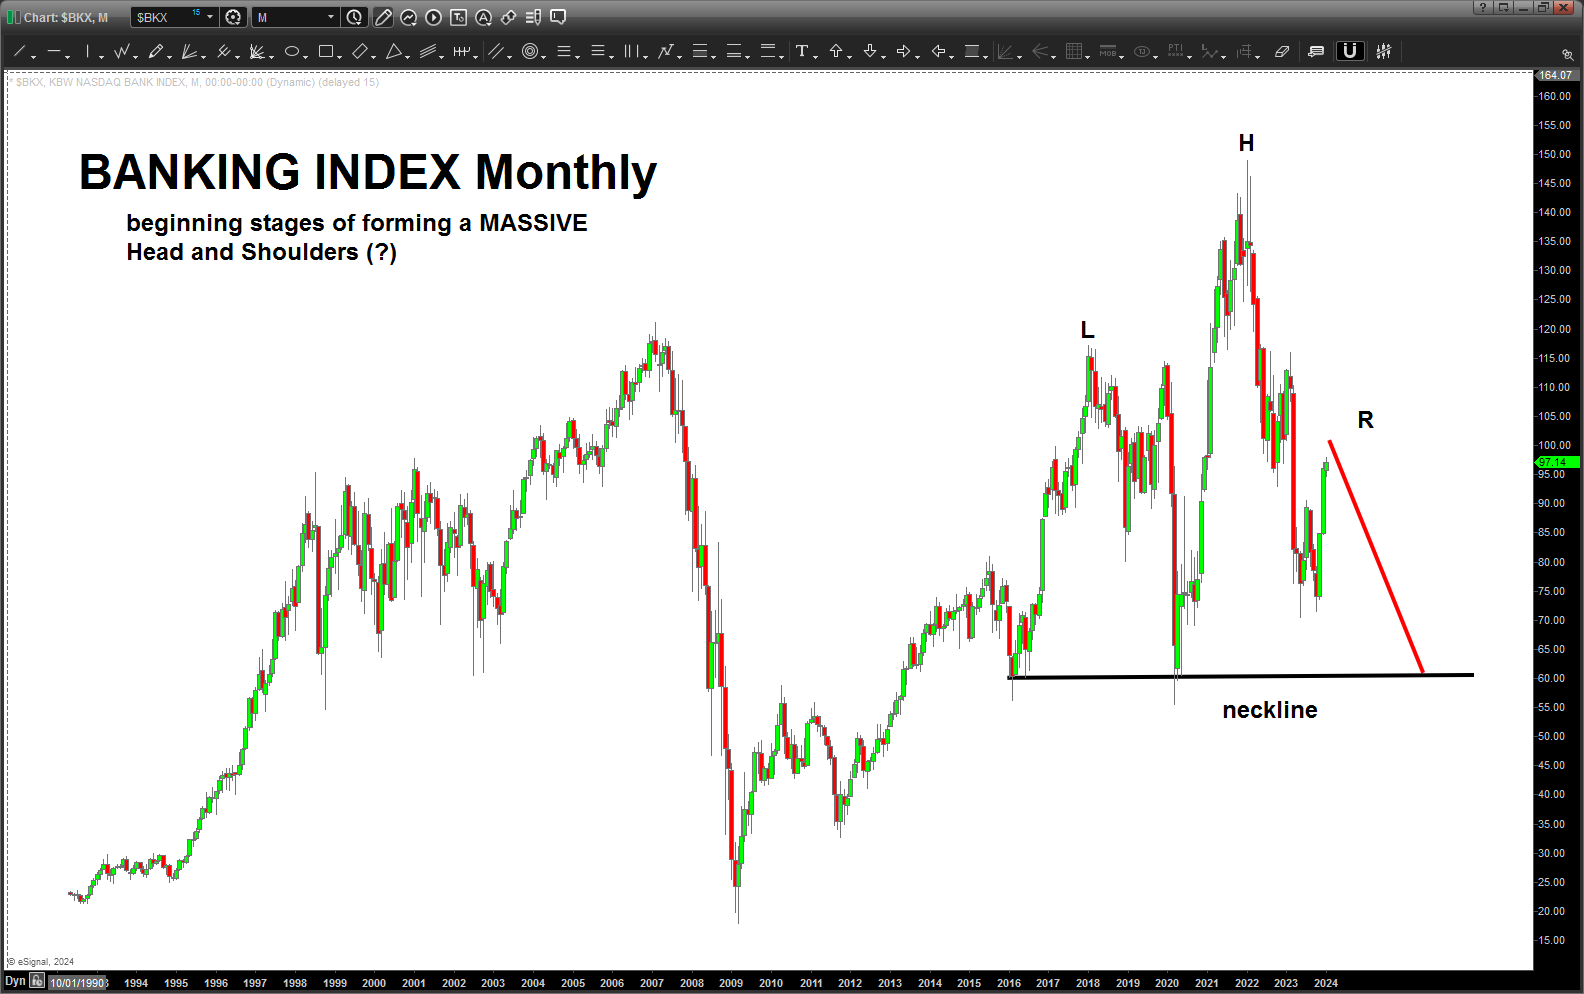
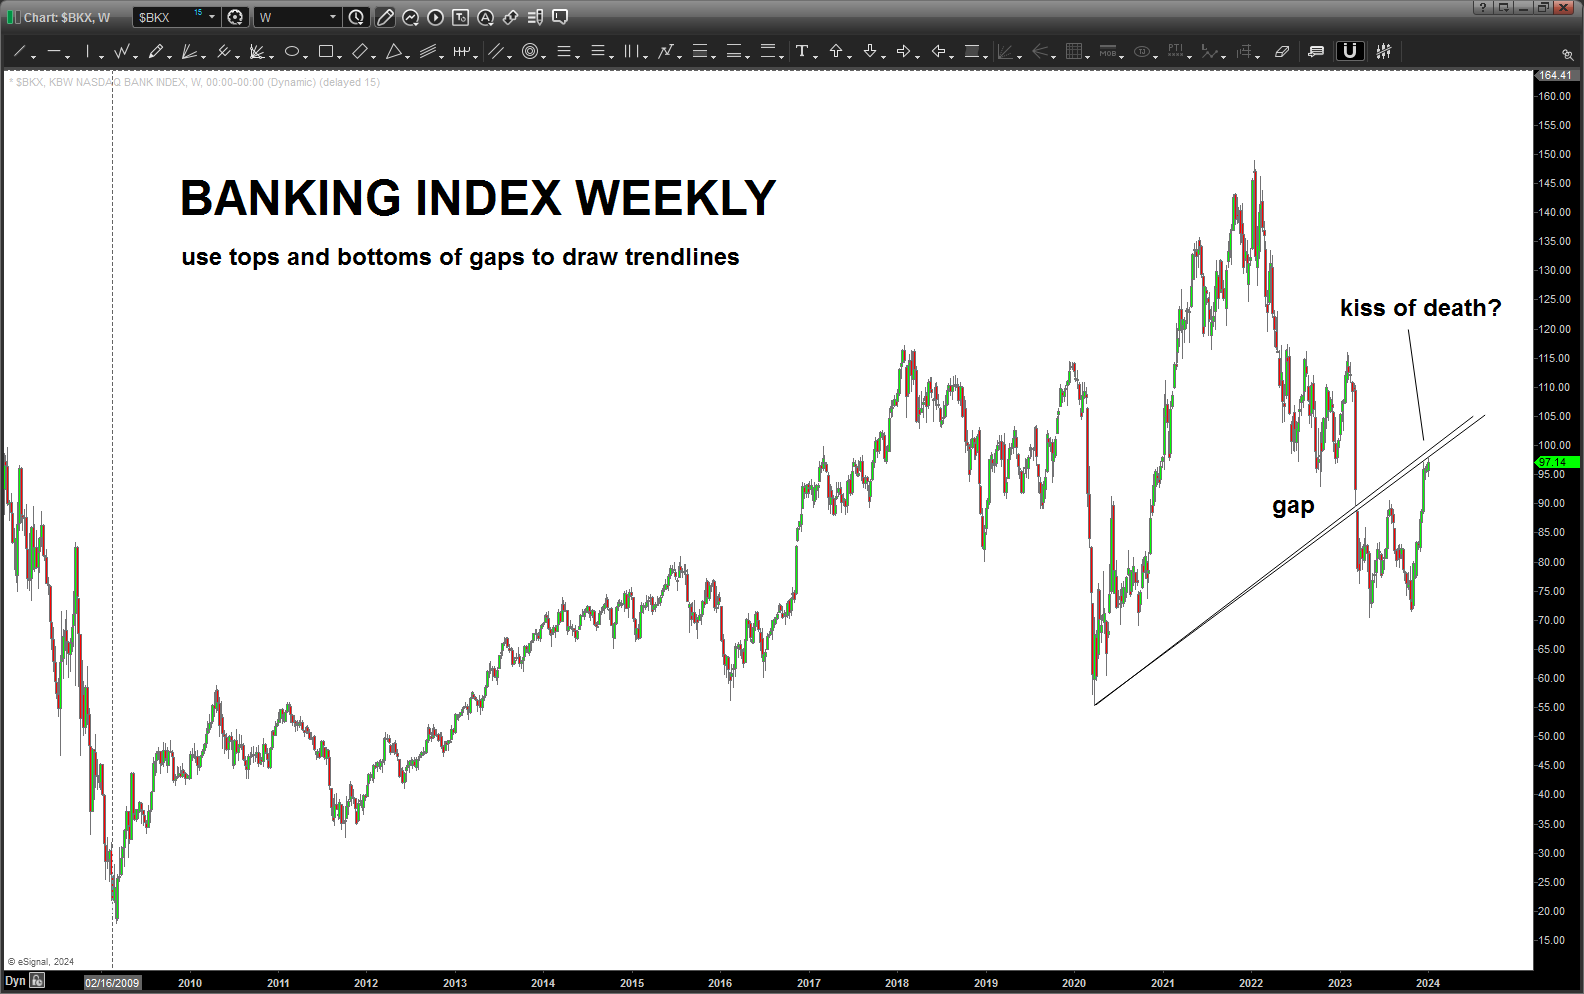
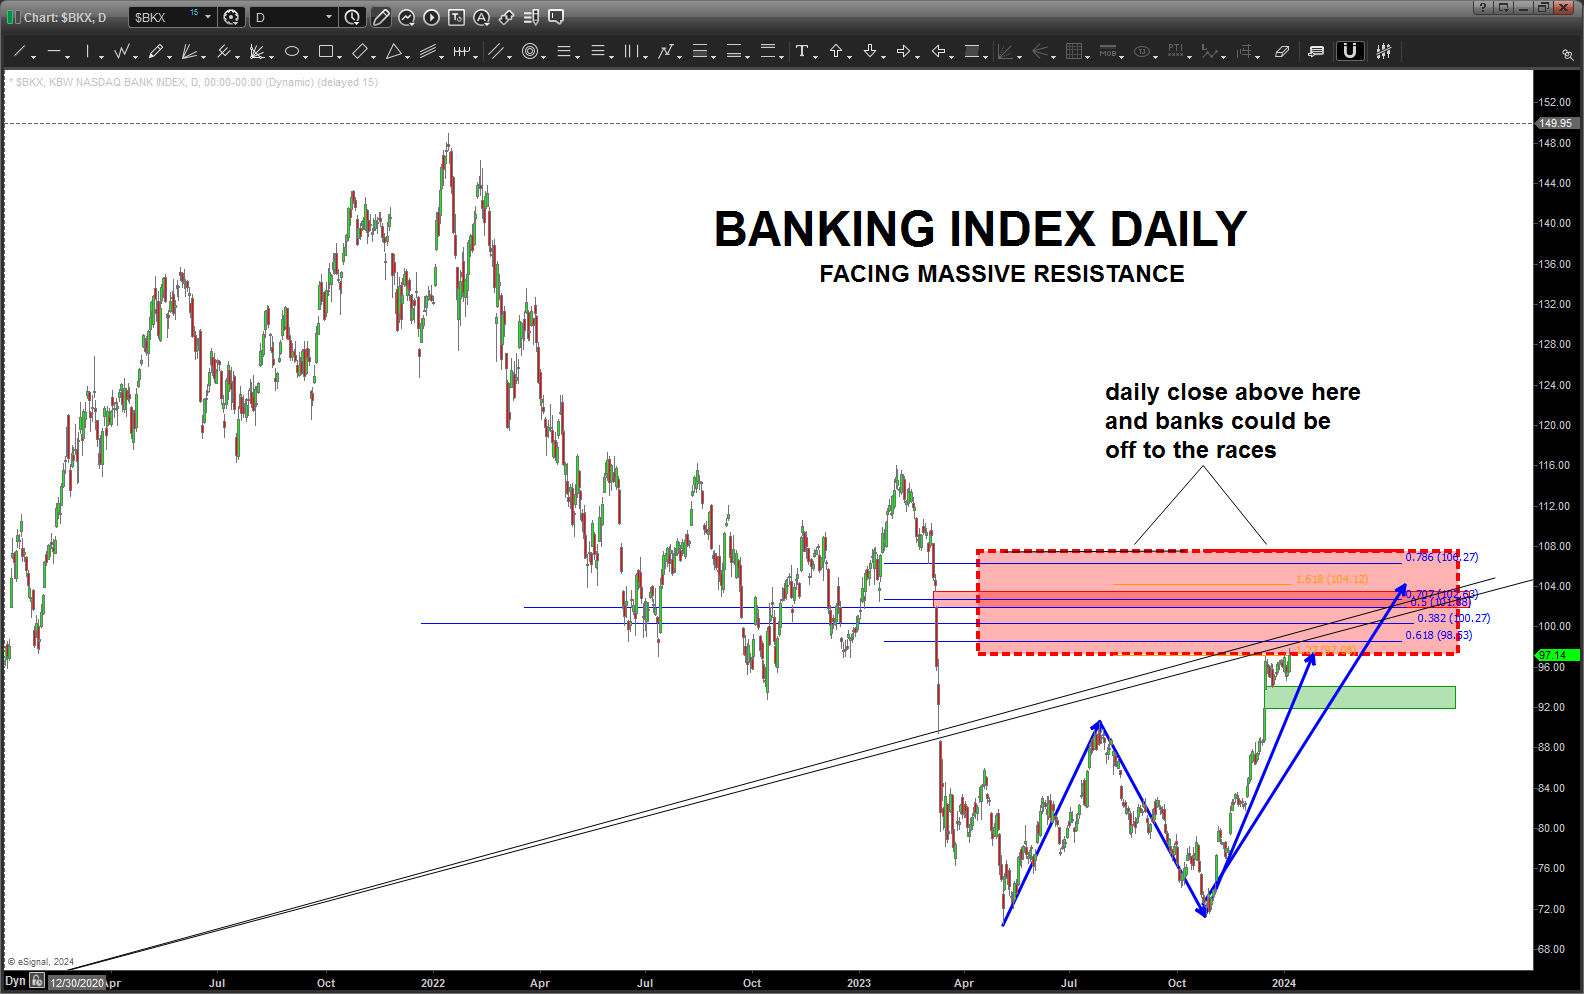
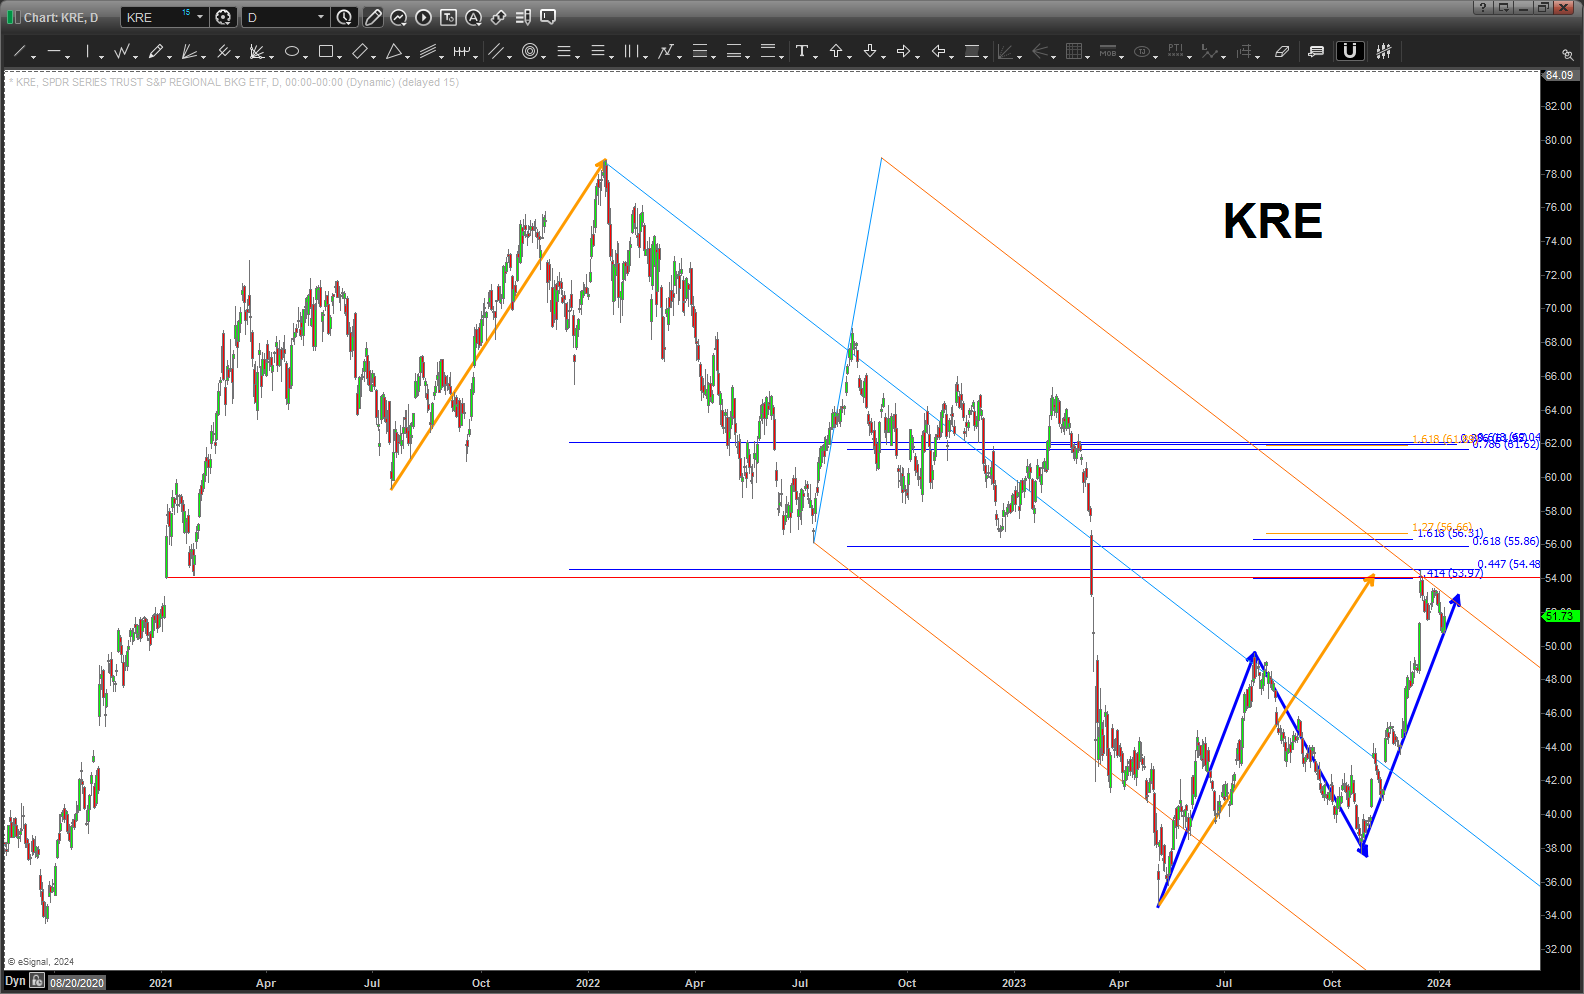
If you’re a BULL you want these patterns to FAIL.
If you’re a BEAR you want them to WORK.
Banks/Financials lead us UP and they lead us DOWN.
Decision time Banks/Financials …
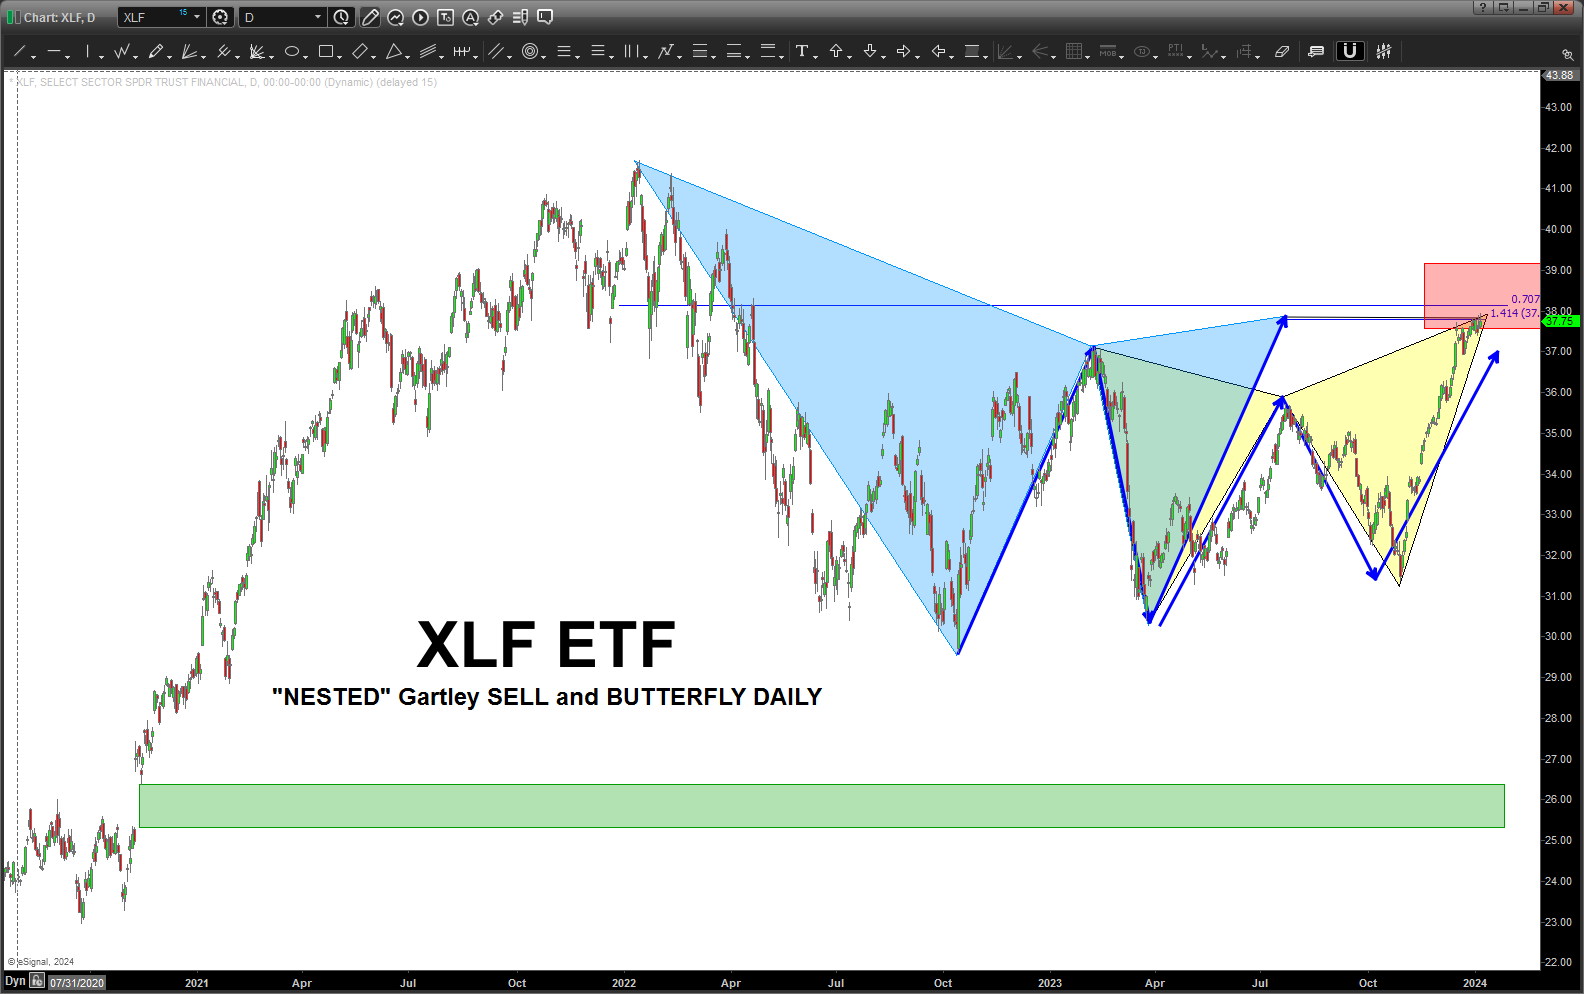
Also, take a look at XLF … completed, not only a Gartley SELL but it also has an embedded BUTTERFLY SELL PATTERN w/in the Gartley. IF XLF gets above the upper zone of the red rectangle – off to the races but it has to get thru a LOT of resistance, first.
Cheers – Bart
LILLY (LLY) – January 5, 2024
Posted on January 5, 2024 2 Comments
Happy New Year.
So many AUMazing things are going to happen this year … get out your tin foil hats.
Speaking of tin foil hats, tighten your chinstrap.
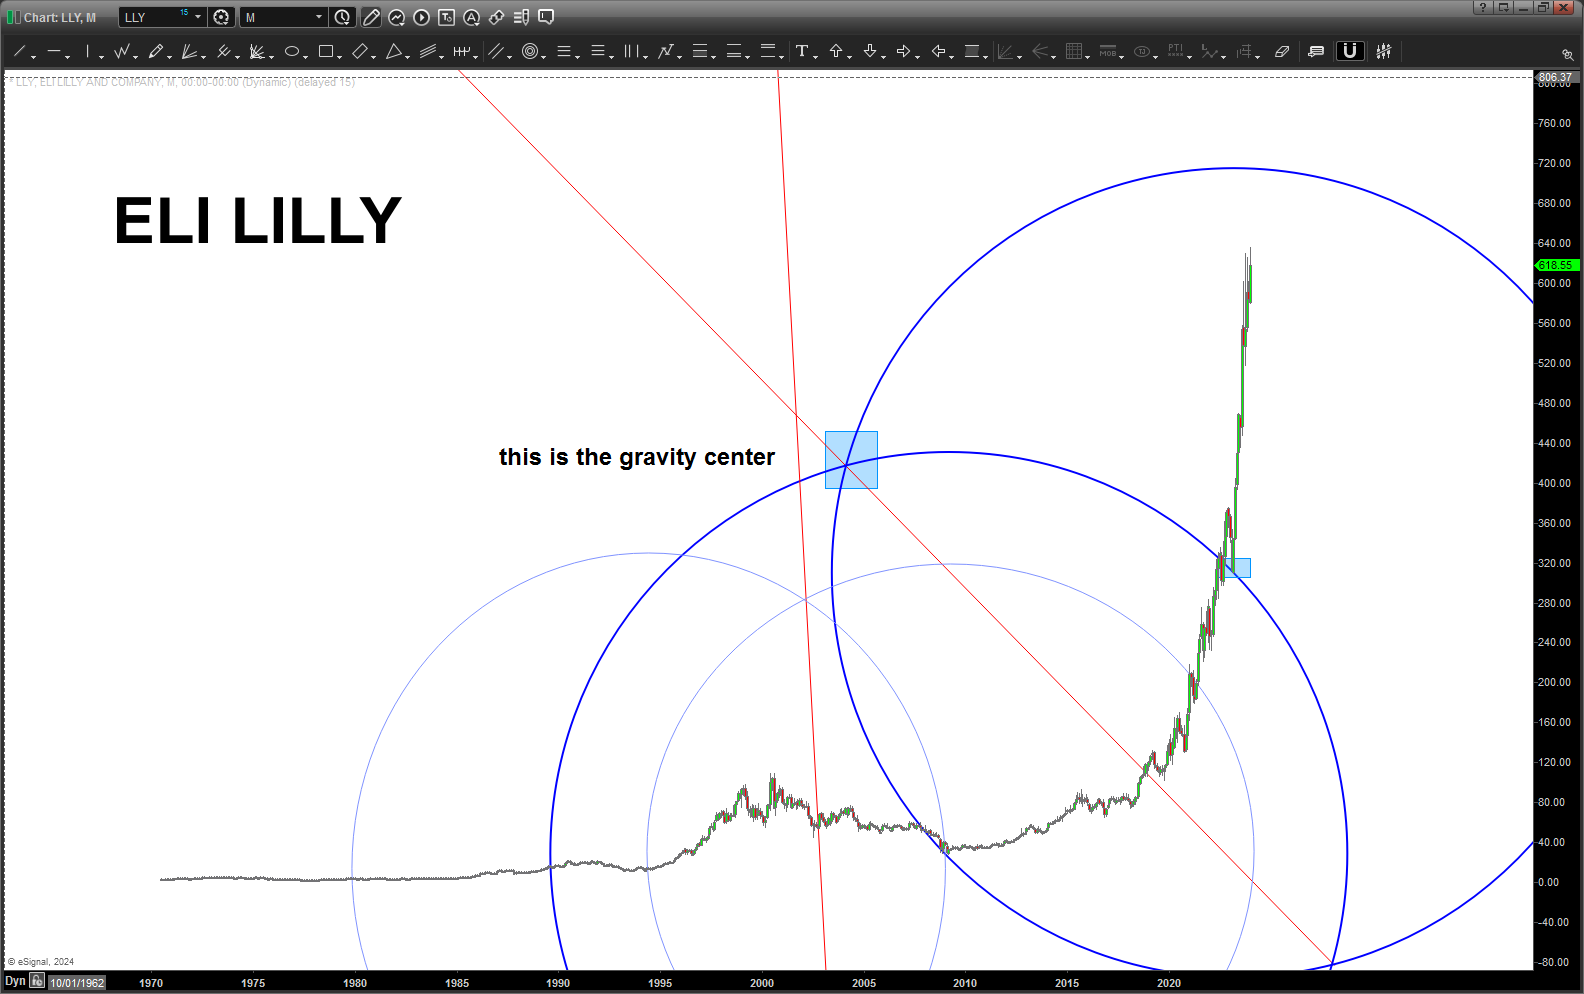
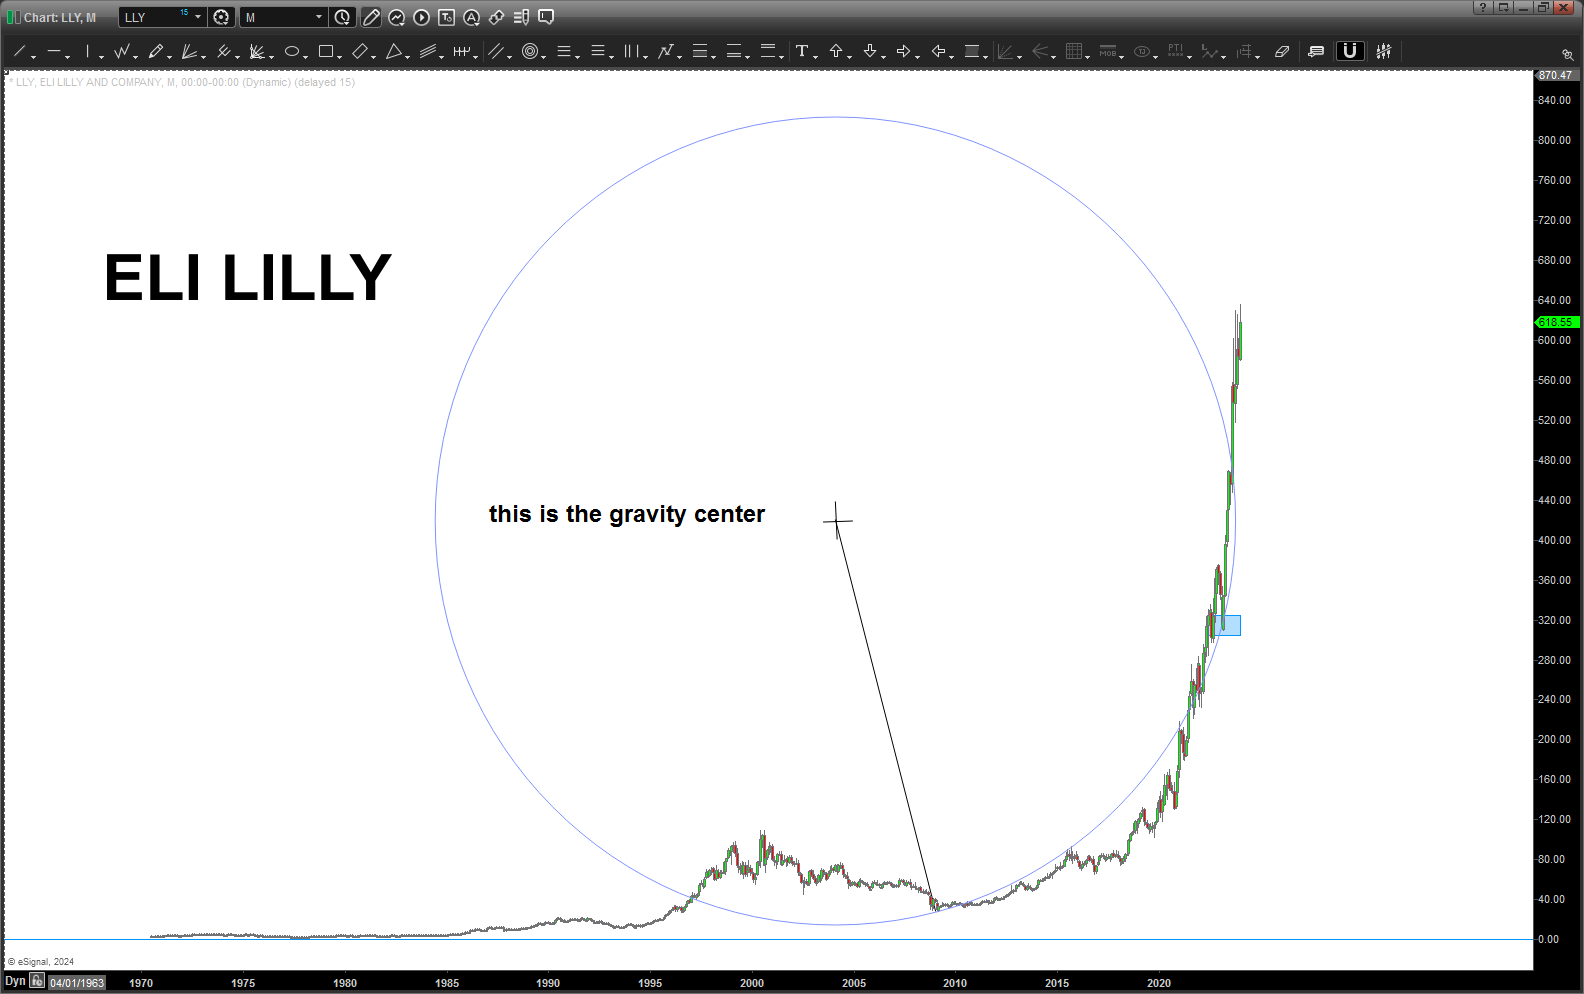
I’ve shown before how to use the “what we learned in grade school” to use 3 points to create a circle. That is all we are doing folks … but, what makes the subject a tin foil hat is the fact, well, that we did w/ stock prices. Yes, trust me I know ..
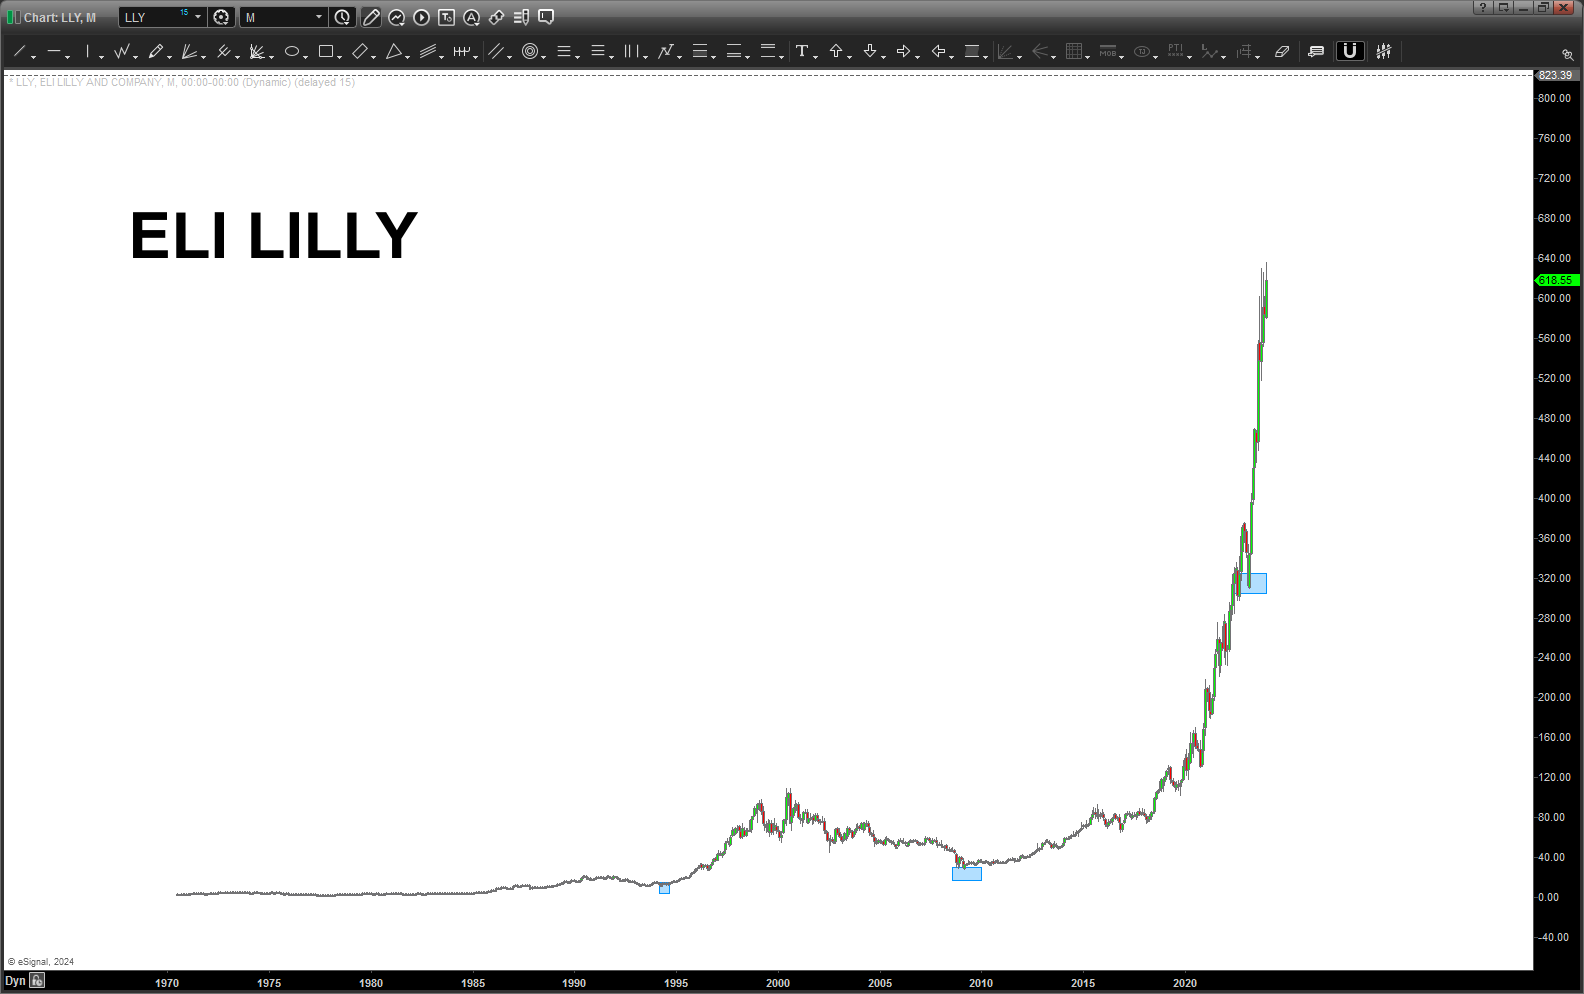
Tonight, I just saw LLY out of nowhere (I used to try and sell into them – try being the operative word – and they were just loyal (to a fault) to their current vendors and, shucks, I really respected that about em’. Made it hard to go back to the boss and say, I’m trying, I really am but they ain’t budging … GREAT people also. So, I know a vast majority of them are really loving their options … so, kinda sucks to do this post, because, parabolics don’t end well. Doesn’t mean that you can’t recover eventually and some have and do but for a while, you’ve simply run out of airspeed and there is NO WHERE TO GO but down …
Additionally, it’s near impossible to call a top on any time frame ( 😉 ) so I’m throwing some zones of possibility into where and take a crack at it … BECAUSE it’s parabolic and we really don’t have a look into their true airspeed or where the throttles are … due they still have power in em’ to keep this climb going or have they been at MAX AB for a while and it’s just a matter of time before you just … stop climbing. And w/ all the geometry I’m going to show below, why can’t we throw a little more physics into the mix? So, basically, it’s just runs out of airspeed and ideas … kerplunk.
For a little more detail here’s a post on it: https://atomic-temporary-44460632.wpcomstaging.com/2020/09/01/parabolic-moves/
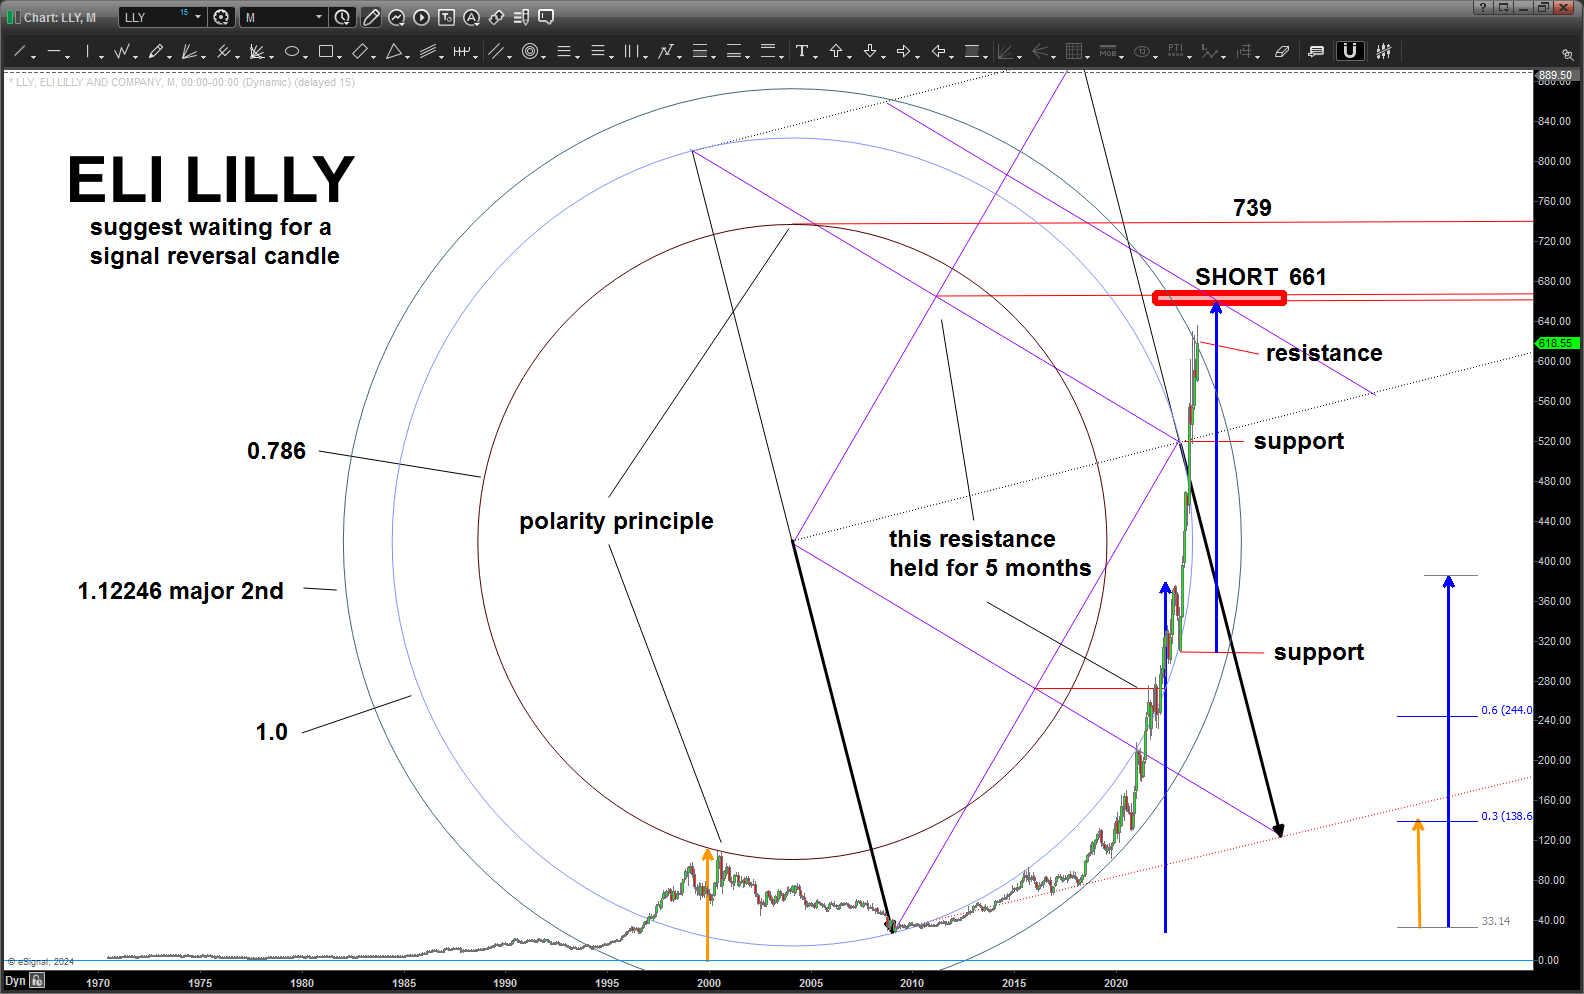
Lilly – wait for a SRC if today was the high – that’s down around 590 ish on the monthly but a daily could suffice also. Else, I’d short at 660 w/ a close stop. From there I’d wait till 739.
For me … 660 seems the most plausible because of the measured moves but also because of the geometry. The latest candle could have done it also but in my experience , it’s just better to have a pattern along/w the geometry.
Junk Bonds – December 31, 2023
Posted on December 31, 2023 1 Comment
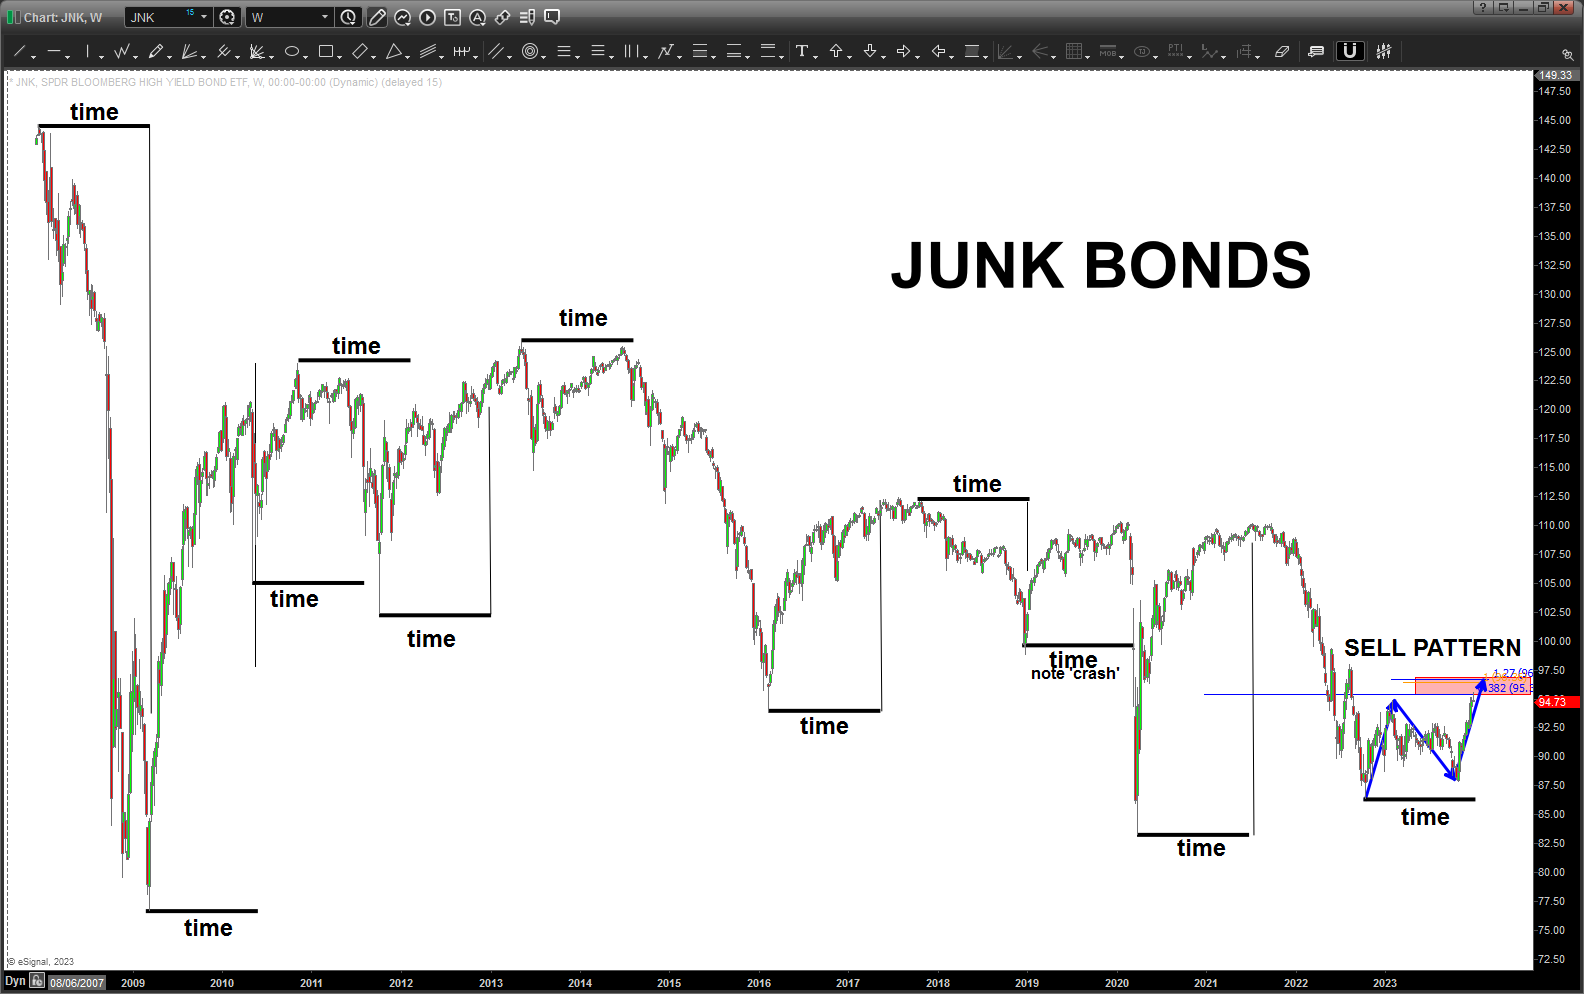
Junk Bonds are extremely important … quite the nice SELL PATTERN has hit or, perhaps, just a little higher.
For the equity market (s) to continue higher, this SELL PATTERN needs to fail.
Also, notice the “time” component working … it’s been working nicely and, obviously, it’s not precise but it can give us a “warning sign” which, I believe it is … the warning “pay attention to Junk Bonds.”
Happy New Year to everyone … I promise 2024 is going to be a barn buster!
ENJOY IT!
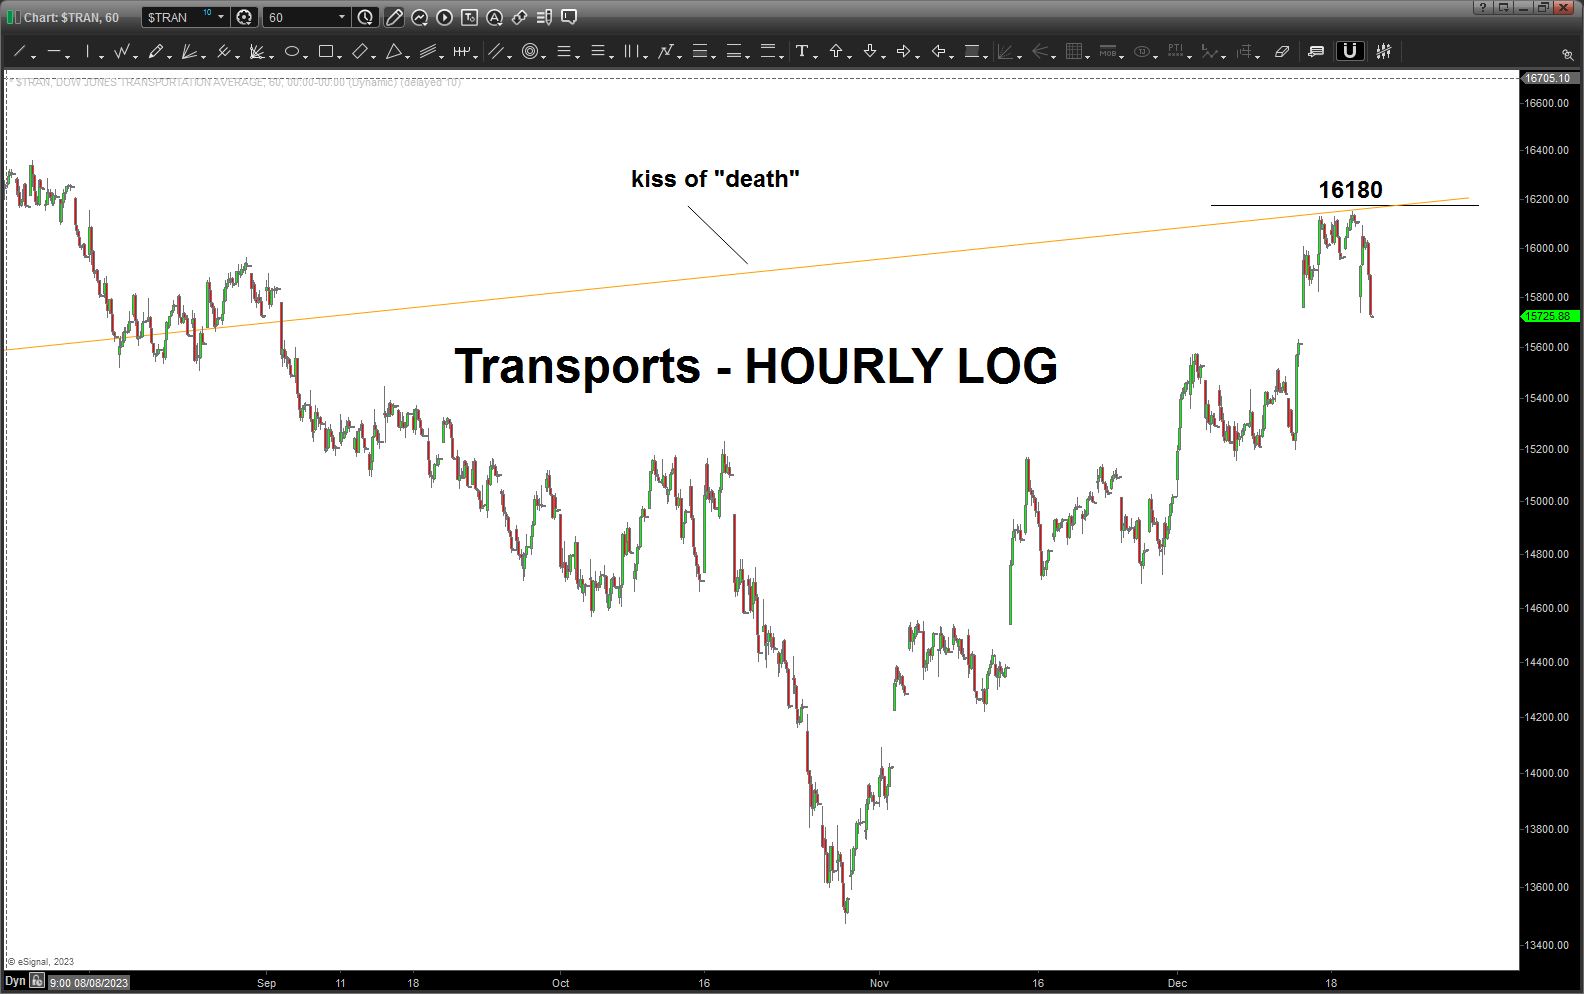
NFLX – December 18, 2023
Posted on December 18, 2023 Leave a Comment
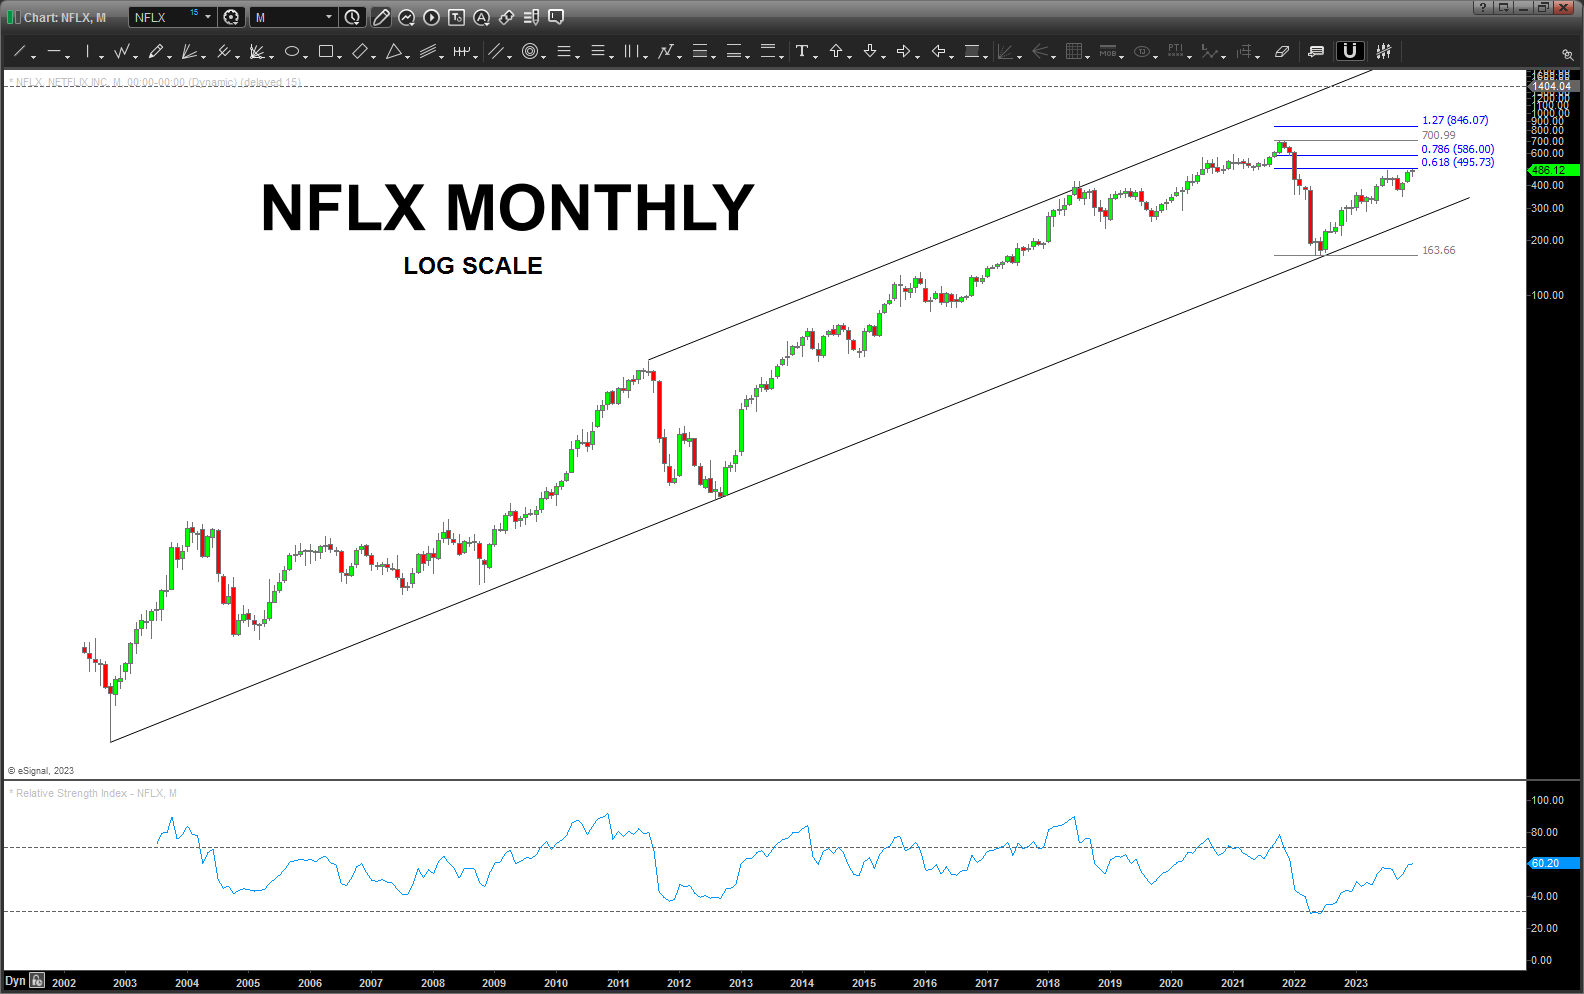
Had not posted in NFLX for a while and forgot (honestly) what a beat down they took but man – also – what a rally!
I wouldn’t be surprised to see a near term pullback w/ the .618 retracement approaching/hit w/ some daily bearish divergence. But, that being said, it bounced off major LONG TERM LOG TREND LINES and that means, for now, the band plays on … if we ever get back to the lower end of the log trend lines (key – LOG TREND LINES) I’d be a buyer. Of course, that would have been the one time it broke support! 🙂
Dow Jones Industrial Average – December 18, 2023
Posted on December 18, 2023 3 Comments
Reference Post: https://atomic-temporary-44460632.wpcomstaging.com/2021/01/20/how-logarithms-music-and-math-yield-40655-as-a-target-for-the-djia/
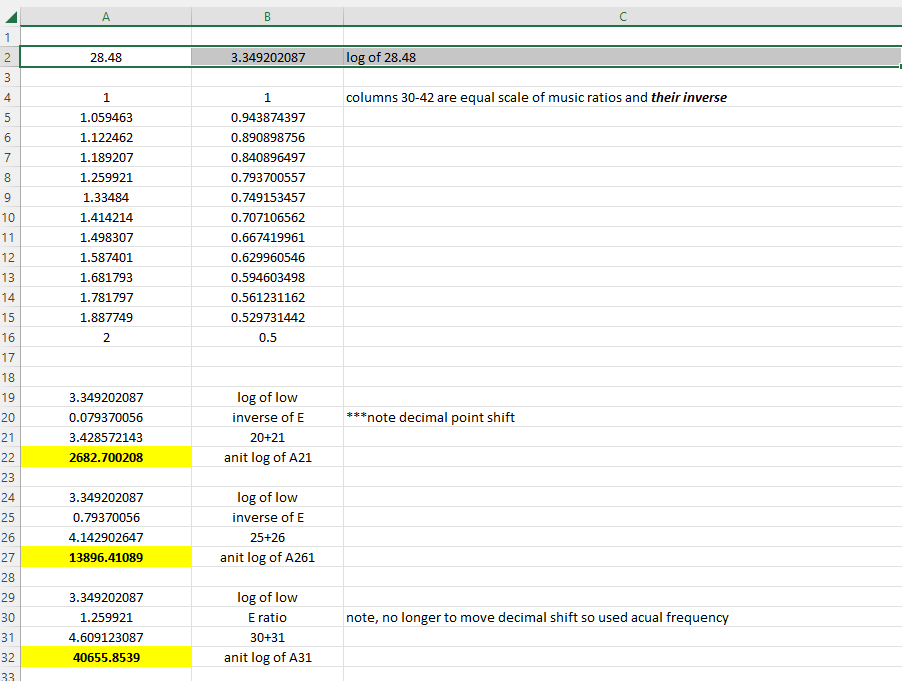
For those that have been following me a while, you’ll know I enjoy using some mathematical methods to derive targets. I’m not going to dive into the math behind these calculations but I am leaving a copy of the spreadsheet so you can see and test the hypothesis if you like. If/when I’m wrong, please let me know and I’ll correct.
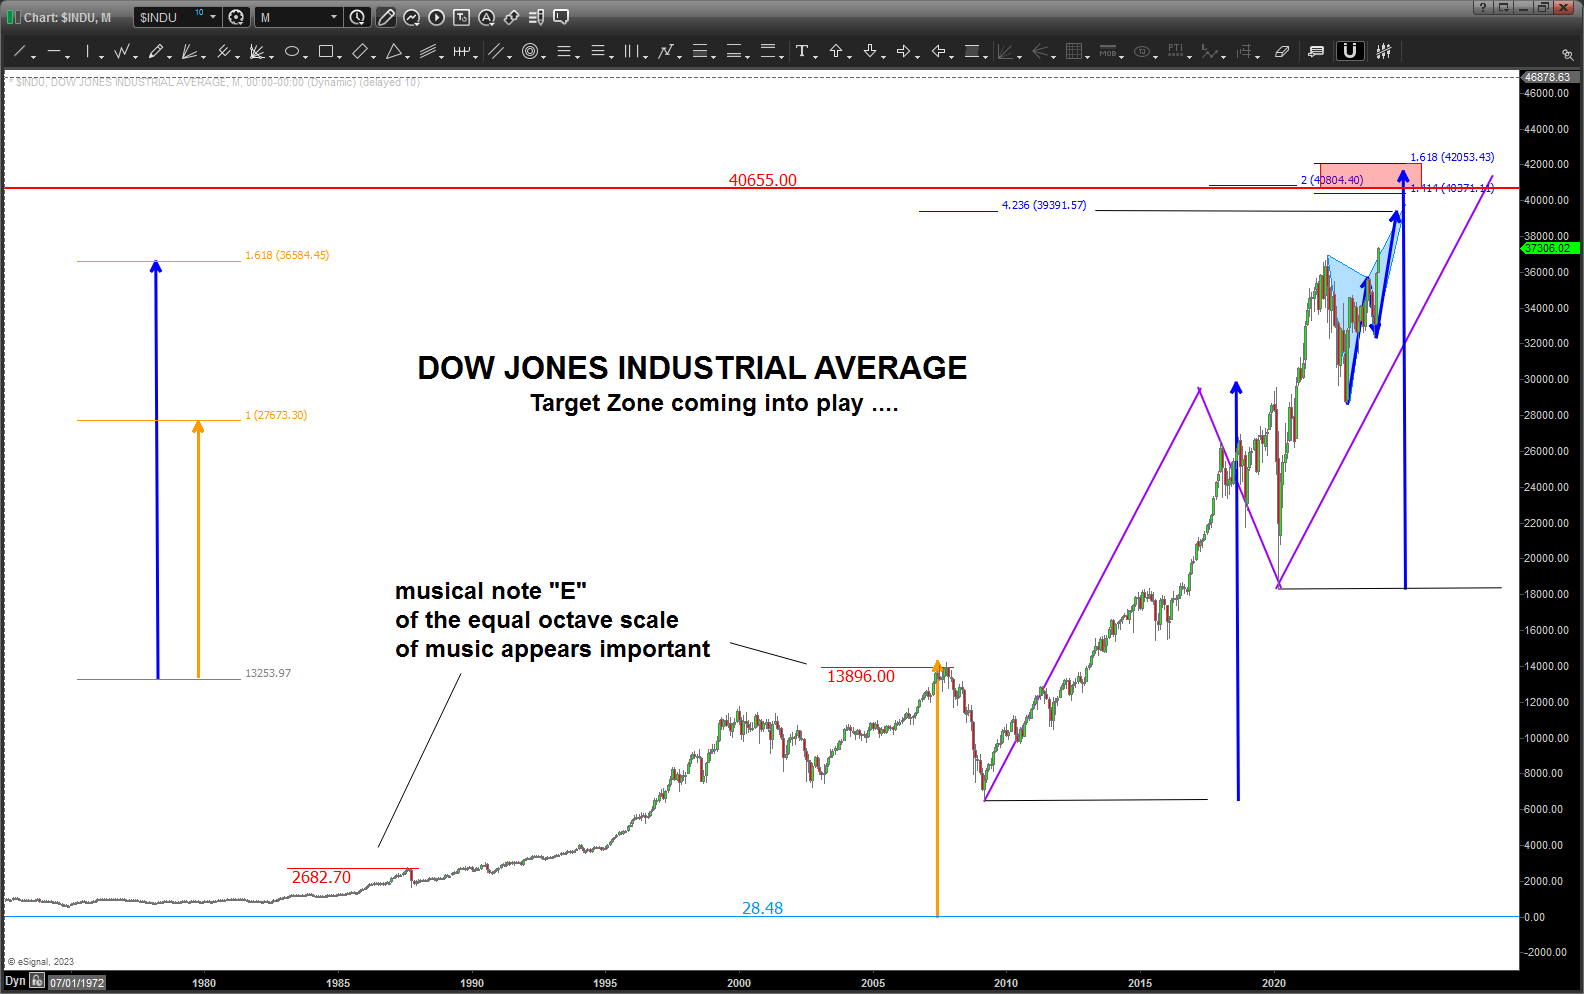
Using logs and musical notes based on the equal octave scale of music, the note of “E” has shown up at pretty much THE major tops of our past century. 1987 and 2007. So, I just moved up another octave and calculate the 40K + ish target shown below. I was always wondering if … or how …we would get to that “number” and we are now w/in percent of that target.
What really gets me excited is that we have a ton of “other” targets coming in to this area/zone. Wowza … I honestly have NO IDEA what is going to happen … but things are certainly lining up.
Let’s wait and see!
IWM – December 18, 2023
Posted on December 18, 2023 Leave a Comment
Last post on IWM: https://atomic-temporary-44460632.wpcomstaging.com/2023/02/03/iwm-february-3-2023/
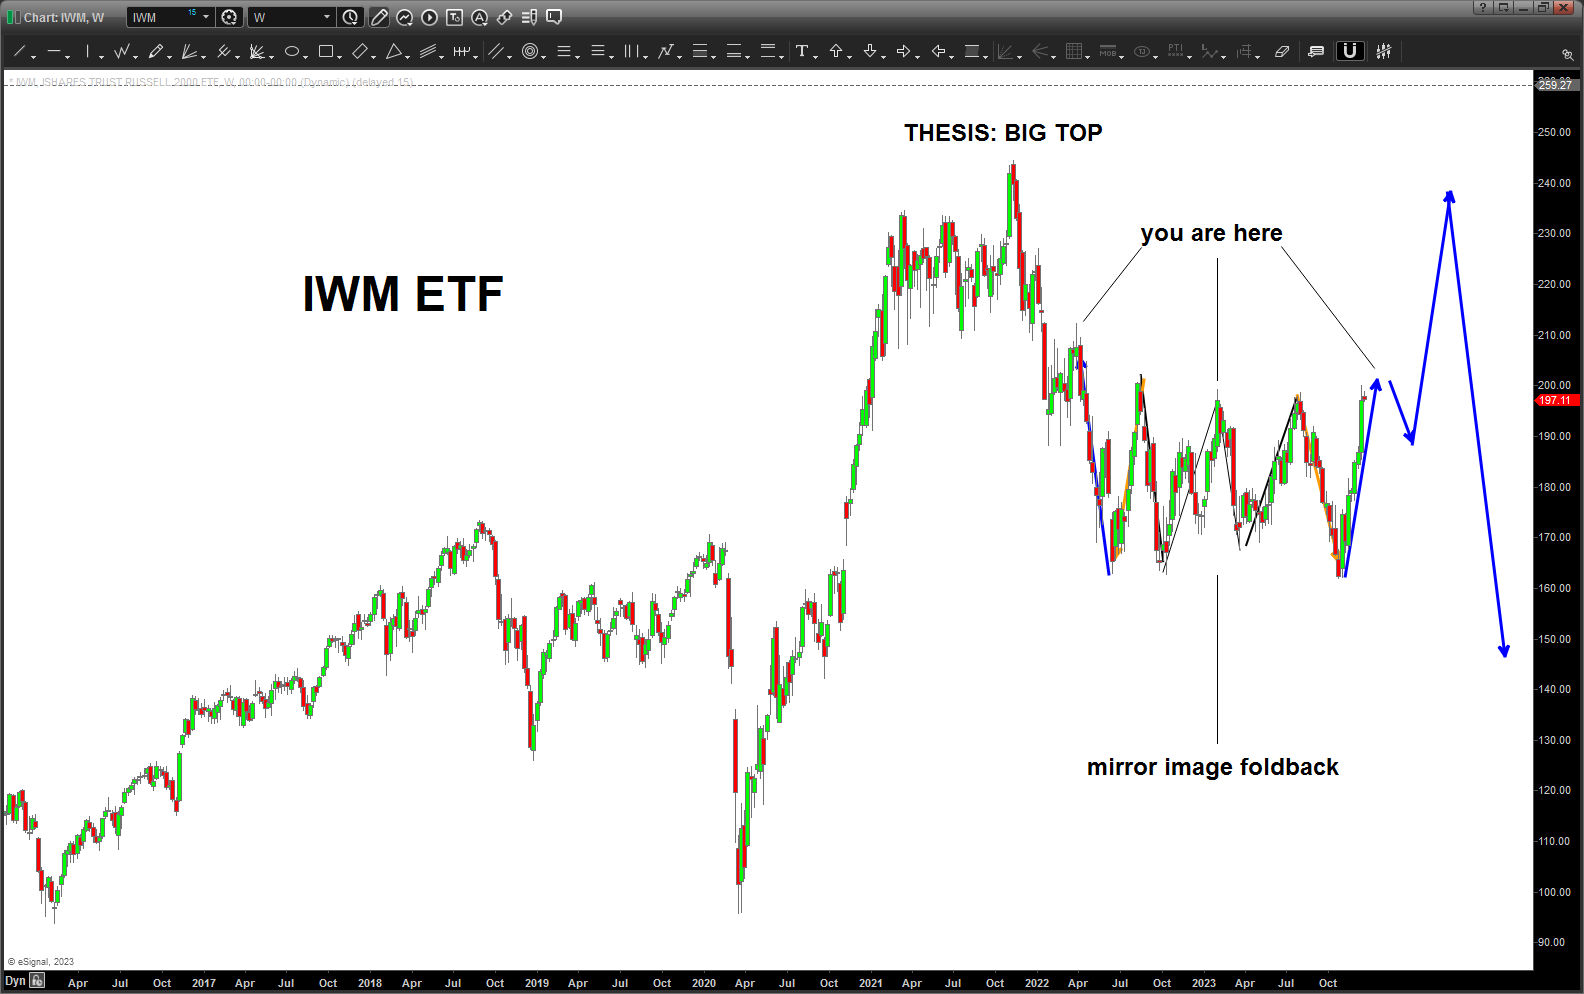
The sell PATTERN worked from the last post but it really hasn’t gone anywhere – amazing that the “number” is still holding the bots, super computers, hedge funds, etc. from blowing thru it … all based on sacred geometry and music.
So, it’s not that much of a stretch to see this as a “bearish flat correction” in EWT and we are finishing/finished w/ the Wave C and IWM starts back down.
Did some very rudimentary timing work to get a feel for the timing … we could certainly go up a little more into resistance shown by the horizontal black line but let’s just wait and see what happens.
Last, the IWM “bottomed” on 161.8. Pfizer topped at 61.8 … can’t make this up folks. Cheers.
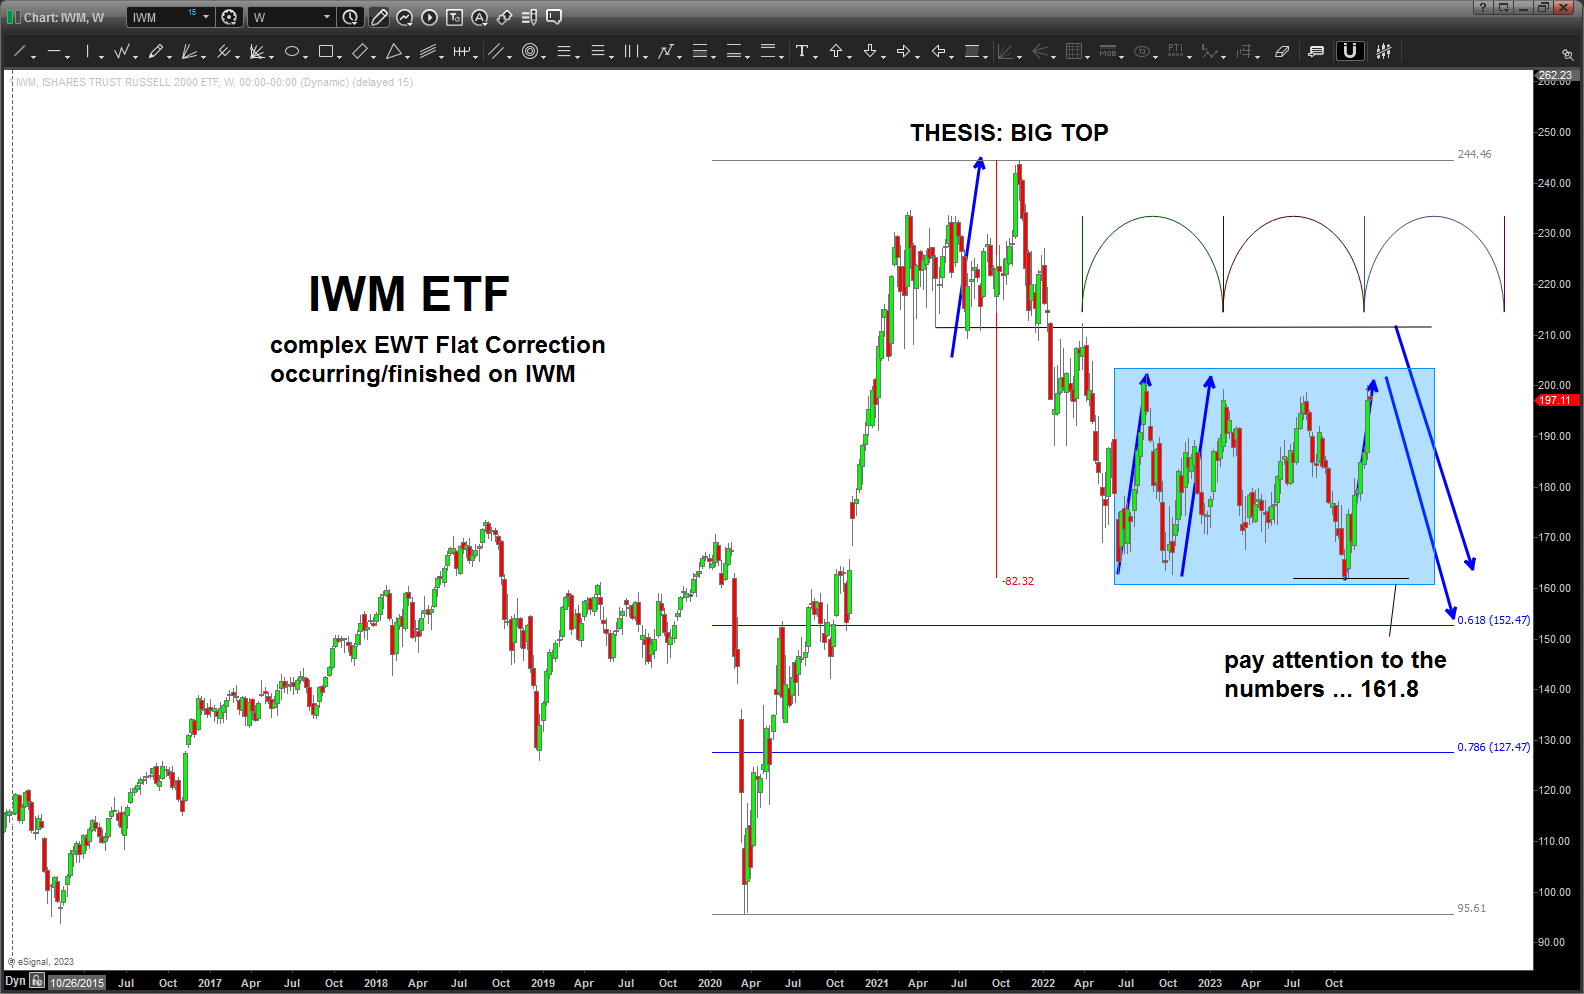
The above is the bearish case near/medium term for now … but when we have corrections like we do I always go back and work thru what Michael
Jenkins (www.stockcycleforecast.com) taught me w/ Mirror Image Foldbacks. They are AMAZING PATTERNS to see and follow and they “usually” will “fail” at the swing points but check this out … maybe? near term IWM keeps chugging up and then gets tanked? Hmmmmm ….