DPZ – February 13, 2024
Posted on February 13, 2024 Leave a Comment
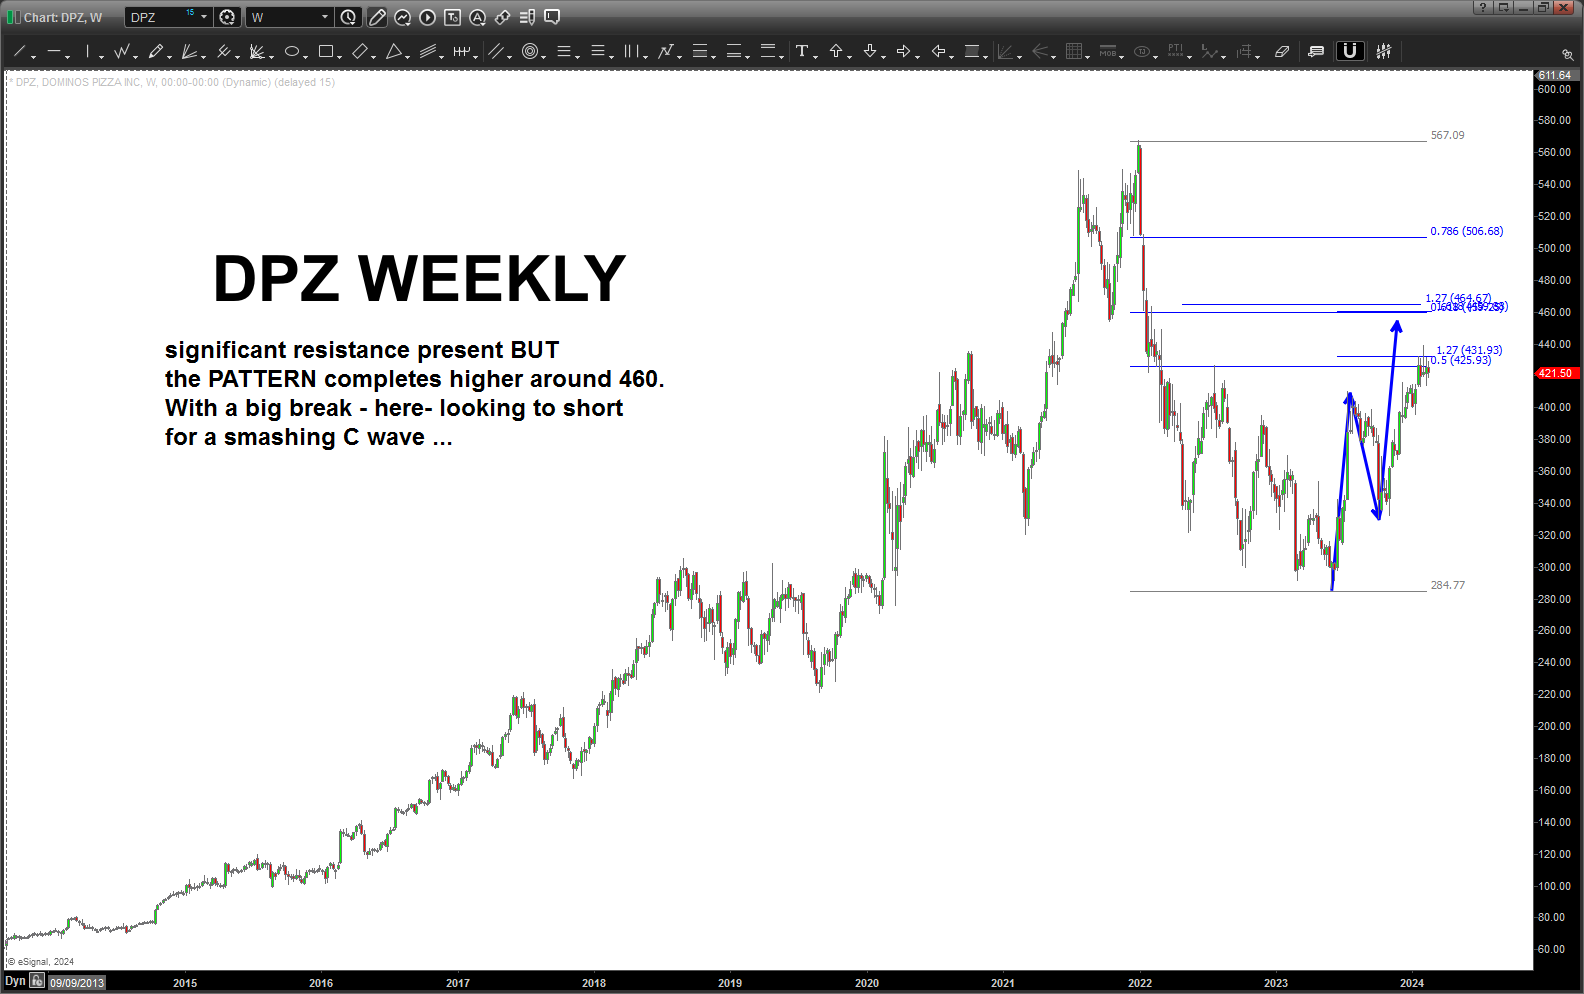
These are the type of shorts you wait for….which, of course, always means it could fail miserably so always have a risk controlled gameplan.
If we break from current levels then try some short … or go full short if you really want, but I’ve been burned not waiting for the ABCD but with the entire market making “a” a top (who knows “if” the top) then perhaps this is as high as it goes … again, it’s all probability.
But look at this one …. all the ratios present around 460 .. got to take a shot ….
Natural Gas – February 12, 2024
Posted on February 12, 2024 Leave a Comment
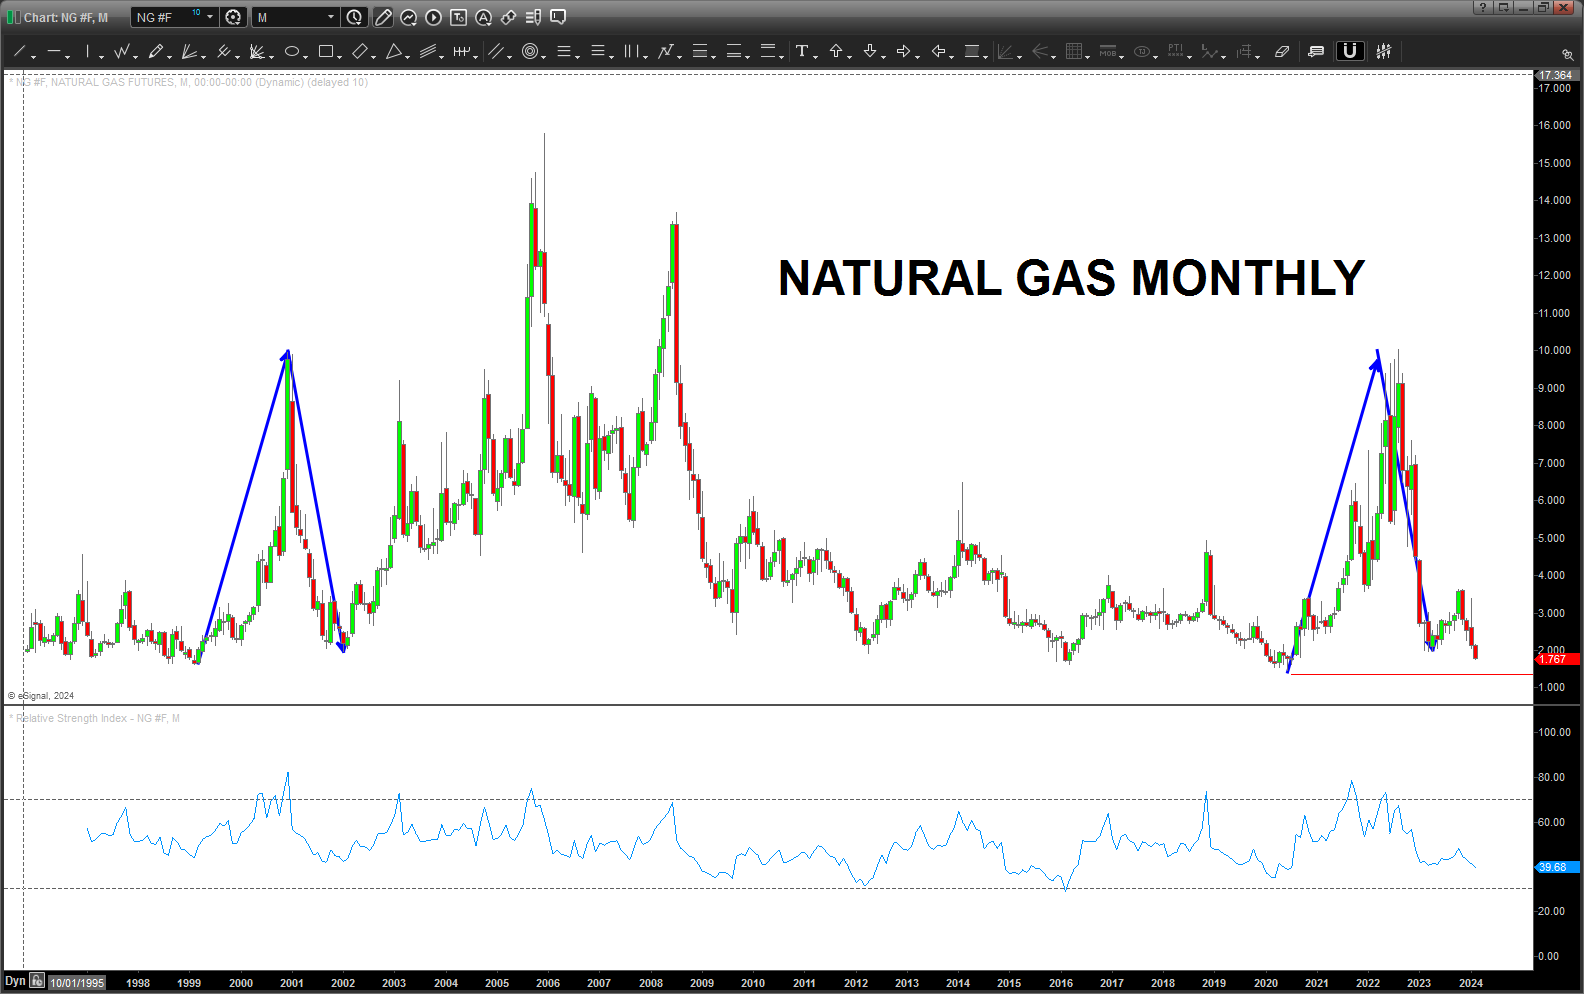
The Monthly (continuous contract) Natural Gas pattern has failed.
CTRL-ALT – DEL
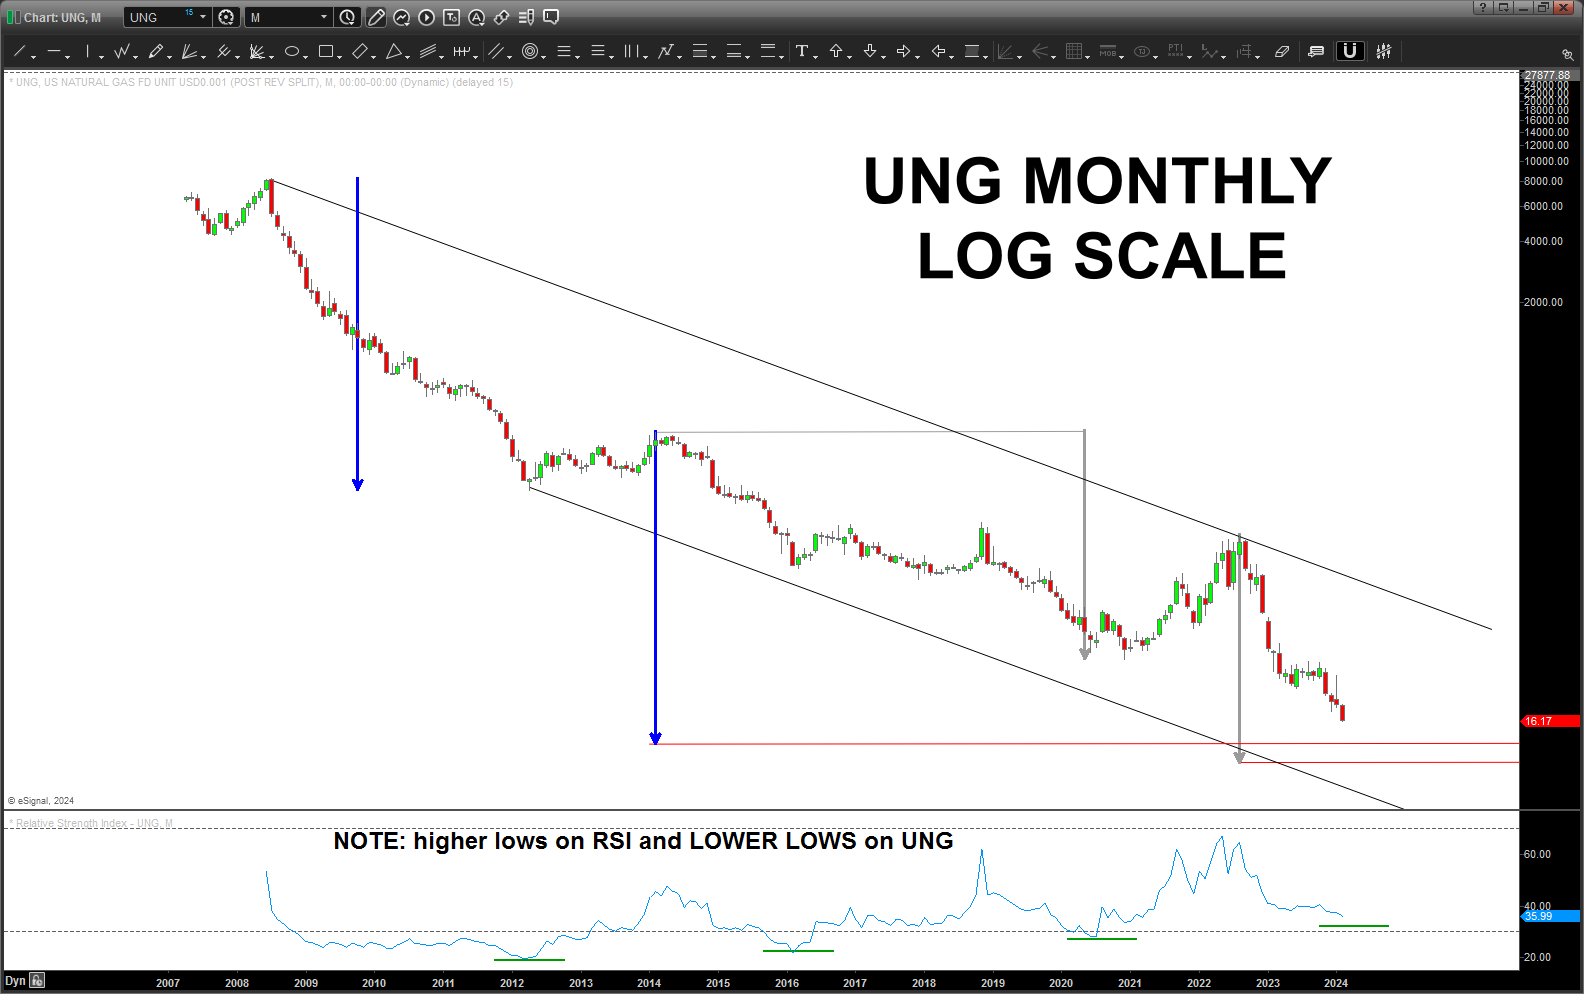
UNG: expect support in/around 10-12, wait for a WEEKLY/MONTHLY signal reversal and BUY.
Take note of the RSI – haven’t pulled this rabbit out of the hat in a long time but – someone take a look and check on me – but the RSI LOWS ARE HIGHER while the UNG LOWS ARE LOWER.
CMT II (I think) – this is an RSI reversal. It refers to a situation where the RSI indicator moves in a direction opposite to the price, suggesting a potential change in the price trend.
At this point, that’s our only hope … first time I have EVER seen this in my charting history …
Put on your tinfoil hats …
TLT – February 2, 2024
Posted on February 5, 2024 1 Comment
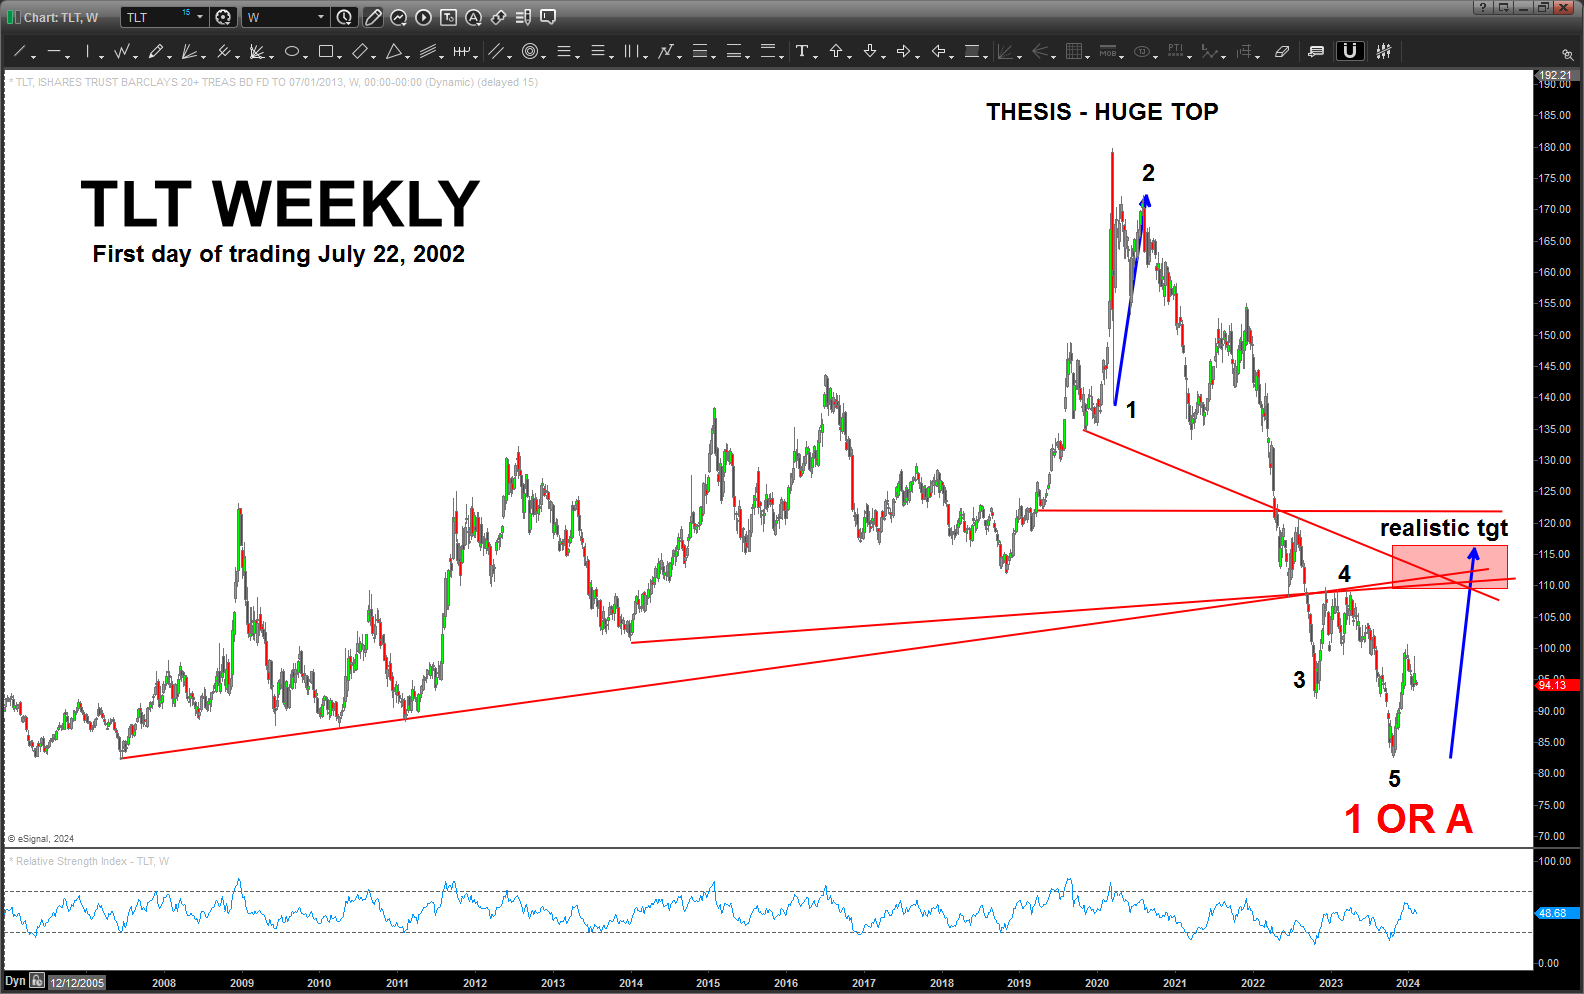
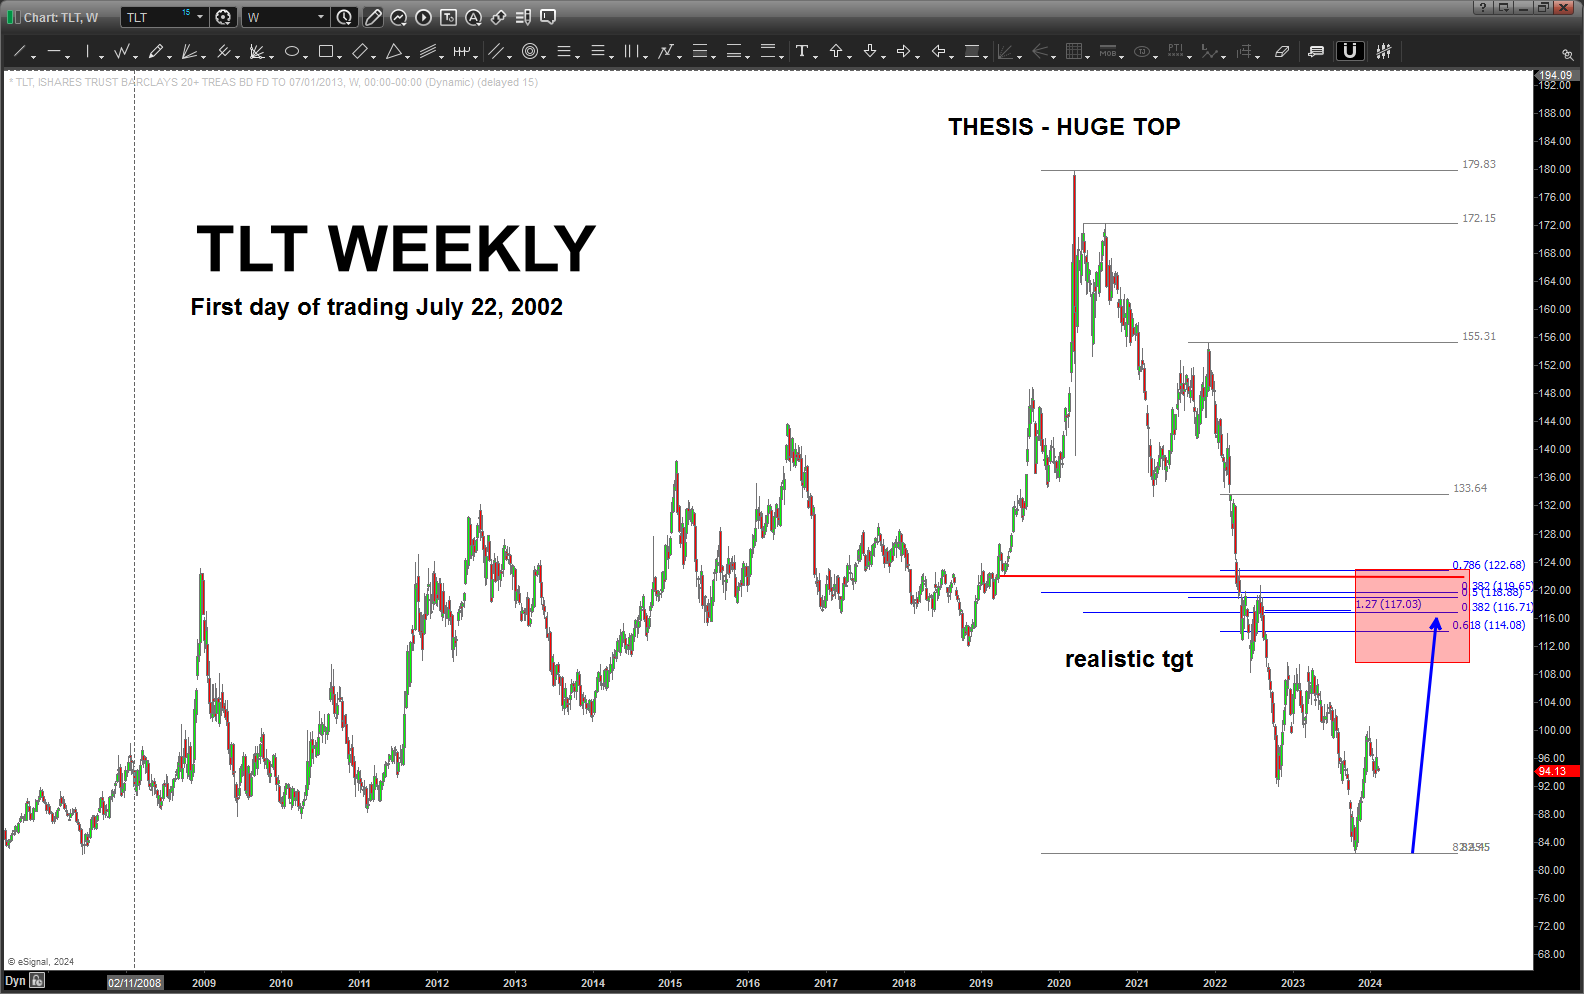
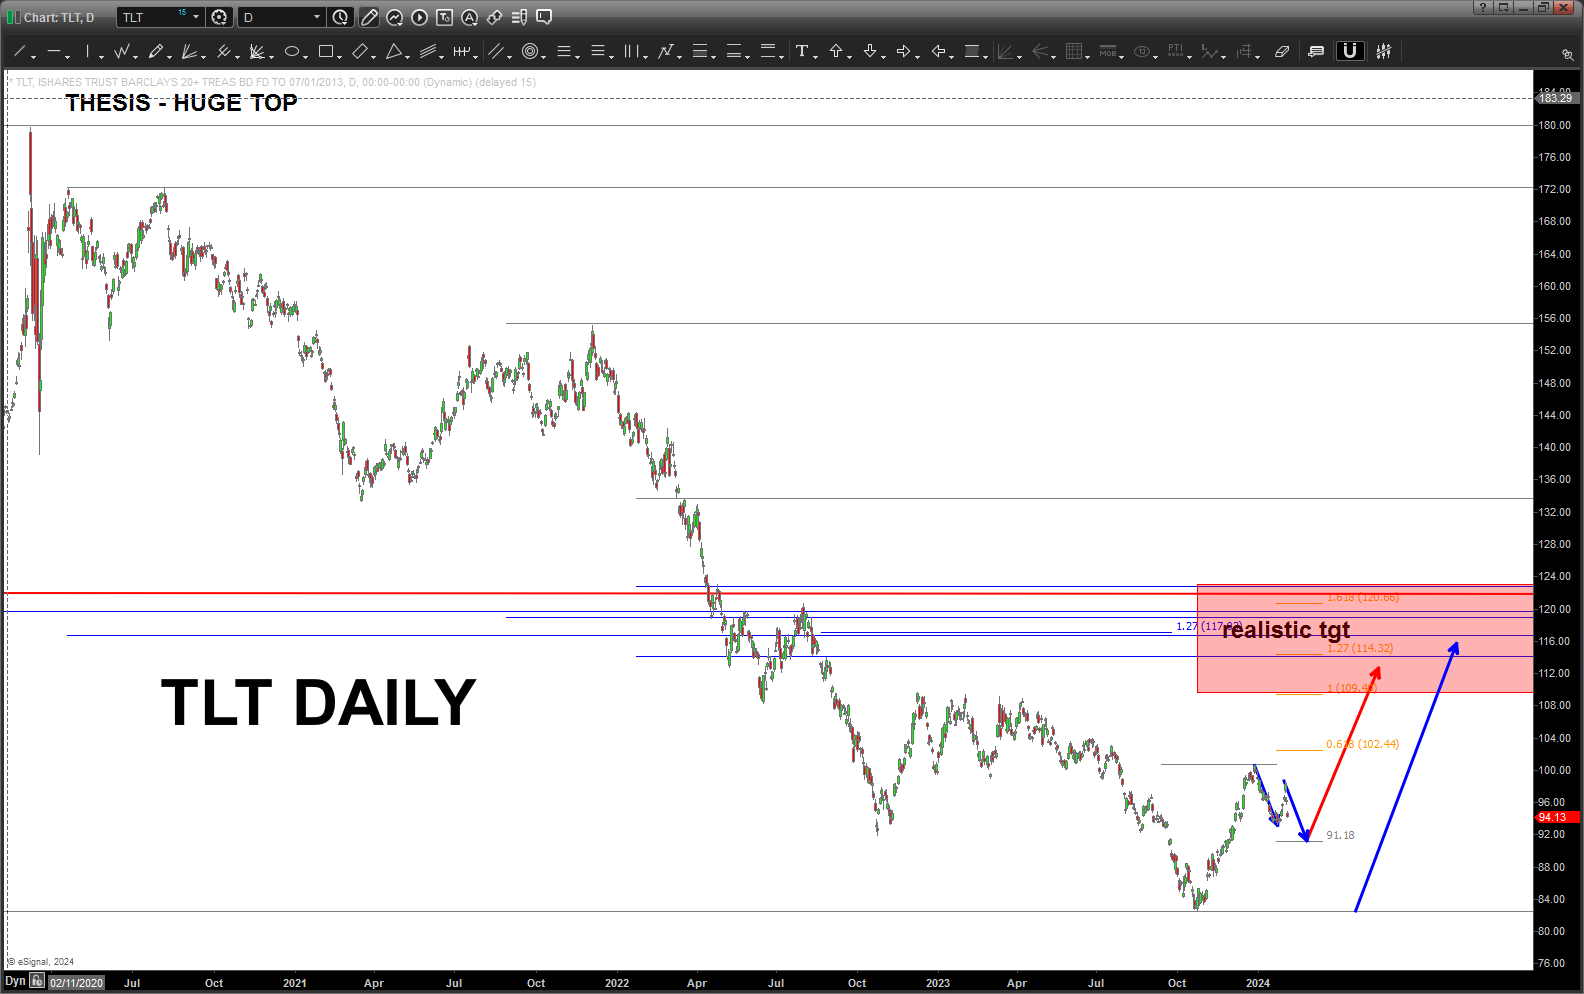
For now, I see this as an A-B-C correction w/ a move down occurring which should be BOUGHT to take up into the mid 100’s – for now.
I say for now because I’m a little “stung” (not that bad but just “stunned” ) I didn’t see the size of the rally in equities. I admit it, I was too stuck into “another leg down” (which I wanted to BUY OBTW) but that “one more leg down” never came … and a parabolic blow off had occurred. Nailed the October low but … missed the move.
So, just like I feel comfortable stocks are setting up for a BIG MOVE down (now or soon’ish) I feel pretty good that the low we made was the end of a 5 count move. If not, then we finsihed a 3 down around 84 and we have another move down below 84. Who knows …
But, given that I am “correct” I have put realistic target up there because, in this current environment, the TLT could go all the way up to 180 and STILL be against the “trend” which – I believe started w/ the high back a couple years ago.
And that, for me, is the key … that was a huge thumping and, the ‘look and feel’, tells me this isn’t going to be ‘easy’ or ‘cut and dry’ – can you President Biden enjoying the FED “raising rates” during and election year? Or, certainly would love for him to “cut rates” and how in the world , seriously, is he going to do that …?
So, this was a GREAT run down in TLT -in which I played LONG TBT and still long and hold a position – but from a “time” perspective I just think we need more TIME so I’m looking to BUY TLT after I see what happens at 91.18.
THIS is important – February 4, 2024
Posted on February 4, 2024 1 Comment
Banks lead us UP and Banks lead us down.
https://www.cnn.com/2024/01/26/investing/premarket-stocks-trading-regional-banks/index.html
True, we have ‘some’ indexes making new highs but we also have some well below there highs in 2023. Market appears fractured …
- DJ Utilities and DJ Transportation – lower highs.
- DJ Composite, Russell, Value Line, SK&P 400 mid-cap – all down
- Financials – still holding strong w/ regard to sell patterns
- Junk Bonds still holding strong w/ regard to sell patterns
- Multiple long term SELL PATTERNS completing
Until Junk Bonds and the Financials really break out … I’m very cautious.
According to EWT and the WSJ of the 11 sectors that make up the S&P 500, only 1, technology, accompanied the index to new all time highs. The other 10 are all at least 15% below their highs.
A key index to watch and one which will give us an idea of where we “really are” is the KRE …
Here is the SELL PATTERN forming on KRE:
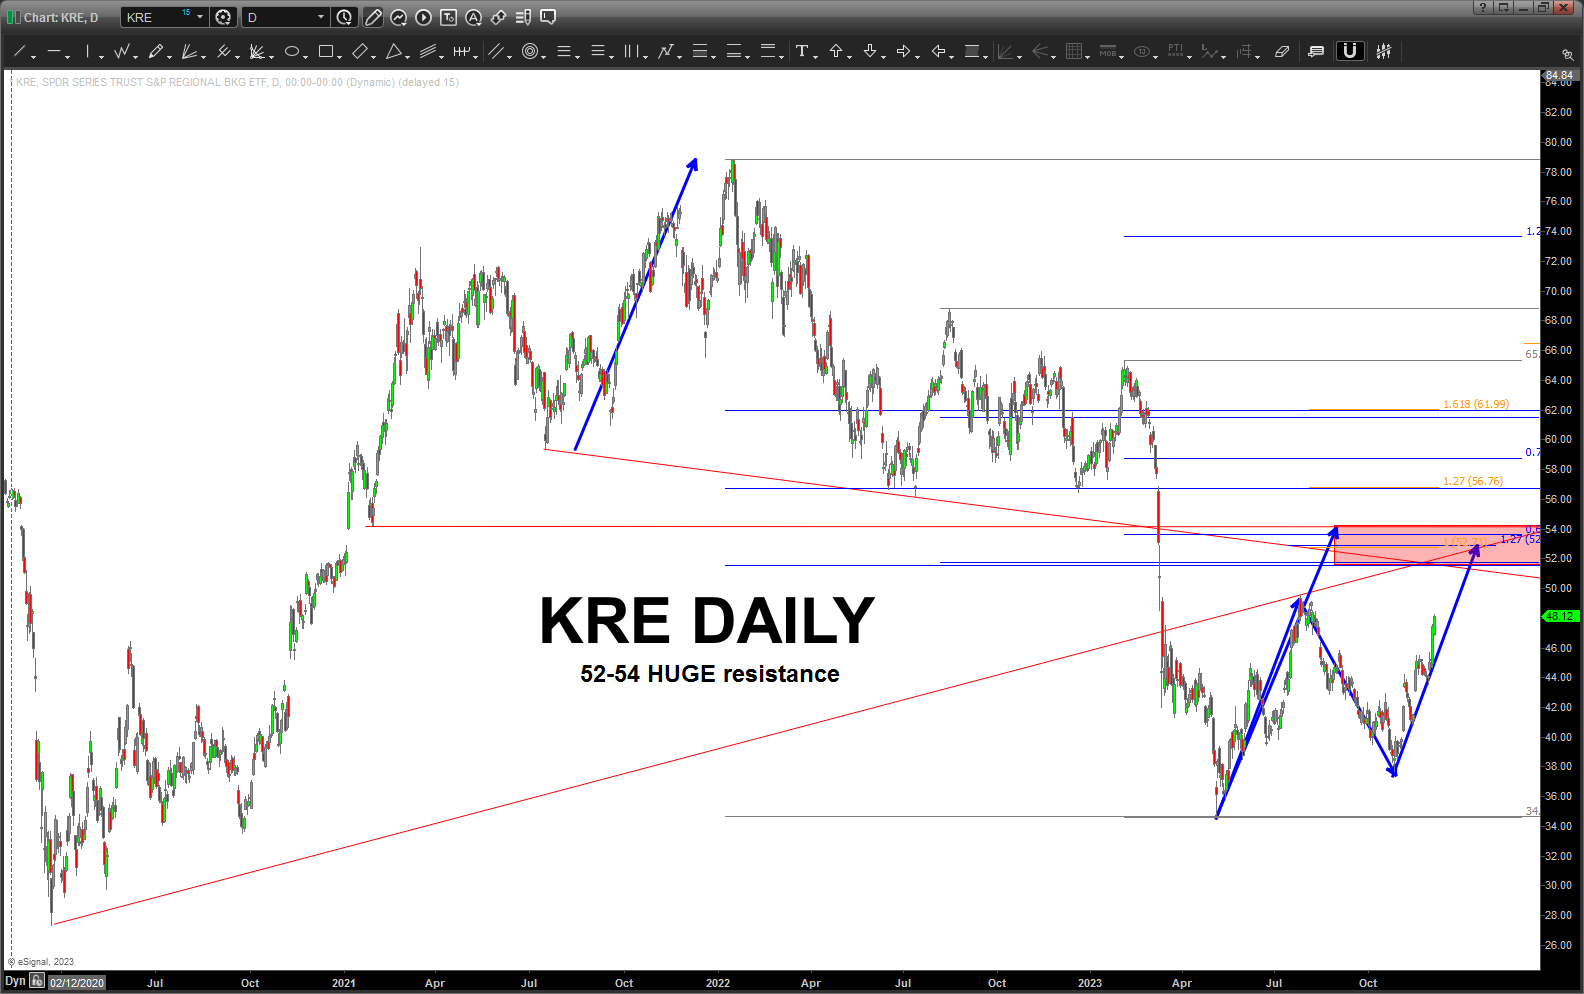
The pattern, THUS FAR, has worked perfectly … if it keeps working the regional banks are in trouble folks and that means pressure on the equities.
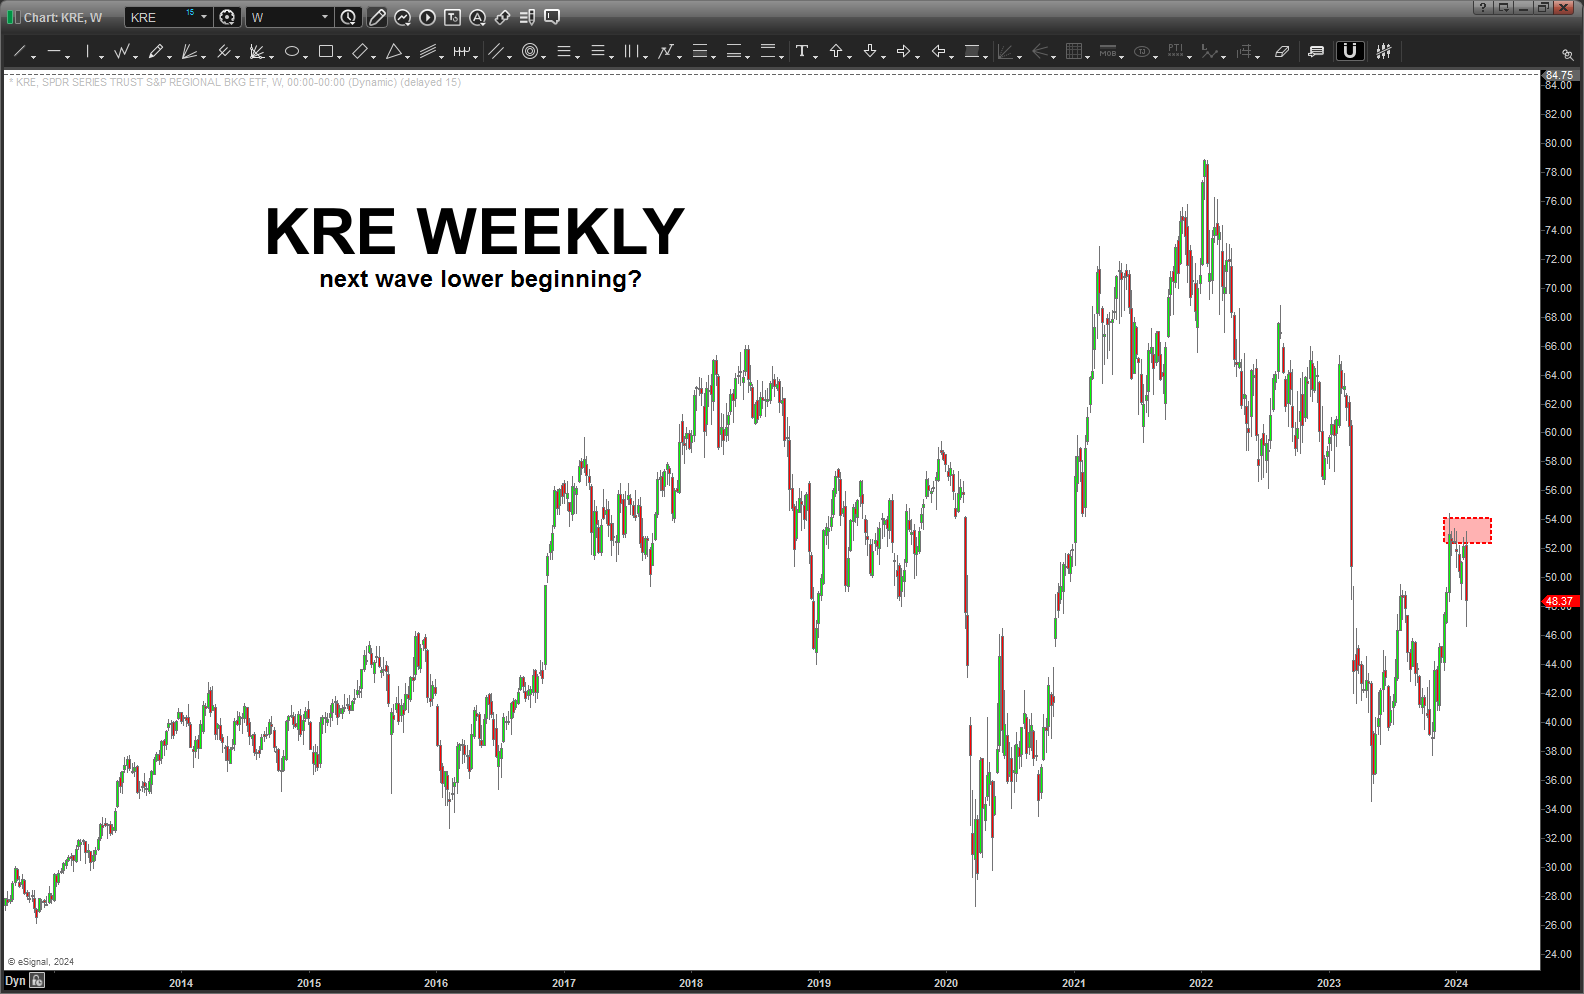
Sorry, not all in on this rally in the overall equity world UNTIL KRE smoke this sell pattern w/ a WEEKLY CLOSE on strength above 55.
If KRE keeps going lower, something is a foot at the circle K.

IBM – January 30, 2024
Posted on January 30, 2024 Leave a Comment
Last posts on IBM:
- https://atomic-temporary-44460632.wpcomstaging.com/2023/02/25/ibm-february-25-2023/
- https://atomic-temporary-44460632.wpcomstaging.com/2018/11/03/ibm-failure-and-a-new-set-up/
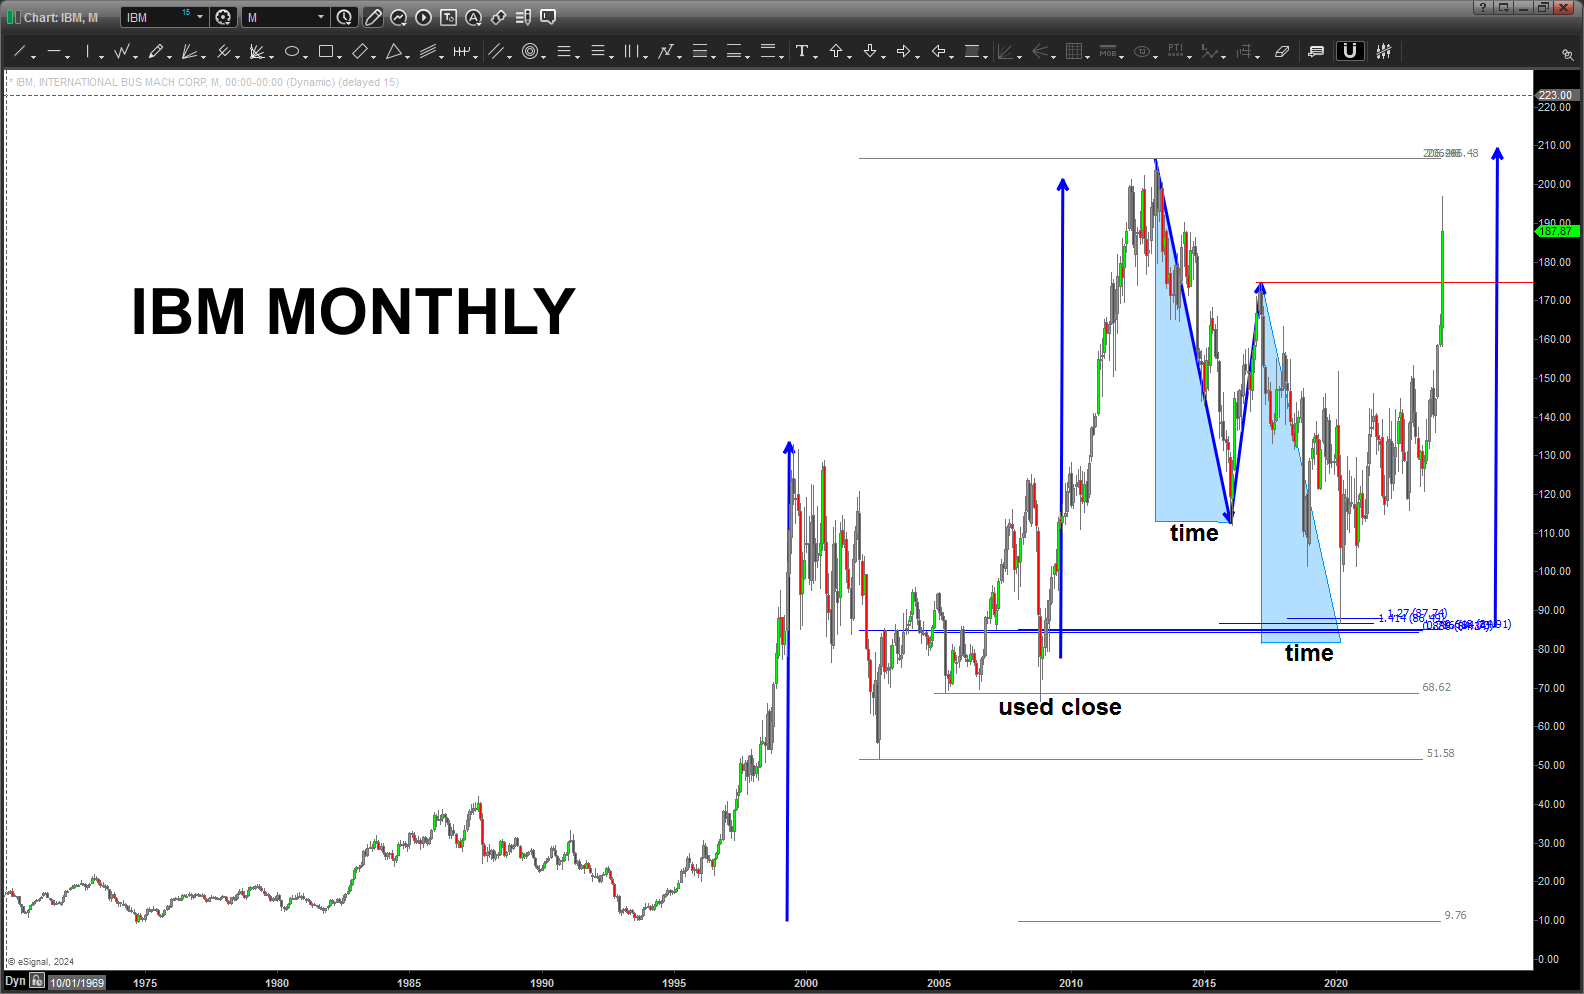
Taking some off the table w/ IBM.
Let the rest run w a stop below 174 on a daily close. Polarity – support is resistance and resistance is support.
Certainly looks like a run to new highs …
Apple (AAPL) – January 28, 2024
Posted on January 28, 2024 1 Comment
Last post on AAPL: https://atomic-temporary-44460632.wpcomstaging.com/2023/09/12/apple-aapl-september-12-2023/
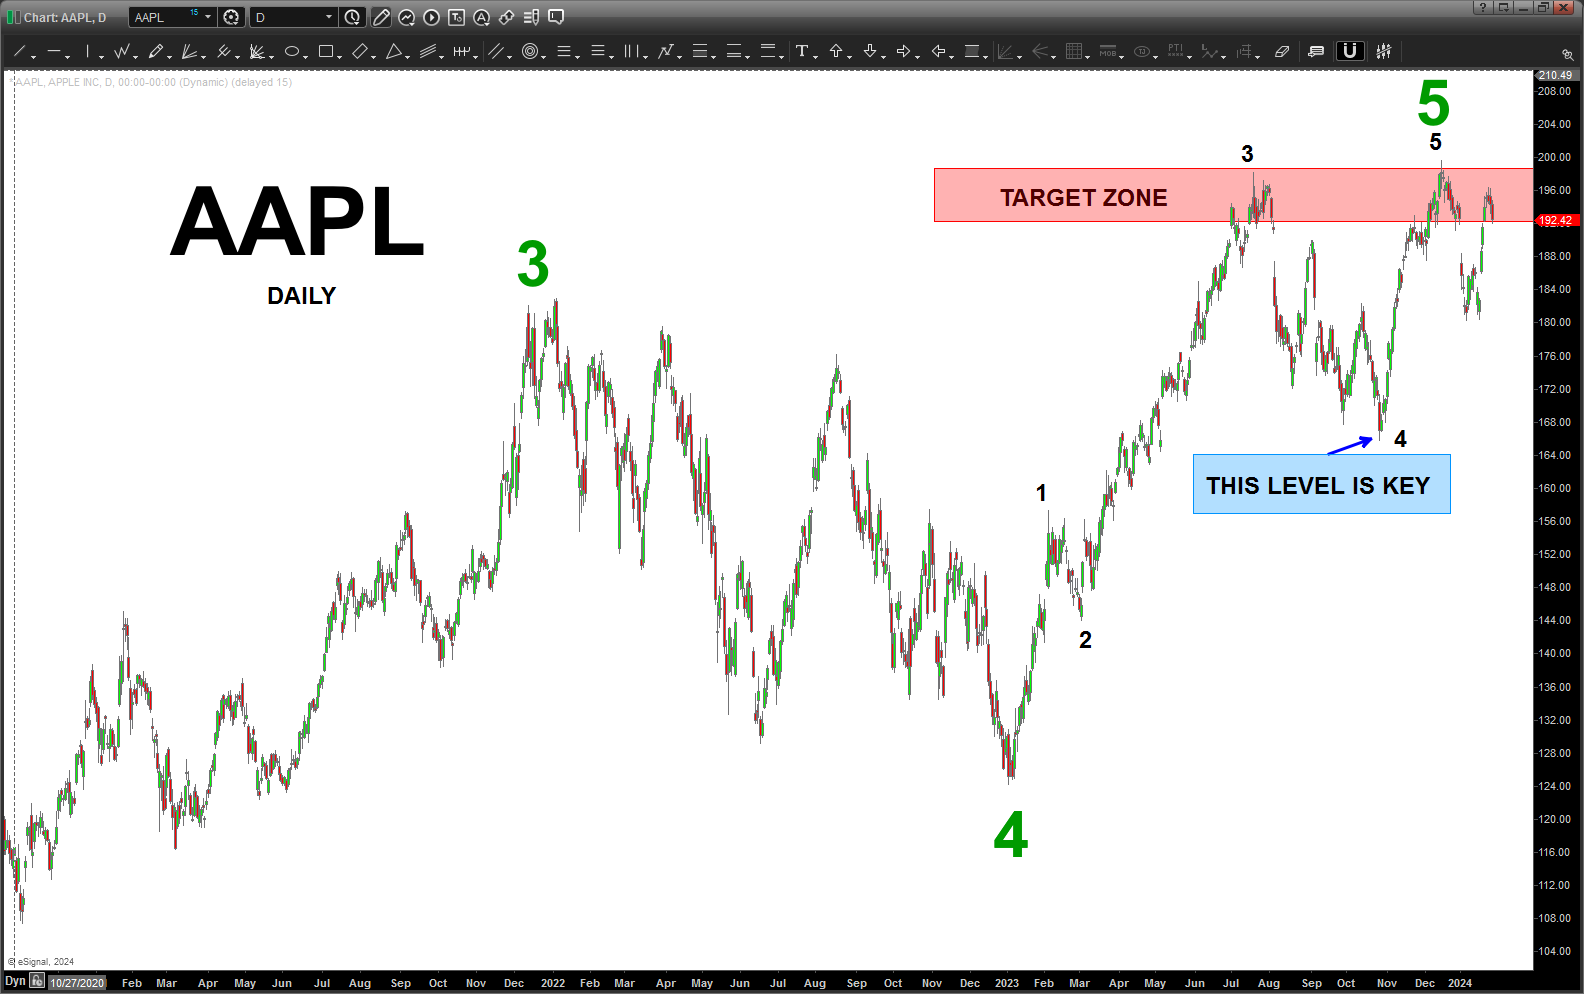
Well, looks like the “top of the circle” strikes again … I’ve been watching AAPL at a distance, not really paying attention to the company even though I have an Iphone and they know everything about me … more on that later, if you want. (?)
But, took a look tonight and there it was … the darn top of the circle was still holding the price action at bay .. like the above paragraph … more on that later, if you want. (?) 🙂
The key to me – like a lot of the charts I’ve been posting lately – this could end the final wave 5. Who knows … but, for whatever count you watch or listen to … I think we can see 5 waves up complete. so, this move lower from 196 should continue lower. Near term, expect the gap support around 184, to offer support or even a buy if your a max bull. I certainly would not … I’m not a max bear but I AM seeing a LOT of BEARISH PATTERNS (long term) appearing all over the place so … at least a “caveat emptor” would be appropriate about now. Only TIME will tell …
AVGO Broadcom – January 28, 2024
Posted on January 28, 2024 2 Comments
Last post on AVGO: https://atomic-temporary-44460632.wpcomstaging.com/2024/01/22/avgo-broadcom-january-22-2024/
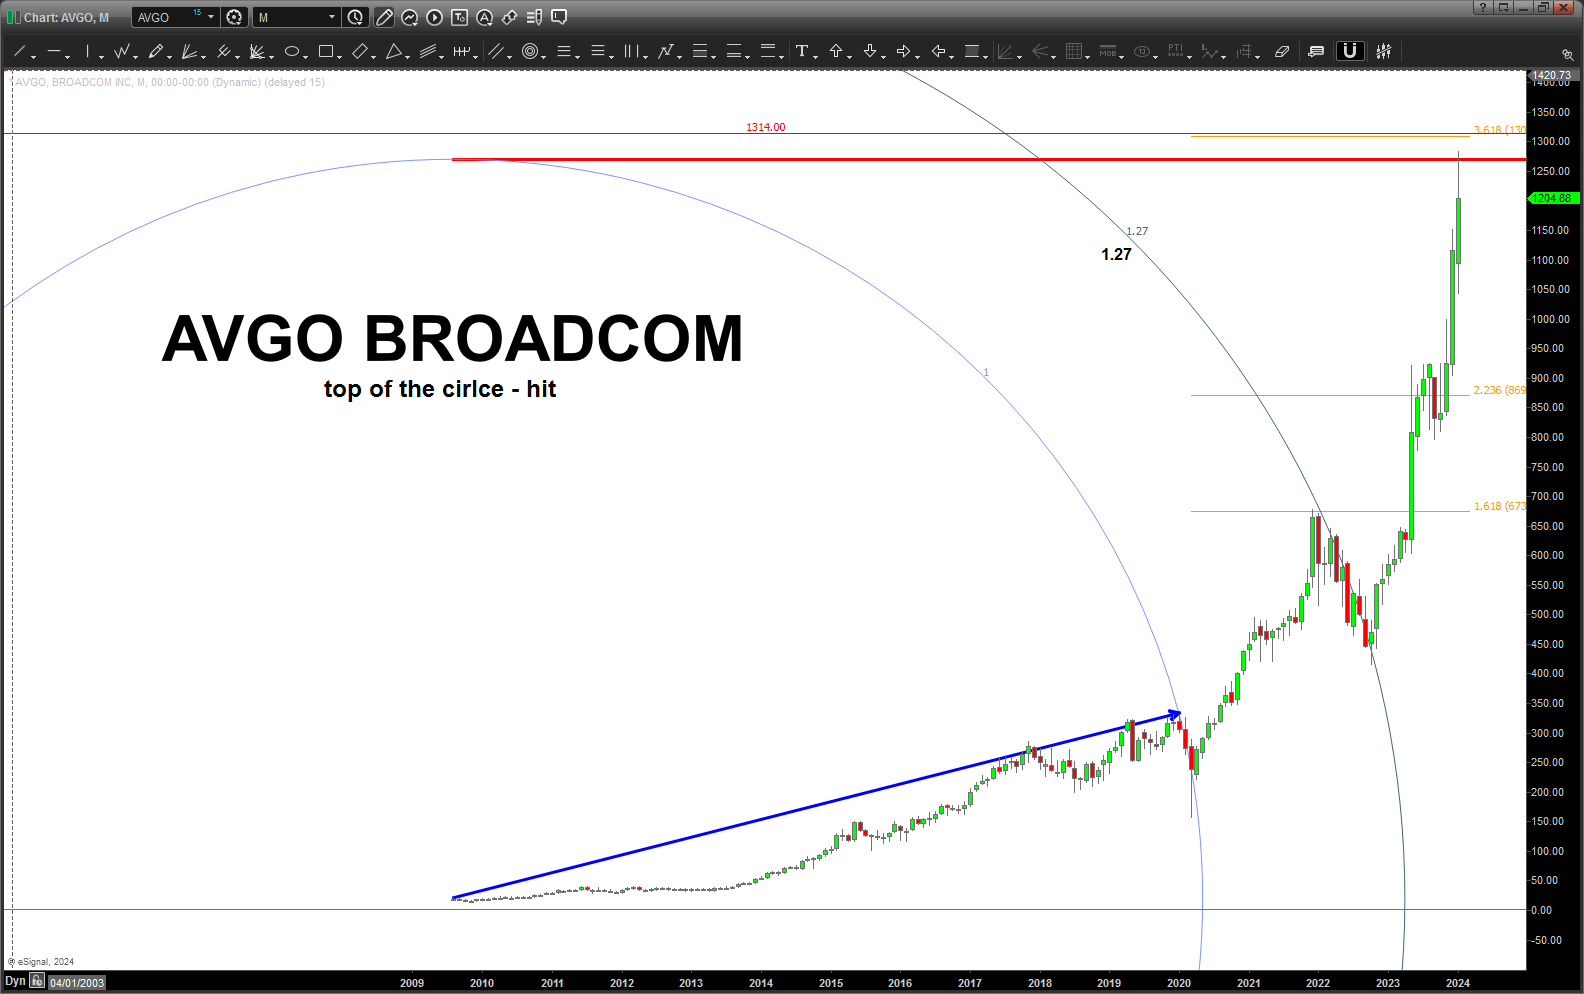
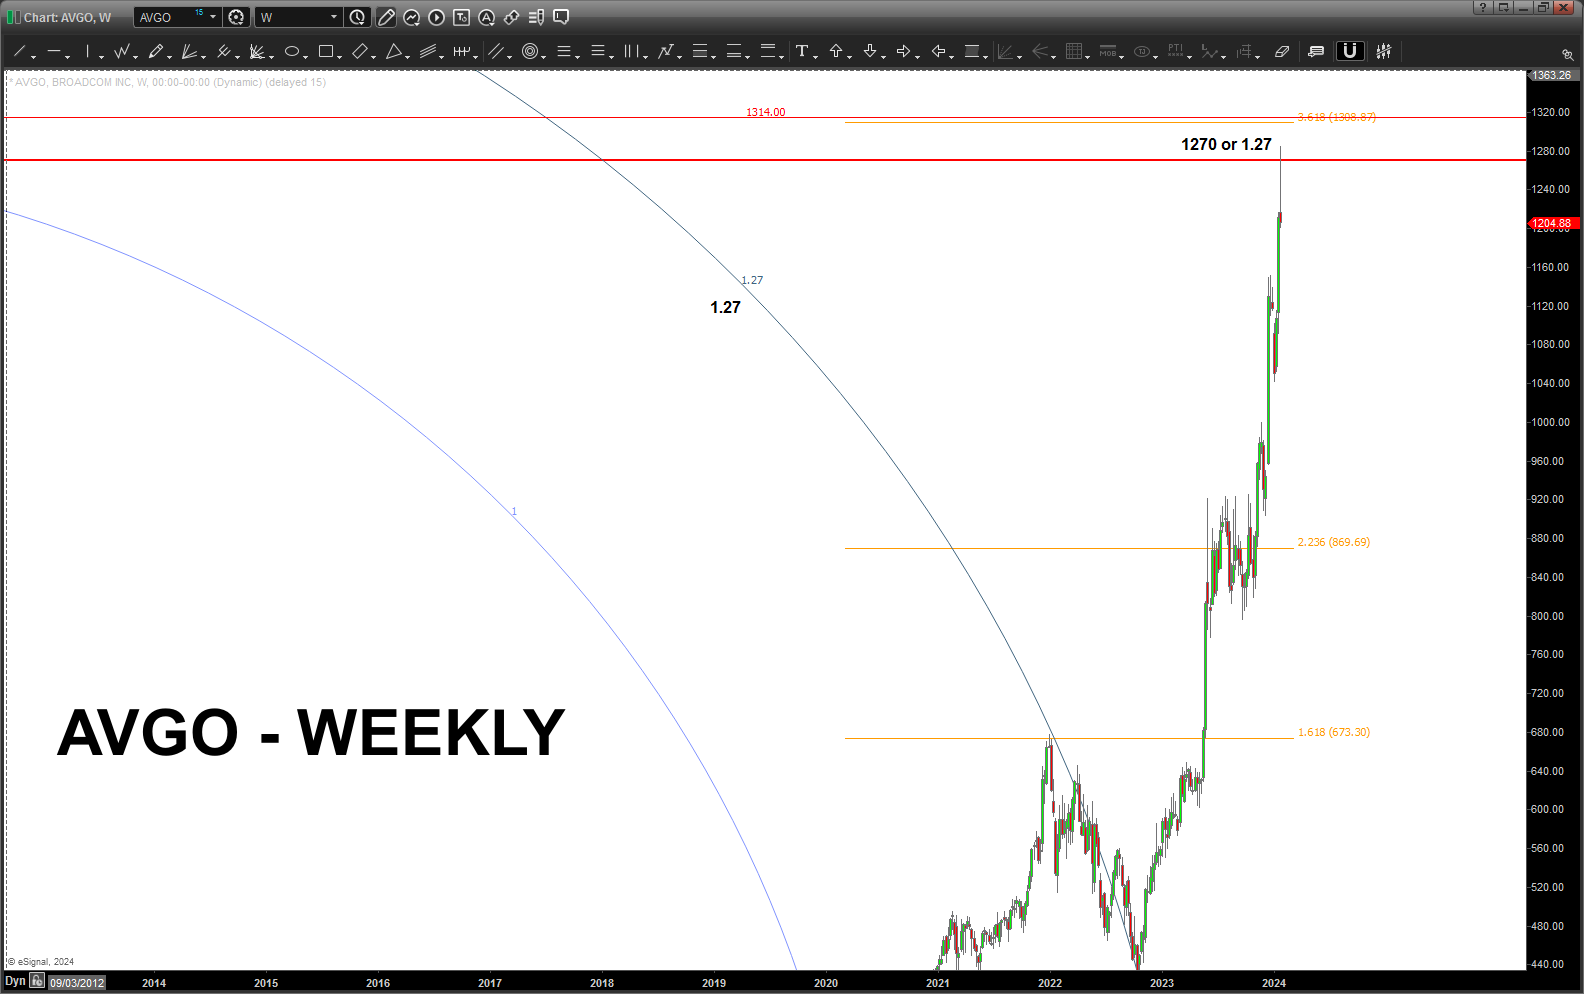
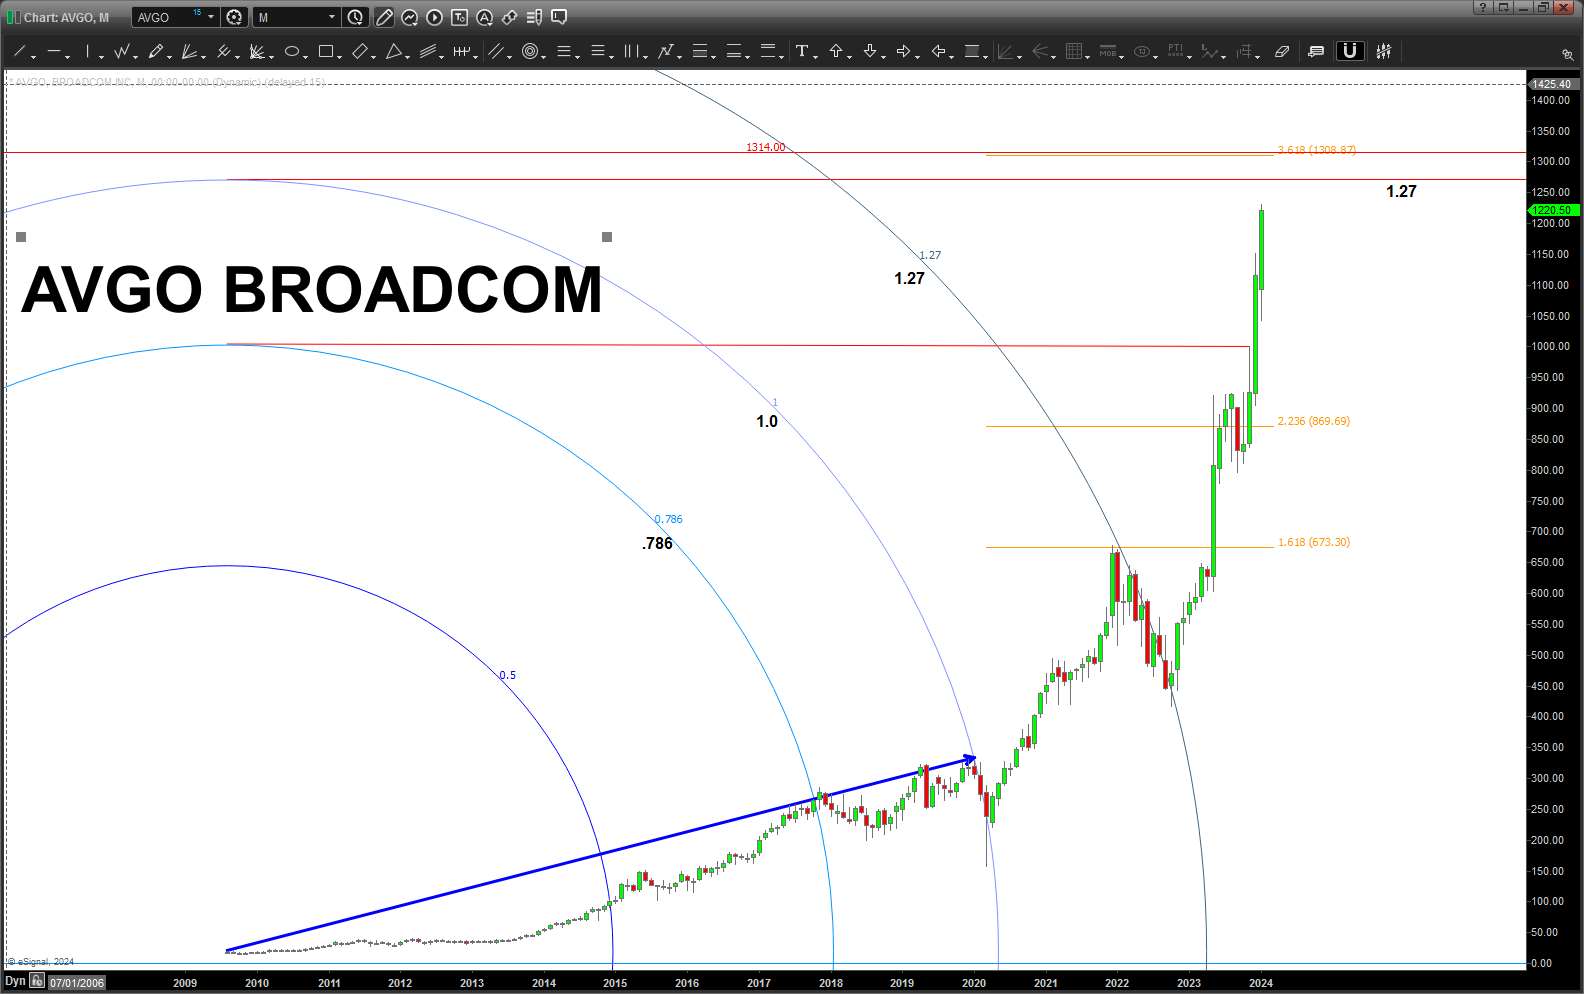
Top of the circle – hit.
Remember, we have a rocketship here so PATIENCE will be and is KEY!
S&P 500 CASH – January 28, 2024
Posted on January 28, 2024 Leave a Comment
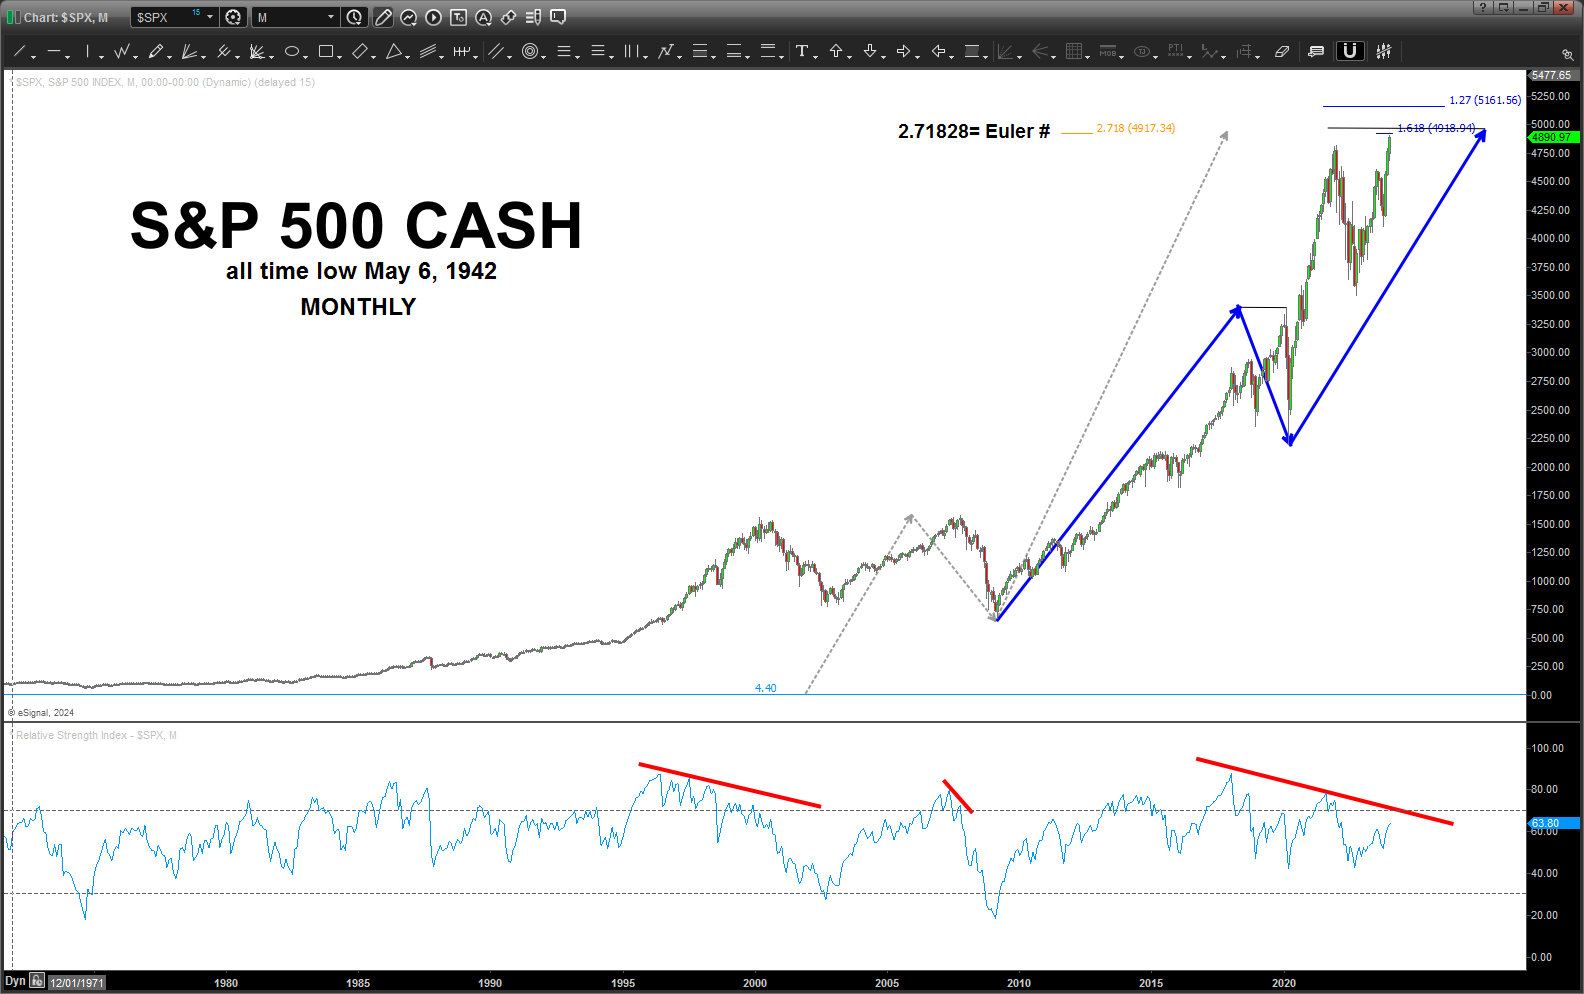
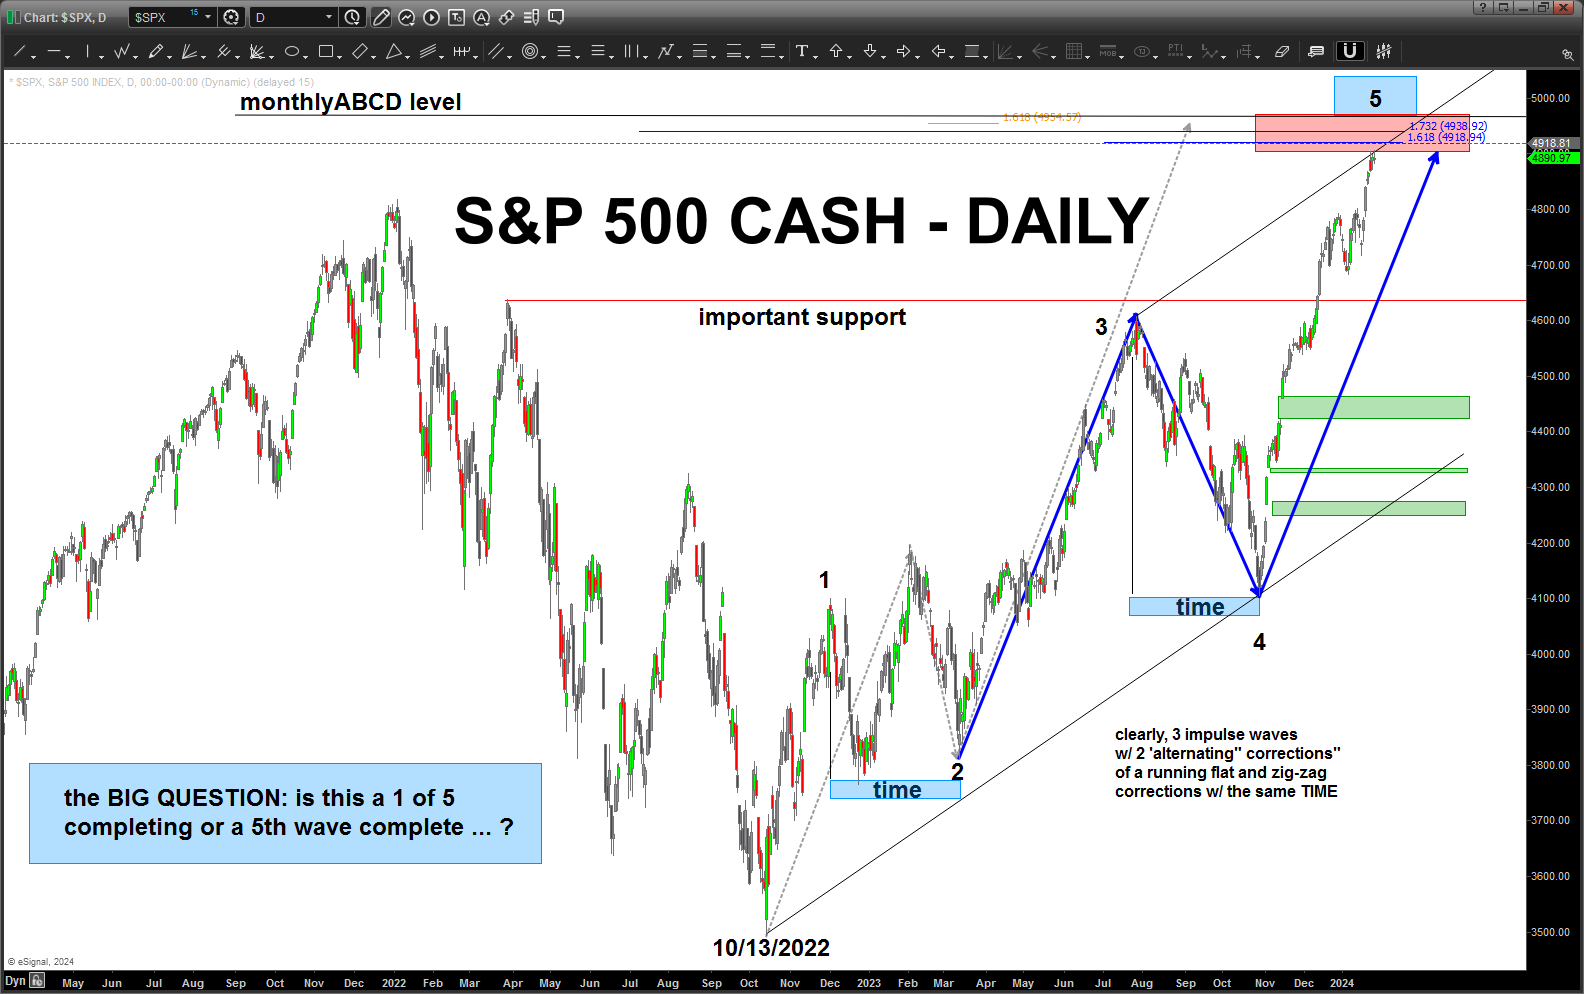
On the daily chart, below, we can clearly see 5 waves up completing … guess the questions is as follows:
Is this a BIG 5th wave completing OR is it the first wave of 5 waves?
Nobody really every knows.
AVGO Broadcom – January 22, 2024
Posted on January 22, 2024 1 Comment
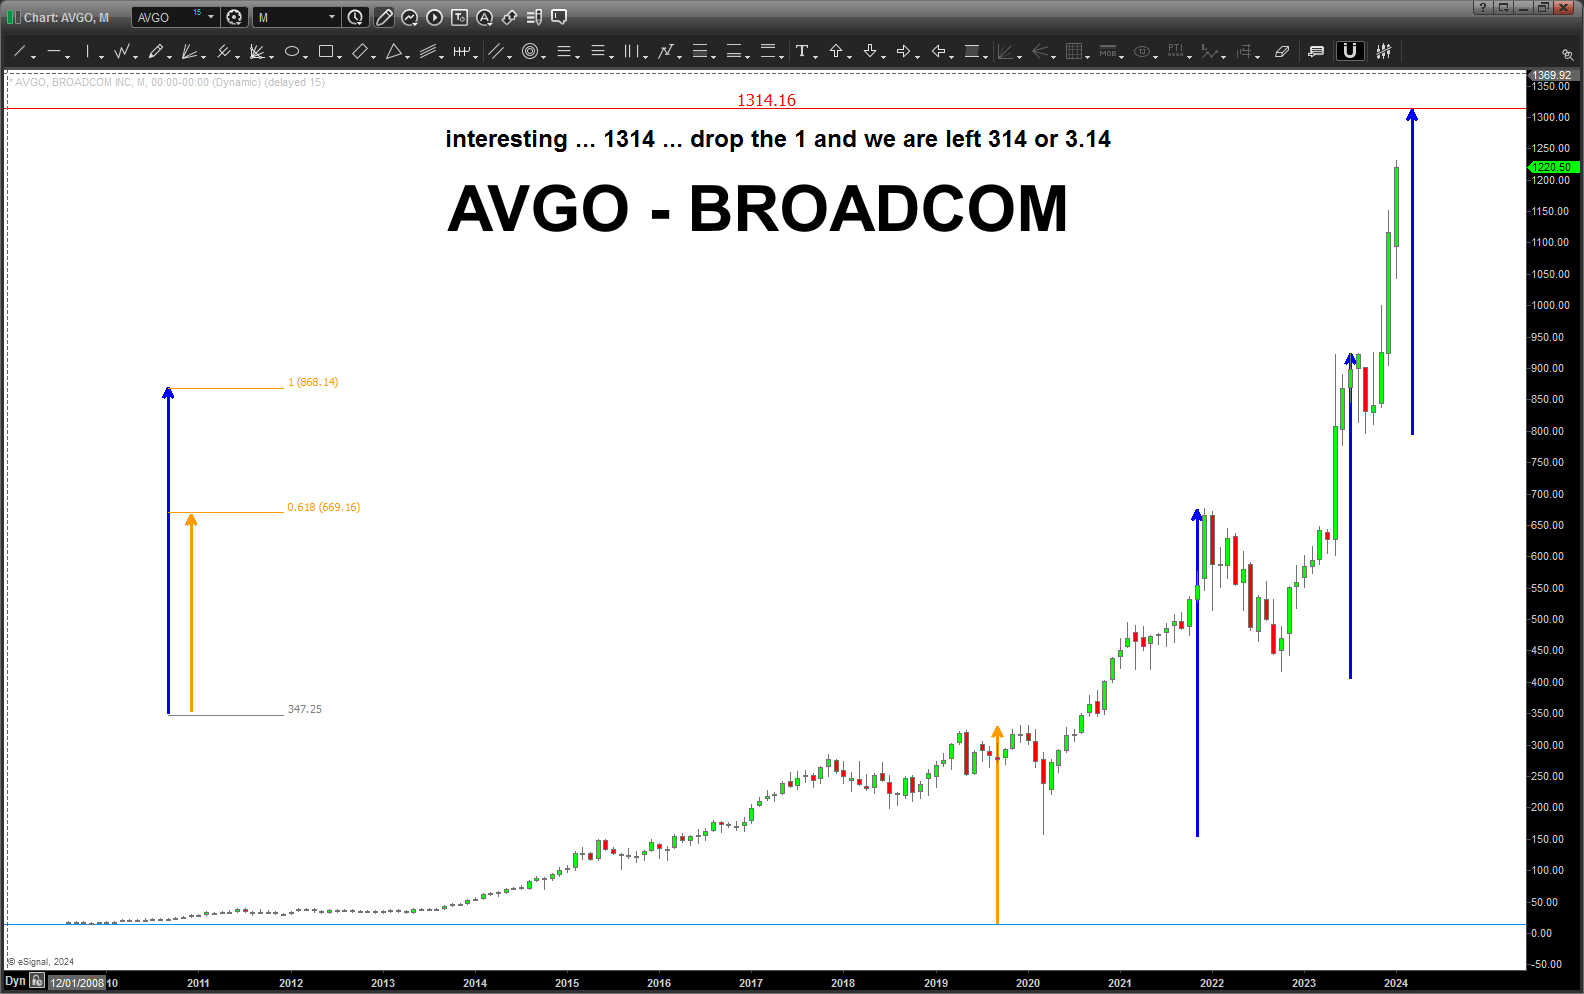
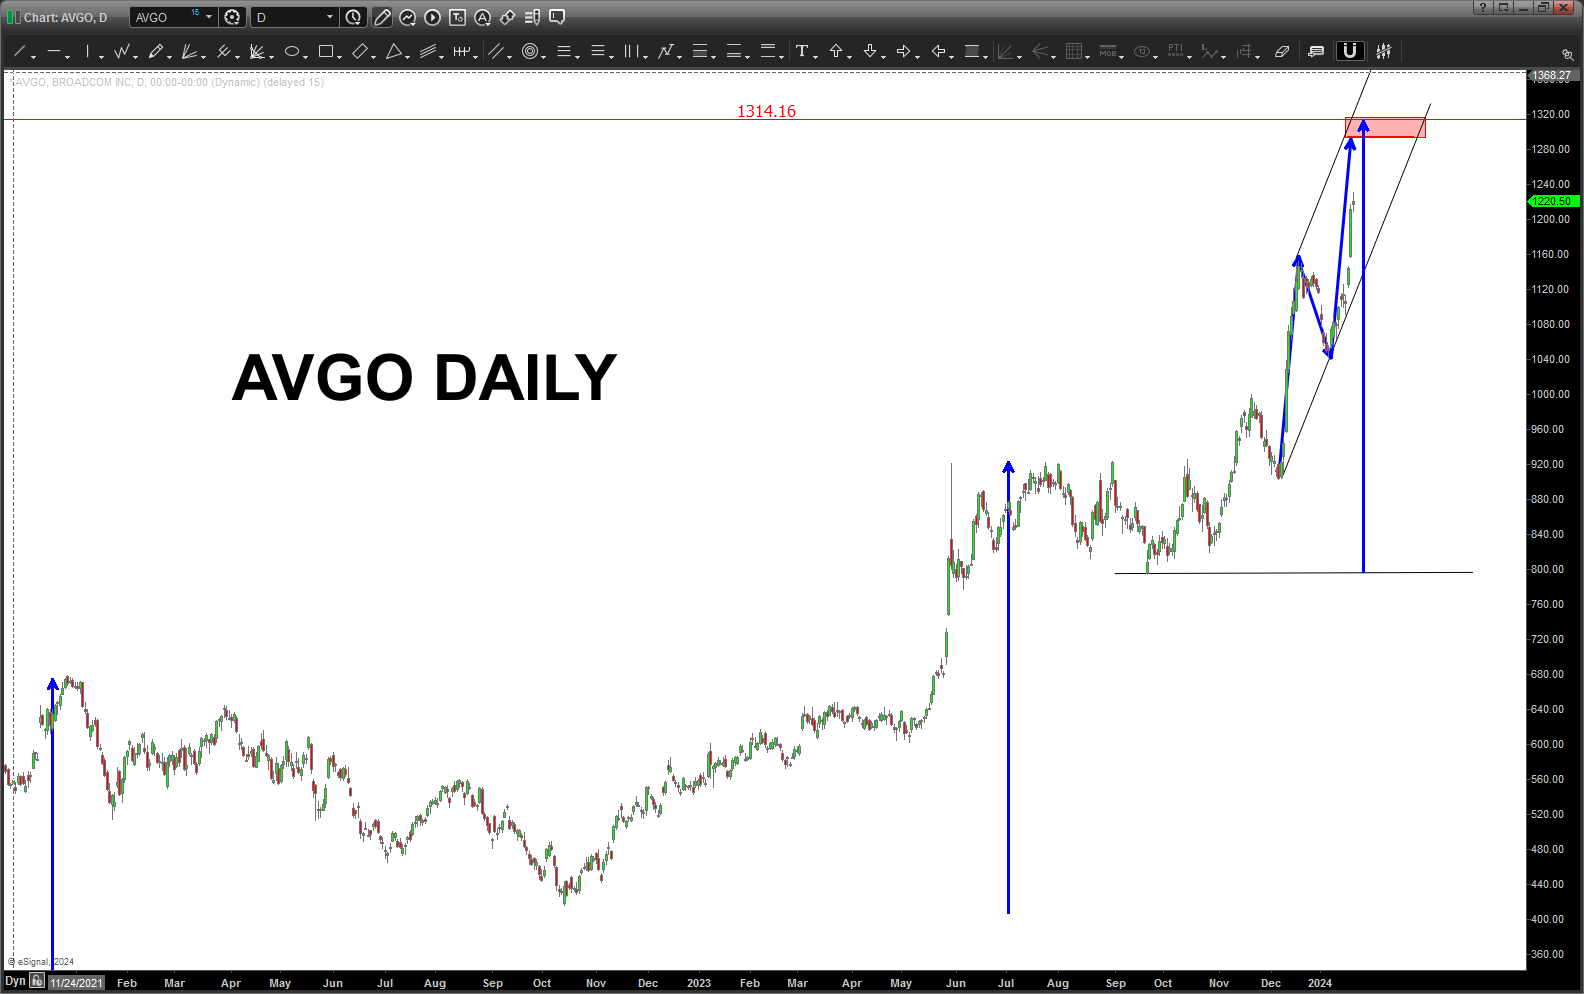
WAIT for weekly signal reversal candles before attempting to short … she’s parabolic and Scotty is “giving her all she’s got Captain …!”
XLK / XLP – January 21, 2024
Posted on January 21, 2024 Leave a Comment
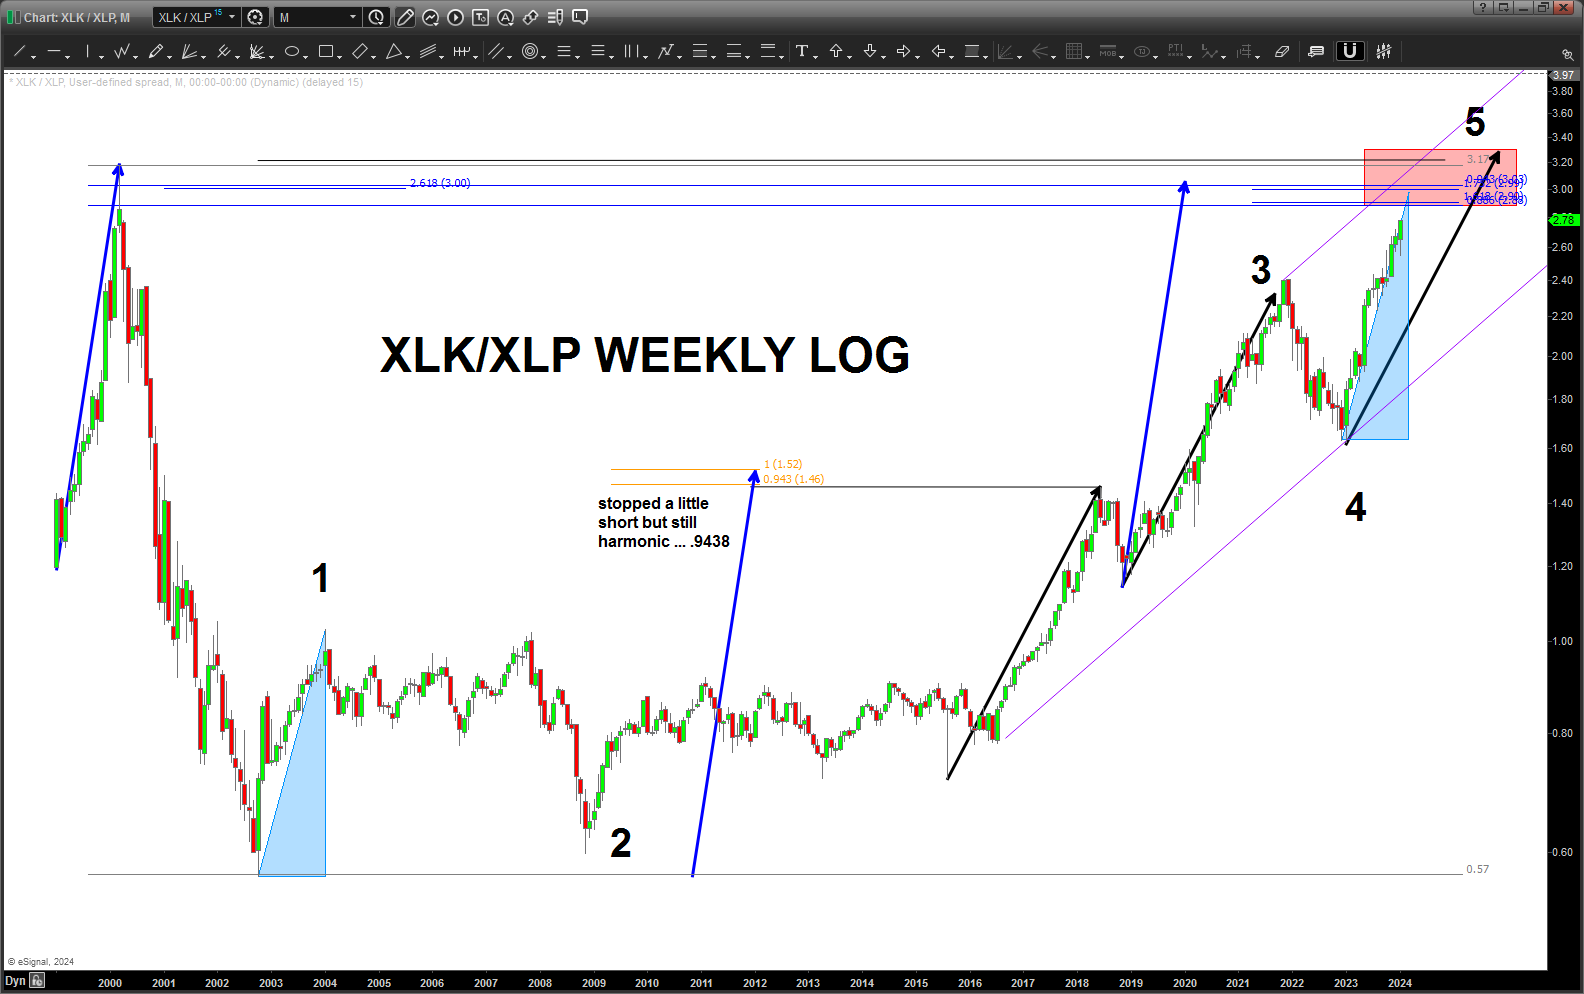
In the chart above, one can see the “blue measured moves” have been important price moves and, from a percentage perspective, EVERY move UP in the ratio has met resistance after the “blue measured move” has completed.
Remember, this is LOG scale so 1/ the measured moves are percentage moves and 2/ the corrections might not appear that large on a log scale (percentage) basis, but they are significant.
For example, the “blue measured move” from the all time low caused a 21% correction in the ratio once it completed … so, these blue measured moves completing are something we should put on our radar.
One of the main reasons we are paying attention to the “blue measured move” is because that was the move UP into the all time high and it works very nicely w/ the flow/harmony of this ratio analysis chart.
You will not see this equality unless you 1/ go to long term charts and 2/ take a peak at LOG scale on the larger time frame charts.
This ratio (XLK/XLP) can be used as a barometer for “risk on” and “risk off.” The thesis being IF risk is on THEN the high flying NASDAQ 100 zooms higher (as in now) and IF risk is off THEN institutions/large retail roll into “staples” for the conservative tub of toothpaste, toilet paper, etc. AKA – the staples.
Right now we have STRONG VOLUMINOUS candles so risk is on … I’ve captured some very important levels a little higher that could stop this puppy in it’s tracks.
Additionally, the EWT count I have doesn’t break any rules so 1,23,4,5 and then we roll over? No pride in authorship of my “EWT count” as that is what stuck out to me. I can see “other” bullish alternative counts BUT on all of them this is a 5th wave so a correction in the ratio, which in turn has put pressure on the NDX 100 in the past, should work again as resistance for the NDX..
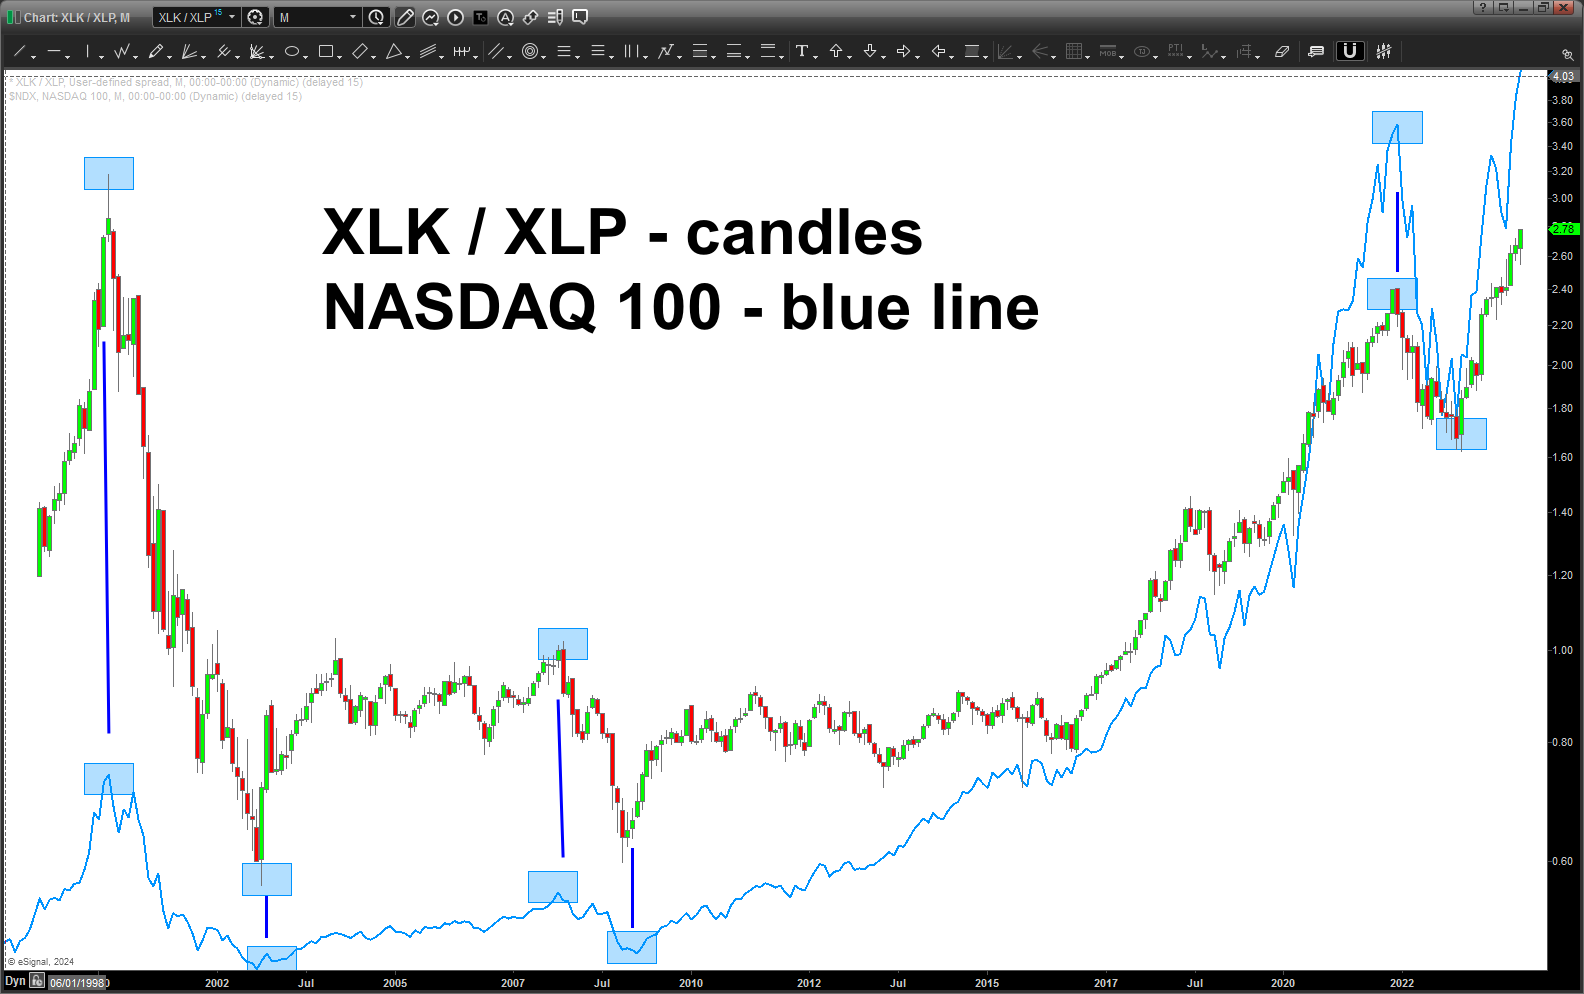
One last, take note of the above chart. These “sentiment” ratio analysis tools are excellent timing tools for the overall healthiness of the market. The PATTERNS work on them because the instruments being compared (ETF’s XLK and XLP) are, themselves, liquid.
In the environment we are in right now, I am going to WAIT for a signal reversal candle on a weekly basis to short this market. Parabolic arcs are appearing everywhere … over the past weekend I’ve come up w/ some pretty powerful levels based on a host of geometry, music, etc. and some of, after 10K’s of hours on the charts, the more “esoteric” (yet most profound implications for life on this planet) methods to simply manage risk.
DO NOT BE SURPRISED IF THESE LEVELS GET SMOKED AND THE TRAIN KEEPS ROLLING …IT’S JUST PROBABILITY FOLKS.
For those of you who have been following me for a while, when I start posting like crazy, it’s usually meant something is coming. Could be monstrous bullish …! WHO KNOWS.
The point being … when PATTERNS appear on the weekly/monthly across the board it’s a signal that “cycles are converging” because, ultimately, that is what the patterns are …they are a confluence of PRICE and TIME that will cause an inflection in the market. The LARGER TIME FRAME the PATTERN the LONGER THE TIME CYCLE HENCE THEIR IMPORTANCE …

