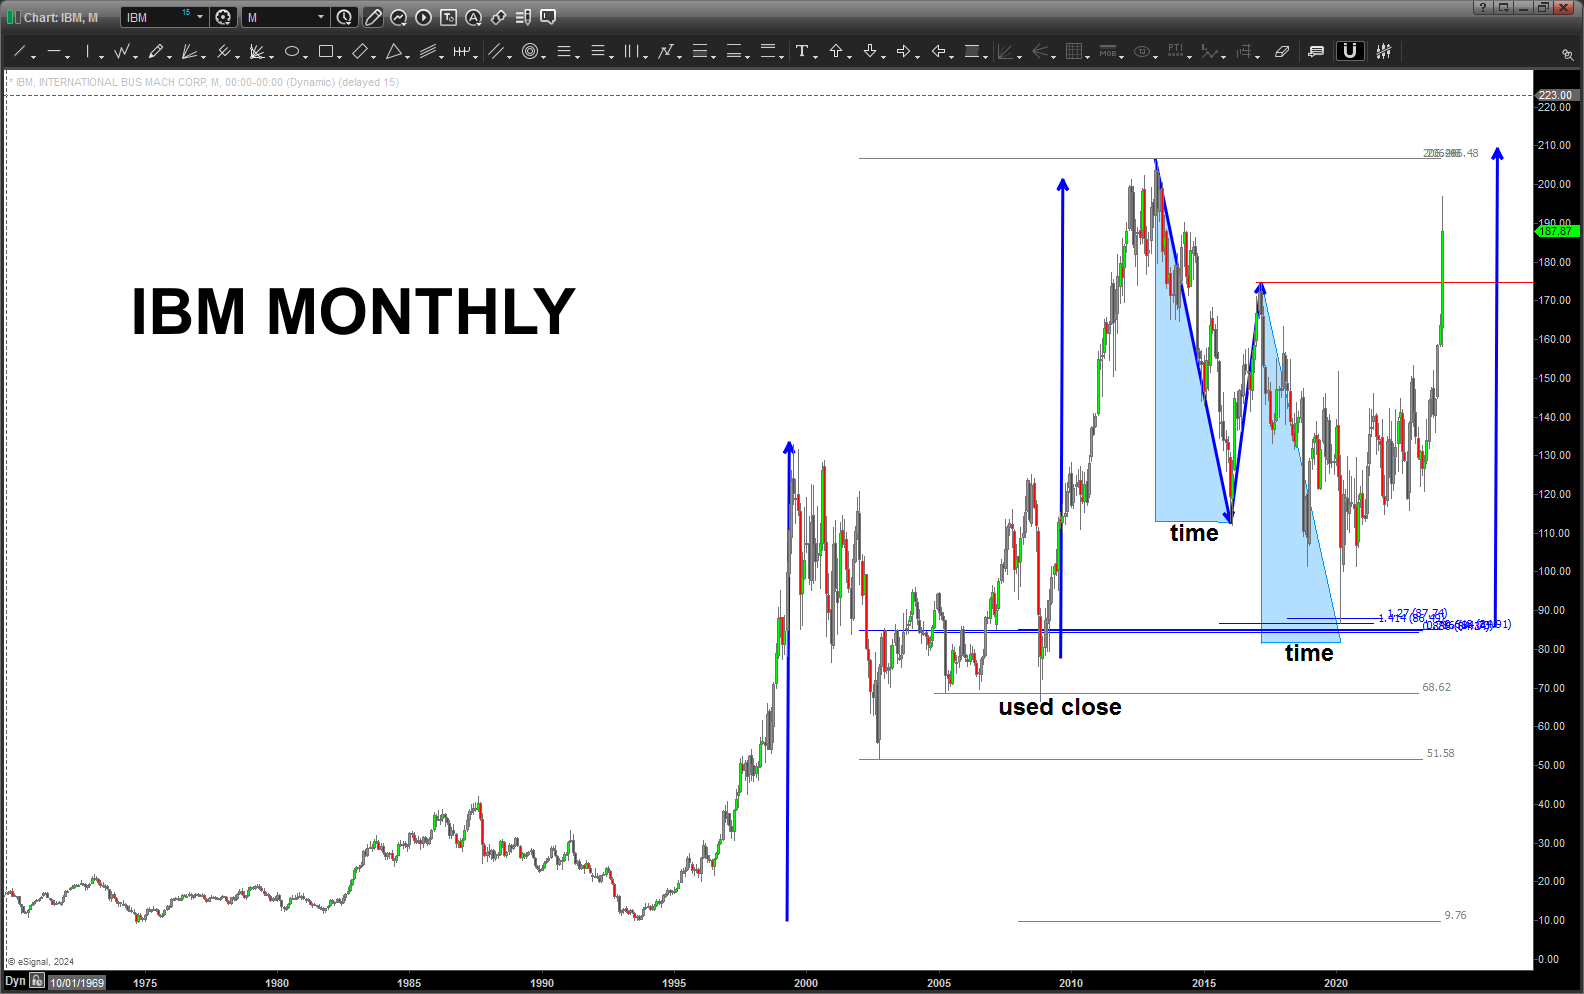
IBM – January 30, 2024
Posted on January 30, 2024 Leave a Comment
Last posts on IBM:
- https://atomic-temporary-44460632.wpcomstaging.com/2023/02/25/ibm-february-25-2023/
- https://atomic-temporary-44460632.wpcomstaging.com/2018/11/03/ibm-failure-and-a-new-set-up/
Taking some off the table w/ IBM.
Let the rest run w a stop below 174 on a daily close. Polarity – support is resistance and resistance is support.
Certainly looks like a run to new highs …
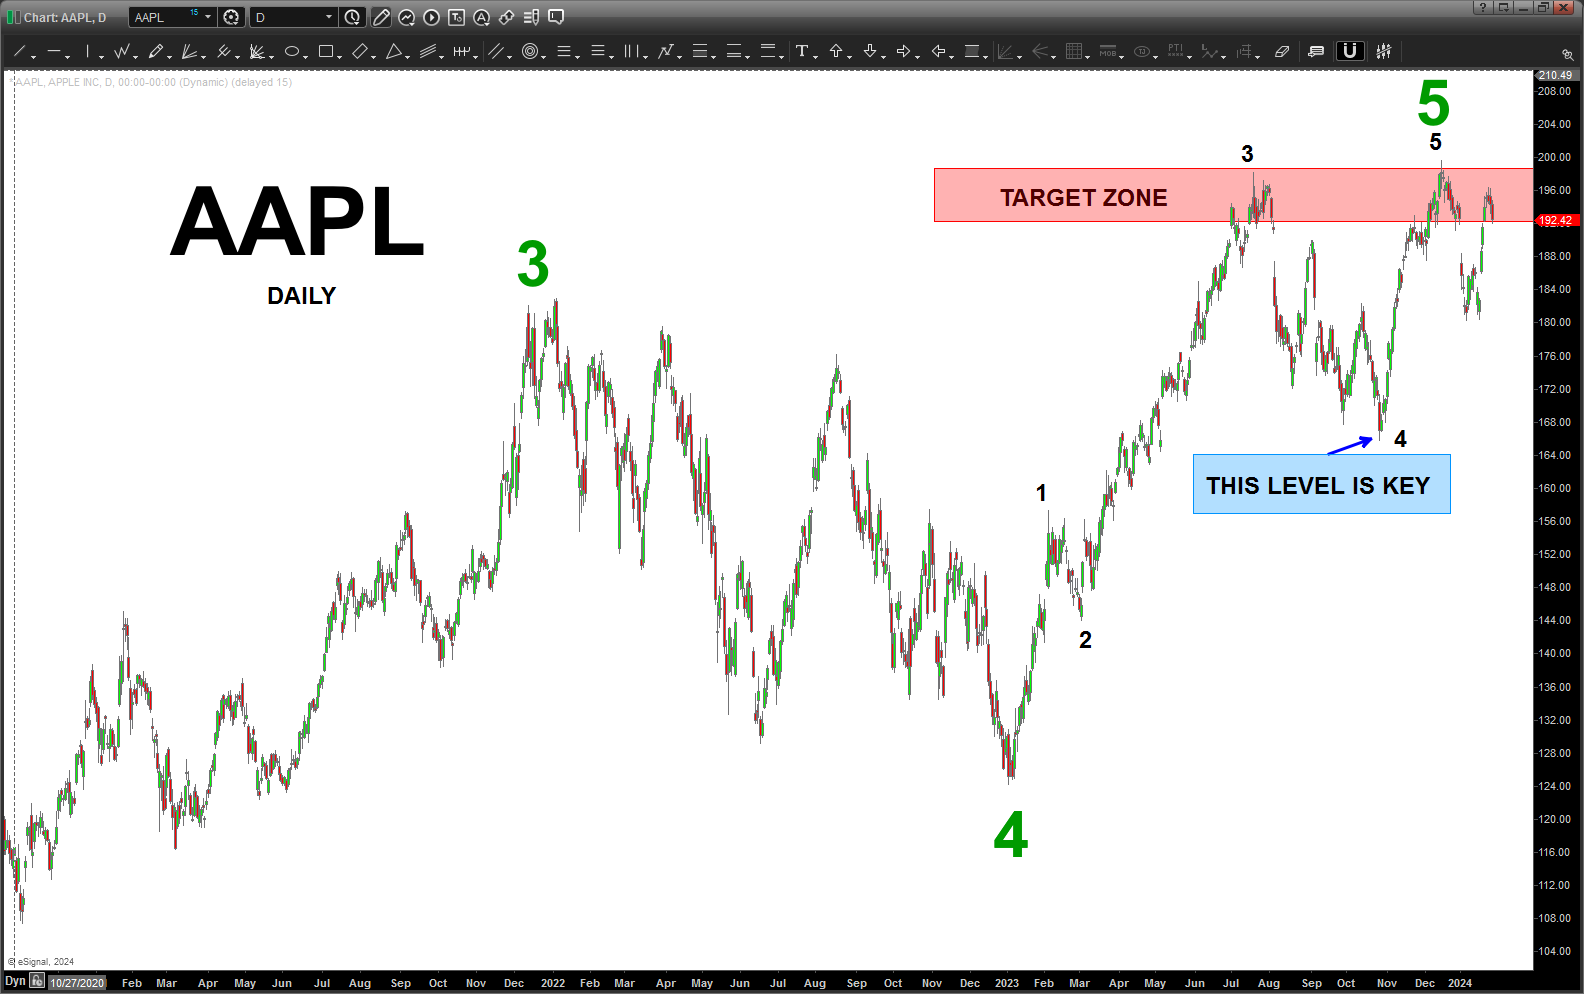
Apple (AAPL) – January 28, 2024
Posted on January 28, 2024 1 Comment
Last post on AAPL: https://atomic-temporary-44460632.wpcomstaging.com/2023/09/12/apple-aapl-september-12-2023/
Well, looks like the “top of the circle” strikes again … I’ve been watching AAPL at a distance, not really paying attention to the company even though I have an Iphone and they know everything about me … more on that later, if you want. (?)
But, took a look tonight and there it was … the darn top of the circle was still holding the price action at bay .. like the above paragraph … more on that later, if you want. (?) 🙂
The key to me – like a lot of the charts I’ve been posting lately – this could end the final wave 5. Who knows … but, for whatever count you watch or listen to … I think we can see 5 waves up complete. so, this move lower from 196 should continue lower. Near term, expect the gap support around 184, to offer support or even a buy if your a max bull. I certainly would not … I’m not a max bear but I AM seeing a LOT of BEARISH PATTERNS (long term) appearing all over the place so … at least a “caveat emptor” would be appropriate about now. Only TIME will tell …
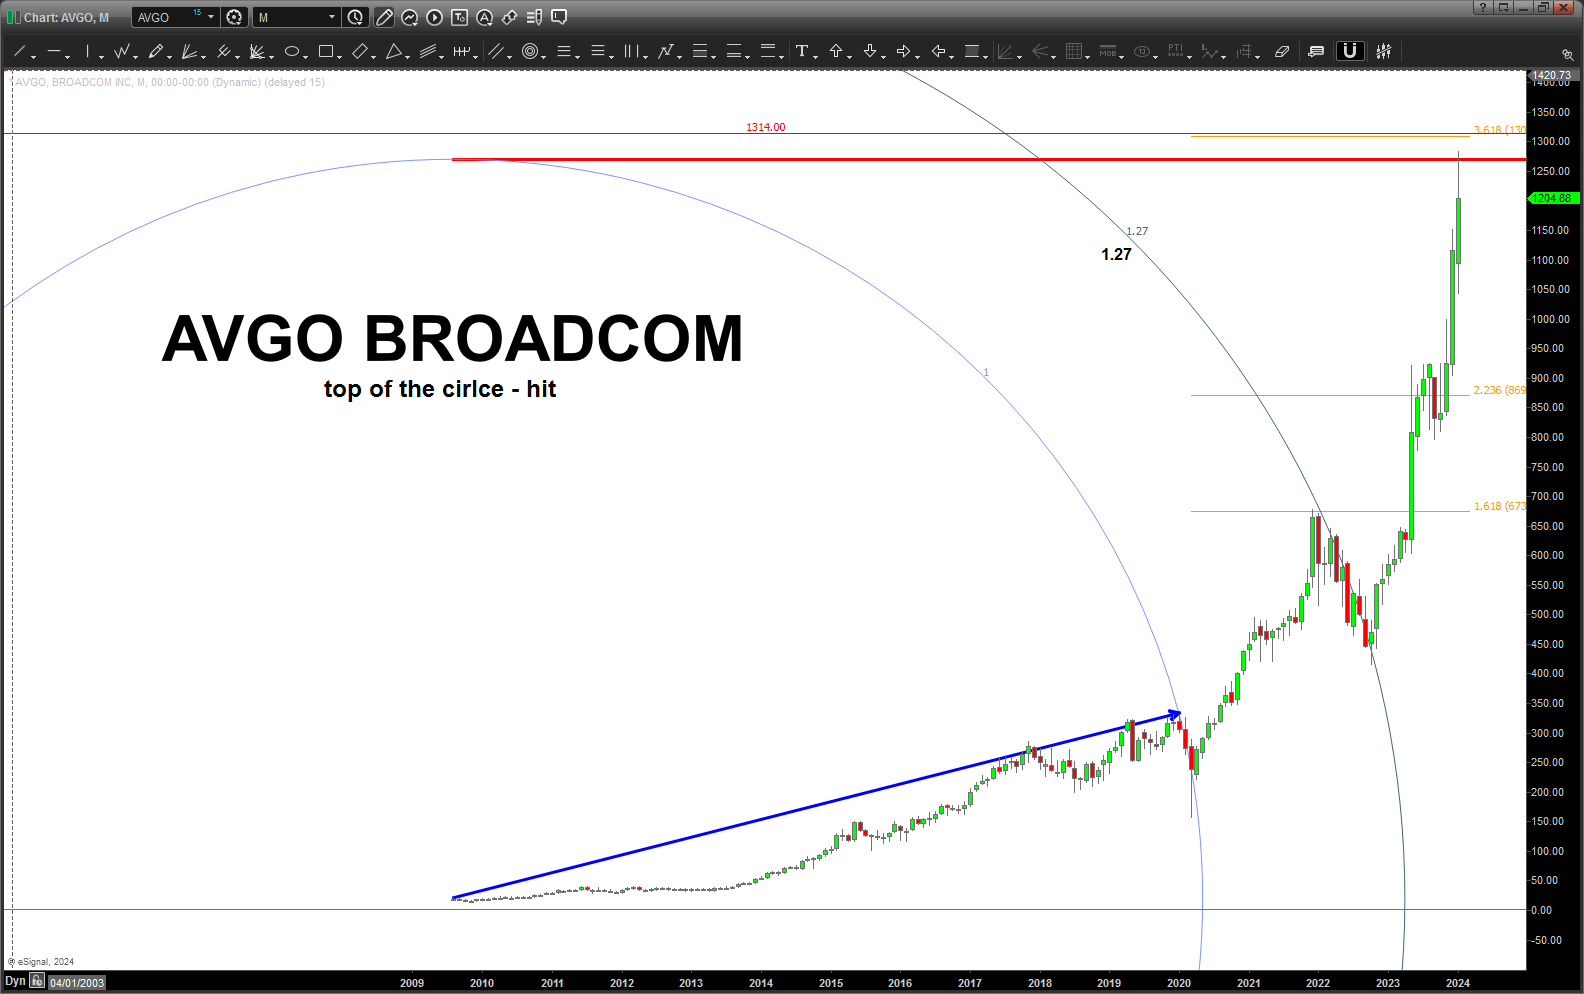
AVGO Broadcom – January 28, 2024
Posted on January 28, 2024 2 Comments
Last post on AVGO: https://atomic-temporary-44460632.wpcomstaging.com/2024/01/22/avgo-broadcom-january-22-2024/
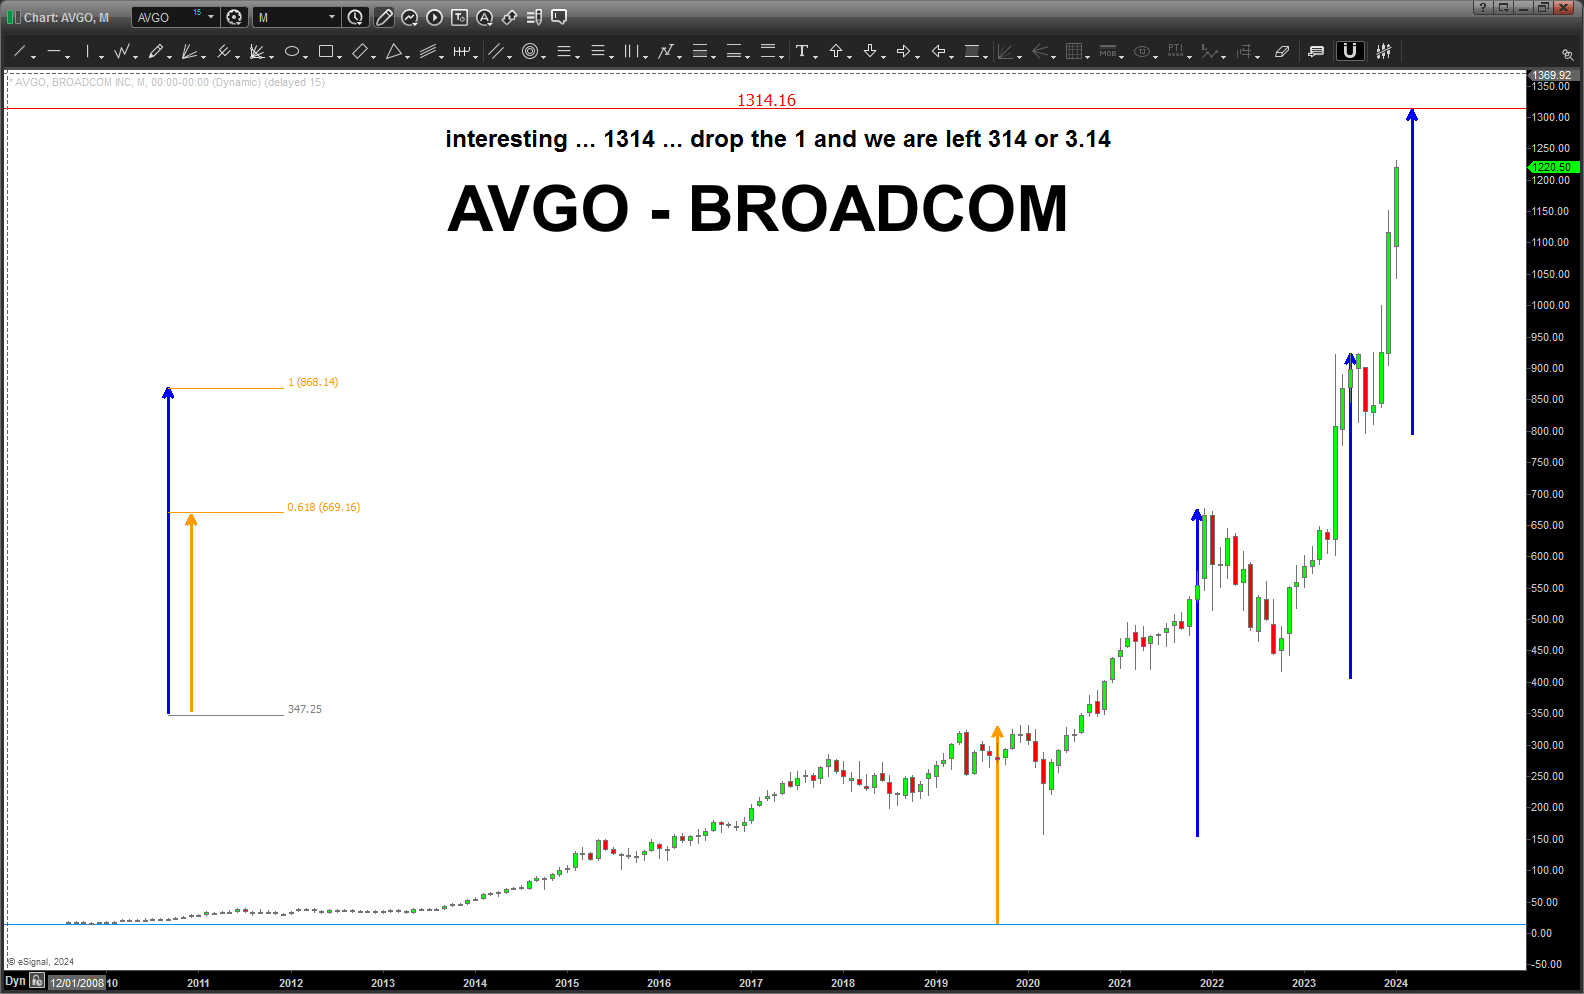
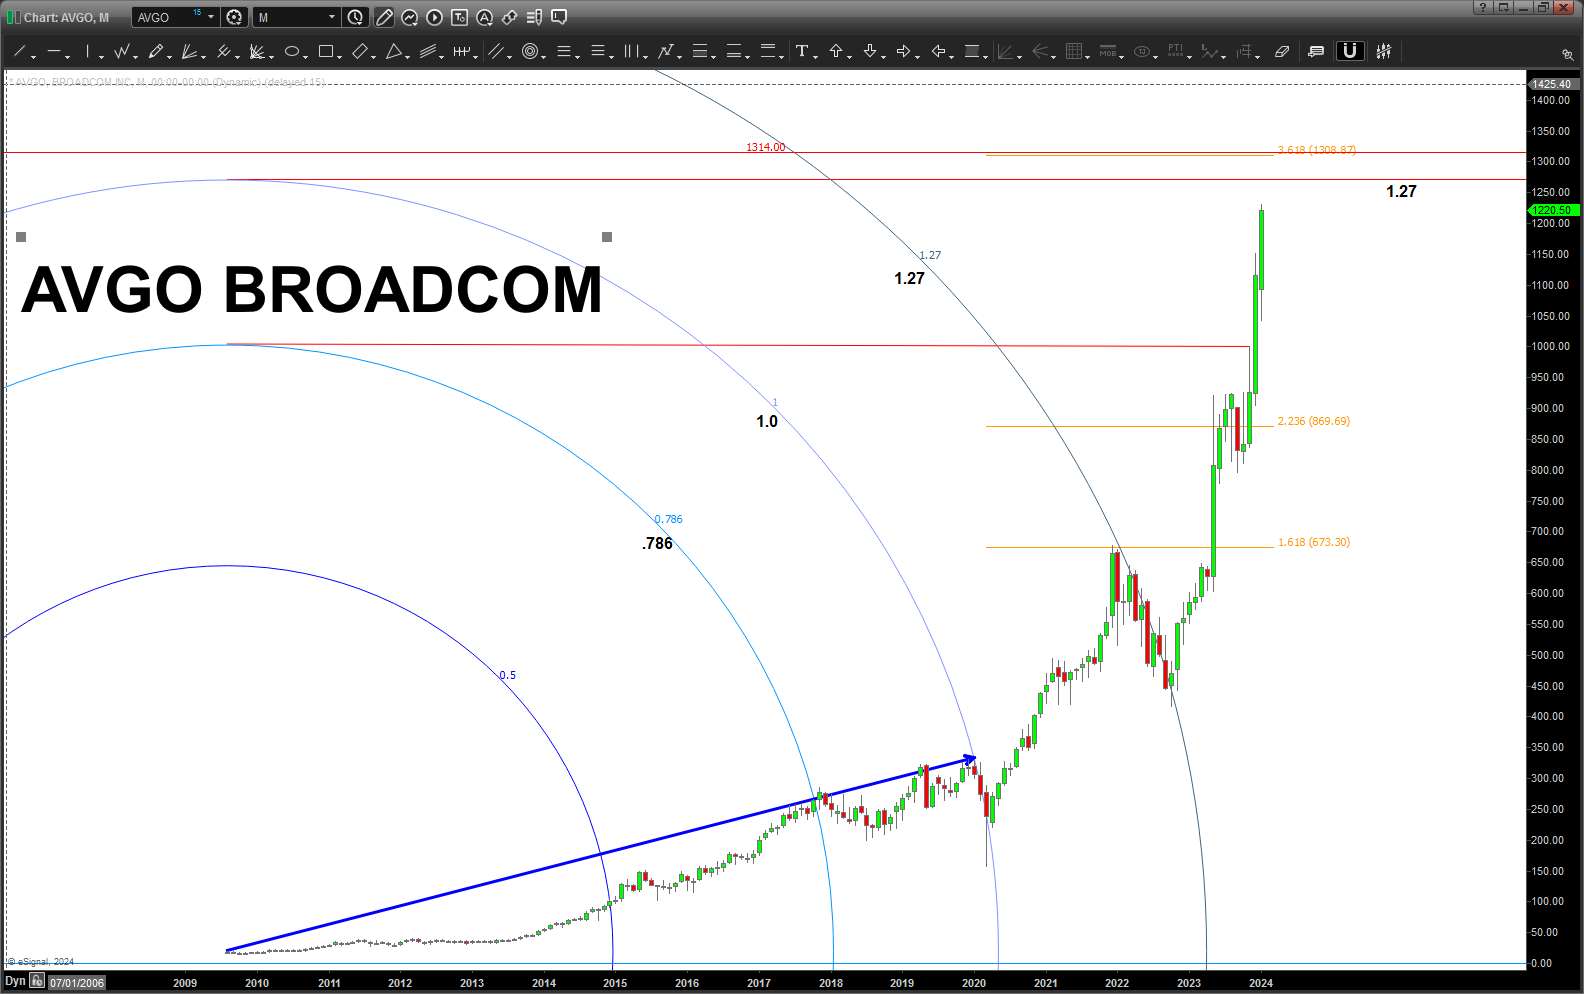
Top of the circle – hit.
Remember, we have a rocketship here so PATIENCE will be and is KEY!
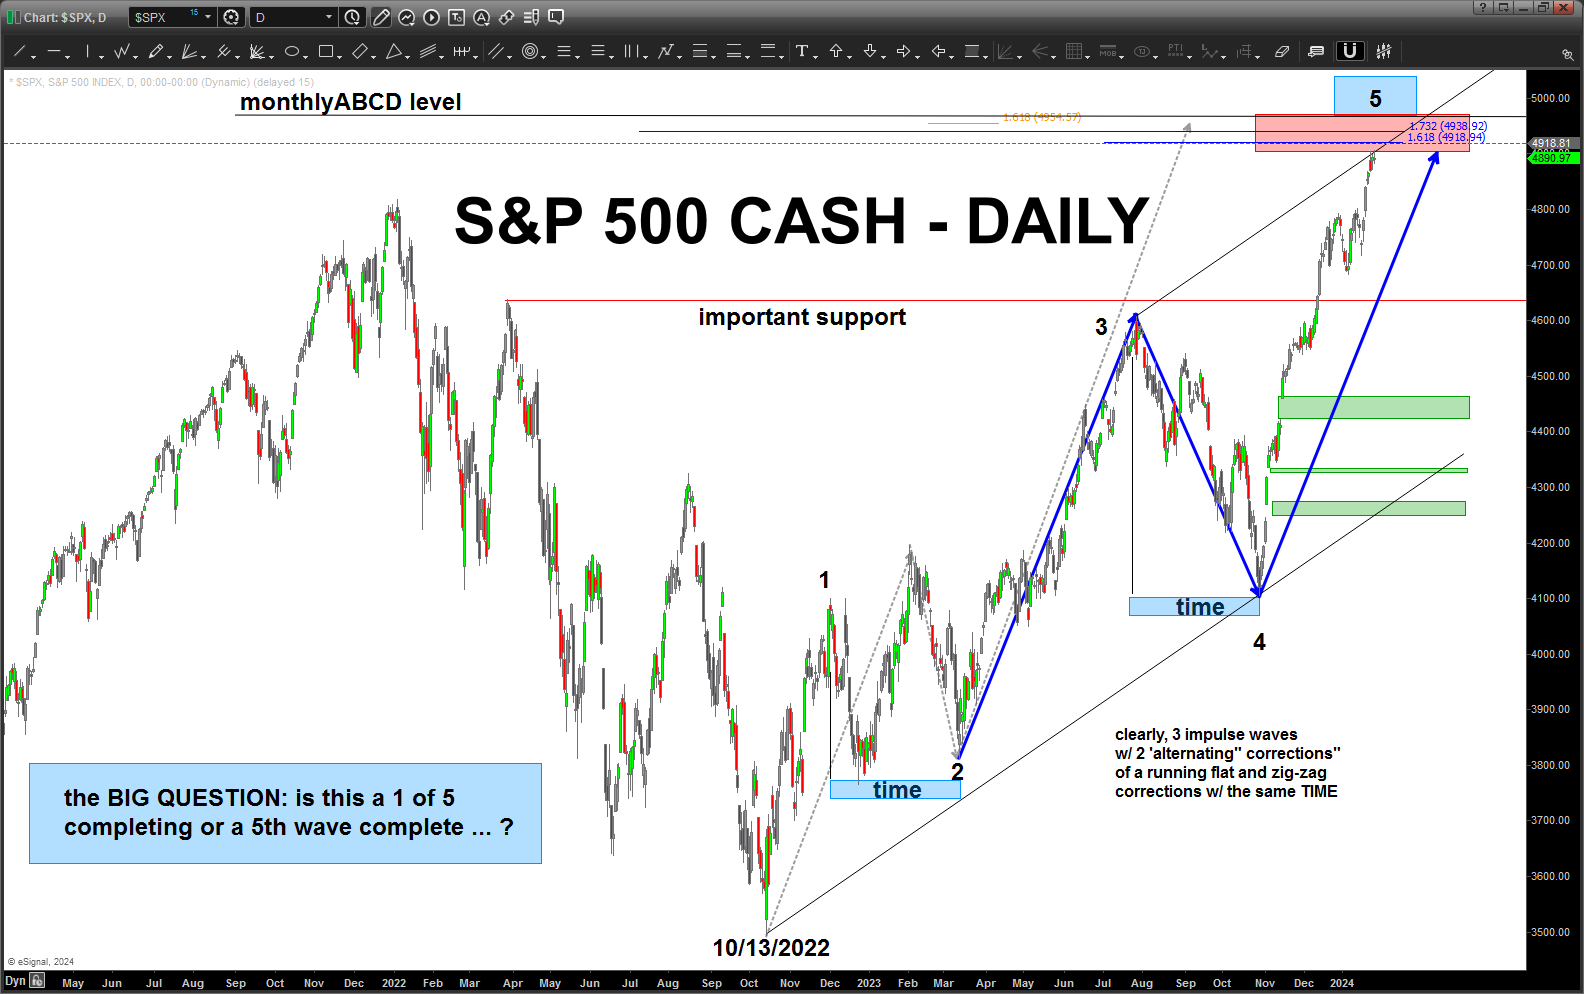
S&P 500 CASH – January 28, 2024
Posted on January 28, 2024 Leave a Comment
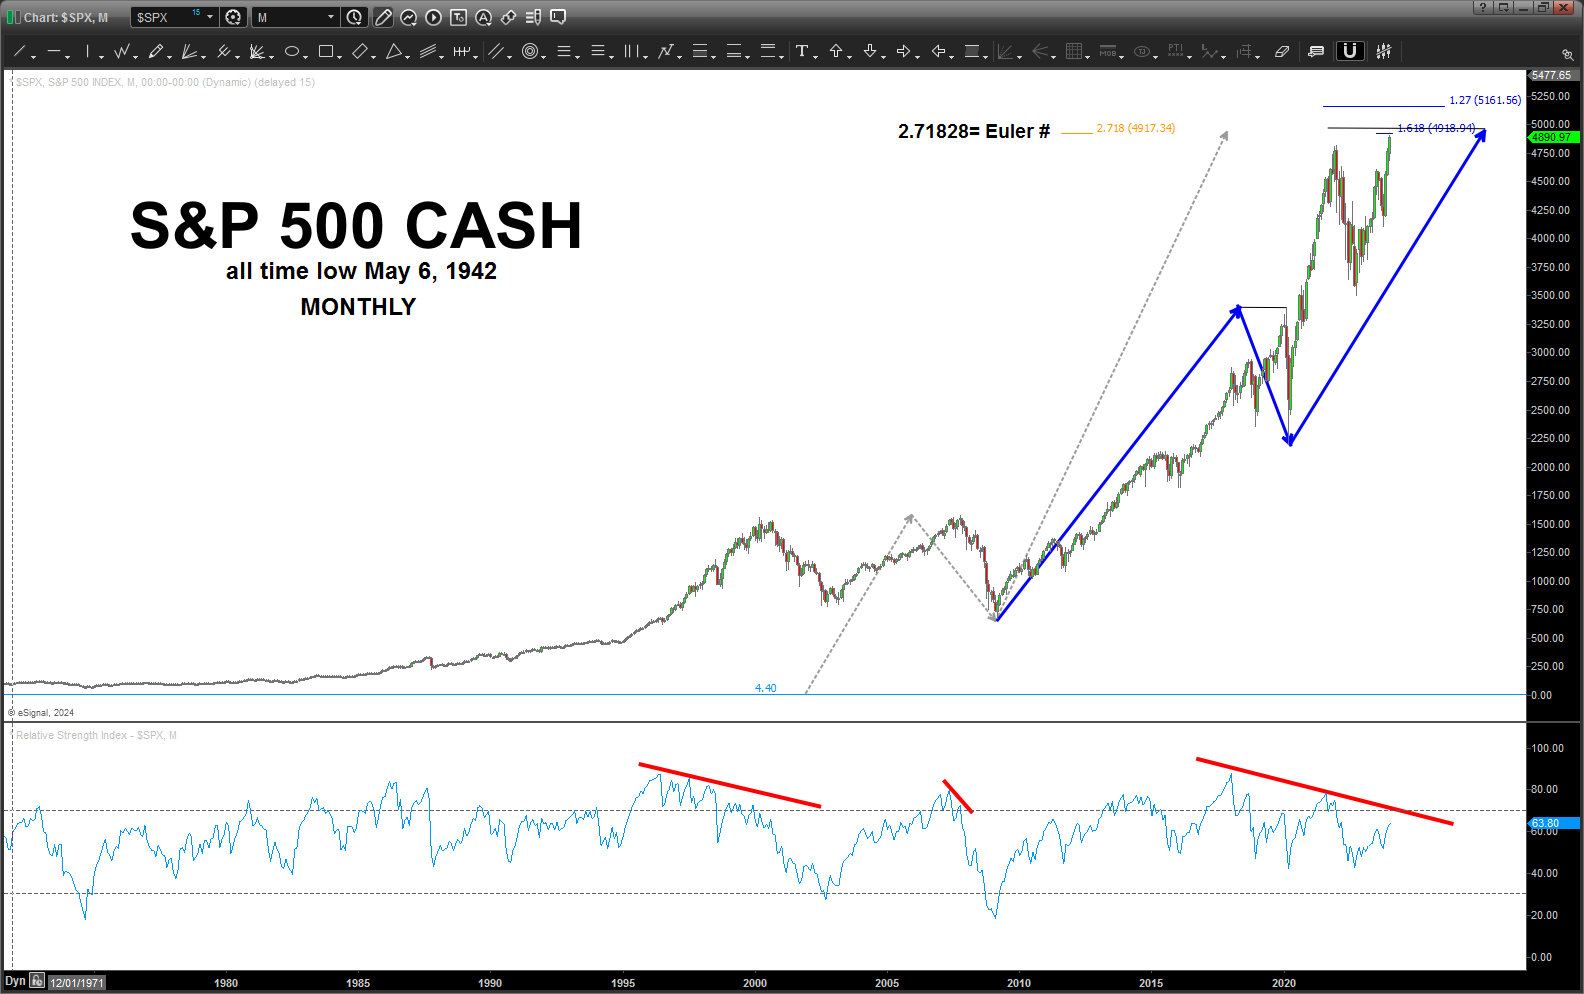
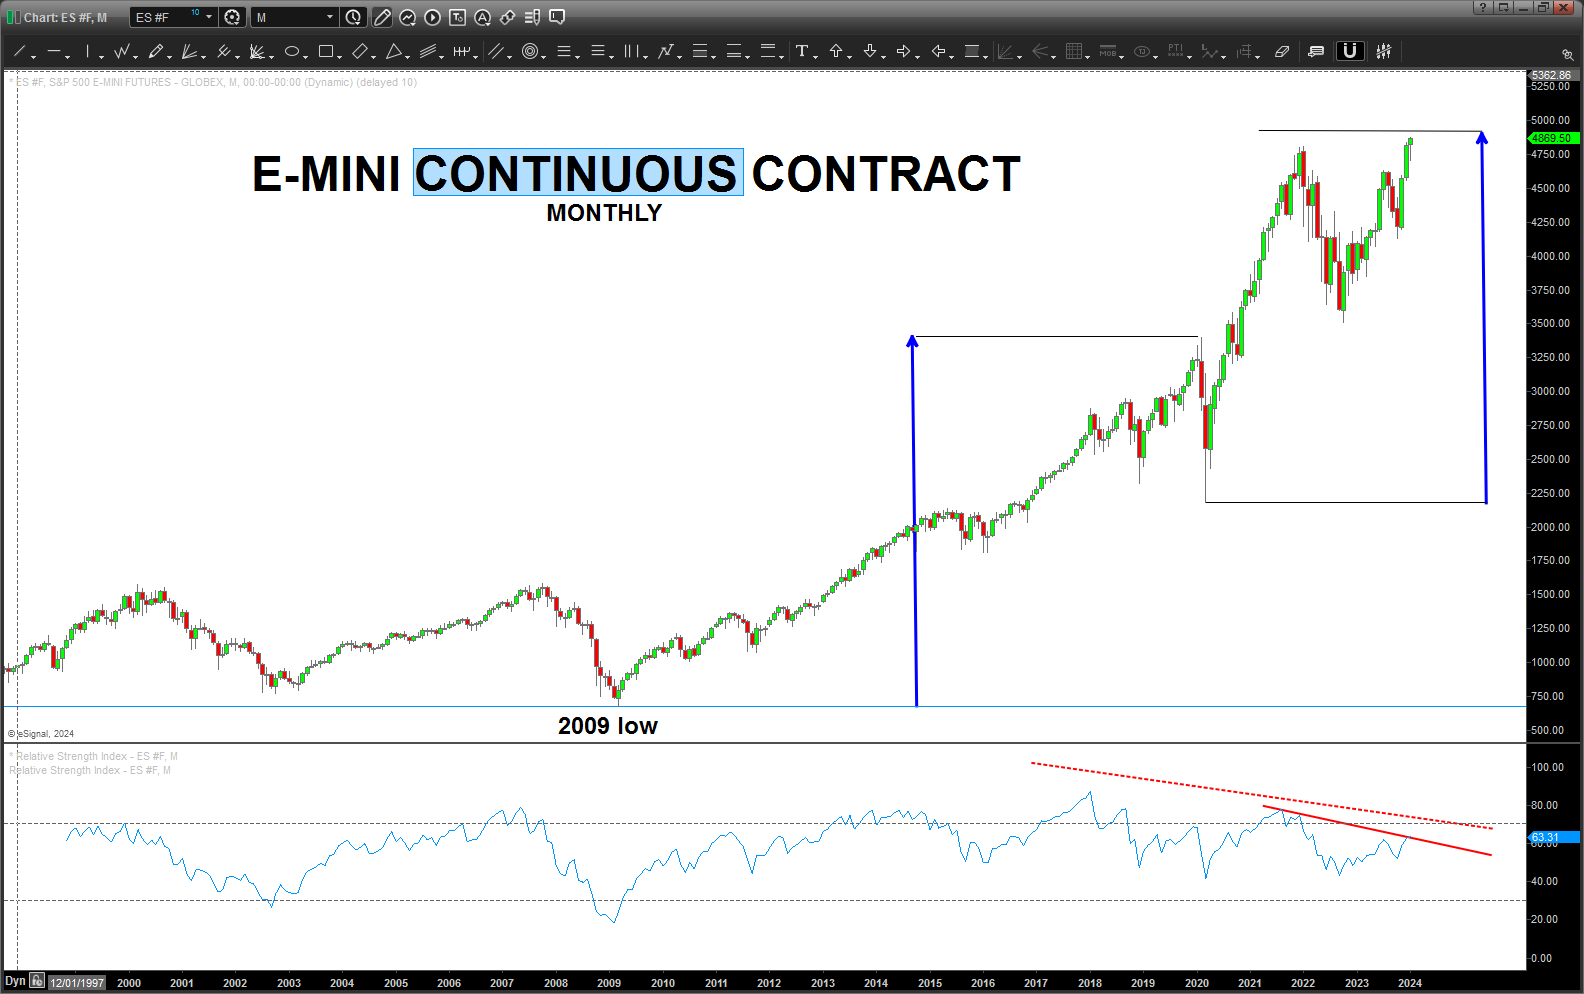
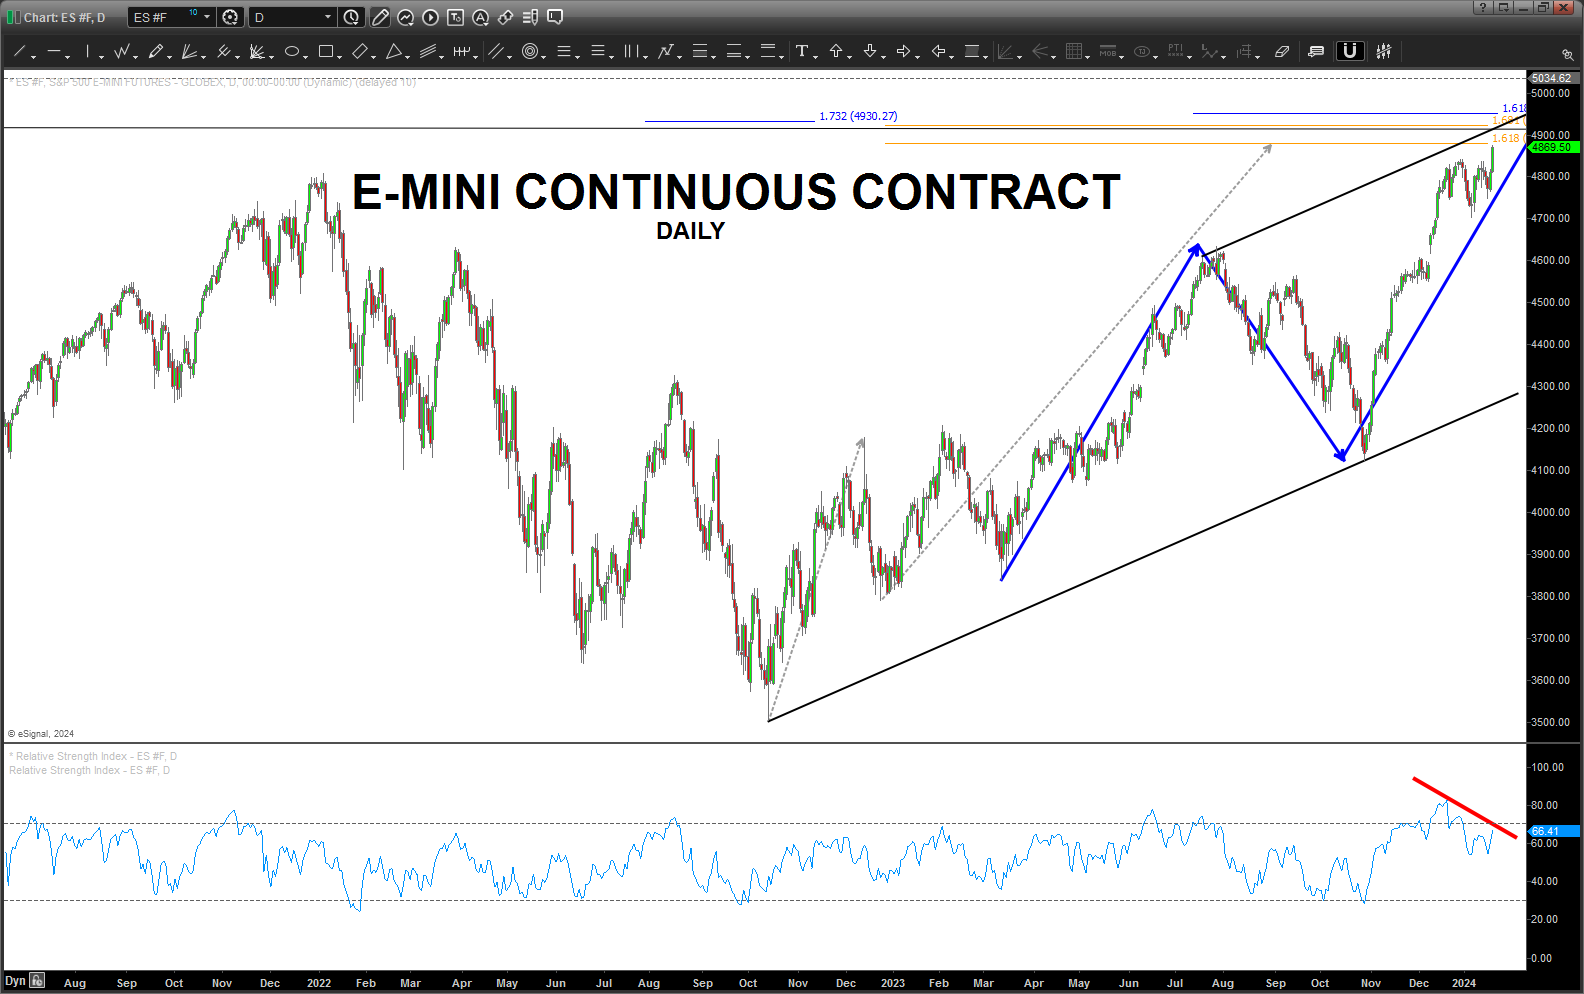
On the daily chart, below, we can clearly see 5 waves up completing … guess the questions is as follows:
Is this a BIG 5th wave completing OR is it the first wave of 5 waves?
Nobody really every knows.
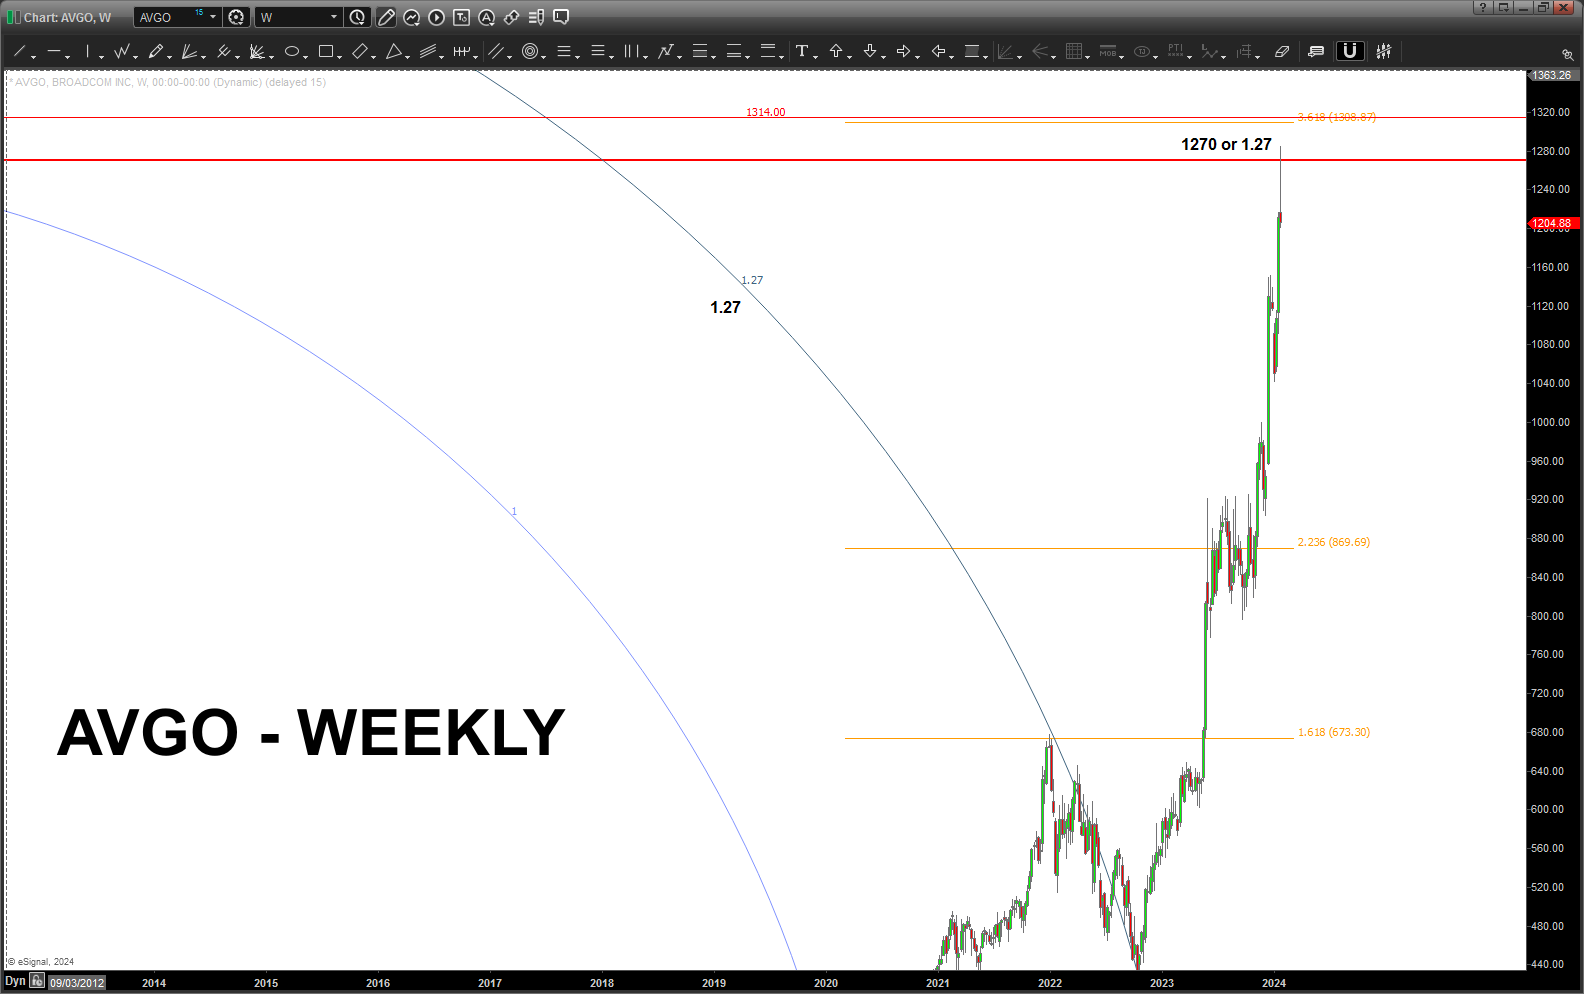
AVGO Broadcom – January 22, 2024
Posted on January 22, 2024 1 Comment
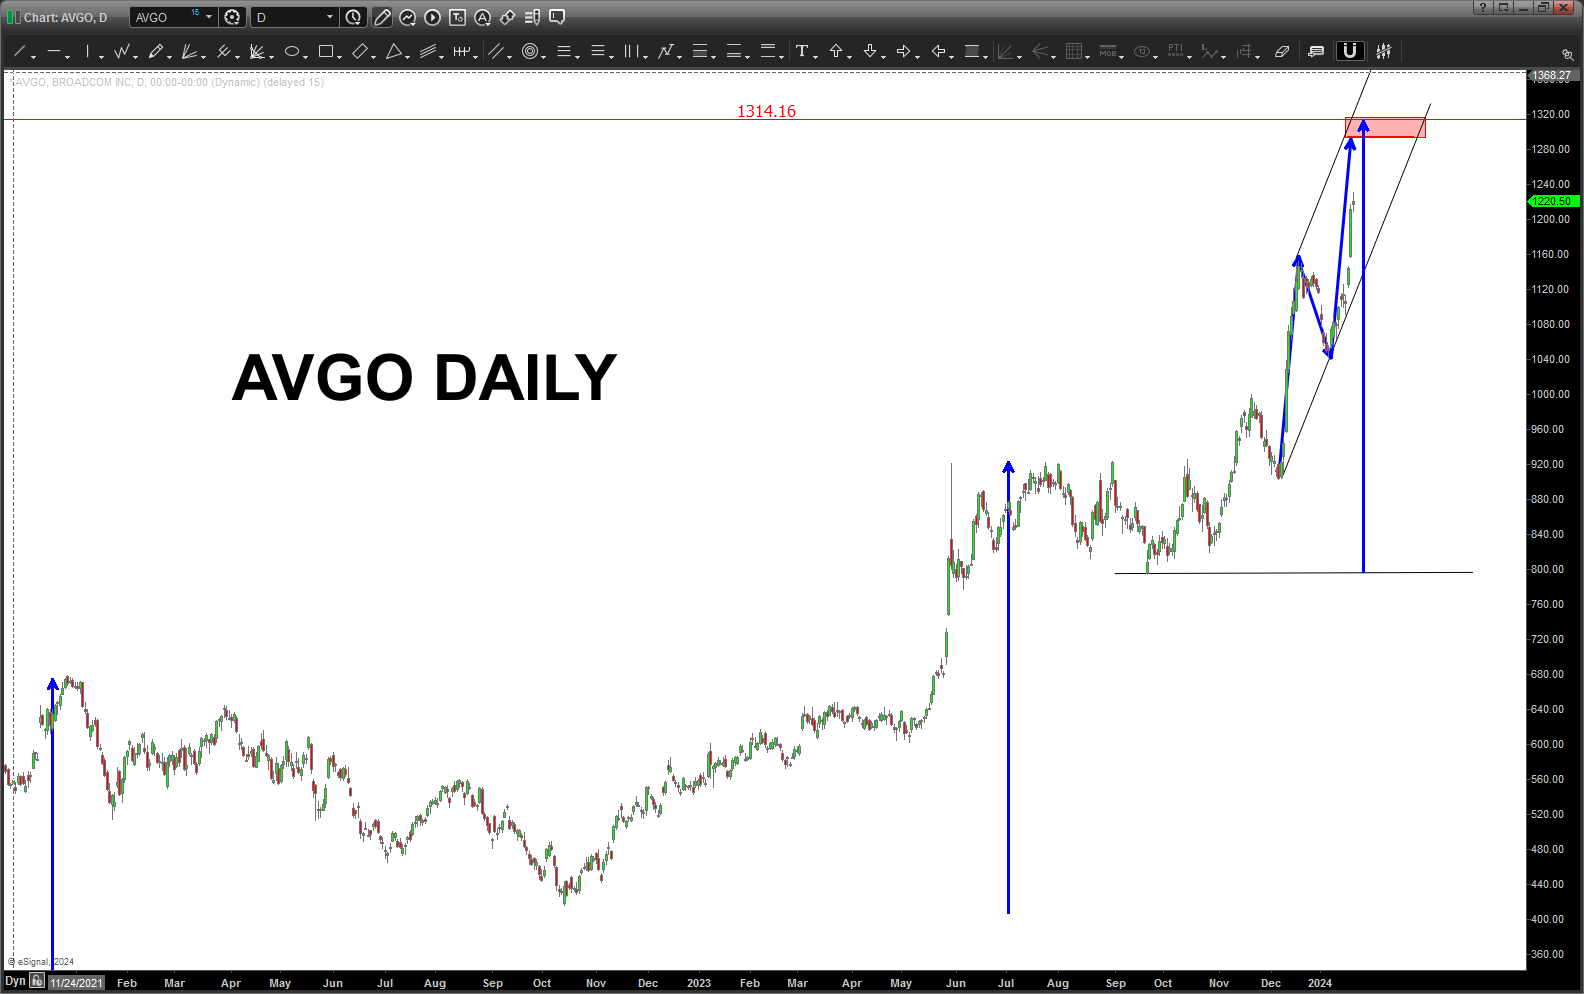
WAIT for weekly signal reversal candles before attempting to short … she’s parabolic and Scotty is “giving her all she’s got Captain …!”
XLK / XLP – January 21, 2024
Posted on January 21, 2024 Leave a Comment
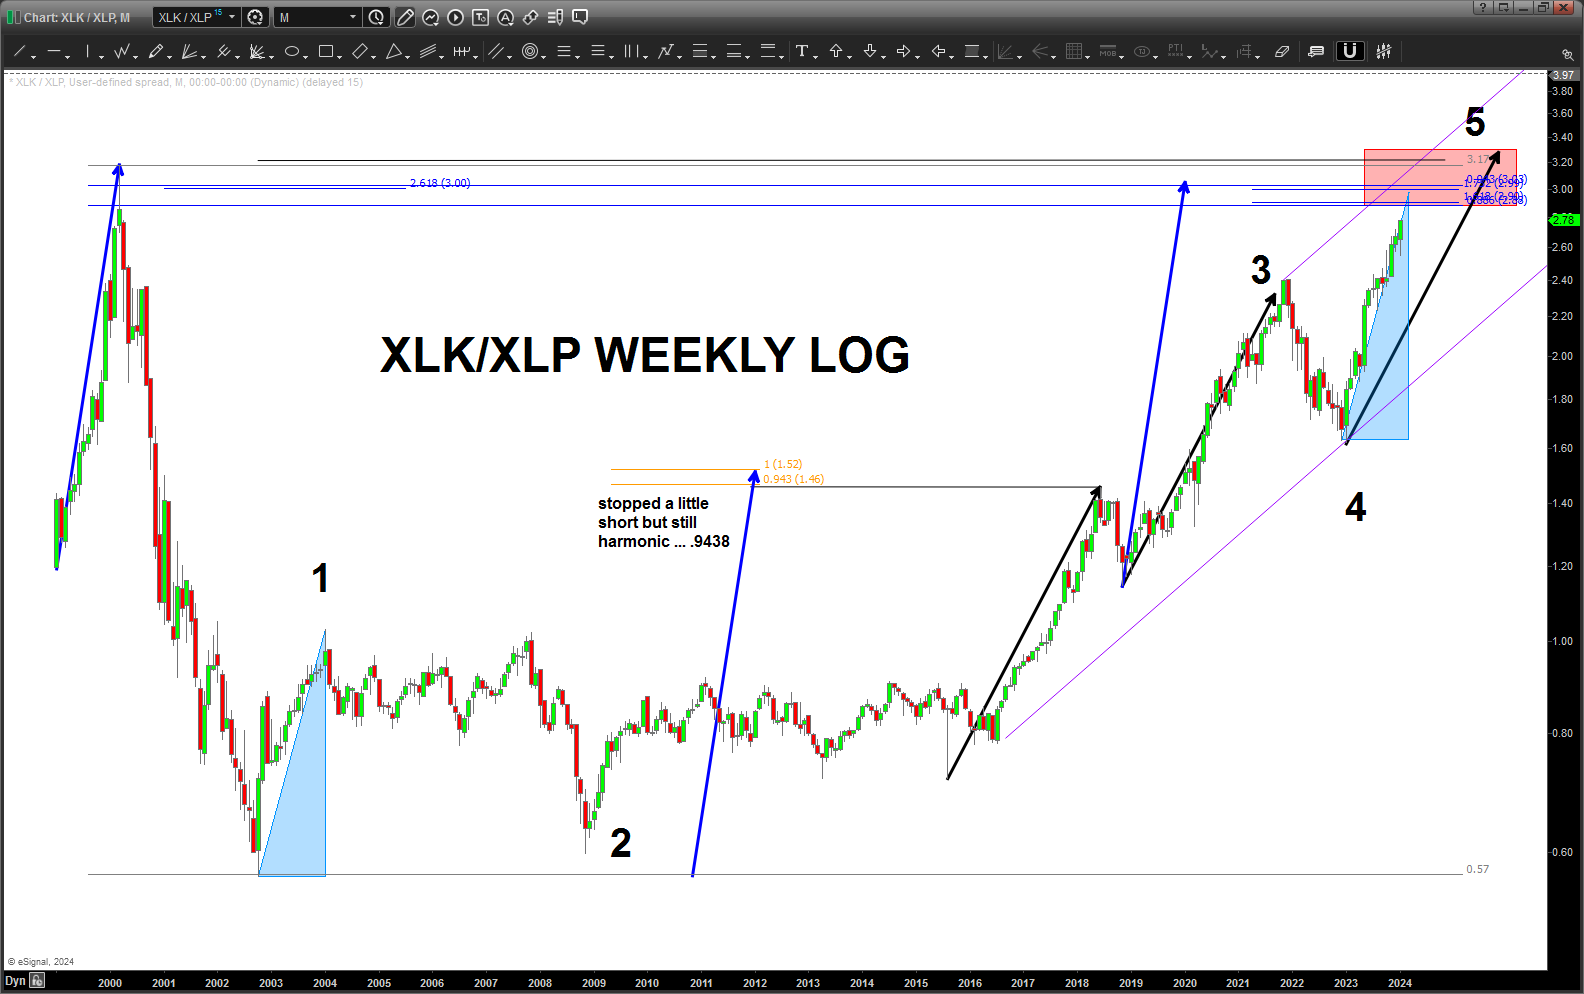
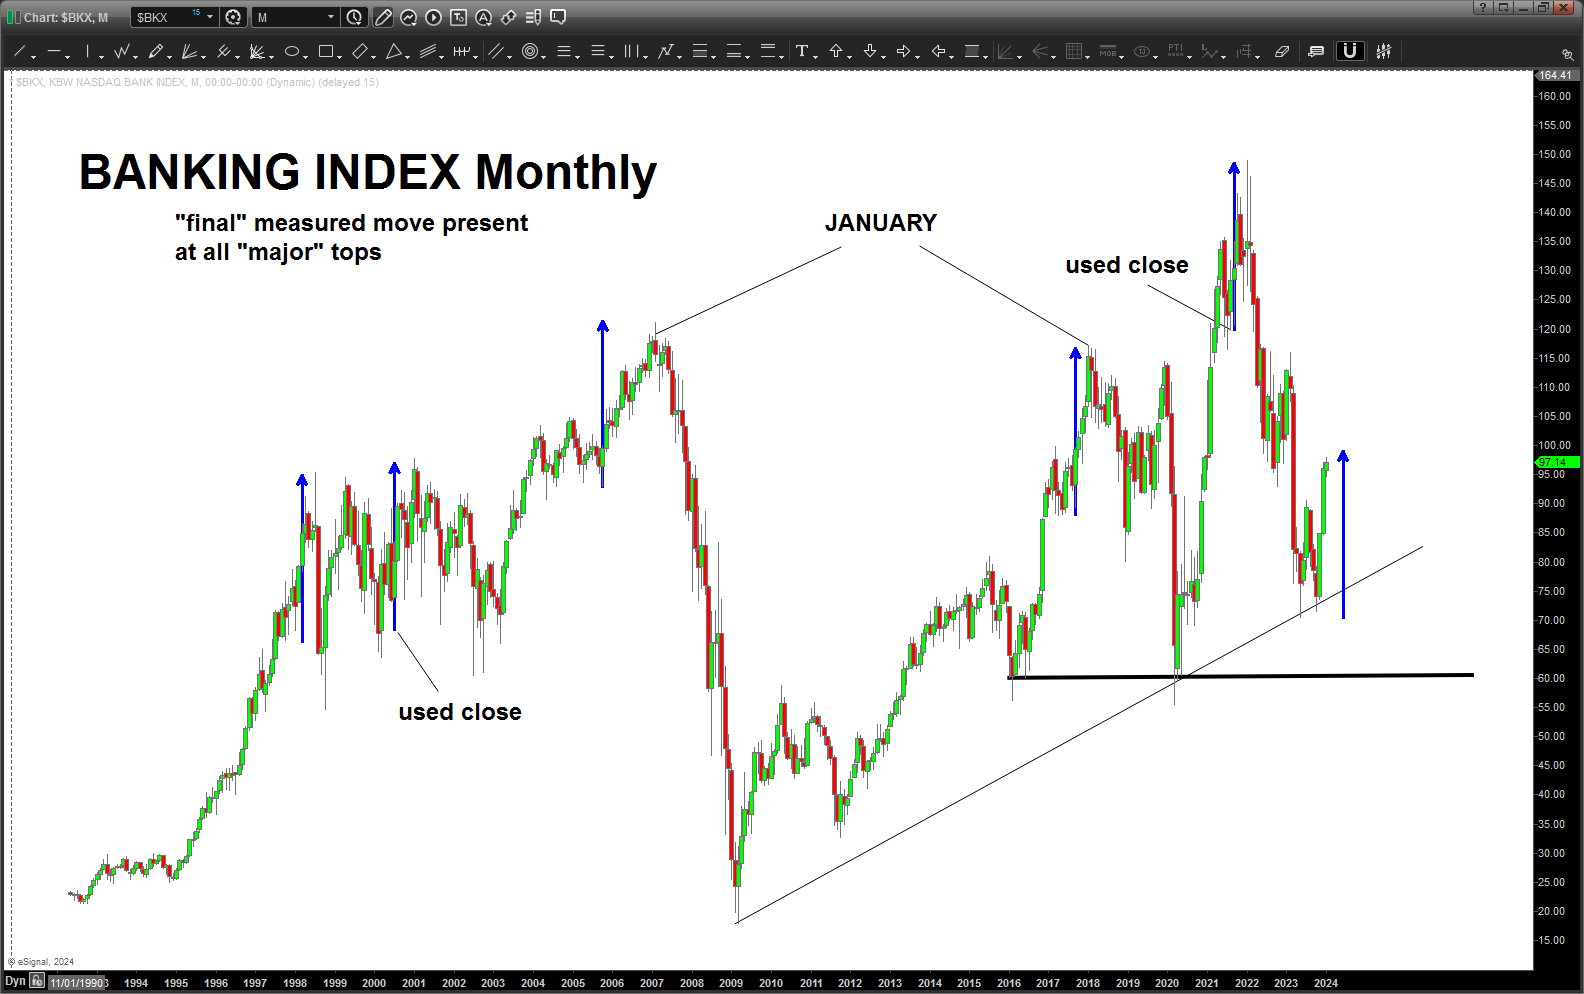
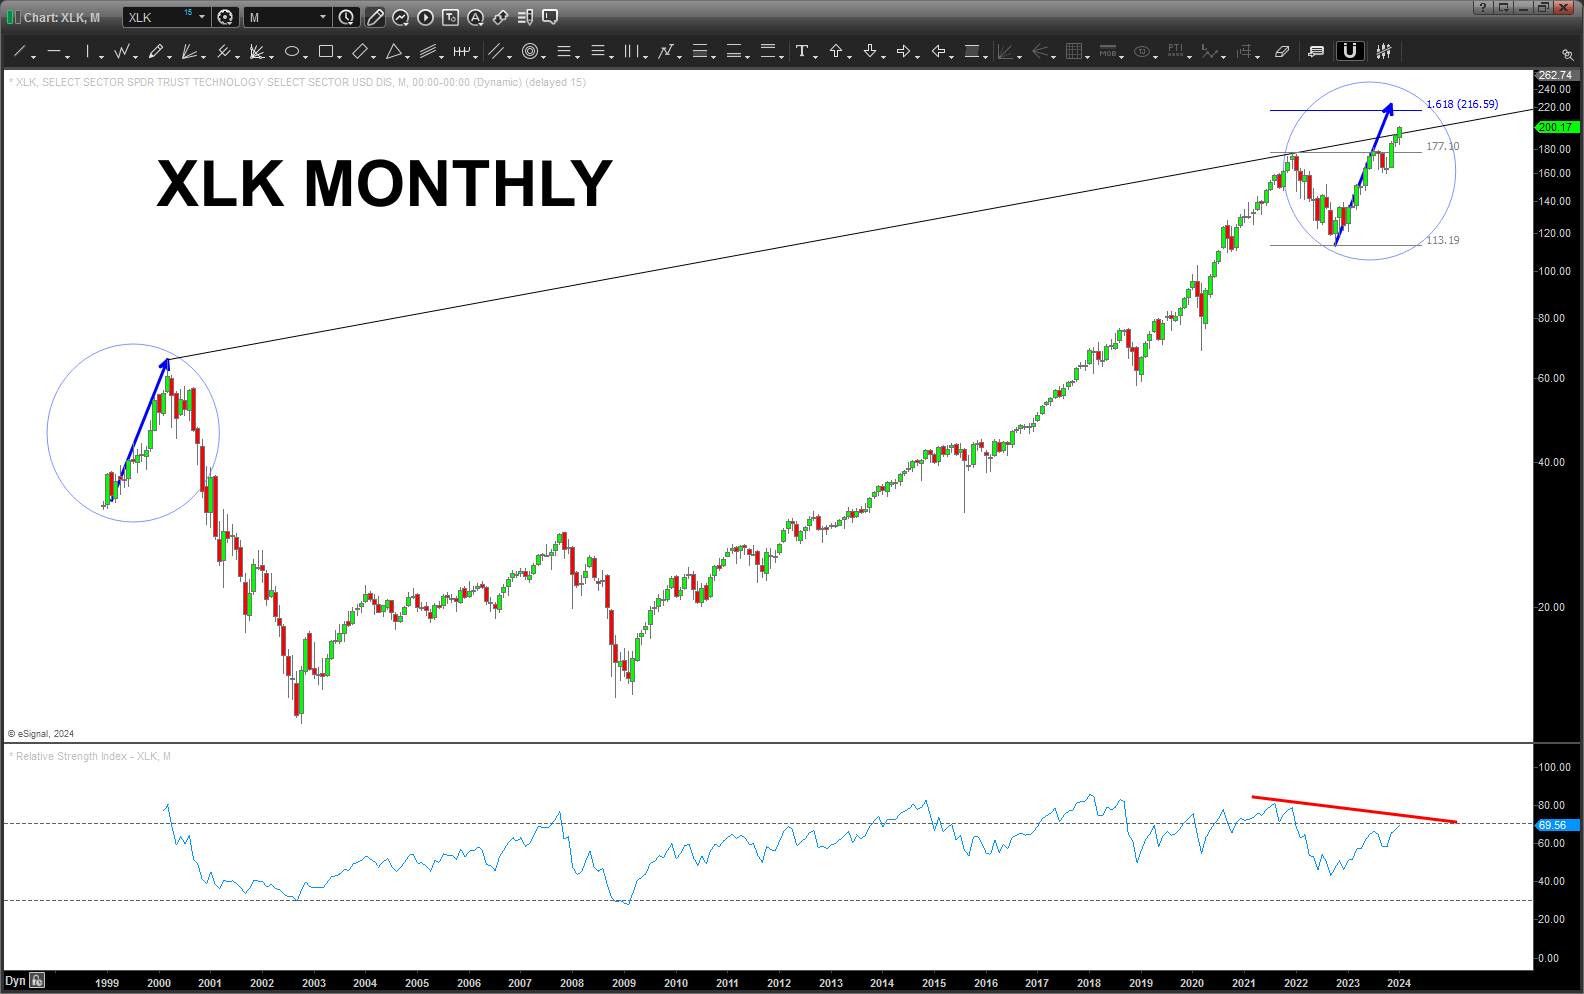
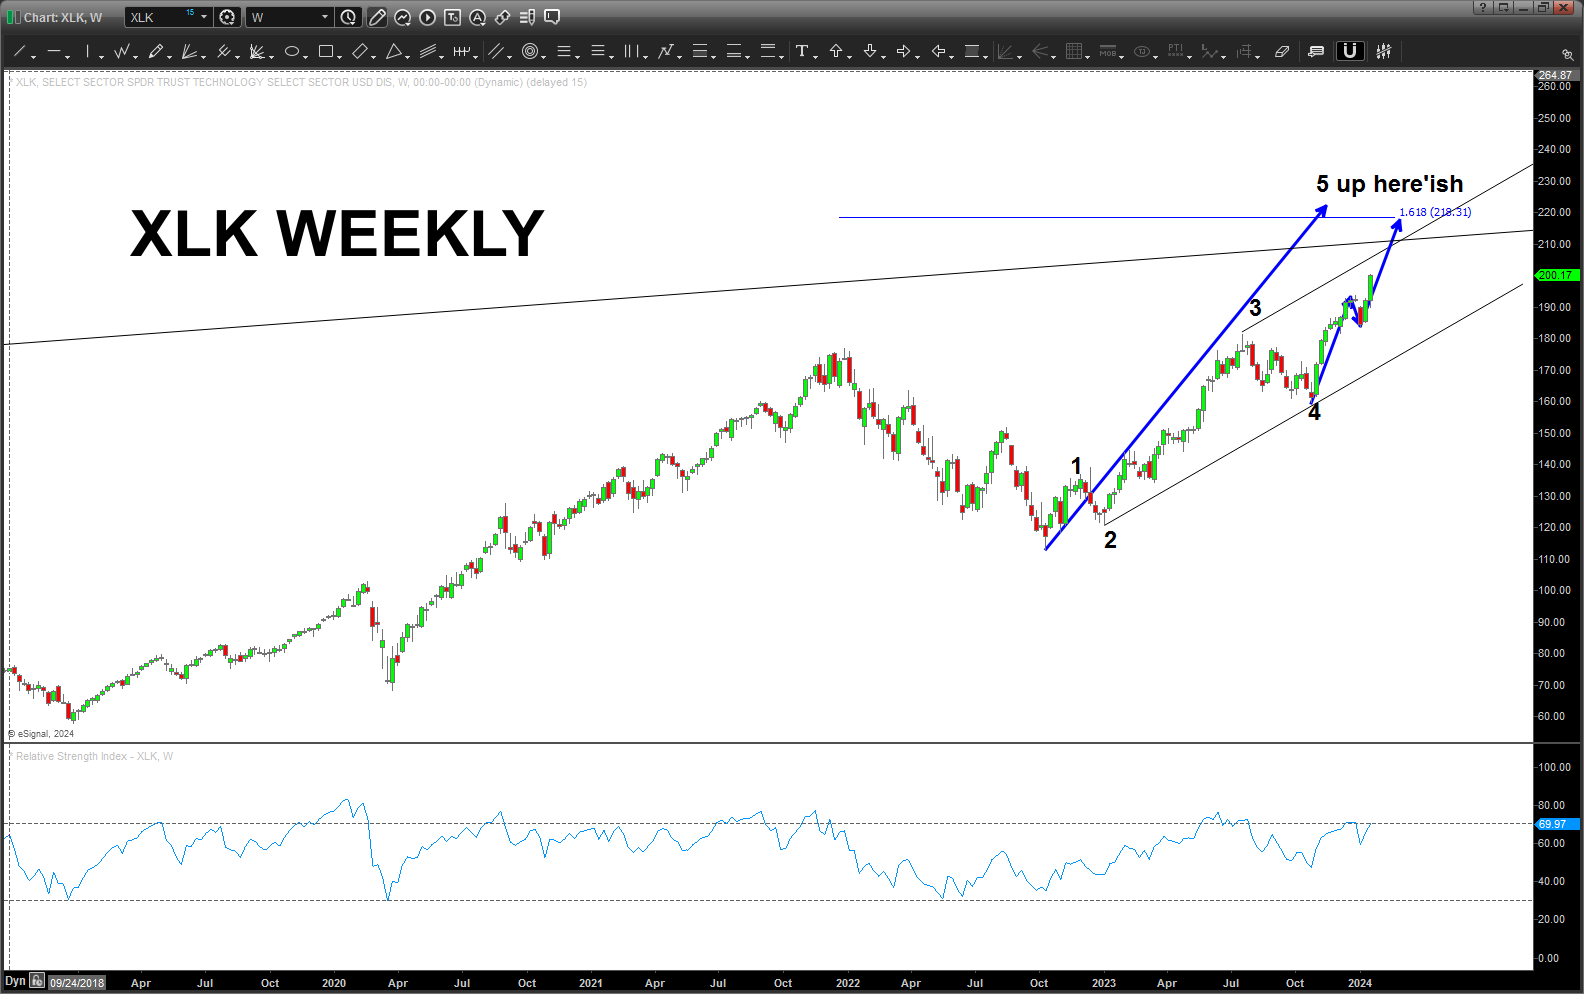
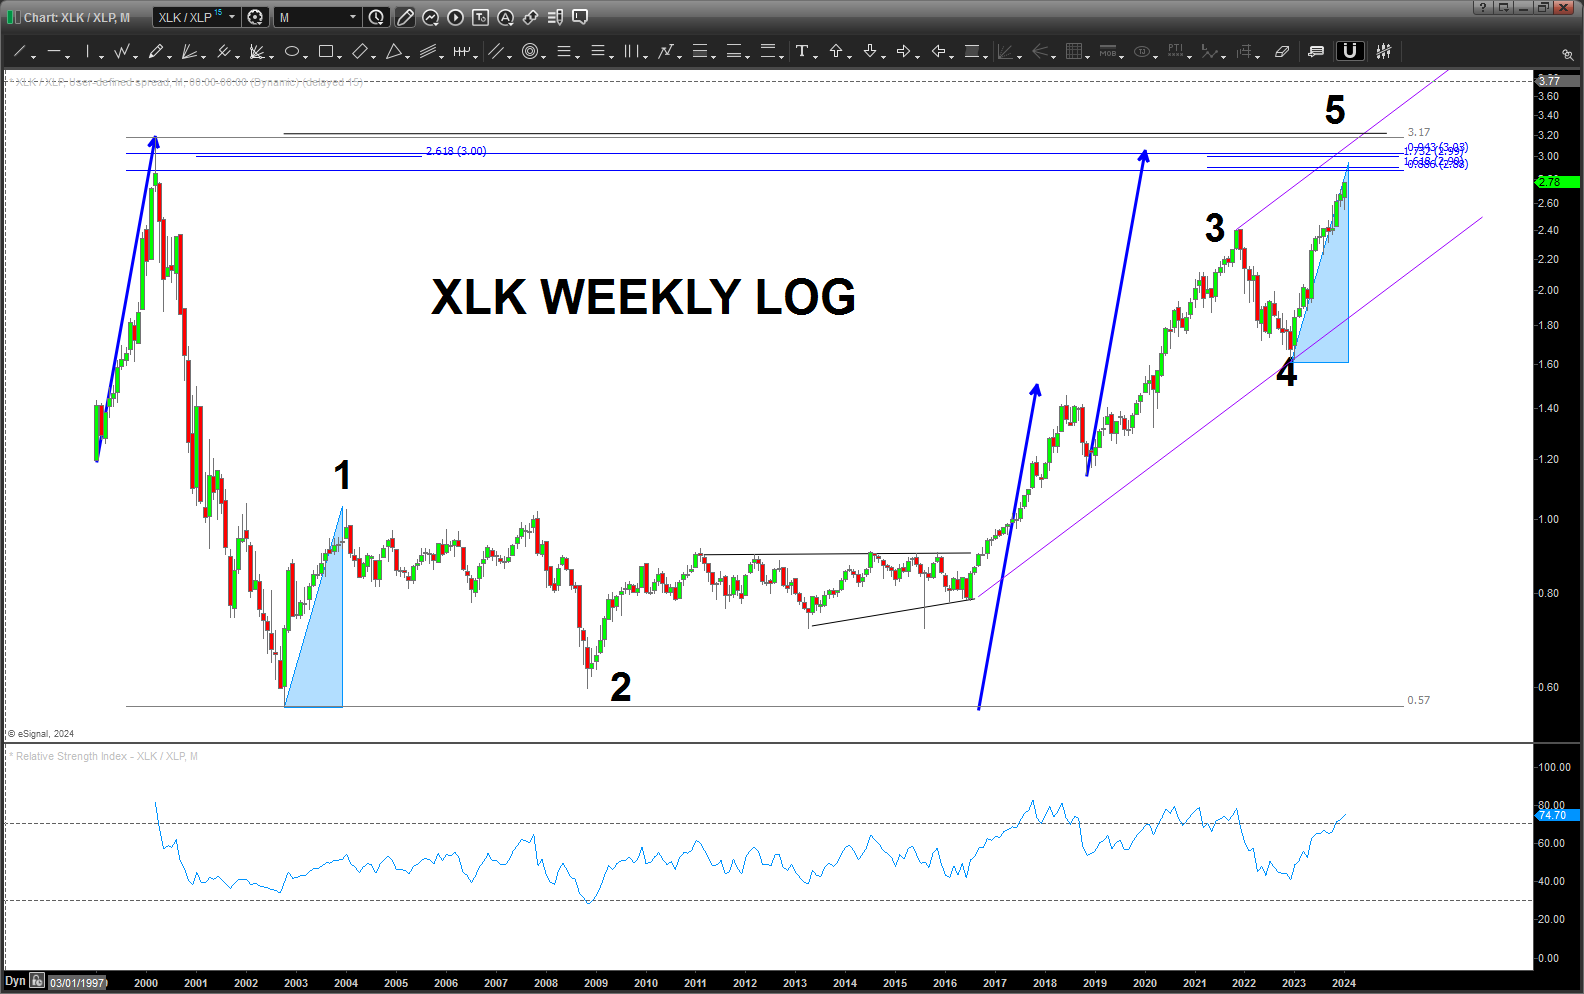
In the chart above, one can see the “blue measured moves” have been important price moves and, from a percentage perspective, EVERY move UP in the ratio has met resistance after the “blue measured move” has completed.
Remember, this is LOG scale so 1/ the measured moves are percentage moves and 2/ the corrections might not appear that large on a log scale (percentage) basis, but they are significant.
For example, the “blue measured move” from the all time low caused a 21% correction in the ratio once it completed … so, these blue measured moves completing are something we should put on our radar.
One of the main reasons we are paying attention to the “blue measured move” is because that was the move UP into the all time high and it works very nicely w/ the flow/harmony of this ratio analysis chart.
You will not see this equality unless you 1/ go to long term charts and 2/ take a peak at LOG scale on the larger time frame charts.
This ratio (XLK/XLP) can be used as a barometer for “risk on” and “risk off.” The thesis being IF risk is on THEN the high flying NASDAQ 100 zooms higher (as in now) and IF risk is off THEN institutions/large retail roll into “staples” for the conservative tub of toothpaste, toilet paper, etc. AKA – the staples.
Right now we have STRONG VOLUMINOUS candles so risk is on … I’ve captured some very important levels a little higher that could stop this puppy in it’s tracks.
Additionally, the EWT count I have doesn’t break any rules so 1,23,4,5 and then we roll over? No pride in authorship of my “EWT count” as that is what stuck out to me. I can see “other” bullish alternative counts BUT on all of them this is a 5th wave so a correction in the ratio, which in turn has put pressure on the NDX 100 in the past, should work again as resistance for the NDX..
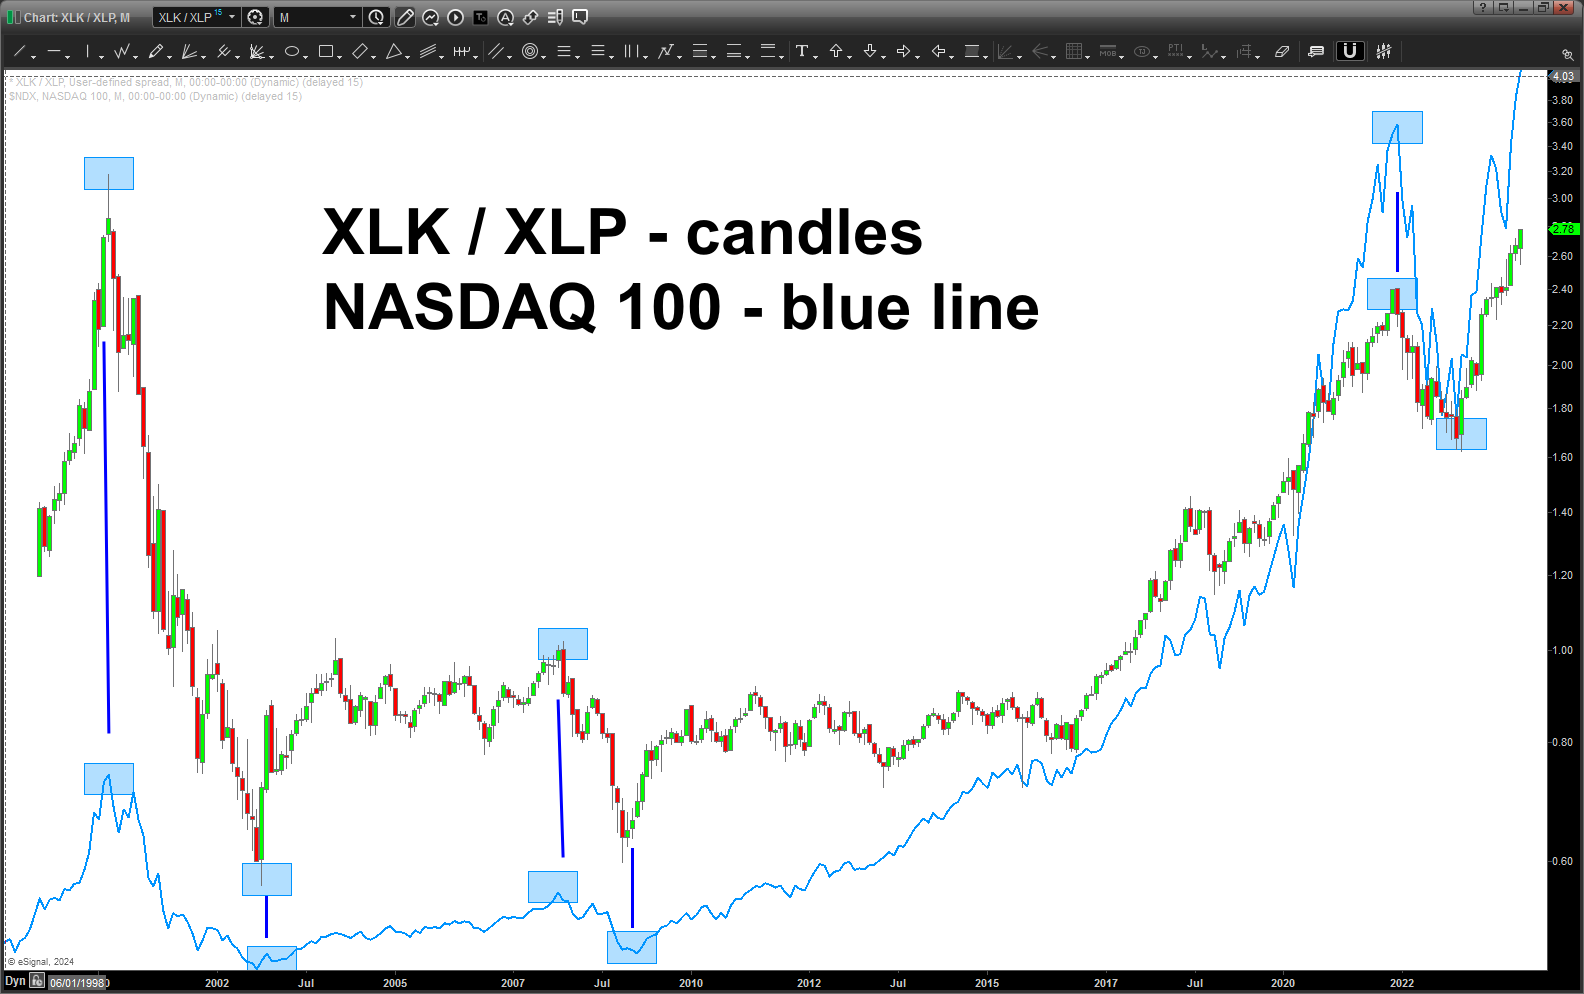
One last, take note of the above chart. These “sentiment” ratio analysis tools are excellent timing tools for the overall healthiness of the market. The PATTERNS work on them because the instruments being compared (ETF’s XLK and XLP) are, themselves, liquid.
In the environment we are in right now, I am going to WAIT for a signal reversal candle on a weekly basis to short this market. Parabolic arcs are appearing everywhere … over the past weekend I’ve come up w/ some pretty powerful levels based on a host of geometry, music, etc. and some of, after 10K’s of hours on the charts, the more “esoteric” (yet most profound implications for life on this planet) methods to simply manage risk.
DO NOT BE SURPRISED IF THESE LEVELS GET SMOKED AND THE TRAIN KEEPS ROLLING …IT’S JUST PROBABILITY FOLKS.
For those of you who have been following me for a while, when I start posting like crazy, it’s usually meant something is coming. Could be monstrous bullish …! WHO KNOWS.
The point being … when PATTERNS appear on the weekly/monthly across the board it’s a signal that “cycles are converging” because, ultimately, that is what the patterns are …they are a confluence of PRICE and TIME that will cause an inflection in the market. The LARGER TIME FRAME the PATTERN the LONGER THE TIME CYCLE HENCE THEIR IMPORTANCE …
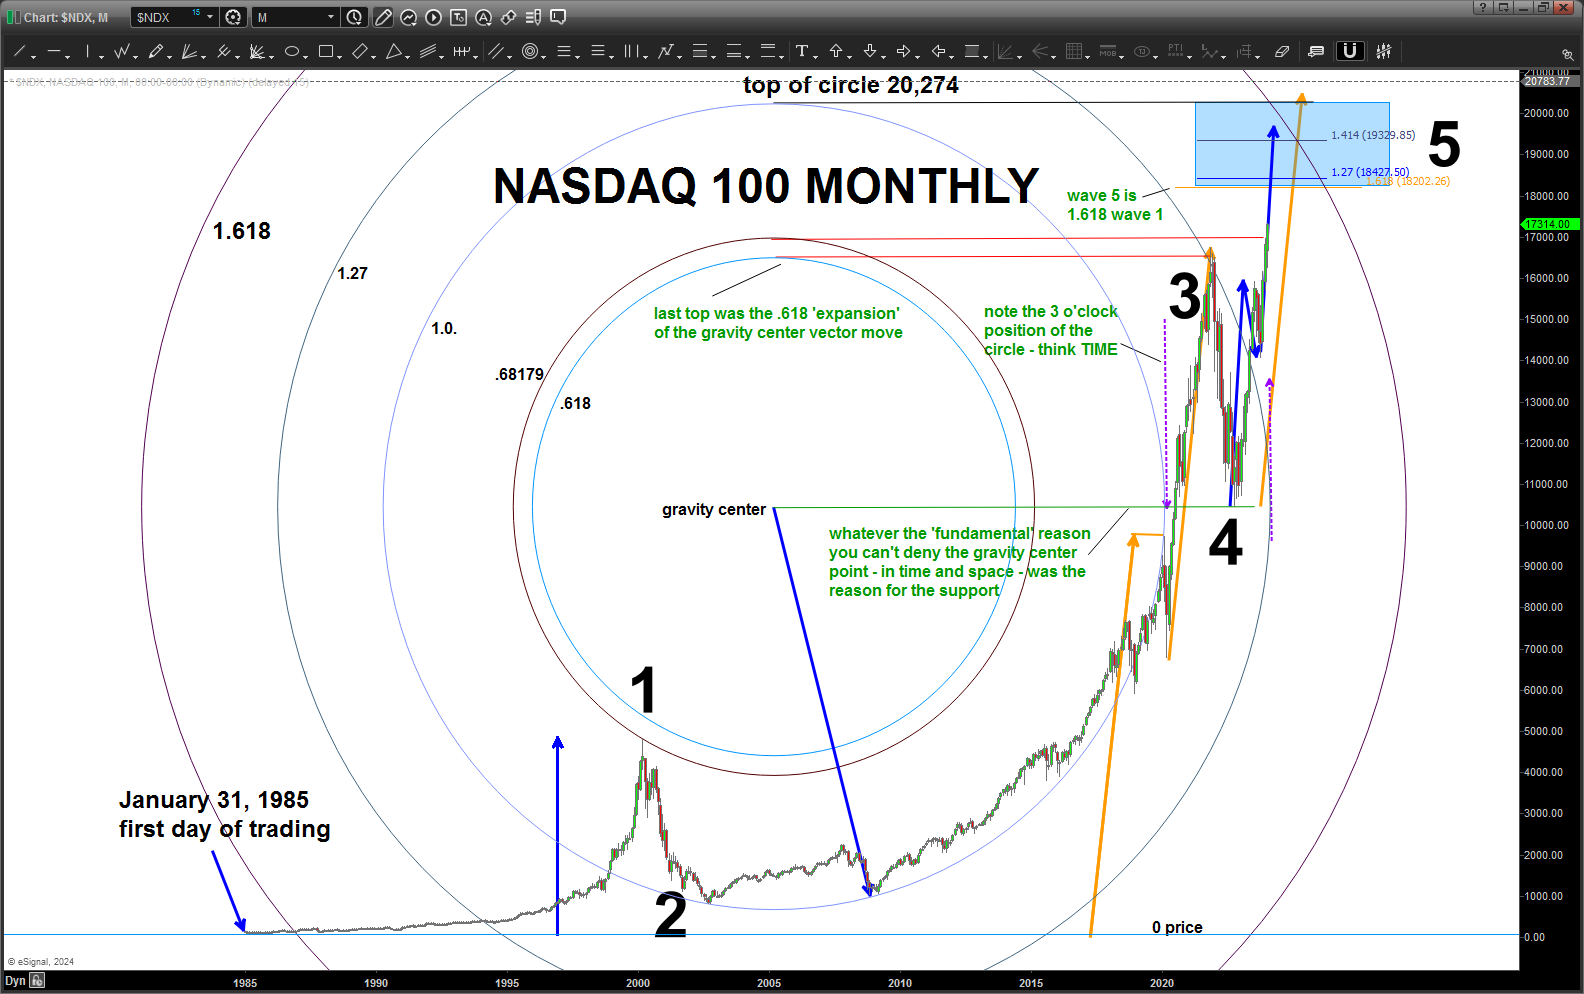
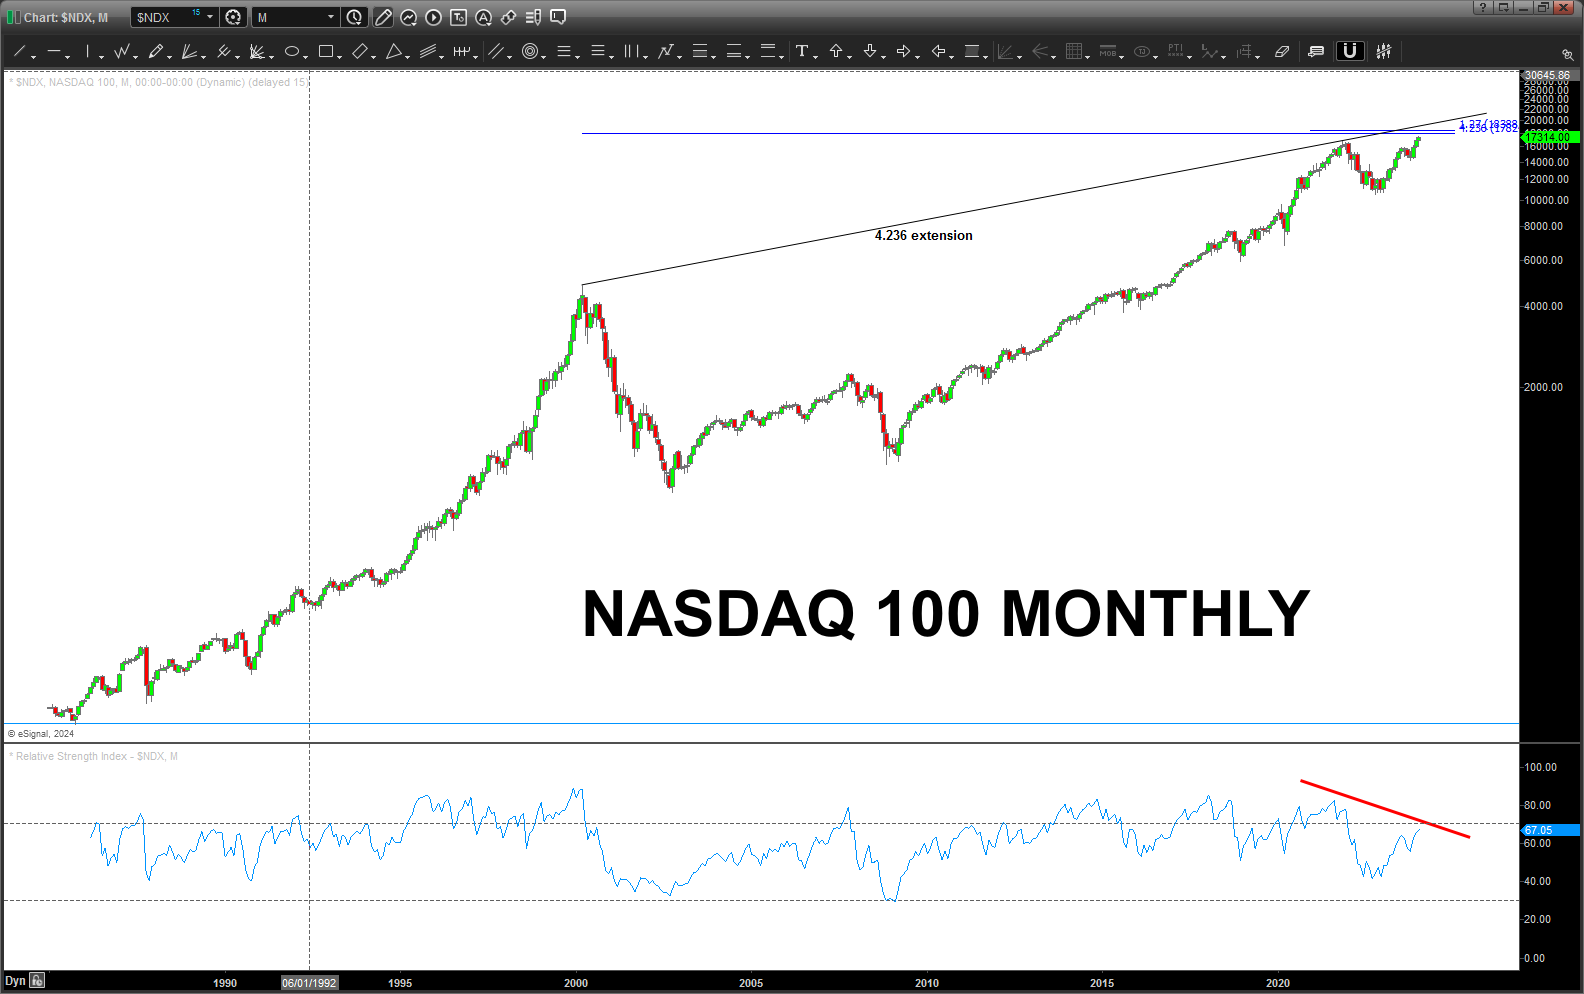
NASDAQ 100 – January 21, 2024
Posted on January 21, 2024 Leave a Comment
I’m still looking/watching for the Bank Sell Patterns to FAIL to get on board for the breakout to new highs. I’m suspect at this point … the JNK bonds haven’t broken thru the ABCD, either. The Russell is a dog …
Who knows, something just doesn’t feel right about this move …
Lithium (LIT) – January 18 ,2024
Posted on January 18, 2024 8 Comments
Last post on LIT: https://atomic-temporary-44460632.wpcomstaging.com/2023/09/16/lithium-lit-etf-sept-16-2023/
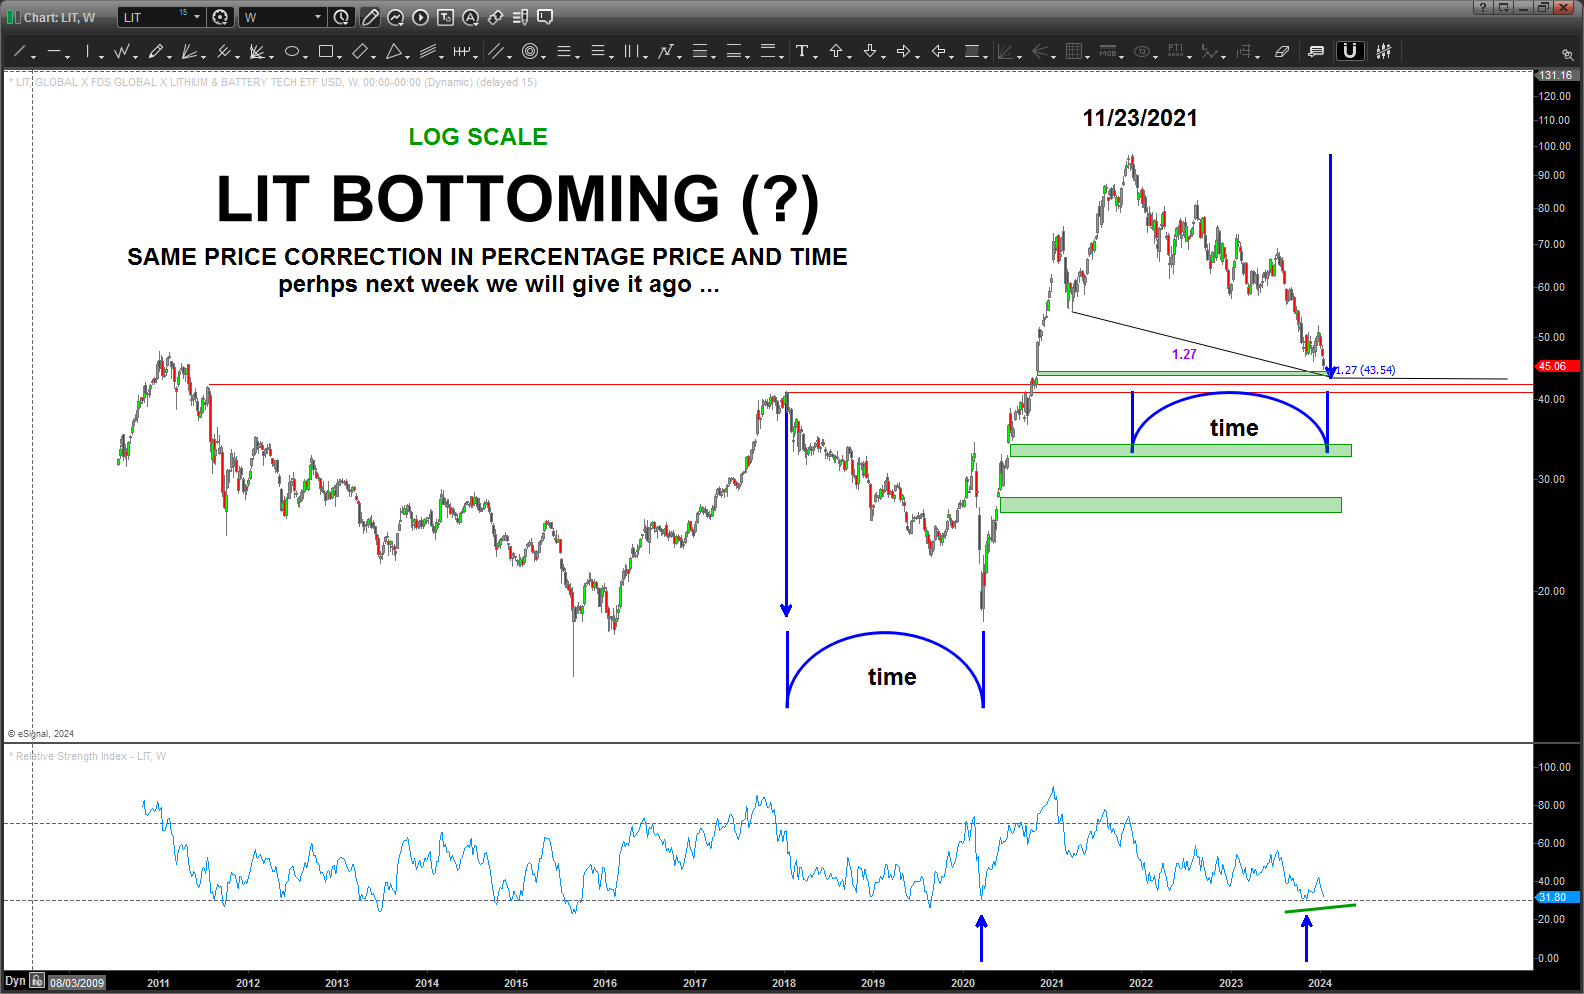
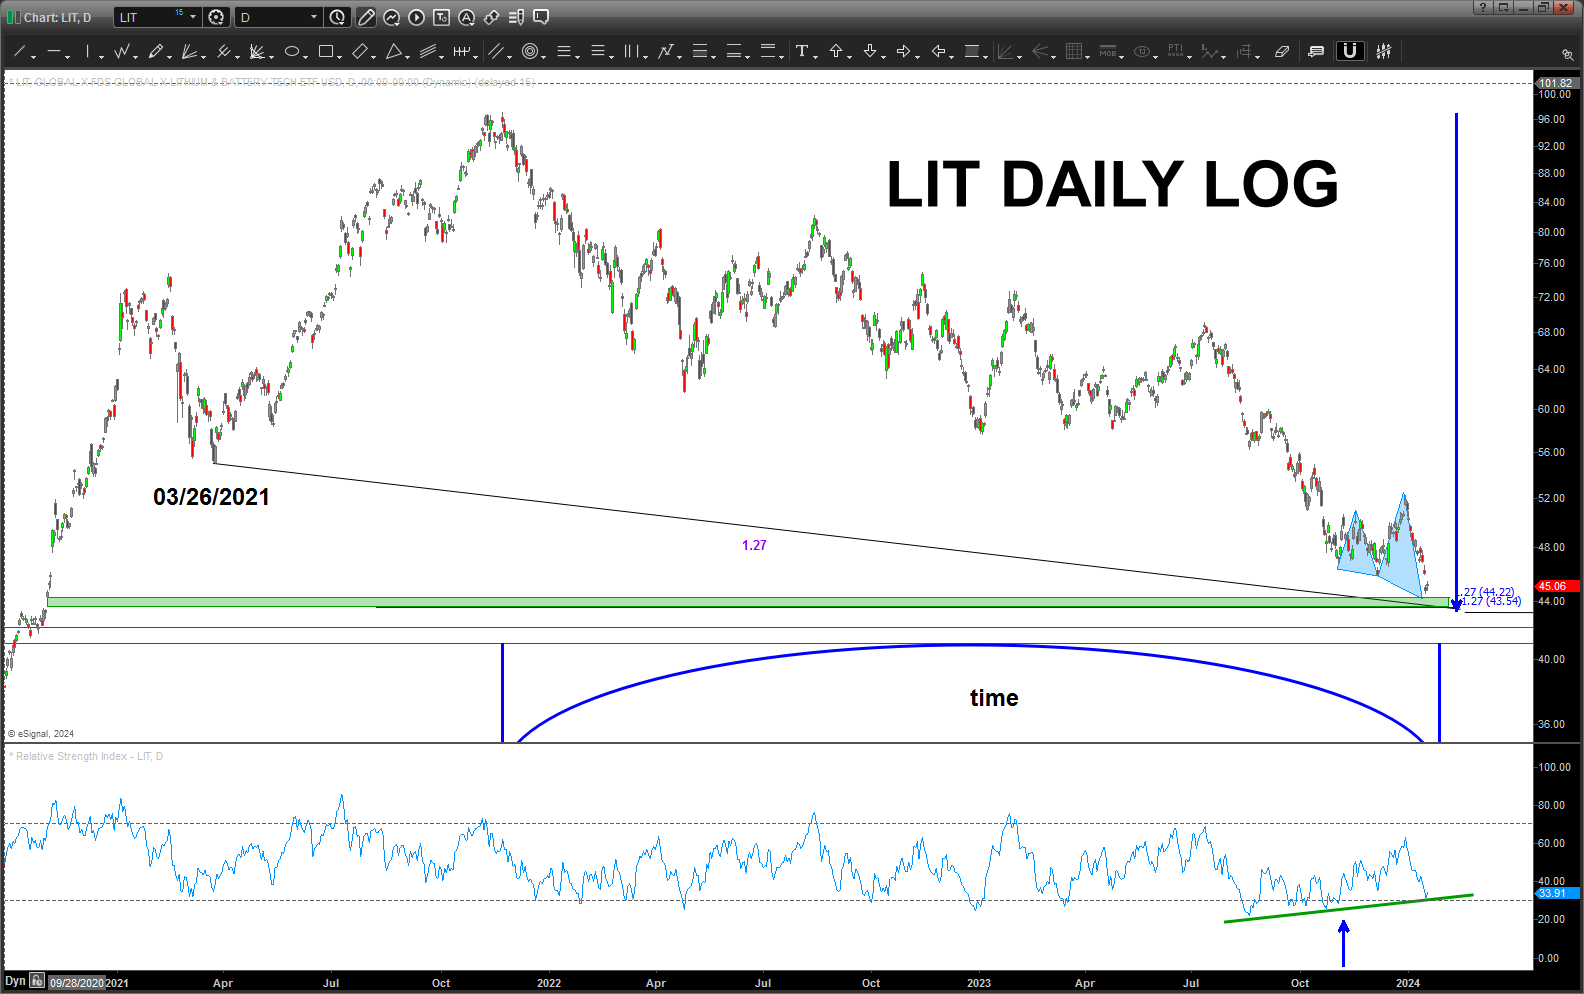
Well, look at that, sure looks like we need to get ready to deploy some capital and buy LIT …. it’s been getting hammered pretty good, so wait for a SRC on the weekly. Conservatives (me) can go for a close above 52 and then look to hold into the high 90’s and perhaps above 100. Not a bad risk – reward.
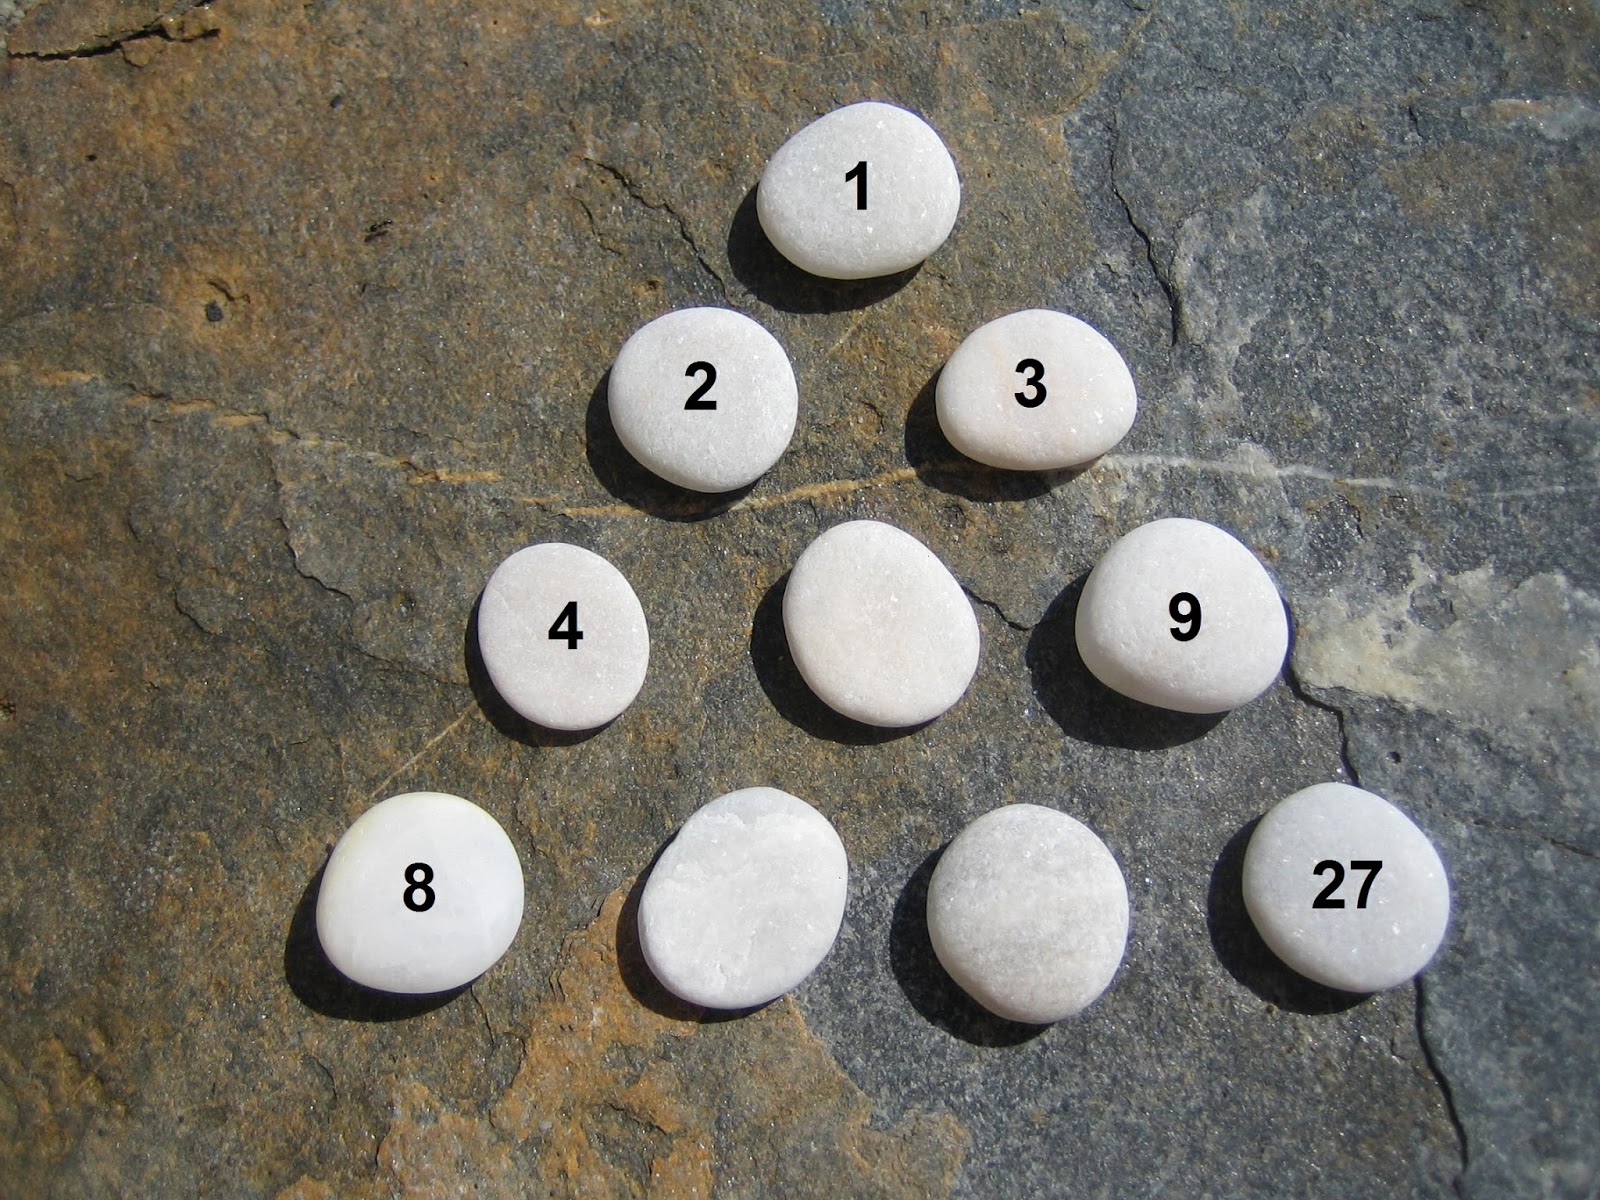
Had to post this here. This simple arrangement of rocks pictured below, based on Plato’s World Soul displayed as Lambda by Nicomachus, explained to me in the book “The Plato and the Quran” is just mind blowing important in the reality we live in … and sometimes these PATTERNS and the numbers are “easier” to see when I just kick back and relax and read.
Taking a look at LIT, I just “saw it.” All the following mumbo jumbo means nothing because PRICE is king and we stop out below 40 either way. Discipline Bart, Discipline.
I’ve been a road warrior that past couple weeks and I have spent pretty much every moment, when sitting in my window seat (broad shouldered), playing very spiritual music, along with Brain Tapping(sometimes twice a day) and also journaling– READING. I believe it opens you up to “see” stuff.
I’ll just leave it at …
How many books are there in the bible?
I used to think this all the time, the more you are around numbers as I am :), you realize NOTHING is random and especially the ancient texts that define our humanity. Finished the “Epic of Humanity” on this trip also, and, let me tell you, when read together in such a short time — WOWZA.
To get back to the question:
There are 39 in the old testament and 27 in the new testament.
Those numbers IMMEDIATELY pop out at ya down the right side of the rock formation.
“Even the very hairs on your head are numbered. ” Hmmmm …
An example:
1.618, the Golden Mean, arguably one of the most important numbers in the universe, is incredibly important. And, if you look at the chart below, you will see the purple 1.27. That’s the square root of 1.618.
So …we use square roots and the inverse of those square roots and we are going to deploy capital on that “number” (vibrational intersection based on numbers) so anything “harmonic” w/ that is also IMPORTANT.
Take this number (3927) and MAKE THE OUTWARD NUMBER (7) THE INWARD 37 and the INWARD NUMBER OUTWARD (29).
We now have 3729 which signifies to GO INWARD and MAKE YOUR INWARD THE OUWARD MANIFESTIONS OF YOUR REALITY.
“As above, so below” ….merge the two numbers (divide the into each other), which represents the marriage of the divine feminine and divine masculine, the polarity balances of forces in this 3rd dimensional plane or yin/yang and we get:
37/29 = 1.27
It’s TIME folks, it’s really really really time to GO INWARD!
And, anyone wonder why the 27 is on ONE Rock? It’s a representation that we are ALL ONE the POLARITY that represents this 3 dimensional existence is what we experienced during the, amazing, Age of Aquarius. Hence, it’s the ONLY rock to have two numbers. Old Testament and New Testament. WOW.
How about the left …?
1176+248 = wait what? come on now …
2024
To the charts … !!!!!
Note we have BOTH PRICE (PERCENTAGE) and TIME (same time as last major correction) EQUAL a little lower and perhaps next week.
Note the RSI support level and on this last swing we have created weekly bullish divergence … same w/ the daily.
And, a key low node, which created a very clear 5 waves into the high, is a 1.27 extension price target right at the measured move price.
This one is looking might tasty …
Nice “standard” red parallel horizontal (polarity) support lines that provide a nice level to manage risk and BAIL if we get a close below this level, on a weekly basis, make this a pretty nice opportunity .
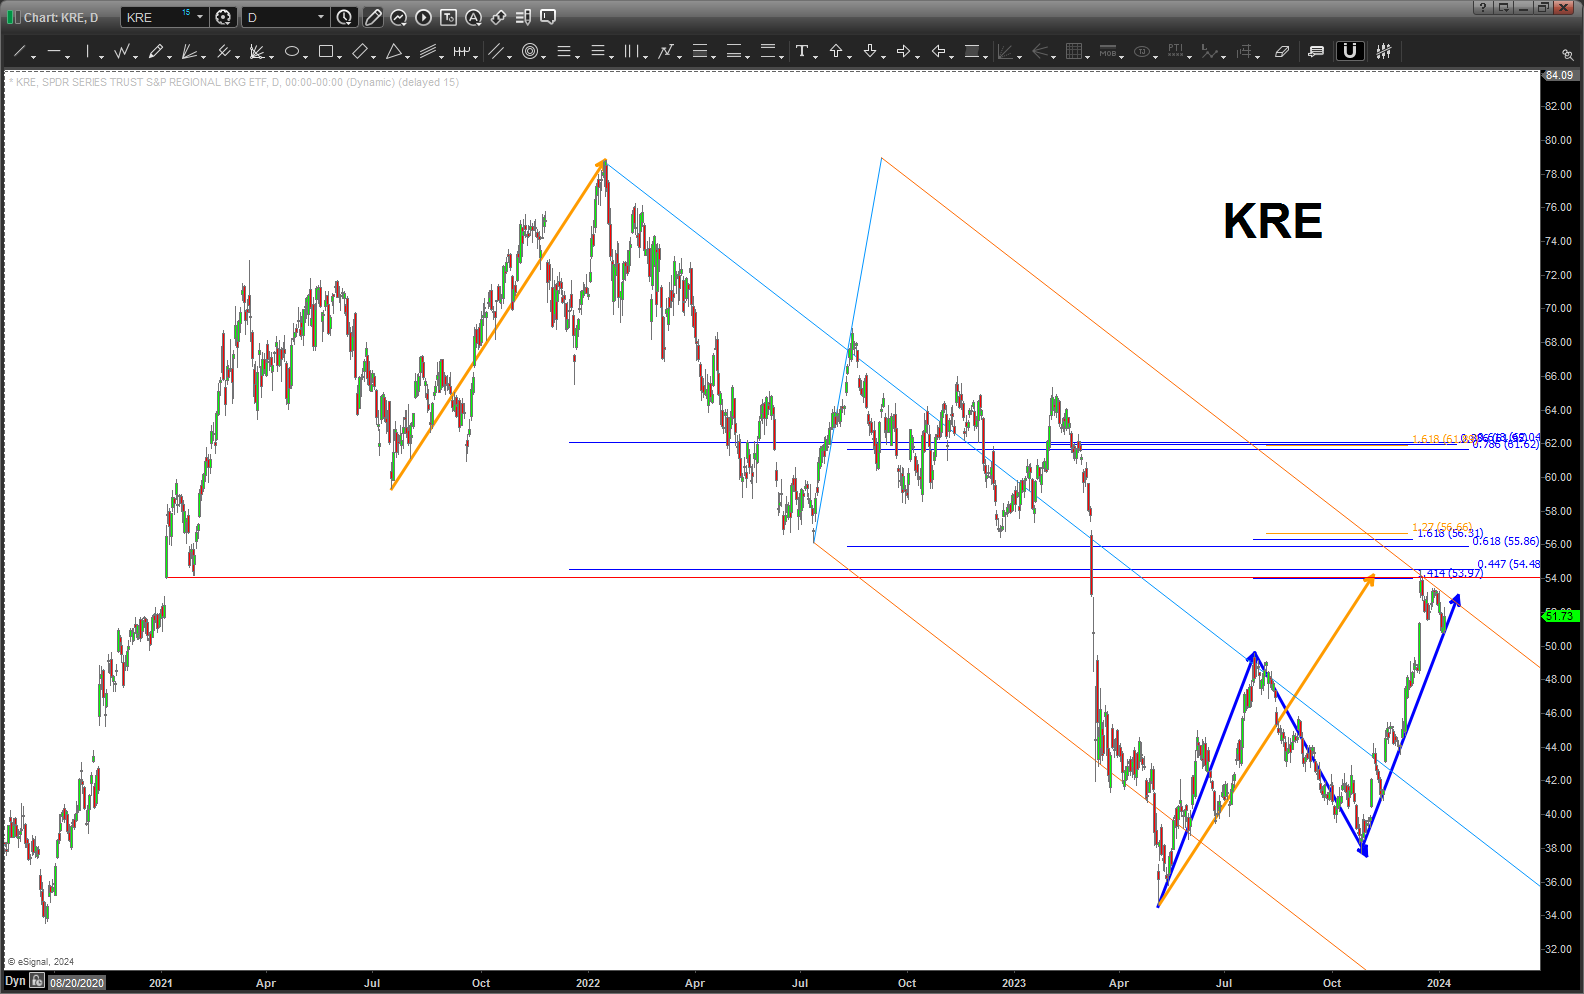
Banks/Financials – January 7, 20224
Posted on January 7, 2024 Leave a Comment
Last post on Banks/Financials: https://atomic-temporary-44460632.wpcomstaging.com/2023/12/04/banks-financials-december-4-2023/
Update …
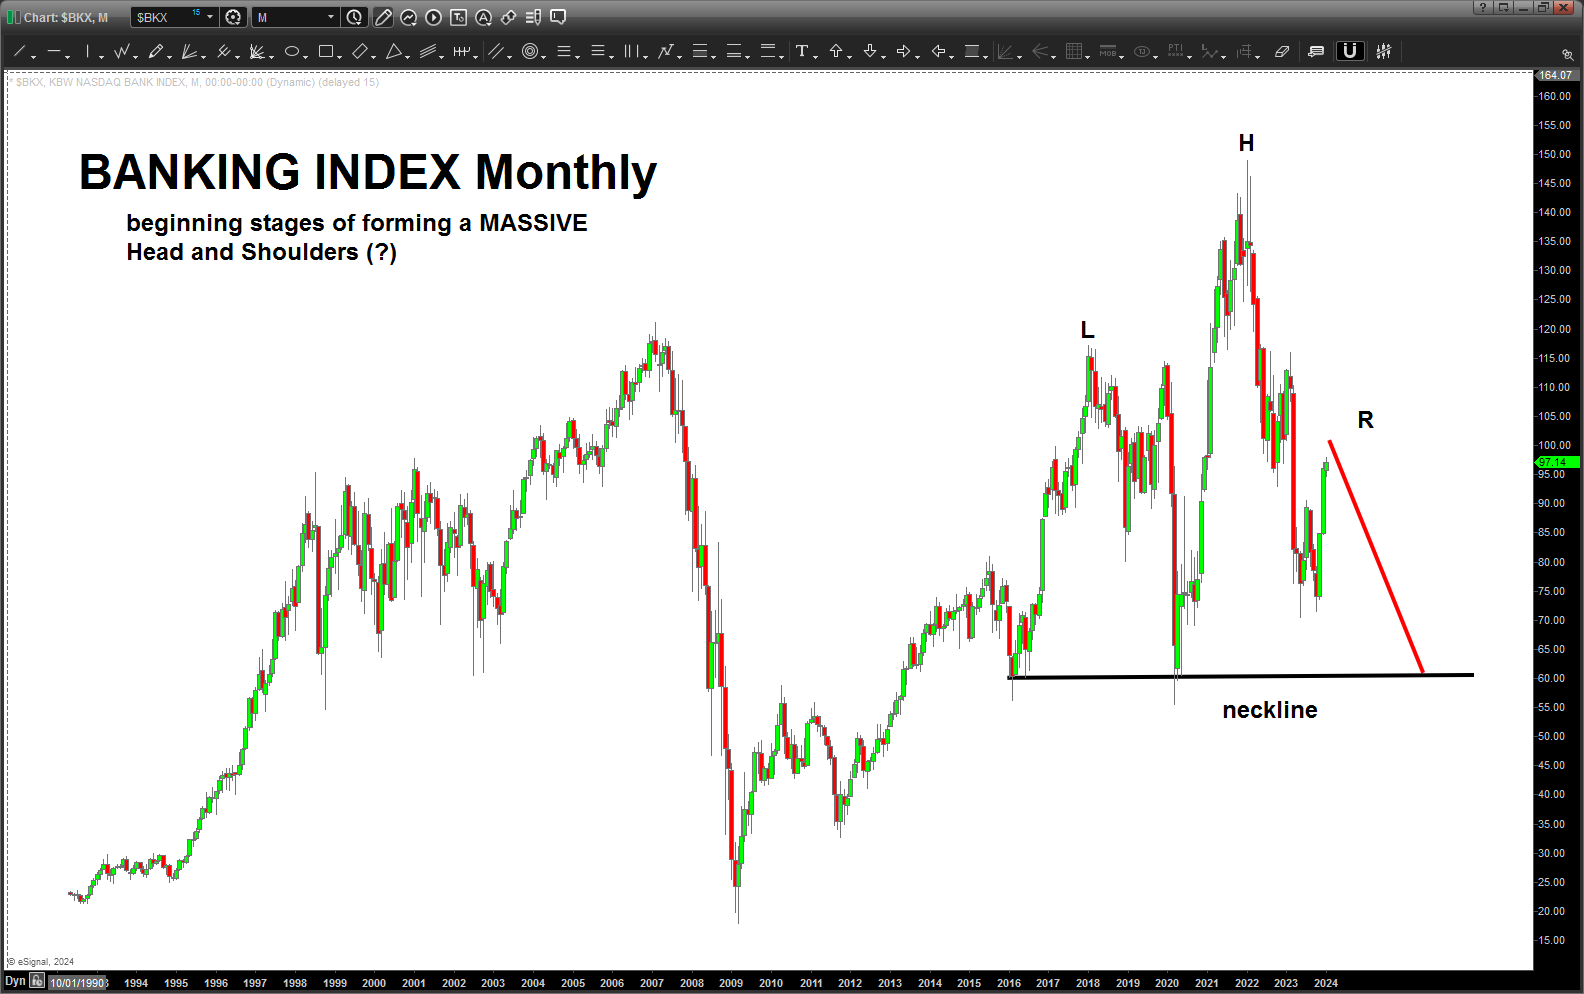
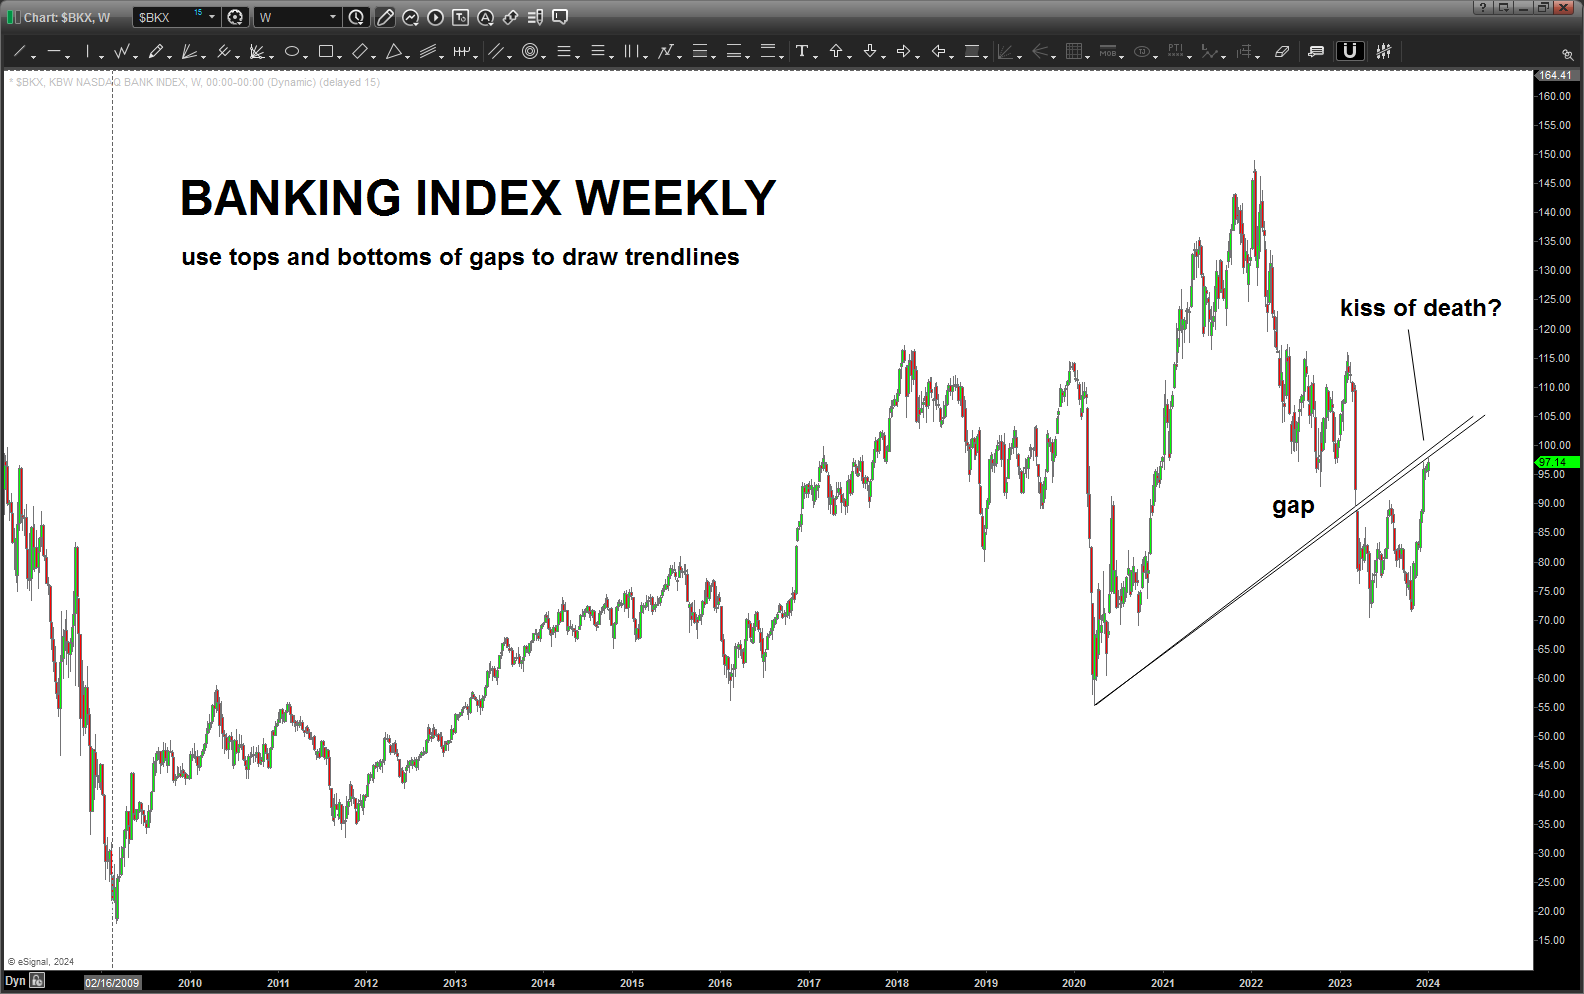
If you’re a BULL you want these patterns to FAIL.
If you’re a BEAR you want them to WORK.
Banks/Financials lead us UP and they lead us DOWN.
Decision time Banks/Financials …
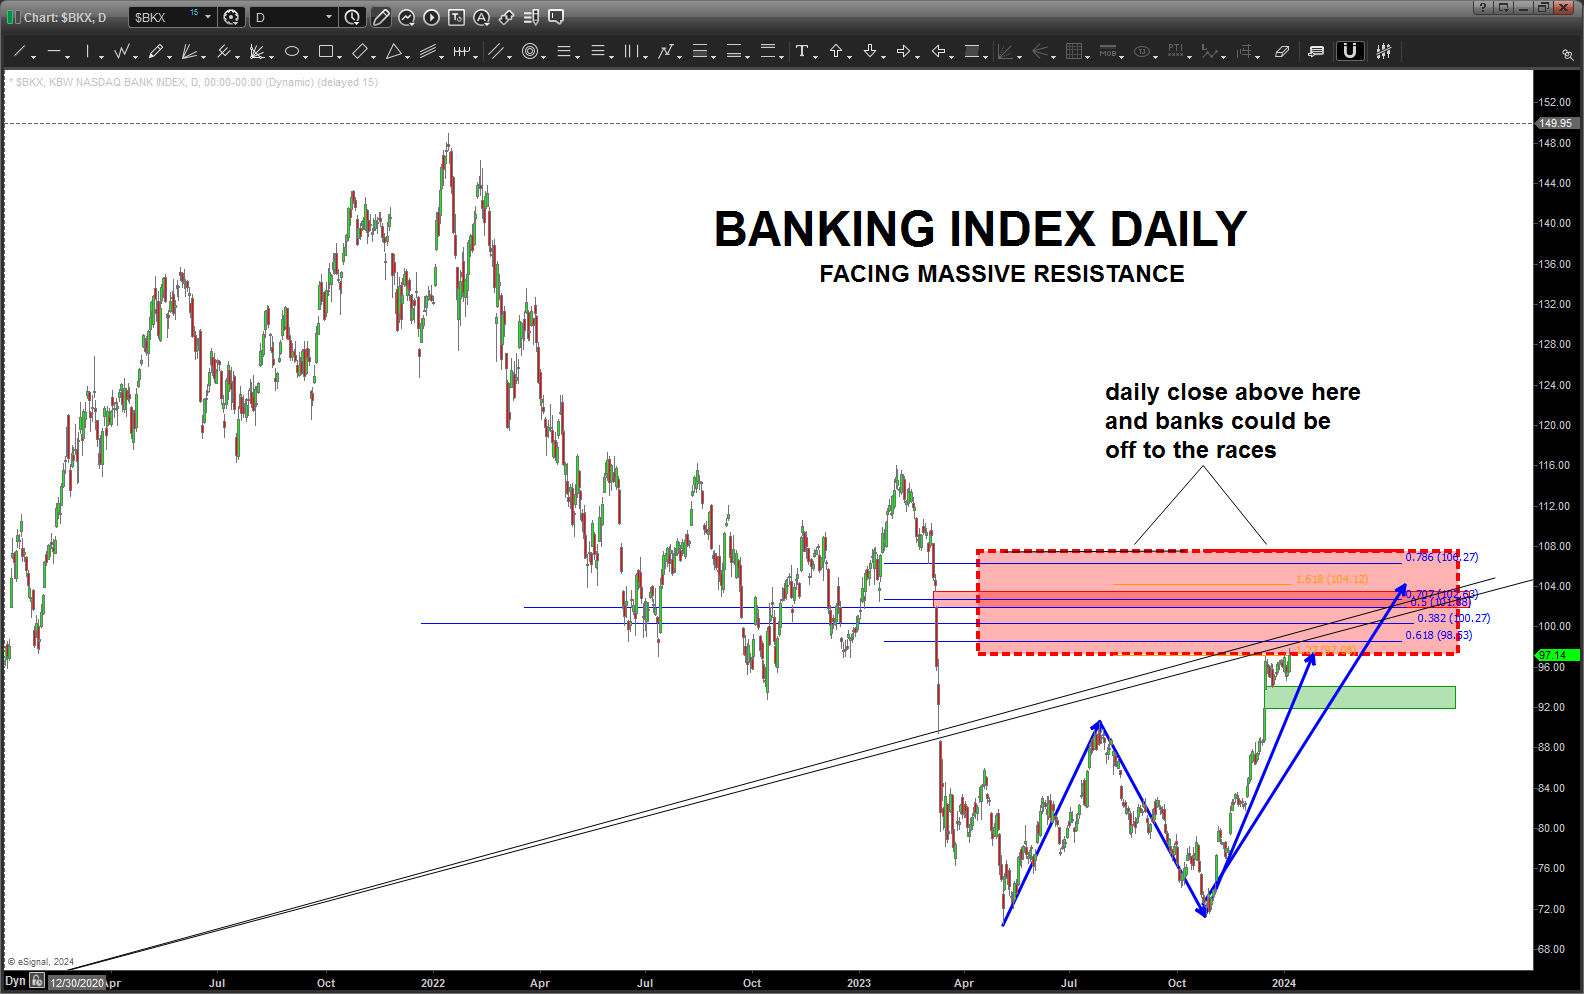
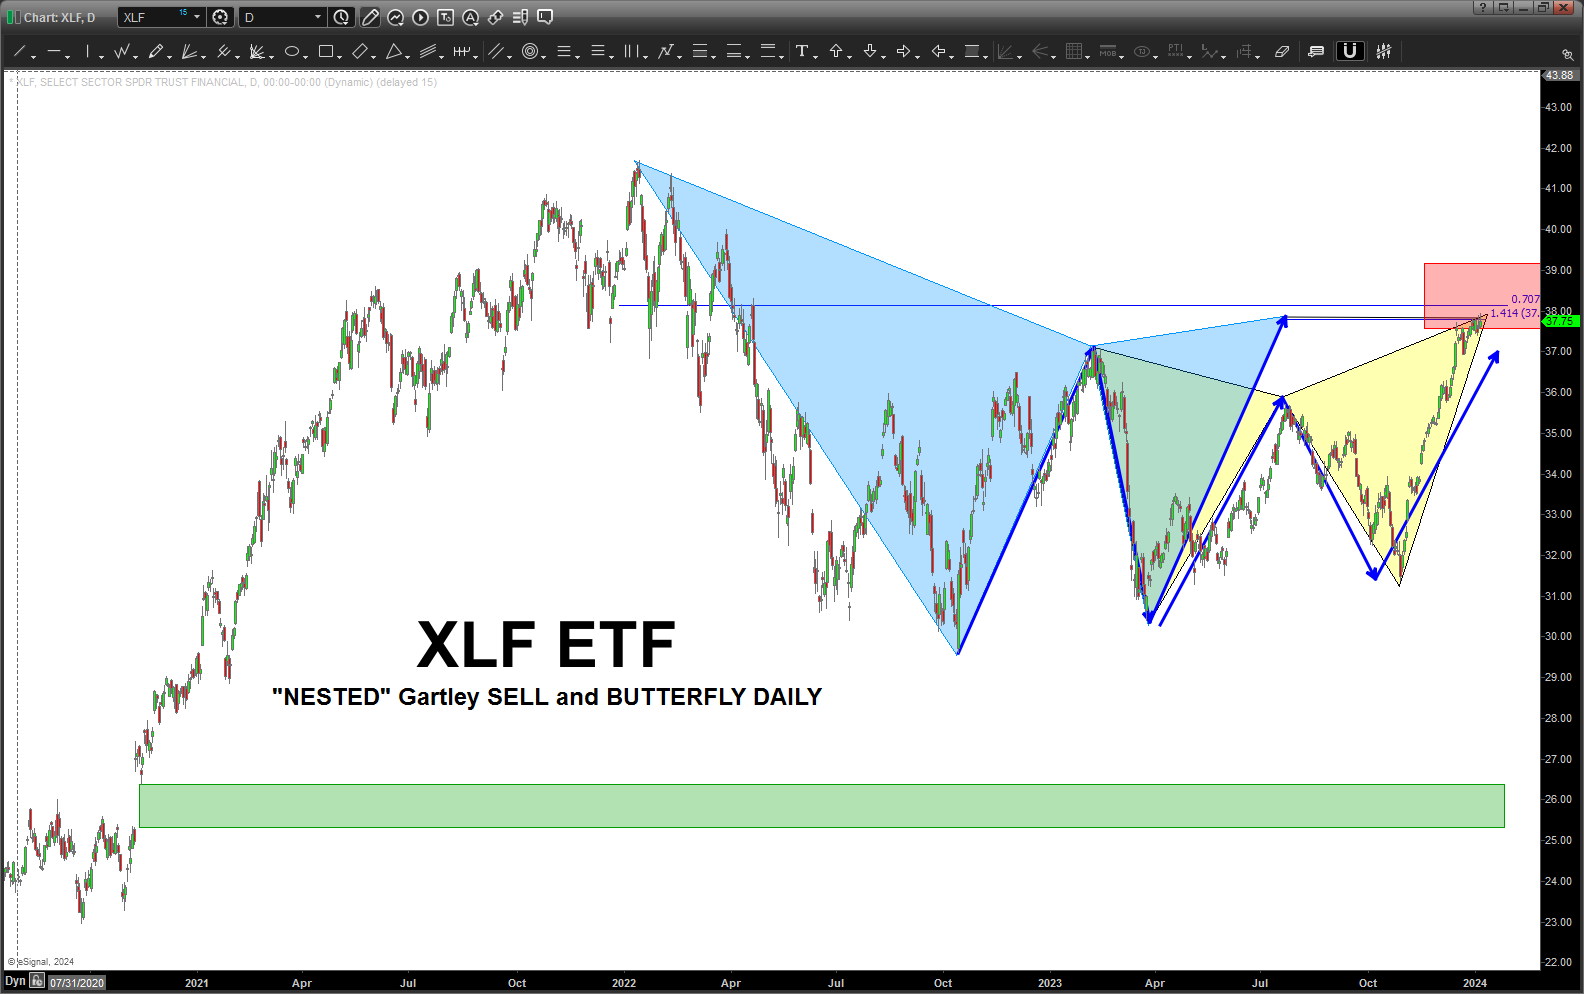
Also, take a look at XLF … completed, not only a Gartley SELL but it also has an embedded BUTTERFLY SELL PATTERN w/in the Gartley. IF XLF gets above the upper zone of the red rectangle – off to the races but it has to get thru a LOT of resistance, first.
Cheers – Bart