Apple (AAPL) – April 27, 2024
Posted on April 27, 2024 Leave a Comment

Last post on AAPL: https://atomic-temporary-44460632.wpcomstaging.com/2024/01/28/apple-aapl-january-28-2024/
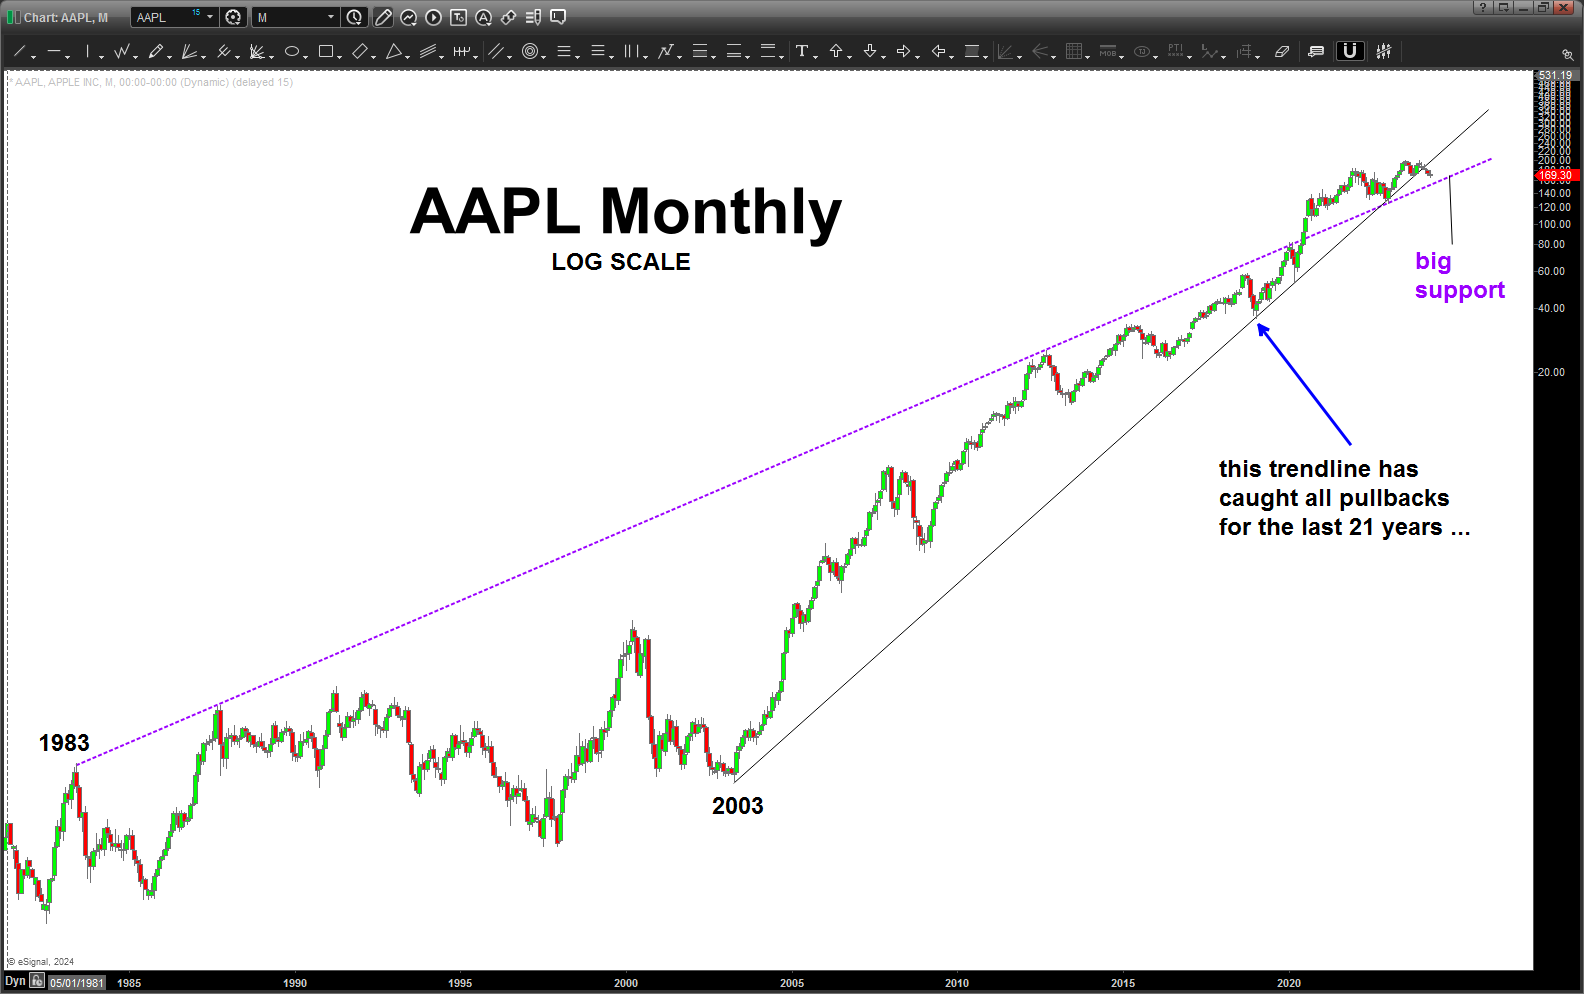
Pretty wild that the worlds most famous company seems to certainly adhere to the vibration of those trading/investing in it … the geometry has certainly been something.
Dare we trust my Elliott Wave Count showing 5 waves complete from a couple posts ago? Or, the fact that the geometry creating the gravity center up there in time and space caused the resistance which – thus far- cause AAPL to star falling from the proverbial tree. Is it going to hit any of us on the head?
So, we have broken and closed below (on a monthly basis) a 21 year support trendline (have no clue if that’s important from a fibo perspective or not) and the next realy important trend line is the dashed purple support line … it’s already been tested and worked causing the most latest run up to all new time highs …
Guess the question is are you willing to make the bet that the “dashed purple line” will hold as support again and AAPL continues its amazing run higher …hmmm.
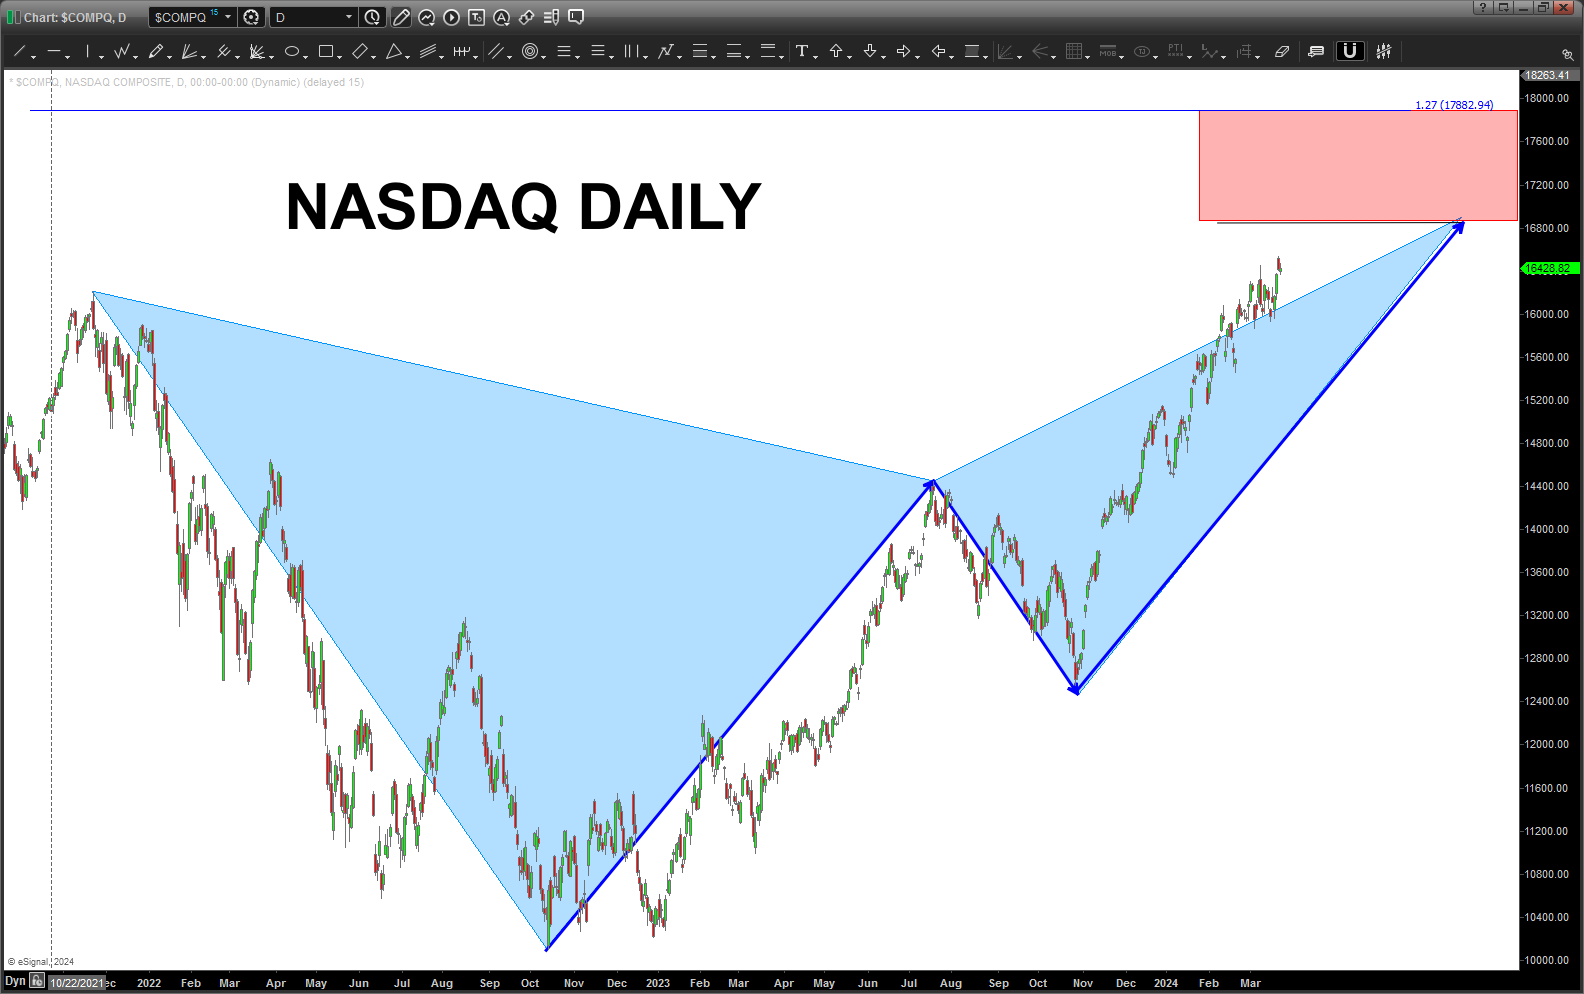
NASDAQ Composite – April 21, 2024
Posted on April 21, 2024 Leave a Comment
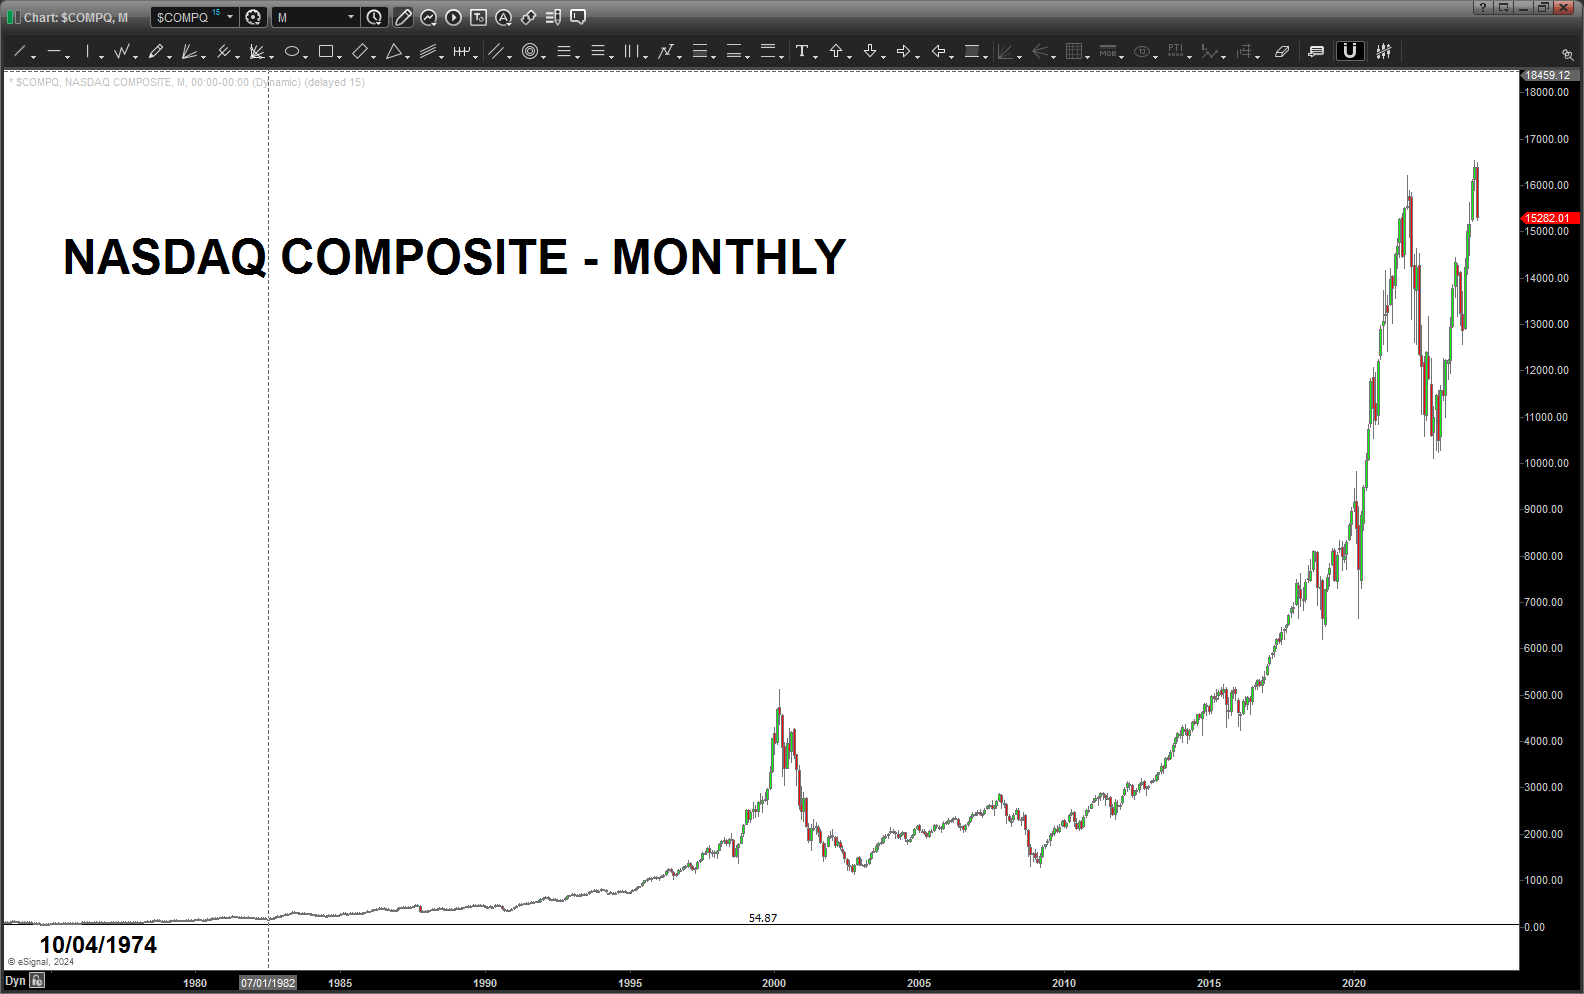
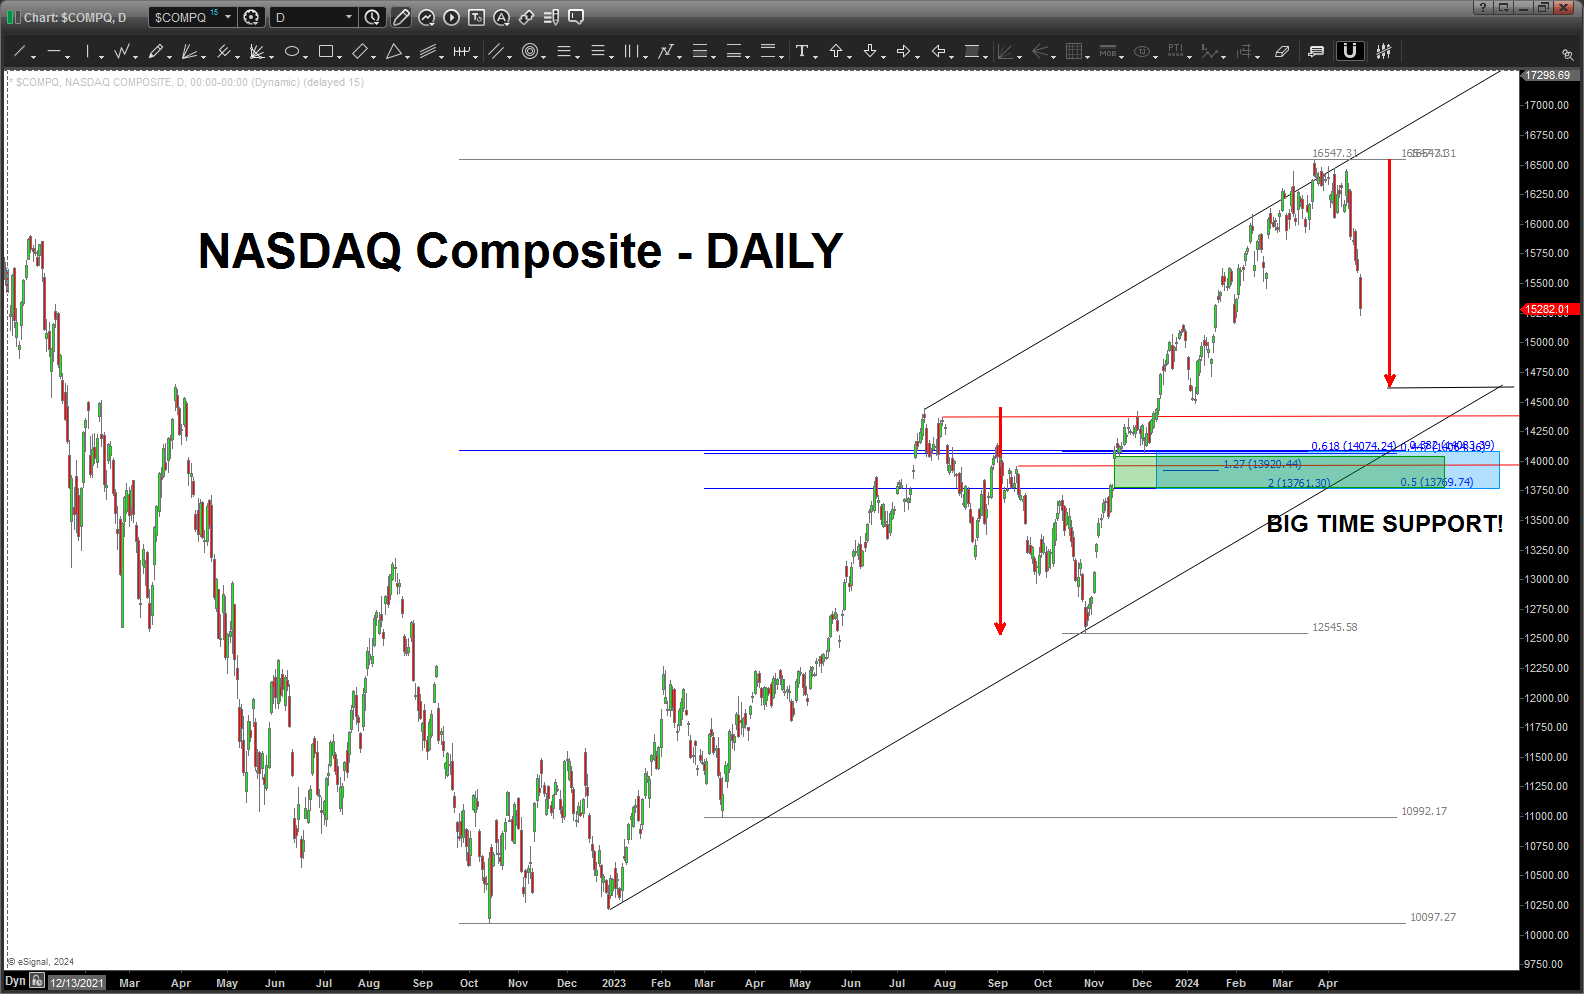
My friend/mentor Larry shot an email over describing the current state of the NASDAQ composite.
Friday’s move represented only the 3rd time the Nazzie was down more than a two standard deviation – in one day. The last time happened – October 1987.
I DO NOT SEE ANY SIGNS OF A CRASH COMING BUT … an interesting factoid, one would think.
We have VERY important support coming in lower in/around 13750-14000.
Not enough of a pullback to do a good projection so … just watch the measured move level (read arrow) and then the confluence levels shown below.
Again, I think we go down into mid-May.
XBI – April 20, 2024
Posted on April 20, 2024 Leave a Comment

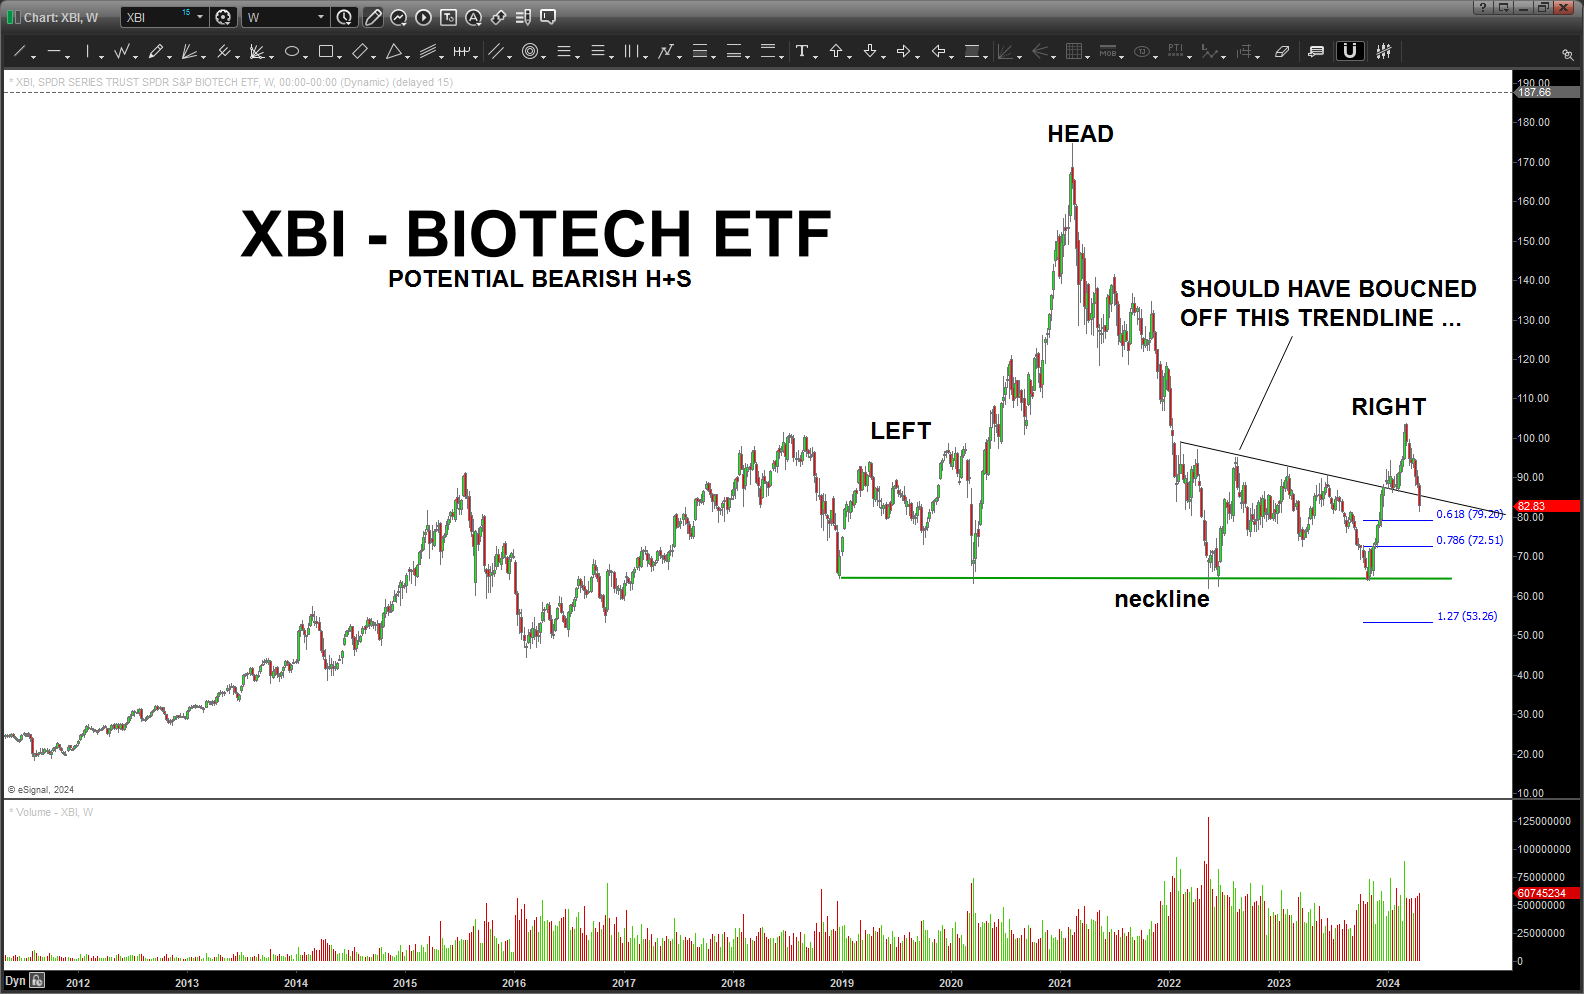
Keep an eye on XBI.
The high labeled “RIGHT” looks like the completion of an expanded flat.
Not hard to see the classic H+S pattern appears w/ the neckline shown as the bold green horizontal line.
If a “true” breakout then we would have expected the “polarity” of the black trend line hold as support – at least for a little bit. It sliced right thru it.
Next up is the .618 retrace. We really don’t have anything to project from so look for the 79-80 level to be support.
Hard to look at this chart as the company that I do Strategic Business Development for is in the biotech sector. What has been amazing is to watch all the VC’s and Private Equity people talk how bullish it is and – let’s face it – that was a NICE bounce off the green line but – what if its on a C wave ending the correction mentioned above?
The neckline has held for almost 5 years ….
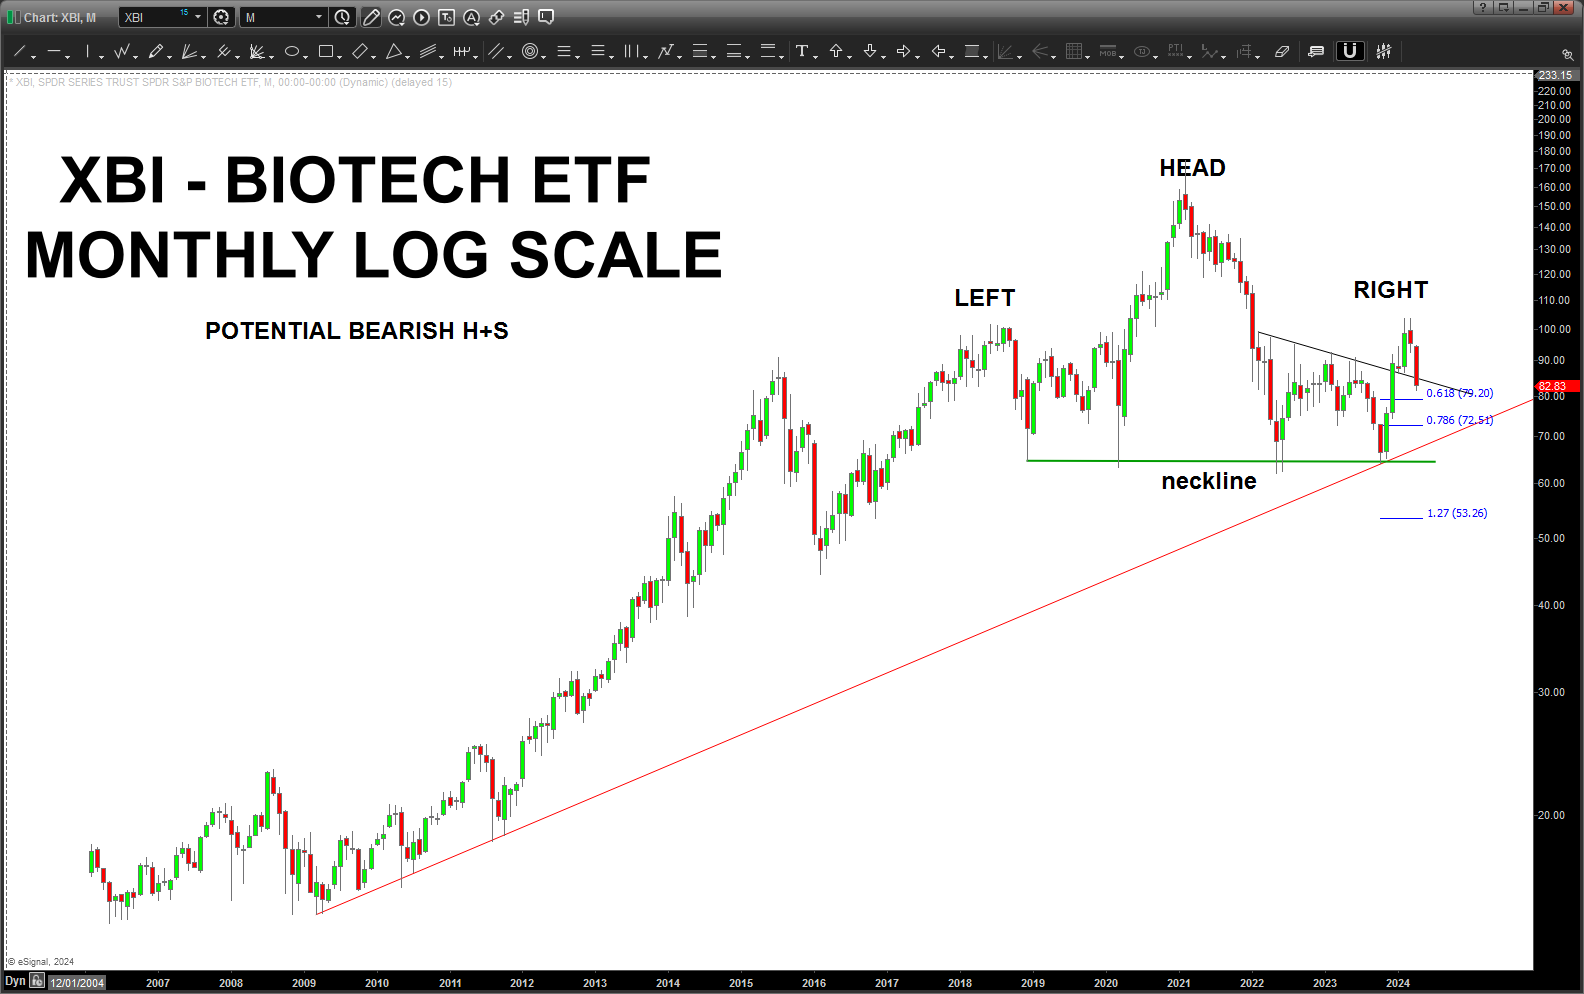
Always look at the long term chart and here’s a long term MONTHLY LOG scale – the H+S pops out like a sore thumb, doesn’t it?
Seriously, asking a question here – does this look bullish?
KRE – April 20, 2024
Posted on April 20, 2024 Leave a Comment
Last post on KRE: https://atomic-temporary-44460632.wpcomstaging.com/2024/02/18/kre-february-18-2024/
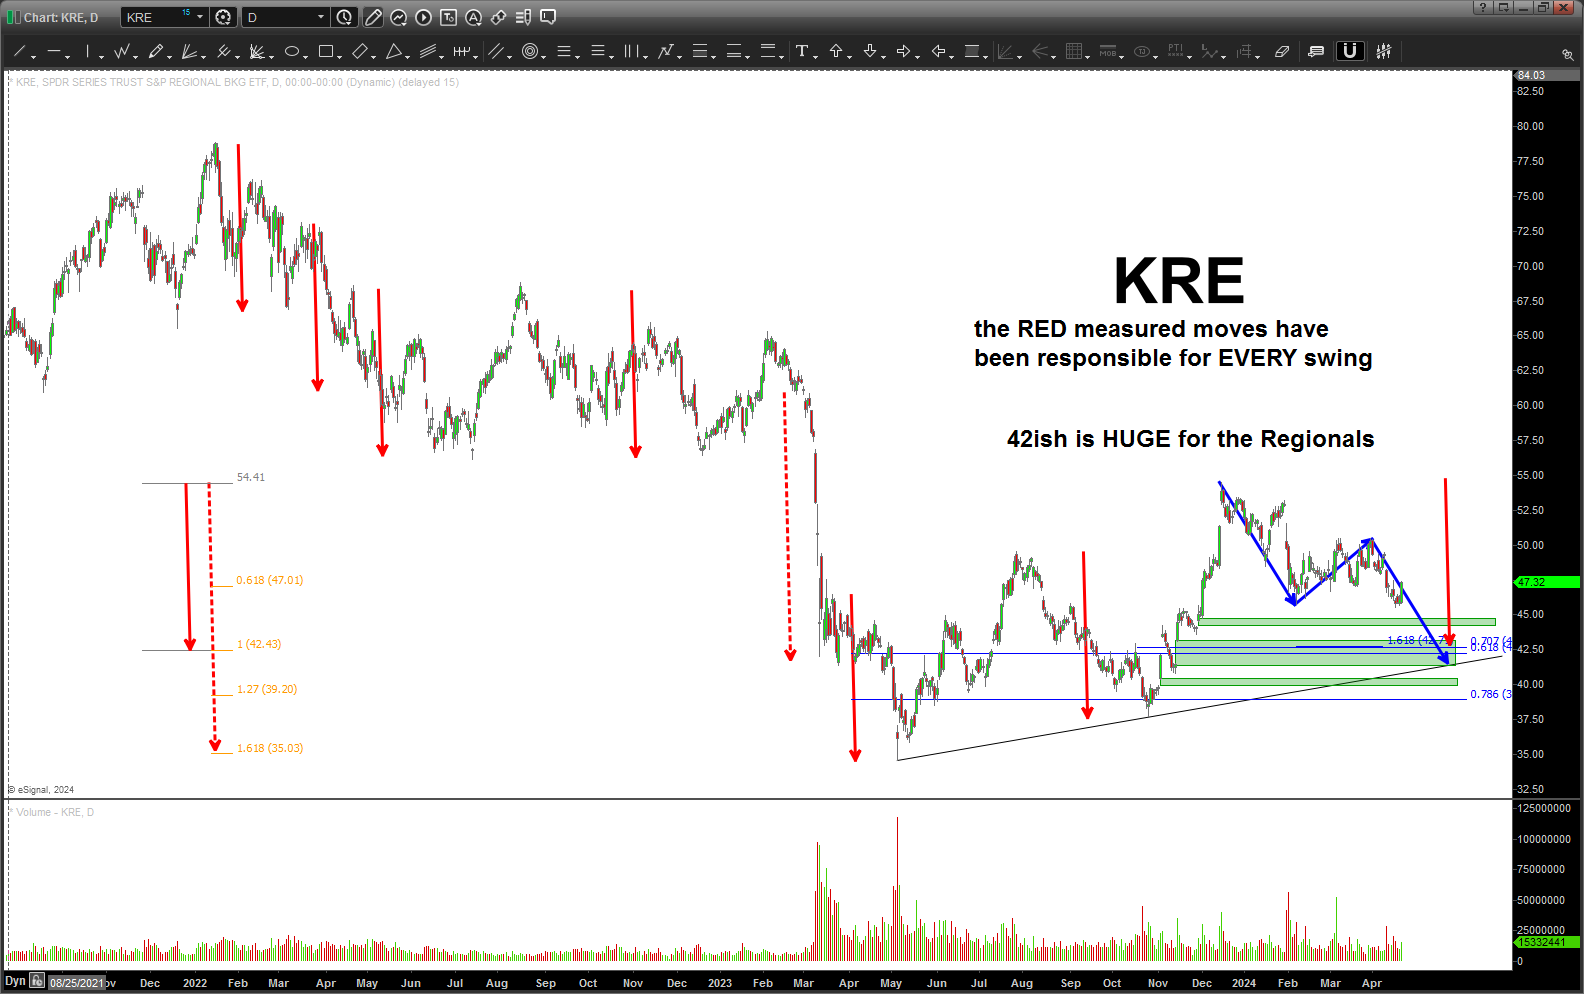
Since the top in KRE around 77 EVERY down move swing has been equal to or close to the “read measured move arrow.”
I added volume tonight because I wanted to see if we had a BIG volume spike accompanying the pretty bullish engulfing candle (daily) that occurred on Friday. Volume is around the norm … take a look at when KRE bottomed. That’s a “capitulation” low.
We have a small gap that needs to be filled before we move into the crucial 42 area for the Regionals.
If Regionals are “ok” then this is a BUY PATTERN and KRE should find support in/around that level.
If the Regionals are “not ok” then, well, that level will NOT hold and the KRE will, more than likely move lower quickly.
Very interesting …
Geometry – April 18, 2024
Posted on April 18, 2024 2 Comments

Slider’s been added to the mix.
Slider and Ponch and I all flew together when at the FRS. While I was “technically” their instructor, those two dudes were teaching all of us … it’s all coming back to me now. I now remember them always challenging “technical” aspects of different weapons systems w/ well thought and researched questions.
I don’t remember if I ever answered one correctly.
They are also two incredibly gifted and patriotic men … love these guys and, seriously, if you could see the content of our text threads. It’s a riot …digression complete.
Anyway, at almost 10 pm EST for Ponch he called me and I could tell he was “in the zone” … we talked “this” stuff and left w/ a concept of inflection points as we were relating it to when we flew low levels – 500 ft / 500 mph and Ponch was actually an F14 Airshow Crew so he got REALLY low and really fast. Man, those days were truly a blast. But, we talked about upcoming turn points and width of route and everything in between …
Around 10 minutes later I got this in text:
“@Bart Slider made a connection back to Reality switch technologies when we were talking FEP/Act Inf and E-M theory.
The turns points we talked about tonight are attractors. They are part of the world space landscape.
The world space landscape is consciousness, it is learning, not static. This means attractors move. No map can reflect the terrain. The terrain is the map.
Patterns you are uncovering contain attractors (turn points).
The gap between what your patterns reveal and actual reality is known as surprise (Boyd called this New Information and mismatches, it also goes by entropy). We seek to minimize surprise.
How do we minimize surprise? We predict where we expect to find attractors (turn points). “
So, my commitment is, as we continue to dive into this “stuff,” I’m going to document it … we are onto an idea and Ponch / Slider have the scent. I’m honestly just along for the Patterns. (they’ll dump me in a heart beat when the next pattern guy comes along … 🙂 )
You might want to tell your friends to follow along … why not? It’s free … LOL.
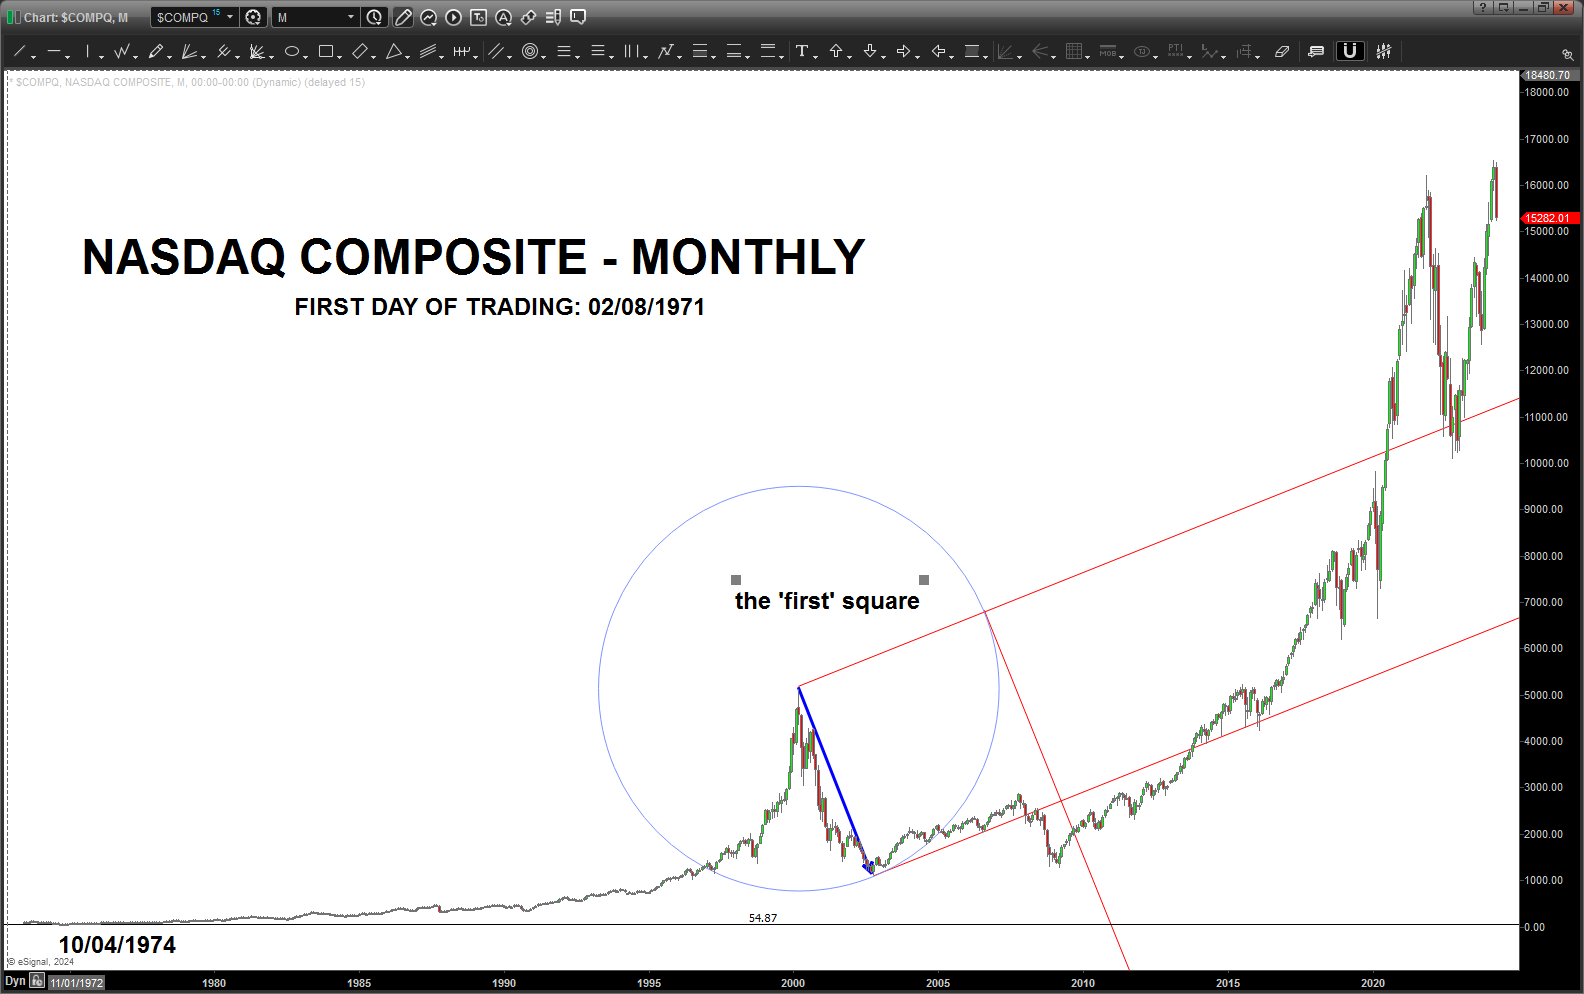
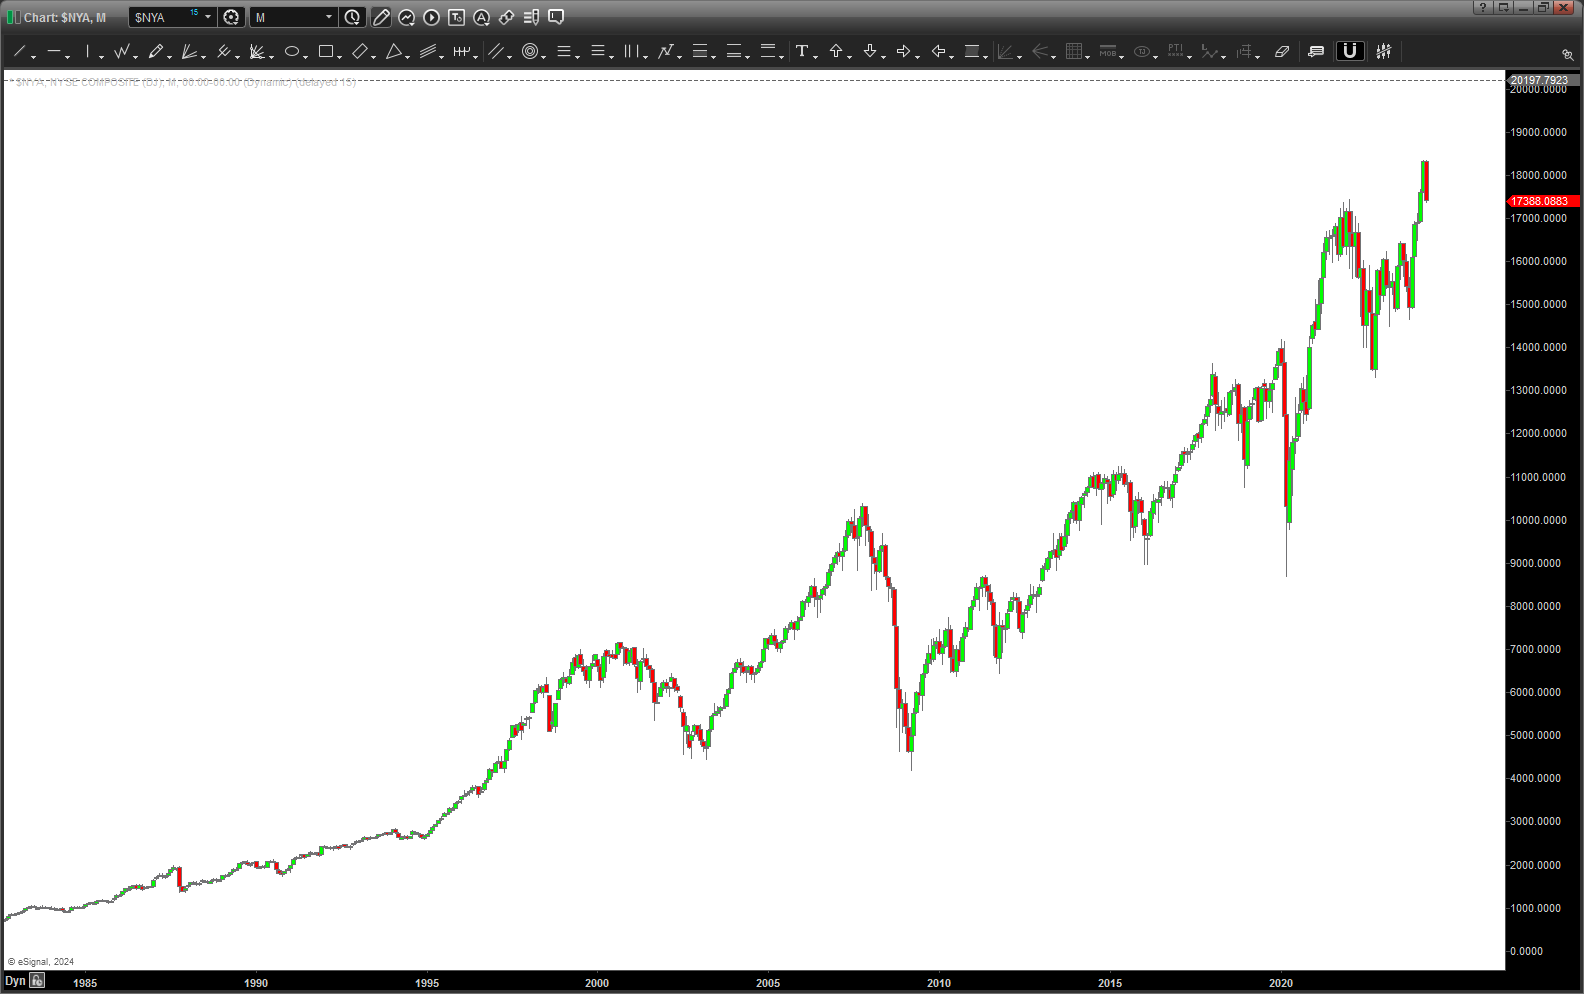
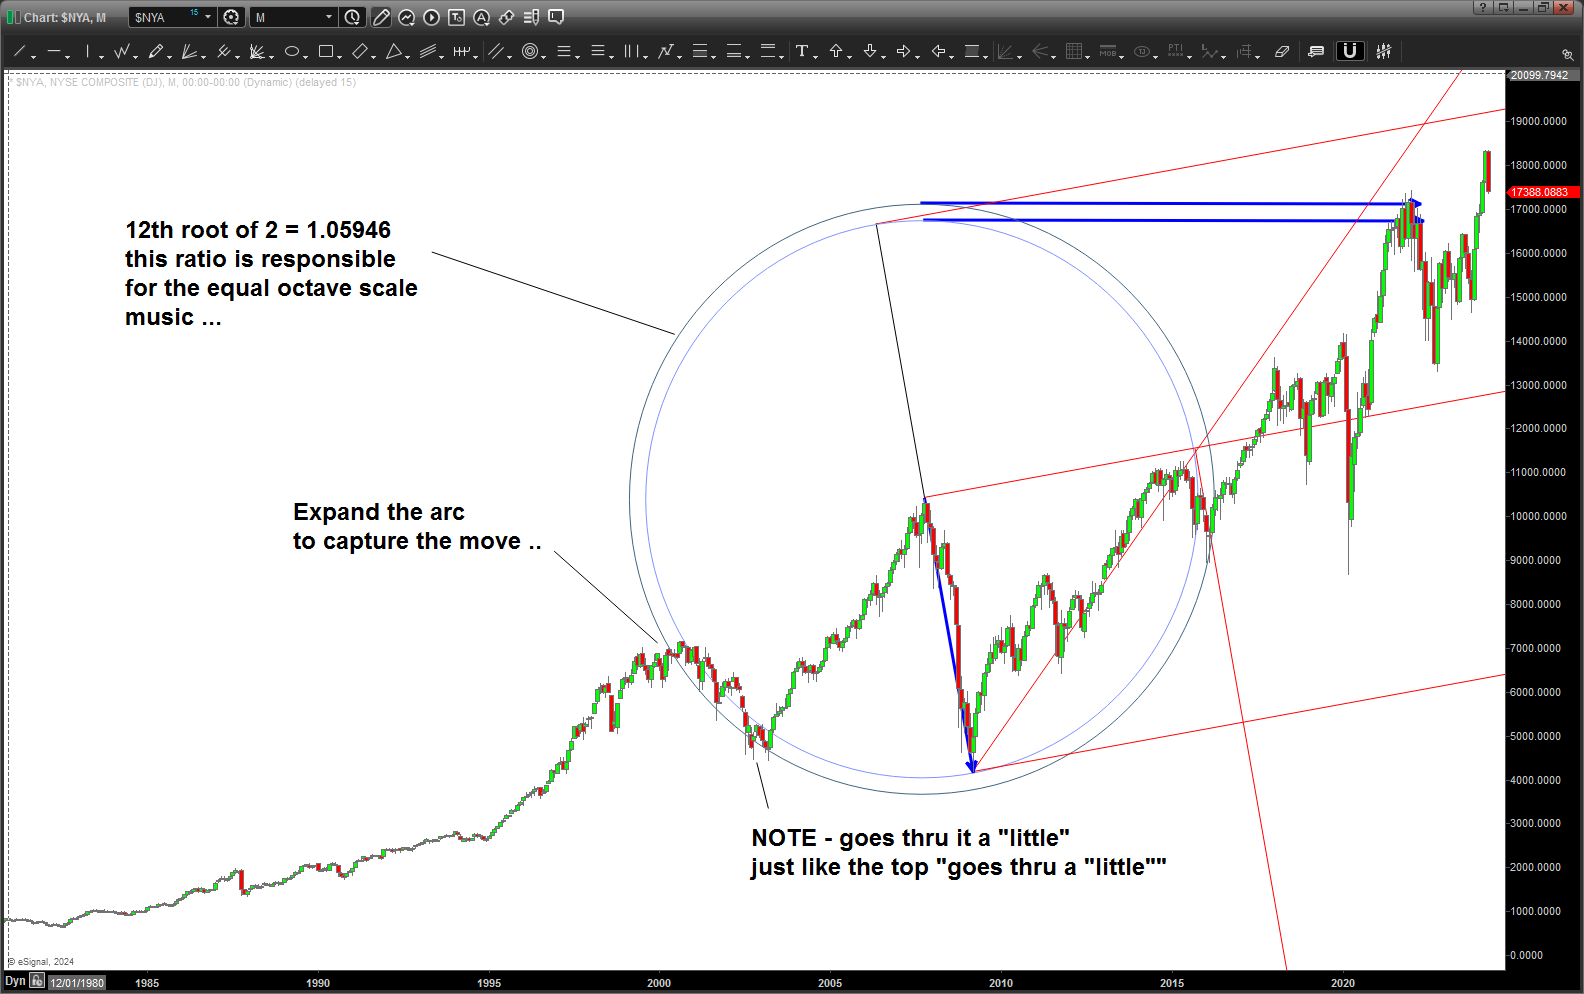
Anyhoo … as we look at the market, one of the things I told Ponch is IT DOESN’T MATTER which swing we pick when we start to create its geometry. The only thing is we want to capture a “swing.” A major high and a major low …
This is why I use long term monthly charts and try to capture as much or all of the chart data/history as possible. Why? Because these ARE the swings – everything else underneath them are – perfect – FRACTALS of the BIG SWINGS. Or, if you would like to look at it in another way, the monthly swings are the result of the first 1 minute or tick chart low to high (assuming most charts these days are going UP) which was the metaphorical rock hitting the water but w/ an expansive force that would be governed by what? The laws of waves, which abide by the laws of music which ultimately produce – the geometry we see w/in all of our reality.
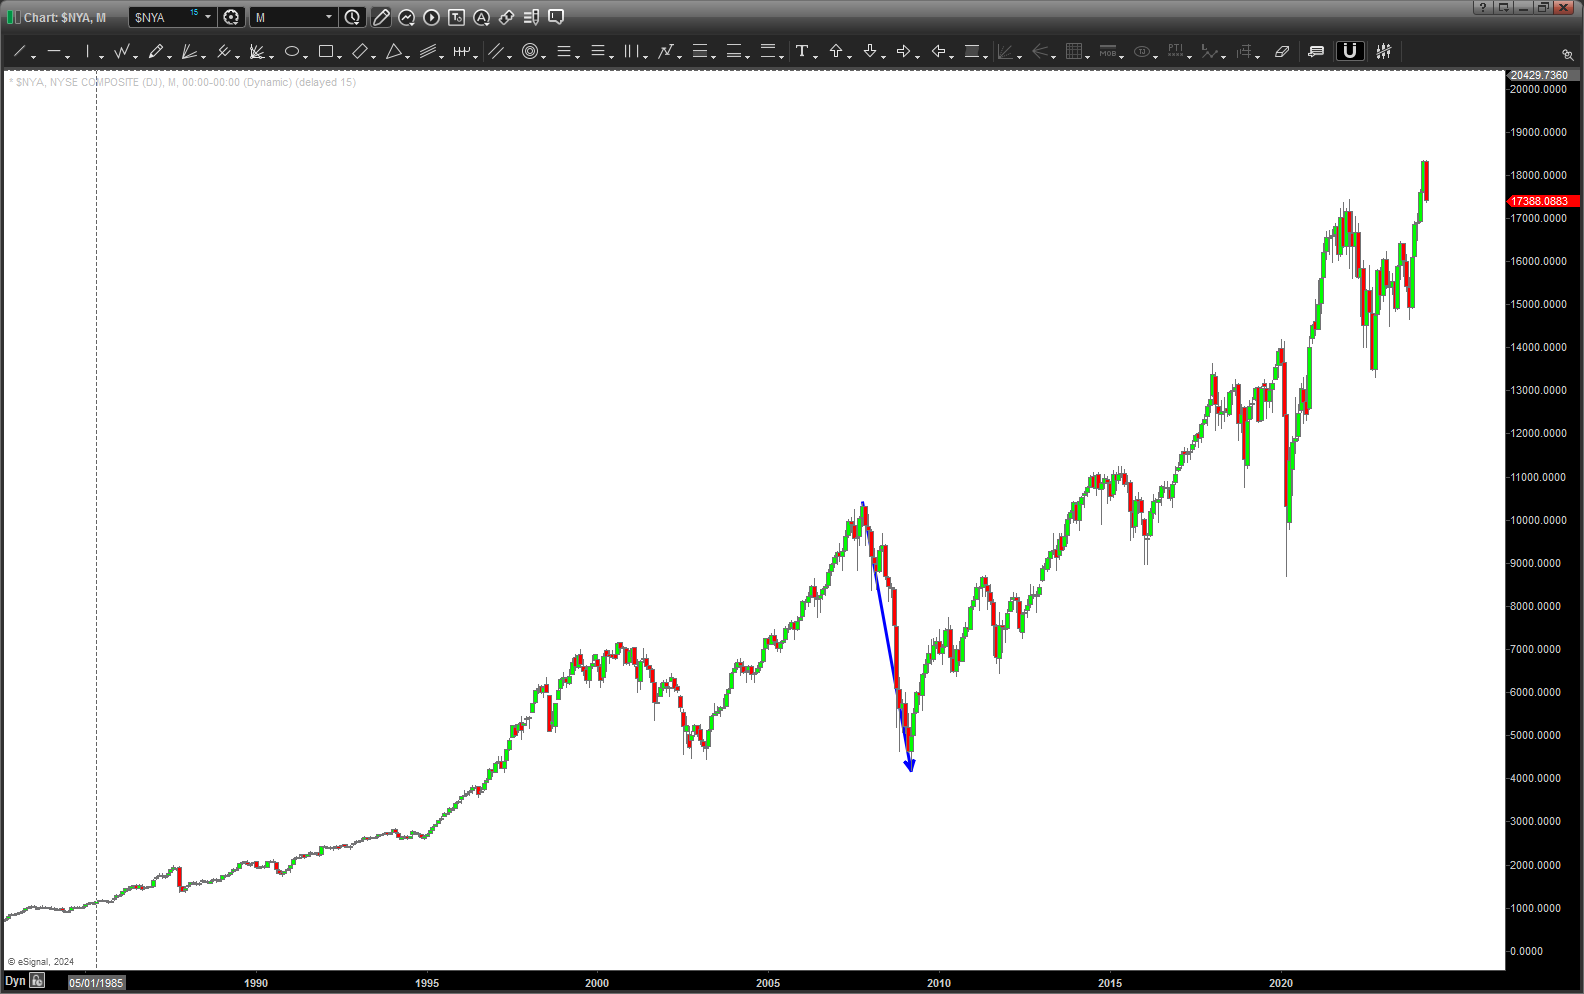
So, below you will see the progression from a “random” swing that I chose and the expansions both back into the past and into the present and future that abide by the natural law governing – well -us all.
SURF.LIVE.
Why not try it yourself – it’s that easy. I mean, come on, if your reading this blog? 🙂
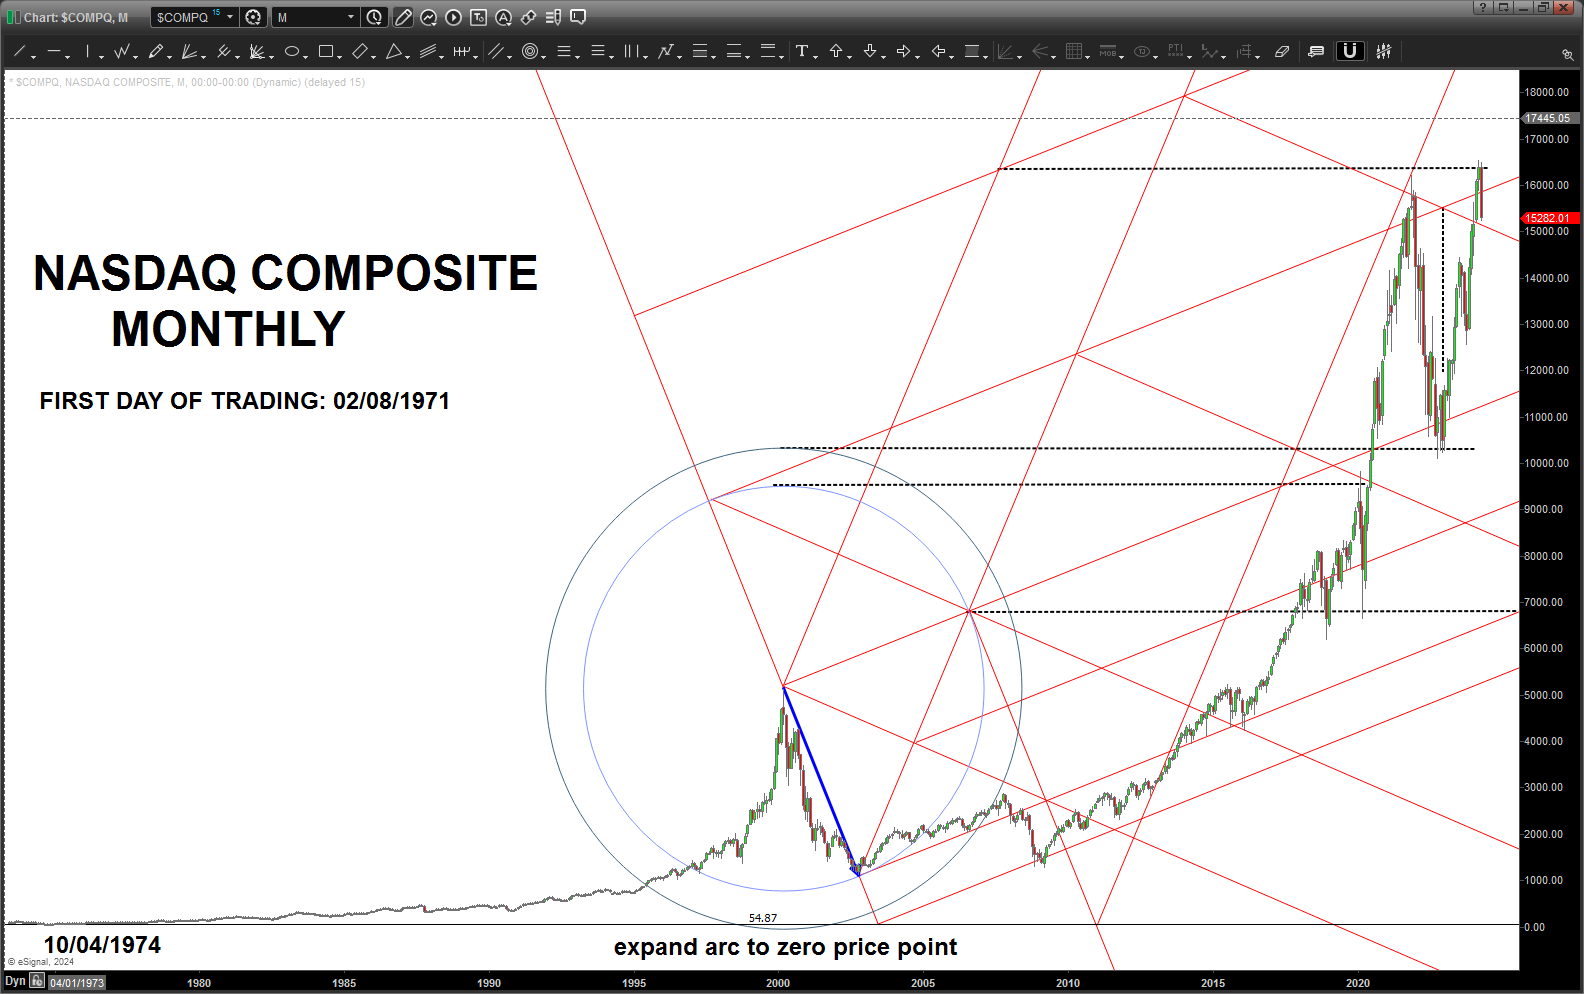
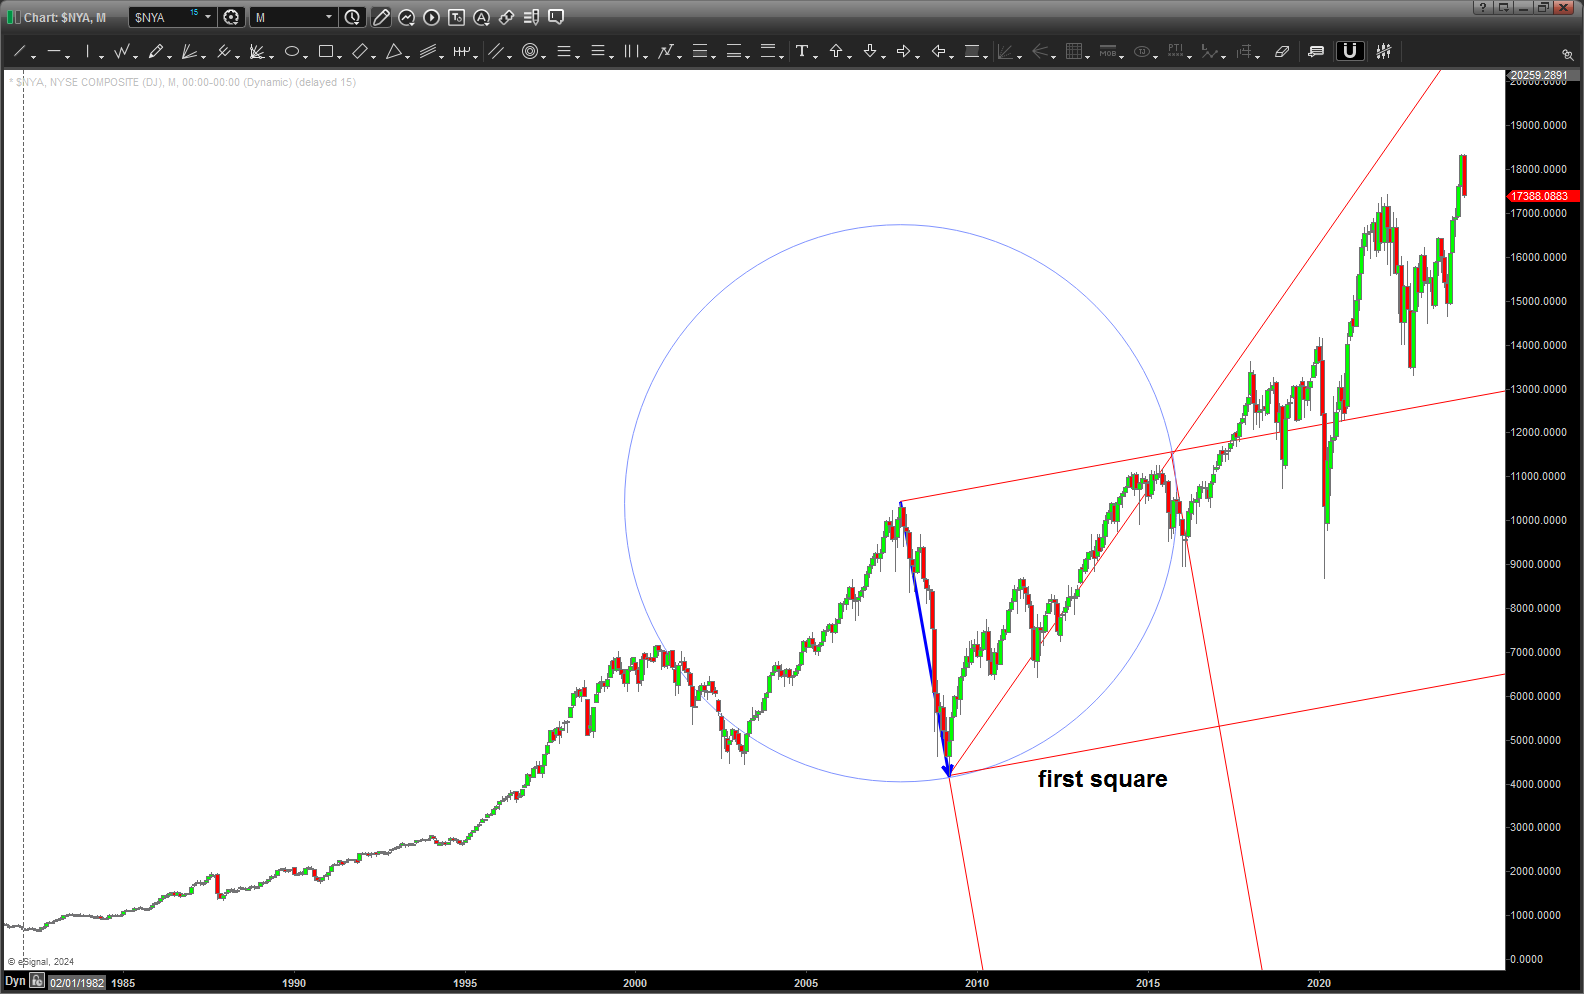
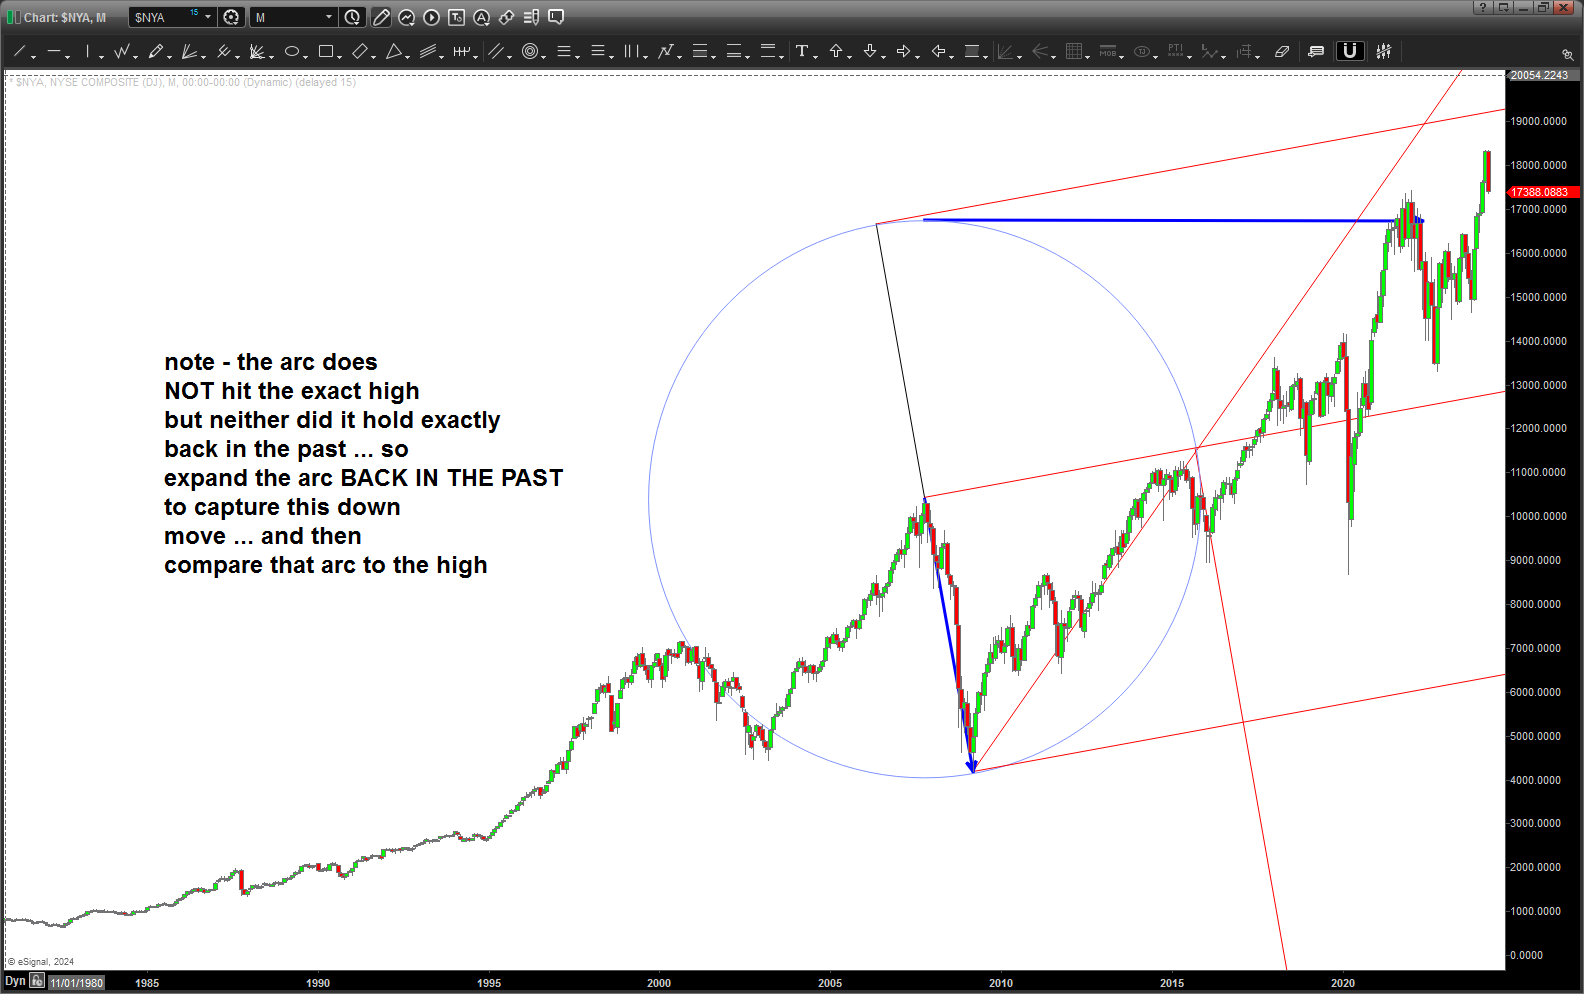
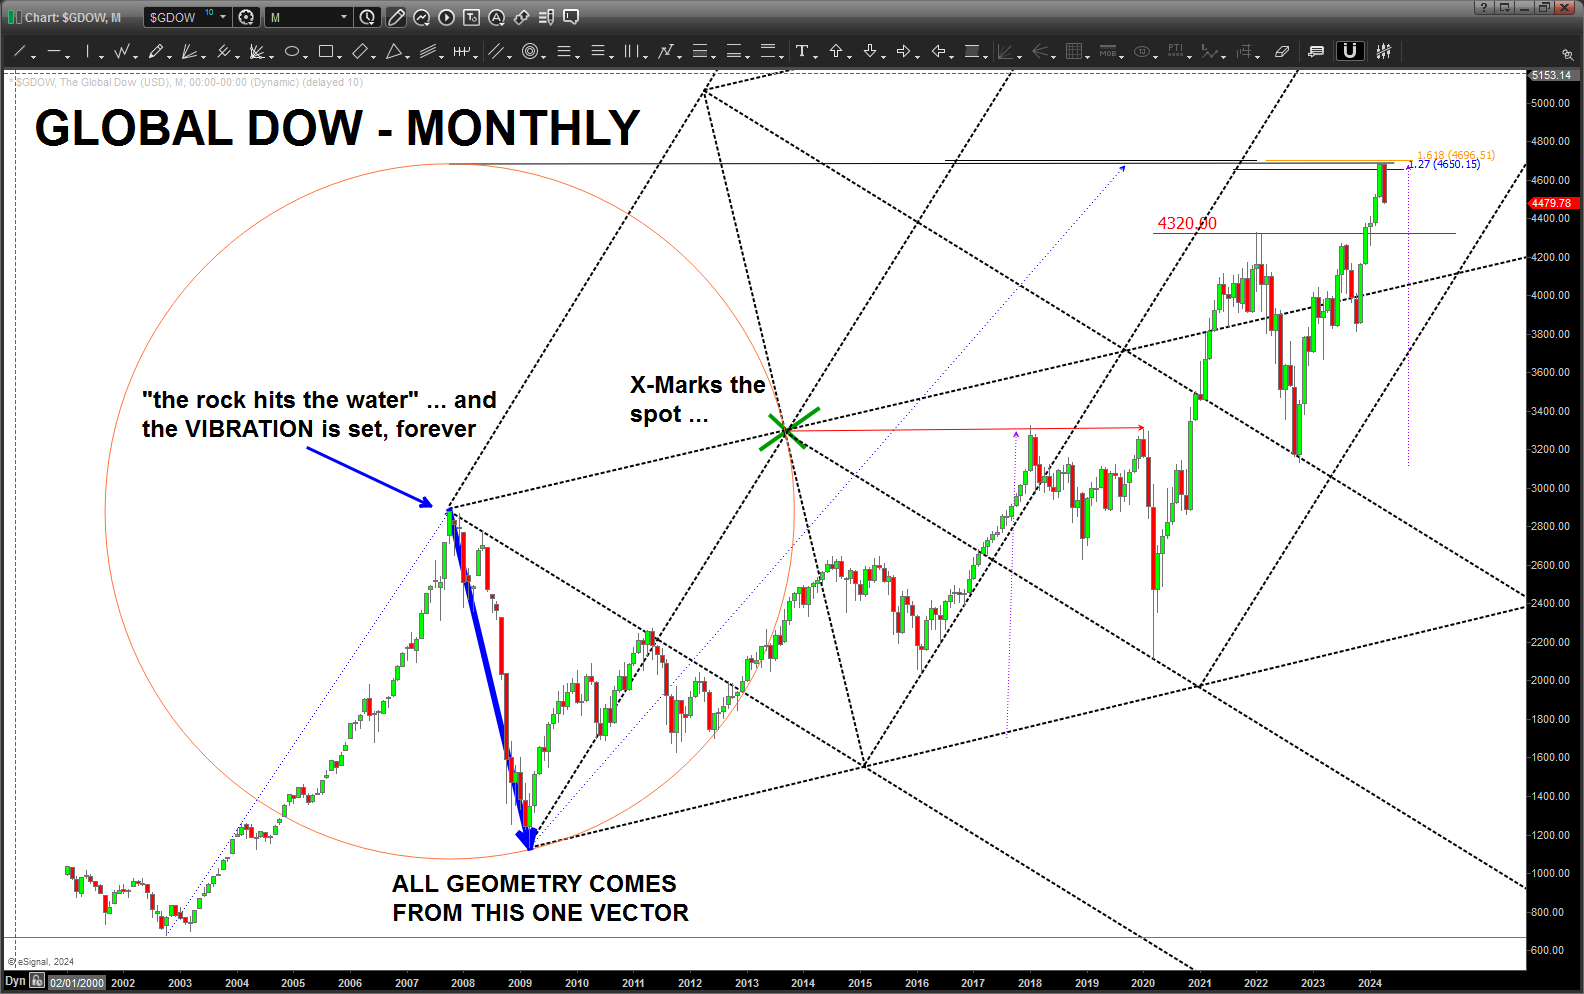
So, as you can see, that one blue vector caused the geometry shown in the above charts which are pretty amazing if you look how the EXACT same delta outside the arc that was support back in the past, replicated itself EXACTLY the same price amount as the past. And, if you just “expand” the arc by 2.o and let your eye study the last chart you will see the “mirror opposite” correction occurring opposite the circle and along the same arc and price total of the one in the past. Wow.
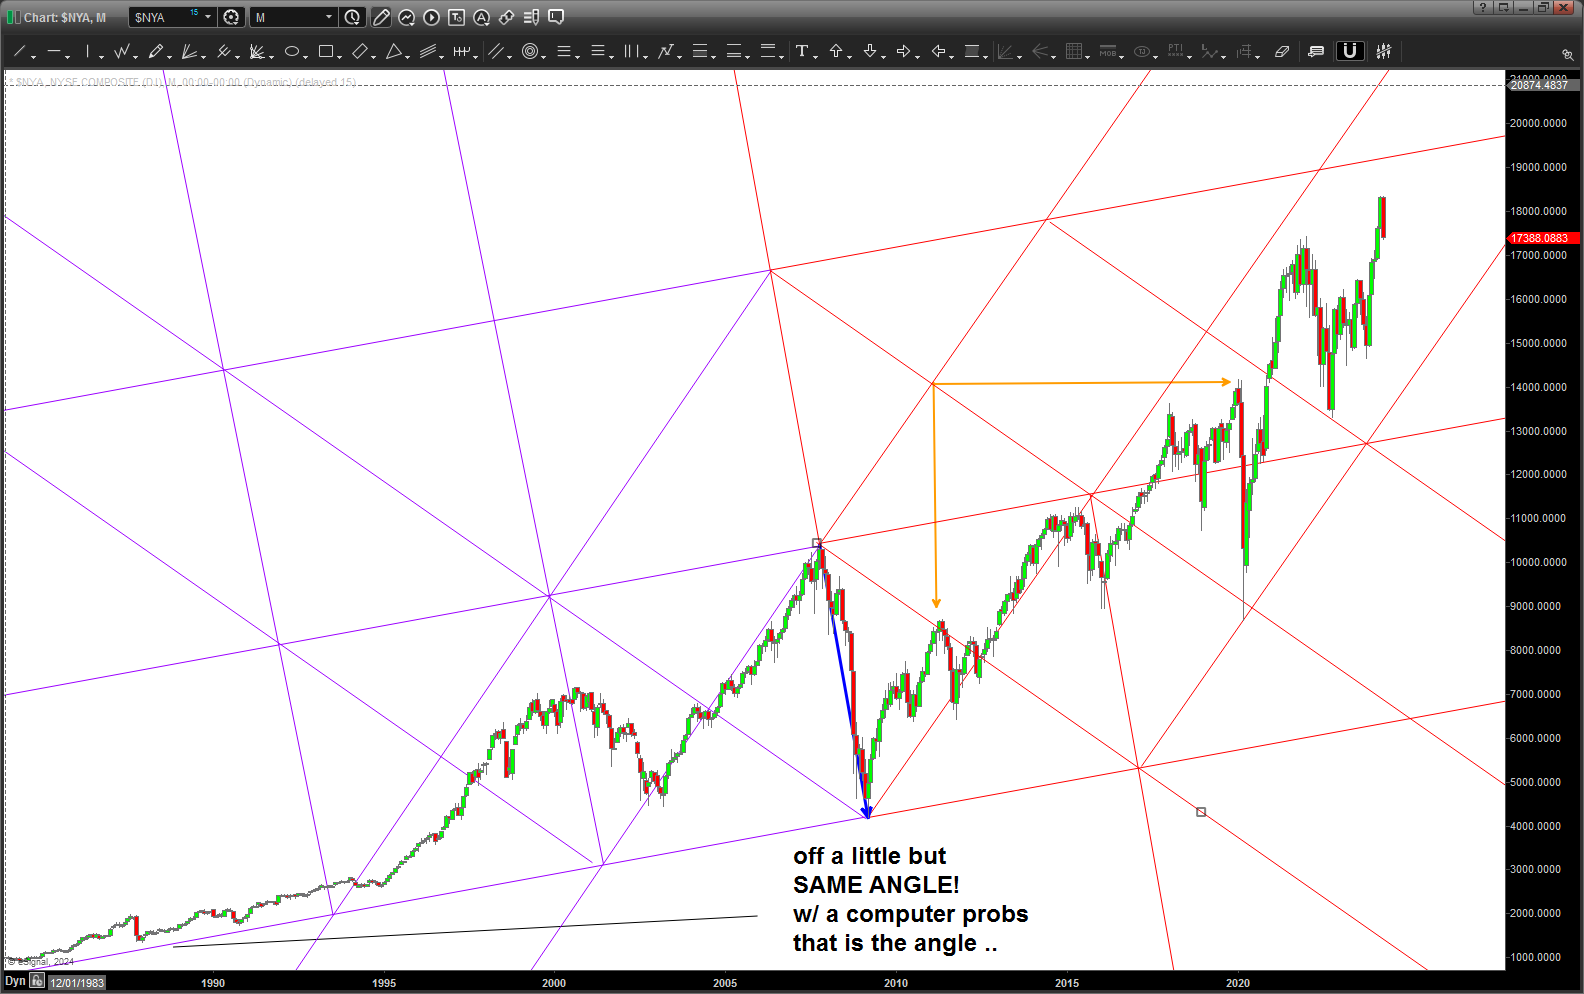
But when things REALLY get fascinating (because it does STILL fascinate me) is because when you put the “entire matrix framework” together you get an amazing picture. Why so amazing?
Think about it – these trendlines and intersections are causing future and past inflection points or angles of ascent and descent based on the GEOMETRY SET by the angular (price and time) VIBRATION of that “blue measured move” down ….
And what’s that vibration do – just like the entire universe – it becomes form.
Study this chart … replicate it. It’s meditative. Or at least is has become …
- A vibration is set in this 2D representation of PRICES MOVING THRU TIME when a security COMPLETES a major long term swing. A swing determined by a major swing low to a major swing high (preferably the first on a long term chart) or vice versa.
- The vibration becomes form governed by natural law. What? Well, in a 2D world the platonic solid for that is a CUBE.
- Hence, it’s just squares peeps …hence the reason we draw them based on the angular (PRICE and TIME) displacement occuring in the 2d representation of this event occuring w/in this game called life …
- Our job, at least mine? Find the patterns to simply manage risk. The same patterns which repeat – as fractals – specifically governed by the emotional vibration of the masses which are trading the same securities day after day … and that’s why the patterns work … because they are, work with me here, simply geometric representations of the frequency, accordingly, NUMBERS that the masses put off subconsciously into TIME AND SPACE (sound familiar) leaving footprints for us to exploit to MANAGE RISK. (That’s all it is) and, since human nature never changes – “there is nothing new under the sun” – the PATTERNS representing the masses vibrational emotions of fear and greed are geometrically created by the same math and music that governs us all …
Now, one last …
Go ahead and make sure you blow up the picture above and spend a little time meditatively staring at the “center point” (where the purple and orange square trend lines meet and start the blue corrective move down) and you’ll begin to, slowly see triangles, then the triangles go together and then you’ll see – yup – the pyramid. Hugh … imagine that.
But now, keep just lifting that “center point” up from there and you’ll see the pyramid nice and clearly. Now, blink, and overlay the Square of 9 numbers on top of this pyramid and – now – do you BELIEVE?
Because if you BELIEVE you will SEE how this all works …
Global Dow (again) – April 17, 2024
Posted on April 17, 2024 2 Comments

My friend Ponch and I are digging deep into the nature of the markets and, frankly, into the nature of reality. No kidding …
He might be THE expert (yes, that’s a bold claim but go look at his website or listen to one his podcasts – the man is brilliant!) at John Boyd’s the OODA loop.
We are discussing a theory we have around the OODA loop, consciousness, fractals and the creation of this 3D Holographic Game by the brain – frame by frame every instant – governed by the principles of natural law.
Did I just right that …? Back to the charts ….
Ponch asked me – why didn’t you pick the first low to the high ? The answer – I’m a straight shooter , “I don’t know, I just liked the one going down.” No kidding … but, like I wrote last night, you could do that and the trendlines might not be the same but they would be harmonic. Well, take a peak … X certainly seems to mark the spot now, doesn’t it …
For further discussion … think about this, seriously.
While I FULLY admit that the patterns have failed – it’s all probability folks but I have found NOTHING better at helping you get awesome entries, exits and, MOST IMPORTANTLY, risk control. WE ALWAYS KNOW WHERE WE ARE WRONG!
So, that being said, philosophically, let’s think about what’s going on here …yes, I am doing this “post price action.” I’m doing these exercises to expose the geometry and hidden order behind it ALL.
You see, once that initial high off the all time low – on a long range timelines is what I prefer – we have SET the vibration for the rest of this securities existence. (Sound familiar – think of YOU taking your first primordial breadth – the place and time (price and time sound familiar) of that first primoridal breadth sets YOUR vibration for the rest of your life. So, when a stock takes its first trade, the ENERGY or VIBRATIONS , begin … but the fundamental wave or frequency of that vibration won’t complete it’s period (see where were going) until it exhausts that first breadth… or high (in this case of the Global Dow)
During that time of the run up – the clocks that govern time for EVERYTHING – yes, the planets have moved a certain amount of degrees – singles, aspects, heliocentric, geocentric, etc. etc. – and that’s how you can start figuring out “which planets it’s shucking and jiving with or what pairs by understanding the impact of it’s IPO date/time. Yeah, no kidding … whatever planet is governing or lesser will give you clues and then … the cycle has begun and the waves go out – all according to natural law and, with ALL of nature being governed by sacred geometry and fractals we can use the same governing principles in anything that grows and contracts … and there we have it – the market.
Pattern recognition is based on the same natural laws that cover all of creation w/in this 3D Polarized Holographic game called life. The entire game is created under the same mathematical structure using constants and mathematical/physics principals that, essentially create and piece together this hologram.
Everything is vibration which creates waves which are governed by mathematical principals based on music.
These vibrations cause reality (they are all at different vibrations – just like all of us) and are perfect subjects to allow the 5 senses to feed the 12 cranial nerves of the brain so the brain can do what – PATTERN MATCH the information that is coming in to create thru our brain the reality we are witnessing. WOW.
The only way for the brain to be able to do that is to make every piece of the game be birthed from the one and created thru the one experiencing life thru it’s first division just like we do over and over and over again.
With all the above being said, that’s why I use pattern recognition to simply manage risk.
And, one last, if I’m drawing the squares off of one vector from the low to the high (or the first major correction) then isn’t the angles formed from that first initial move already in place …? 🙂
Global Dow – April 16, 2024
Posted on April 16, 2024 Leave a Comment

Tonight, for whatever reason, it was the Global Dow.
The past few weeks have been pretty amazing. I’ve done a TON of reading and sketching (yes, Mr. Robert Edward Grant got me into it) and a TON of BrainTap and meditating. Mr. Grant is an amazing follow and teacher. Recommend him – highly. A bright shining light counterbalancing some of the darkness gripping our FELLOW HUMANS. I’ll stop there … we are ALL connected. Be light ….
Anyhoo … in light of the above it was nice to kick back and go to a chart I had not looked at in a long time and come at it w/ fresh eyes. As I sat down, I said “what the heck is the rest of the world doing?” These times are the craziest I’ve ever seen … come on folks, take off your political hat (if you wear one, I DO NOT) and just admit – left, right, center – it’s flipping crazy out there right now!
Ahhhhh … the Global Dow.
I opened the chart, w/ NOTHING on it (no indicators or drawings) – just price and time.
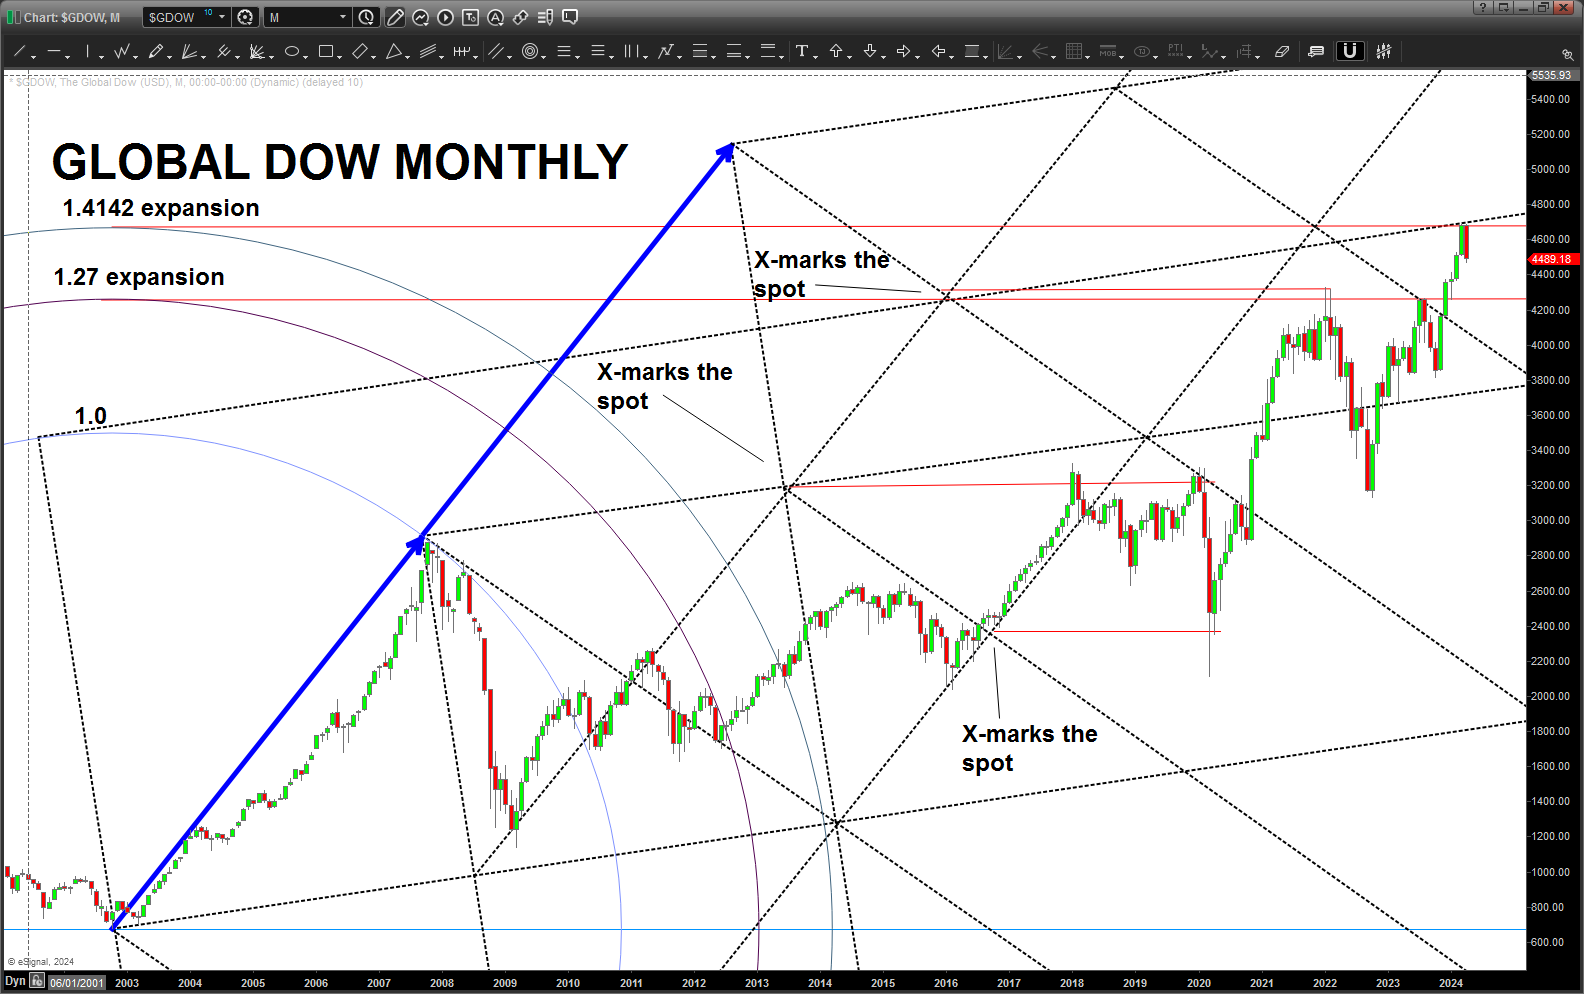
Everyone can see the “measured move” that I chose as the “rock hitting the water” point. You could have used the all time low up into that big first high – it would have given, more than likely, different trend lines BUT I imagine it would have given trend lines that are significant and harmonic with the trend lines we have drawn.
The blue measured move arrow produces EVERY SINGLE bit of the geometry shown in the chart below. Take some time and just follow the bouncing ball up the chart and look at the GEOMETRY that this particular VIBRATION (the blue arrow) created.
Now, look at the top … the all time low, to the first high and then down (the blue arrow) projection is, yup, 1.618AB=CD and, the last swing in/around the 2022 timeframe is a 1.27 extension (square root of 1.618).
Trying not to confuse anyone w/ too many lines I’ve also drawn the 1.618 projection AND a dashed (feint) purple measured move which is equal – exactly – to the last swing high.
Now, just for a little fun, what was the EXACT high in January 2022?
4320 – 432 HZ. Thank you Mr. Grant.
All this being said, where are we?
Definitely against some STIFF resistance so going down for a bit is a good highly probable bet.
Is this THE top … I really don’t think so. Not that my counting is anything to write home about, but I do have a BULLISH count after this pullback – representing this is all this really is … a healthy pullback in an ongoing, potentially extending 5th wave. My other count is we are starting a wicked and, potentially THUMPING, C wave down. Ain’t Elliott Wave great?
Throwing any EWT aside, batten down the hatches, try and get some shorts on and just get ready for some volatility – potentially like we’ve never seen before or haven’t seen in a VERY long time. That’s just where we are all folks.
Folks … pretty amazing chart above. This is NOT about me … it’s about BELIEVING is SEEEING. (Thanks Mr. Grant)
SEEING the inherent PERFECT geometry in it all … and just sitting down in front of a chart and letting your eyes put together what they put together for your BRAIN every second they are open … guess, after time, the PATTERN RECOGNITION is nothing more than what you are doing – right now – reading this blog (if you’ve gone this far 🙂 )
Cheers – Bart
TAN – April 11, 2024
Posted on April 11, 2024 2 Comments
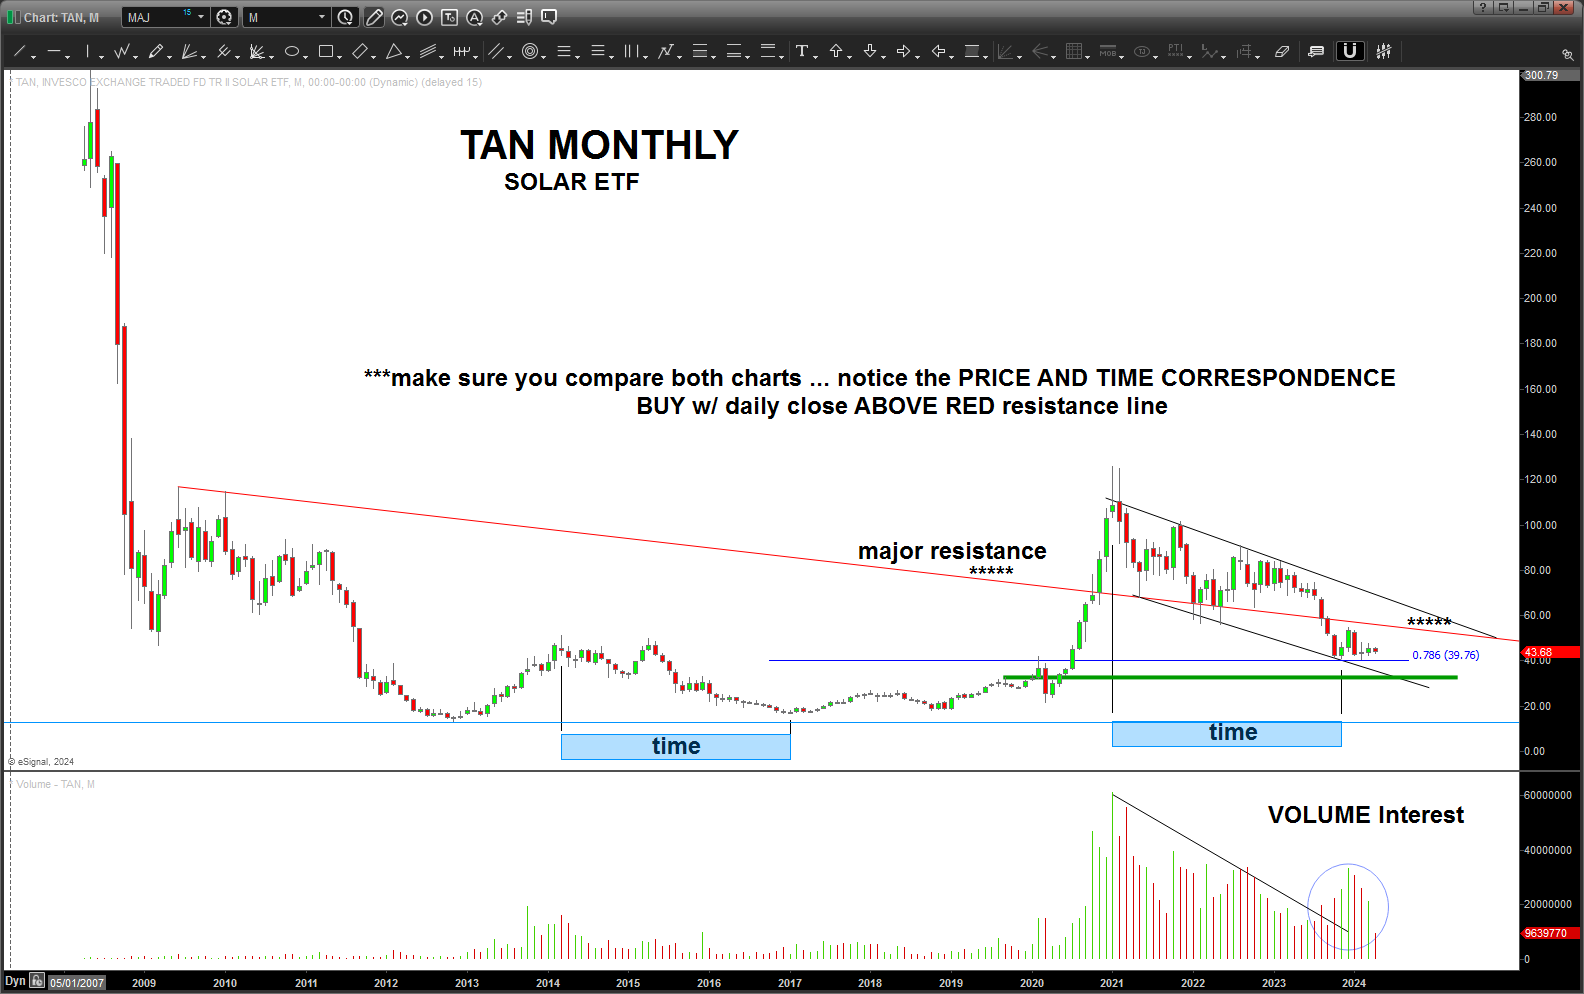
Looks like we have a VERY nice set up getting ready to run:
TAN – Invesco SOLAR ETF. There are multiple Solar plays out there. I’m lazy, so I went to the ETF that covers the ecosystem.
We have a lot of positive indications that this one is worth the risk. This investment will be – more than likely – 3 years+ and I’ve been following it ever since David Keller, CMT (who I think is one of THE best out there) started talking about it years ago. Come to think about it, it might have been in the 2010-2015 area.
Anyway, here’s the way I see it –
*EWT is showing us STILL in wave 3 and that means we have some ways to go higher … I “like” the count and it doesn’t break any rules BUT please remember my golf game and EWT – we have some parenthesis present so I could very easily be subconsciously “forcing” myself into this count. Oh well, but you know me – full disclosure here.
*Volume is showing and interesting “breakout” – what I mean is volume steadily declined as the price declined greater than 60%. Once we “bottomed” notice how volume “broke out” and broke thru the resistance and is getting bigger as we are bottoming?
*This is the biggest one for me – the illusory TIME component. In this case we have the SAME TIME COMPONENT PRESENT for the two ‘major’ corrections thru thus far.
* Take the above about TIME and note what the price is sitting on – exactly – the 786 from the all time low to the most recent high. Nice.
*In this long recommendation – the price will HAVE TO overcome the red resistance line – due to polarity. A conservative play would be to BUY only w/ a monthly or weekly close above the red line. There is still plenty of room to run.
The next chart shows the “count” and in a bullish scenario – this ETF is getting ready to RUN. A .68179 (musical note) projection (monthly), sitting on top of the .786 from all time low to most recent high, RSI support which is showing the classic “breakout” to new resistance high for a BULLISH trend and, most importantly on this chart is THE EXACT SAME PERCENTAGE PRICE CORRECTION as the last correction move.
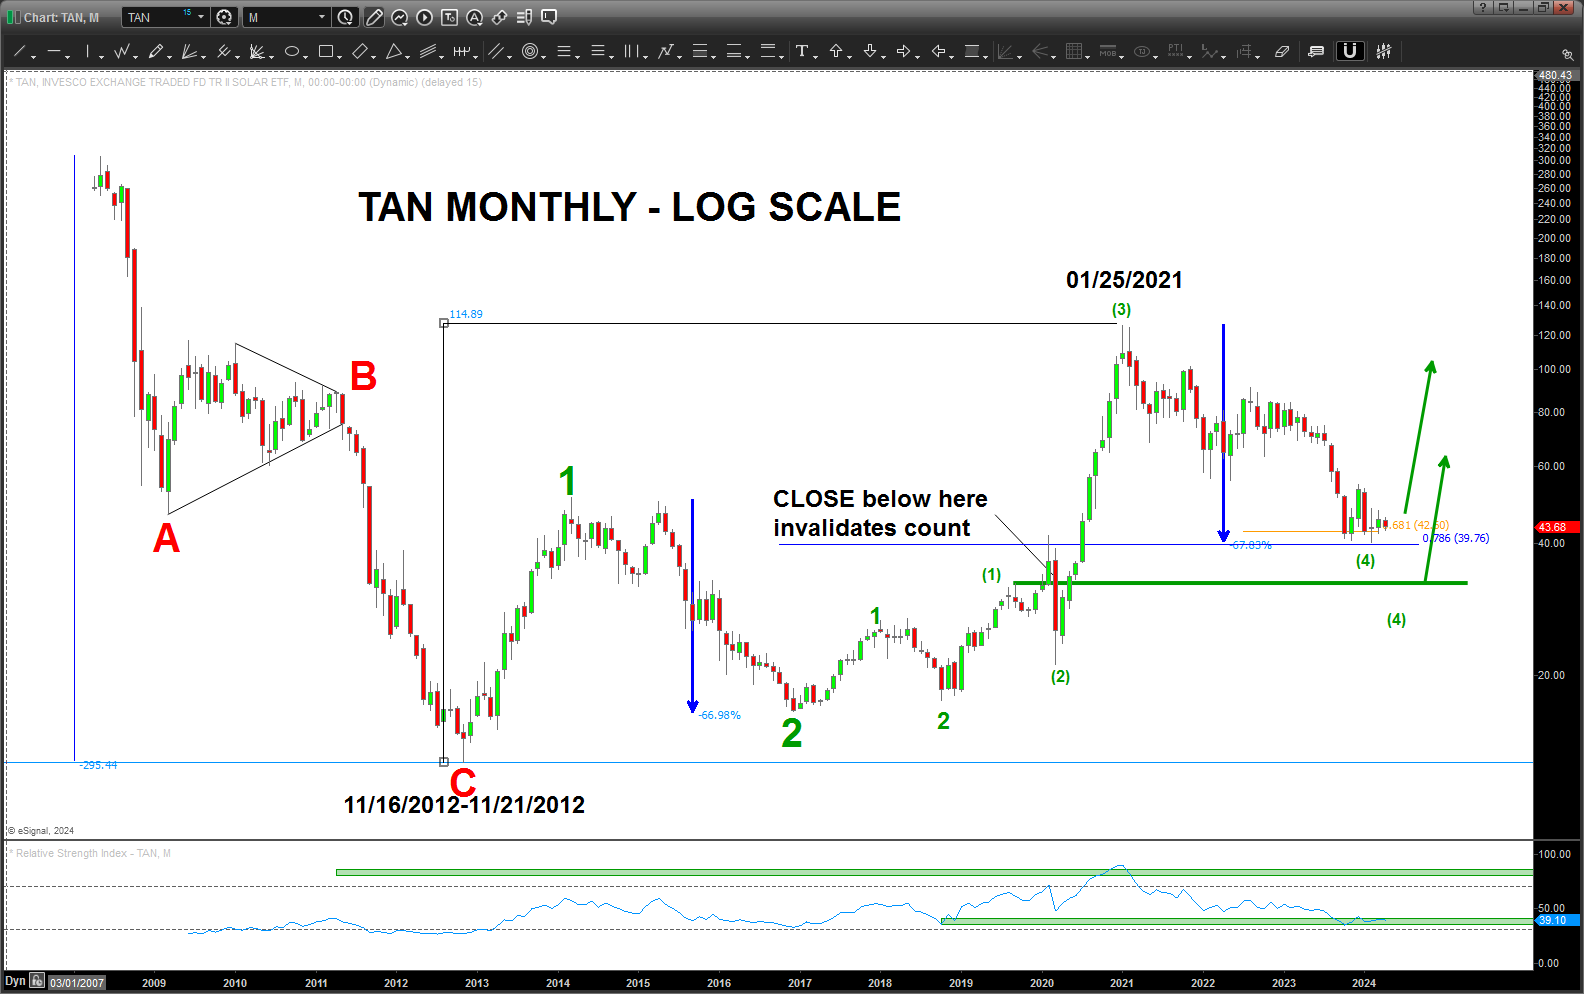
There we have it – PRICE equals TIME w/ other, important, but lesser confirmations from traditional technical analysis tools.
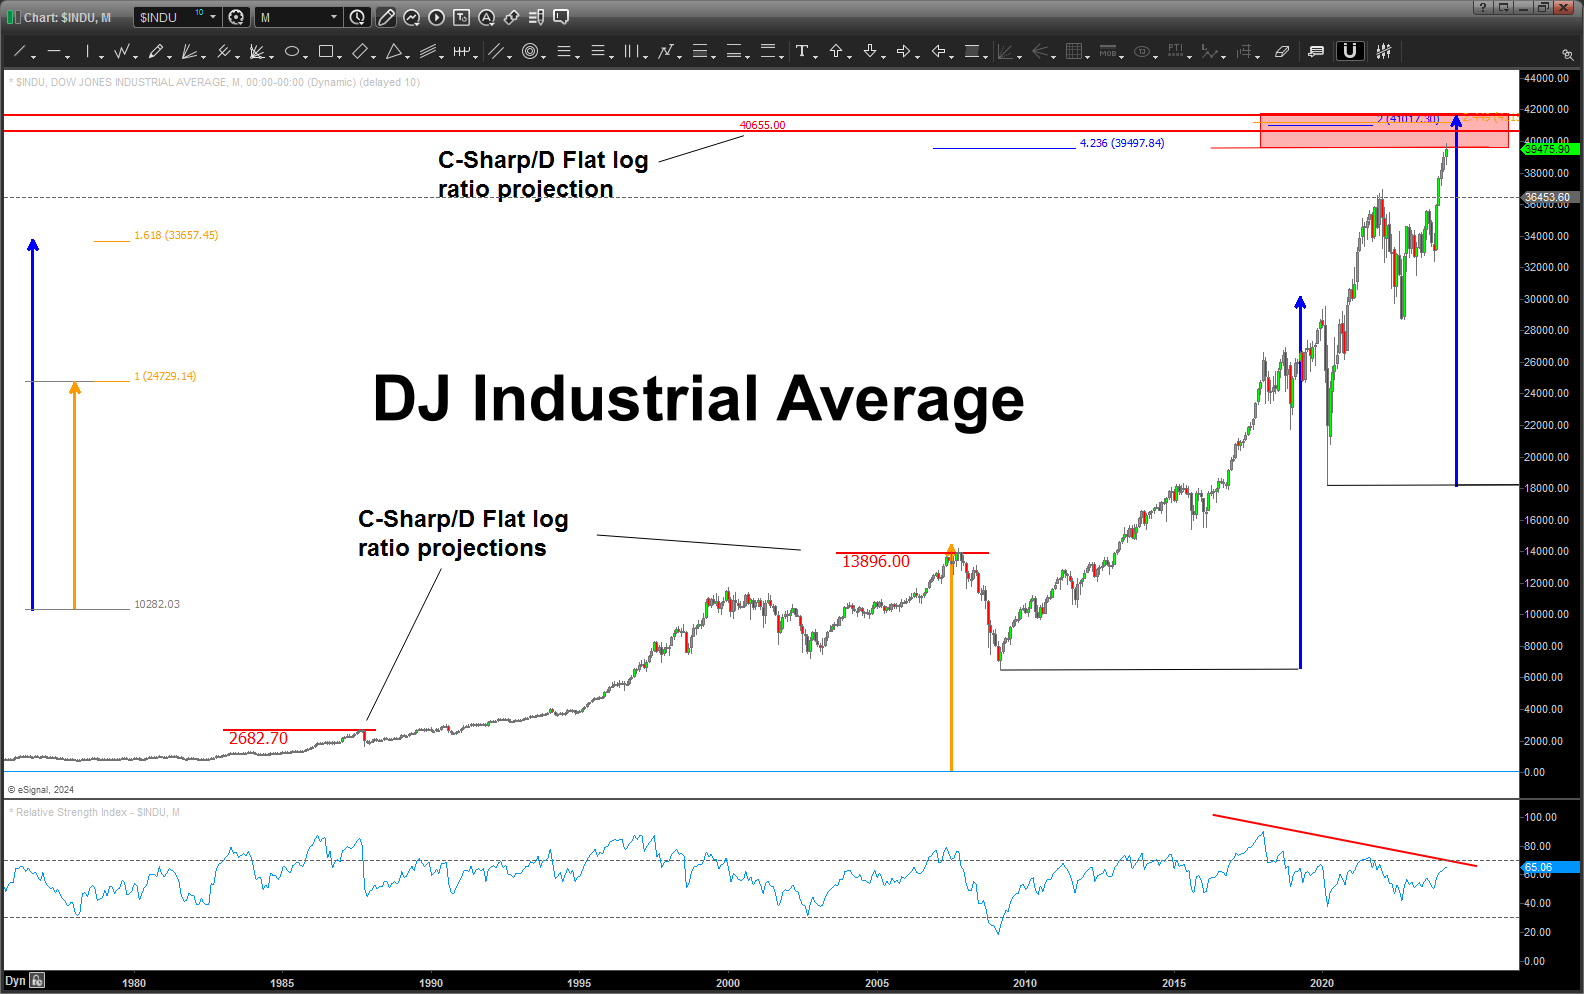
DJIA since 1897
Posted on April 10, 2024 Leave a Comment
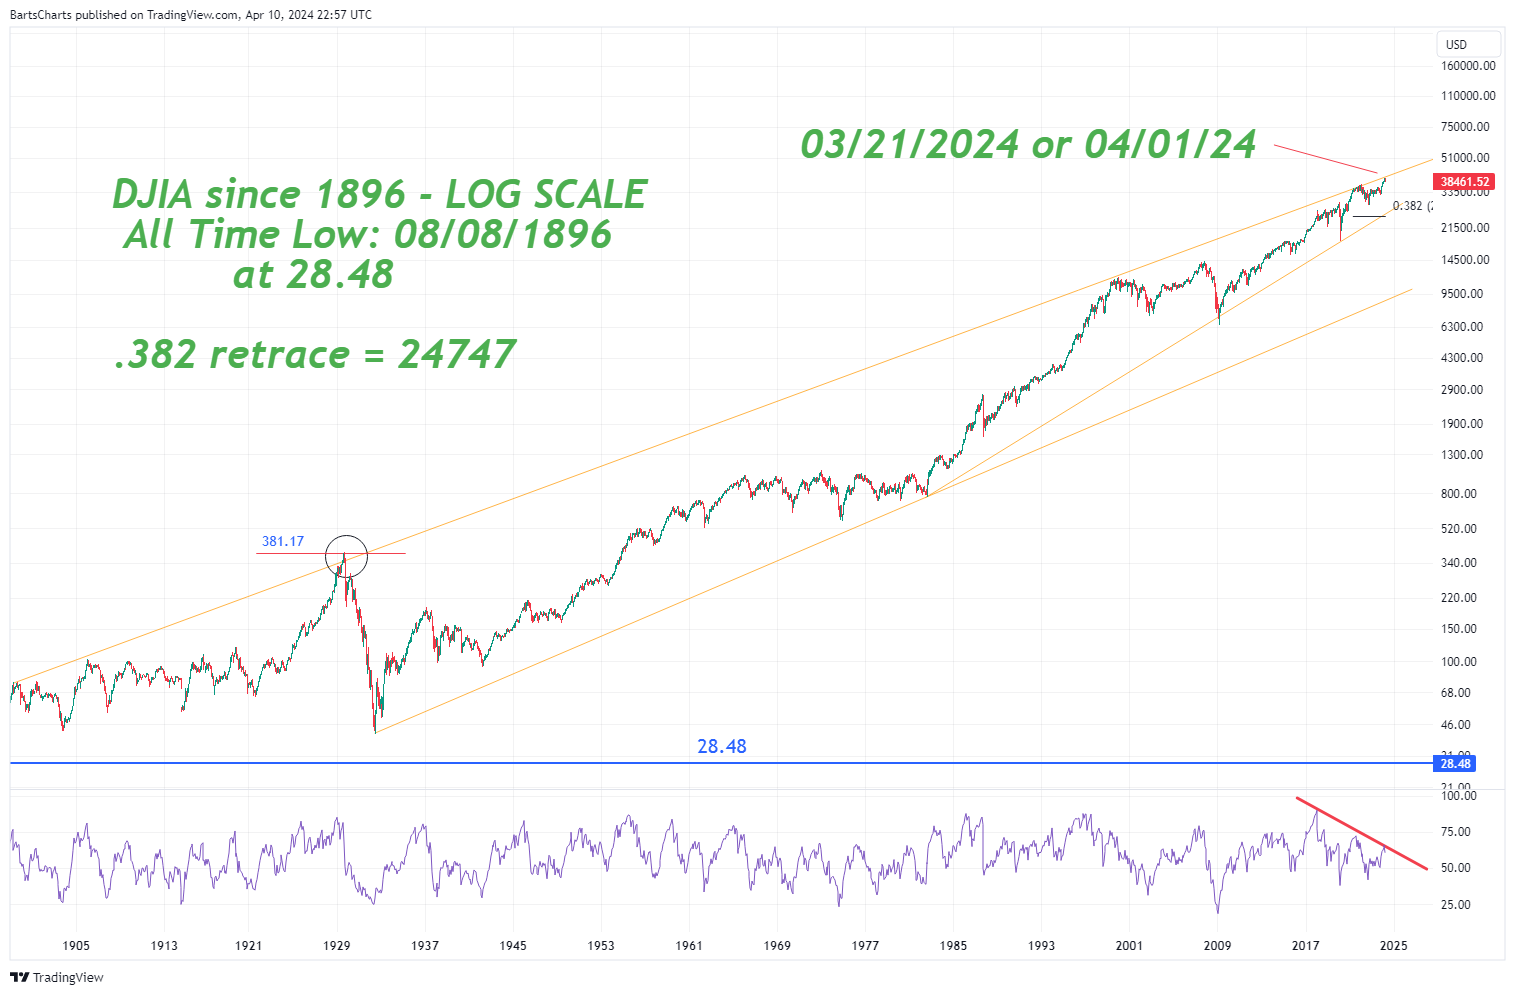
Appears we have a pretty important trend line w/ big bearish divergence on the Monthly.
Note, cropped the wick in 1929 to hit the highs in 2000 and 2022.
The Markets – March 24, 2024
Posted on March 24, 2024 1 Comment
The NYSE Index HIT the square out at 18, 059 and reacted very very minimally (which surprised me to be honest) and is walking up the wall of worry. Today that level is at 18,070.
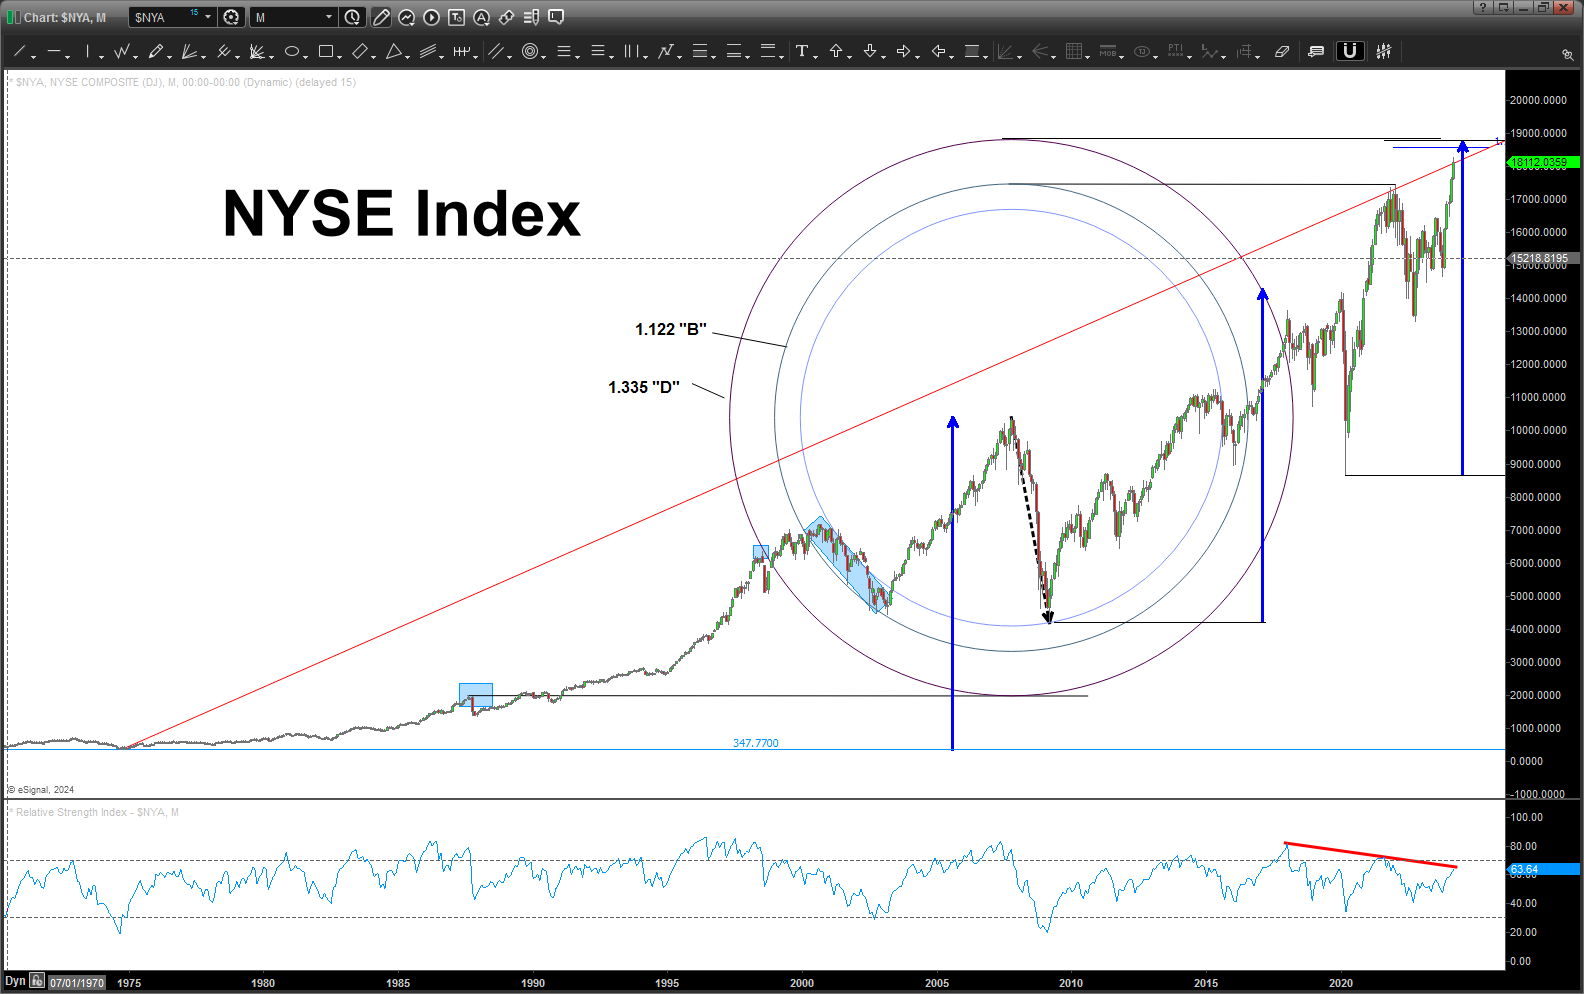
As you can see above, we have not CLOSED ABOVE the 1:1 trend line from the all time low and I suspect that it will continue to provide MAJOR resistance BUT as it happened last week, it can keep squaring itself out until it reaches the ‘final’ square out. As long as we do not get a close above (monthly) the 1:1 trend line this market remains vulnerable (very ?) to a pullback that could last, at a minimum, a couple months.
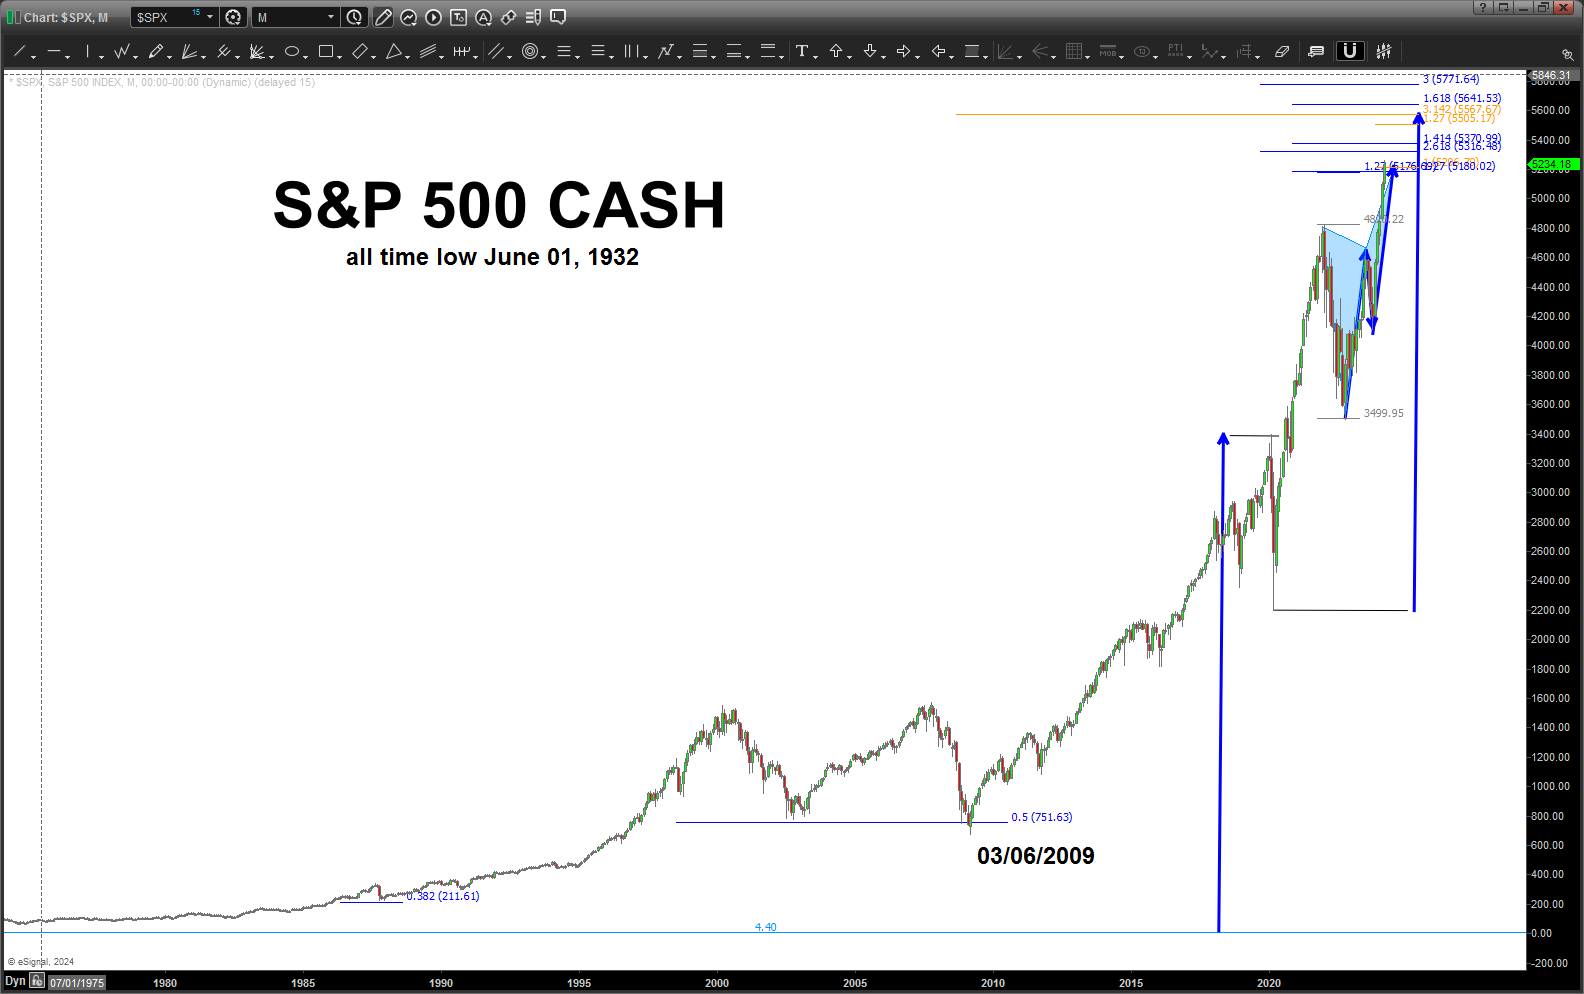
Here’s the DJIA approaching or hit an area of MAJOR resistance.
Same story w/ the S&P 500 and the NASDAQ:
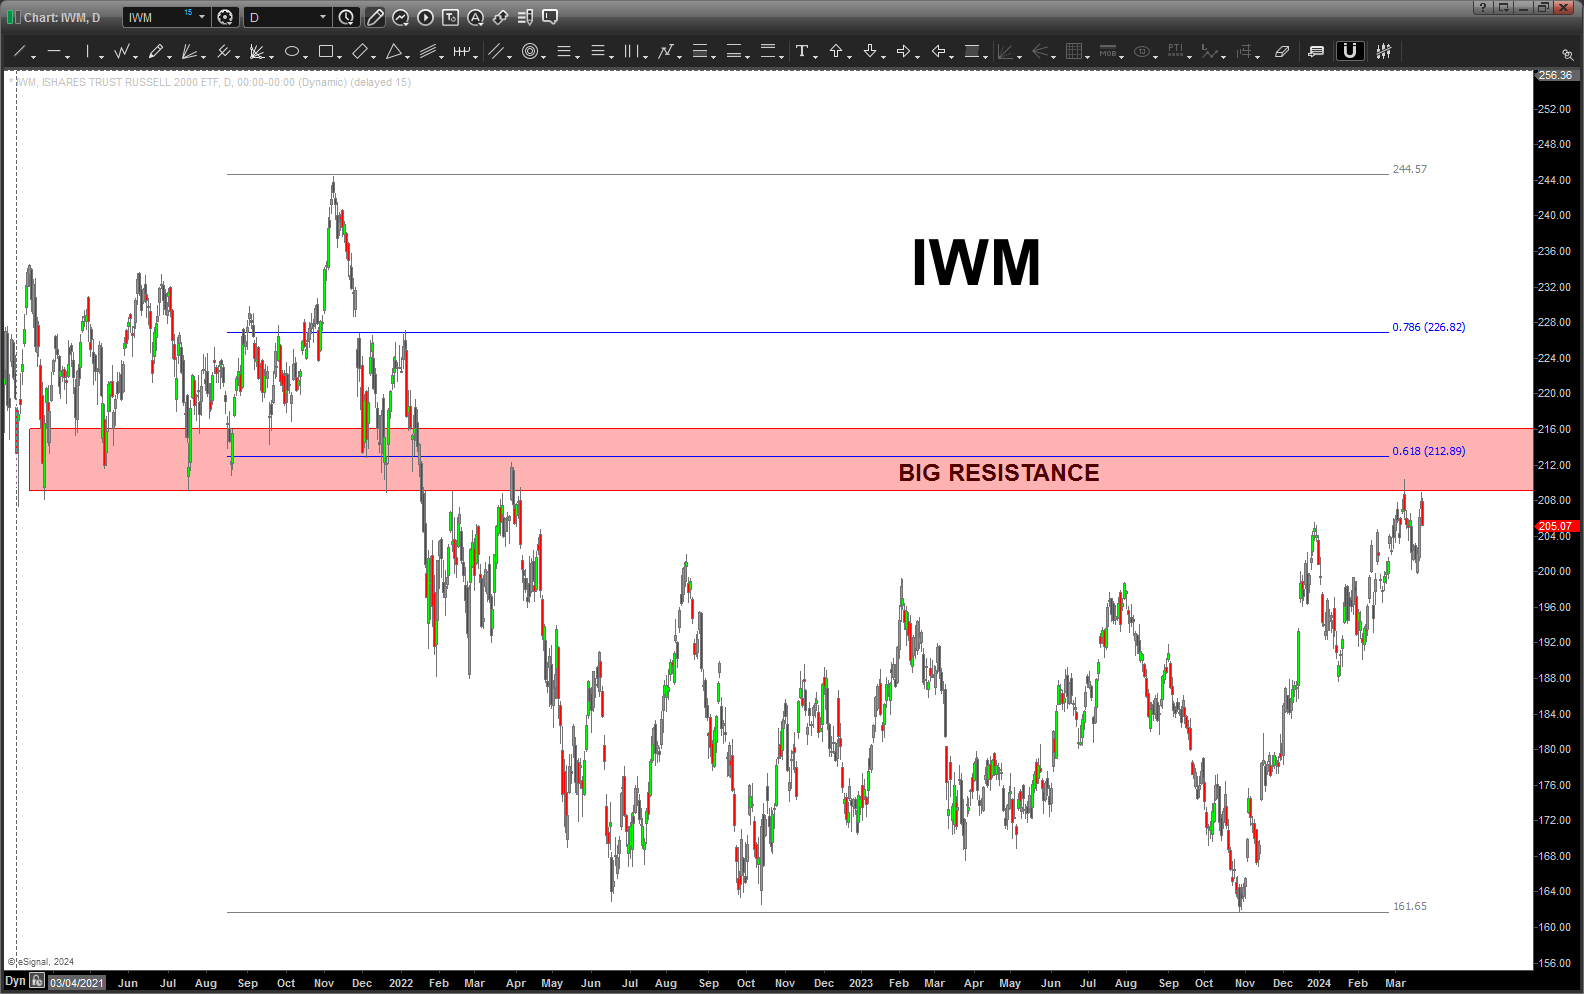
The Russell 2000 is VERY weak compared to the other indices:
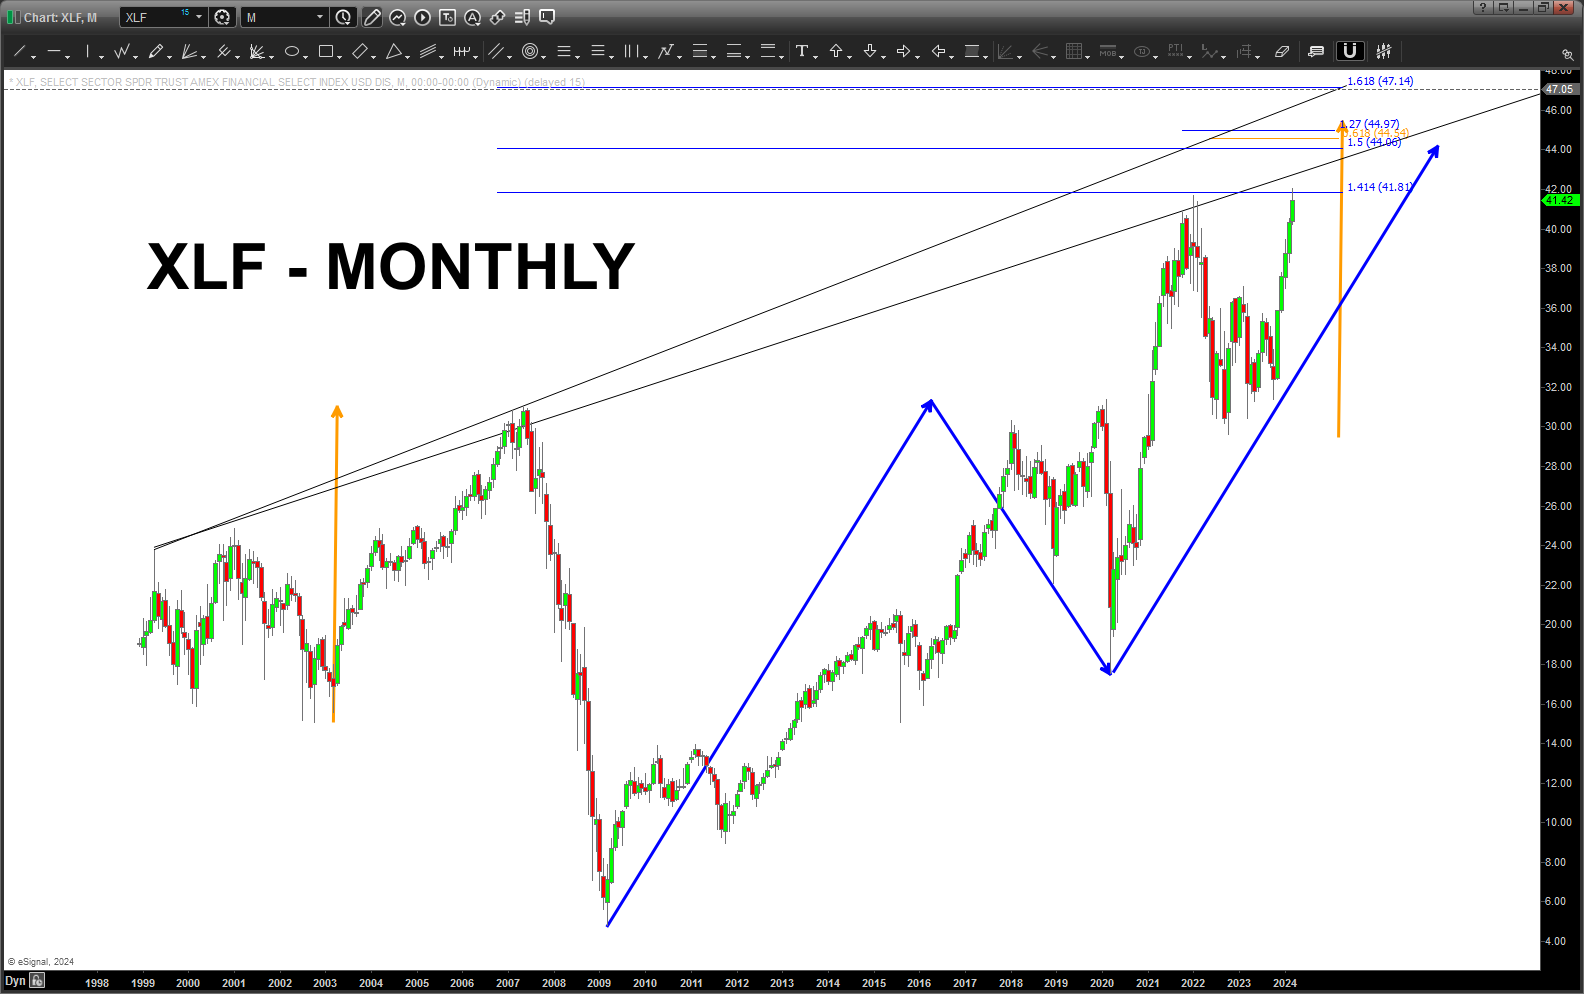
On prior posts we have focused on the Banks/Financials … the XLF has outperformed and made new highs … the overall market has followed. We are VERY close to a BIG ABCD completing on the XLF. If you remember the post on the Banks/Financials a few months ago, the XLF pattern failed and the market kept going higher.
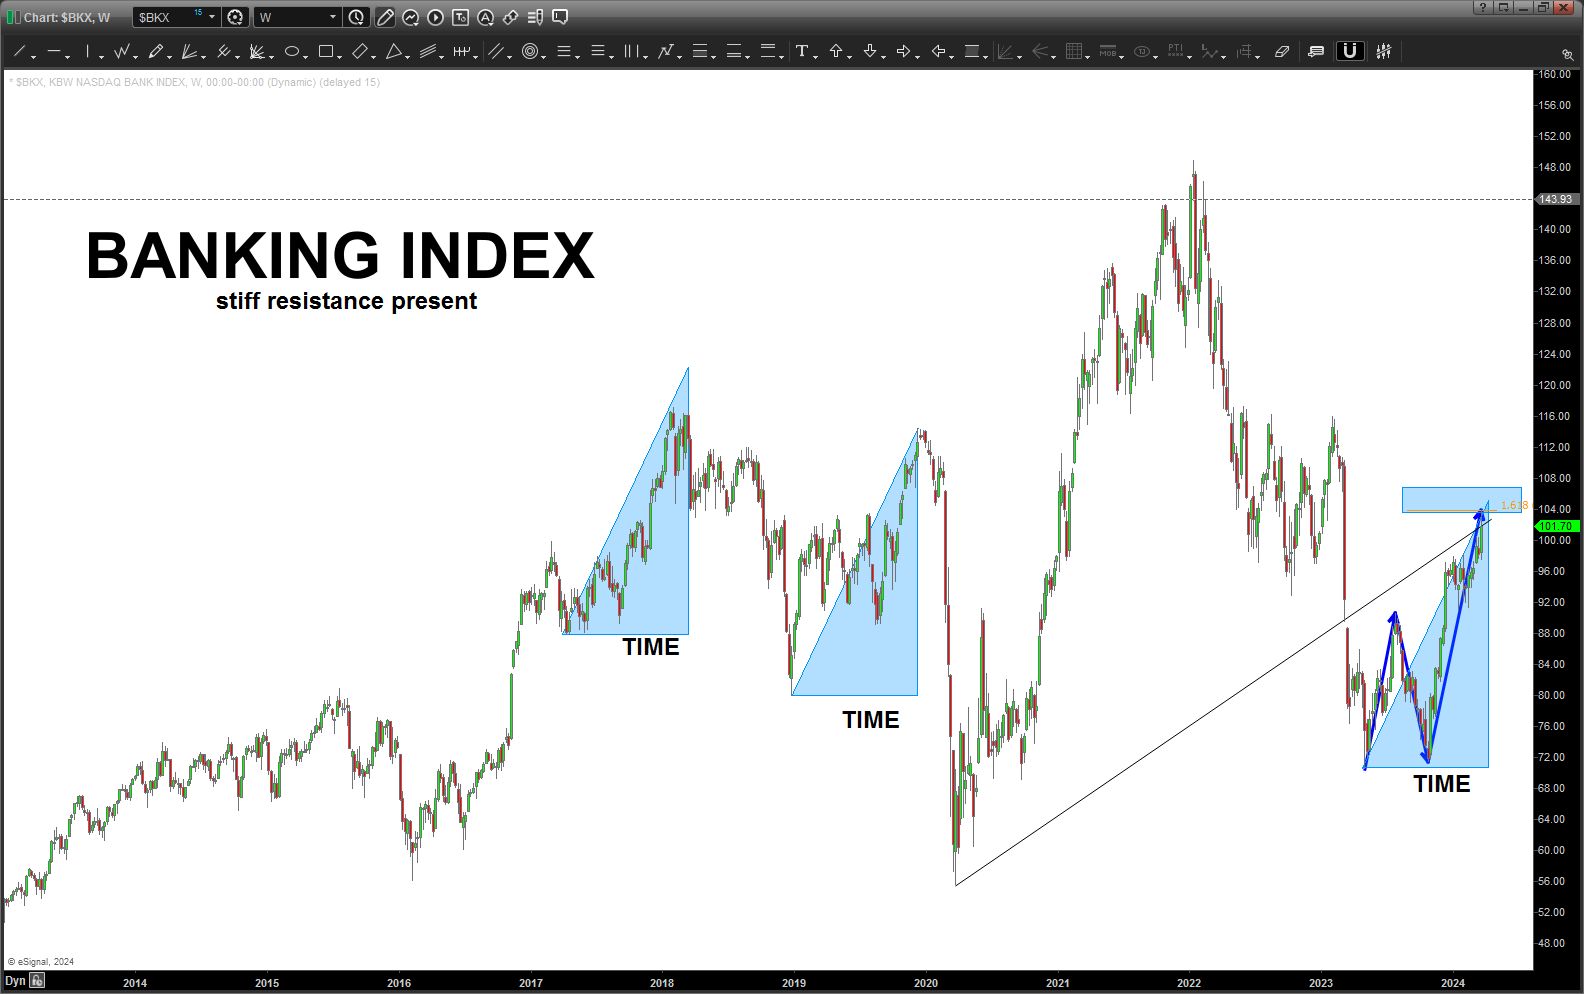
If we take a look at the Banking index (NASDAQ) you will see it has been lagging badly compared to the overall general market. REAL leadership in the Banks/Financials would have this MUCH higher.
Sure looks like a zig-zag correction and 1.68AB=CD was hit Friday.
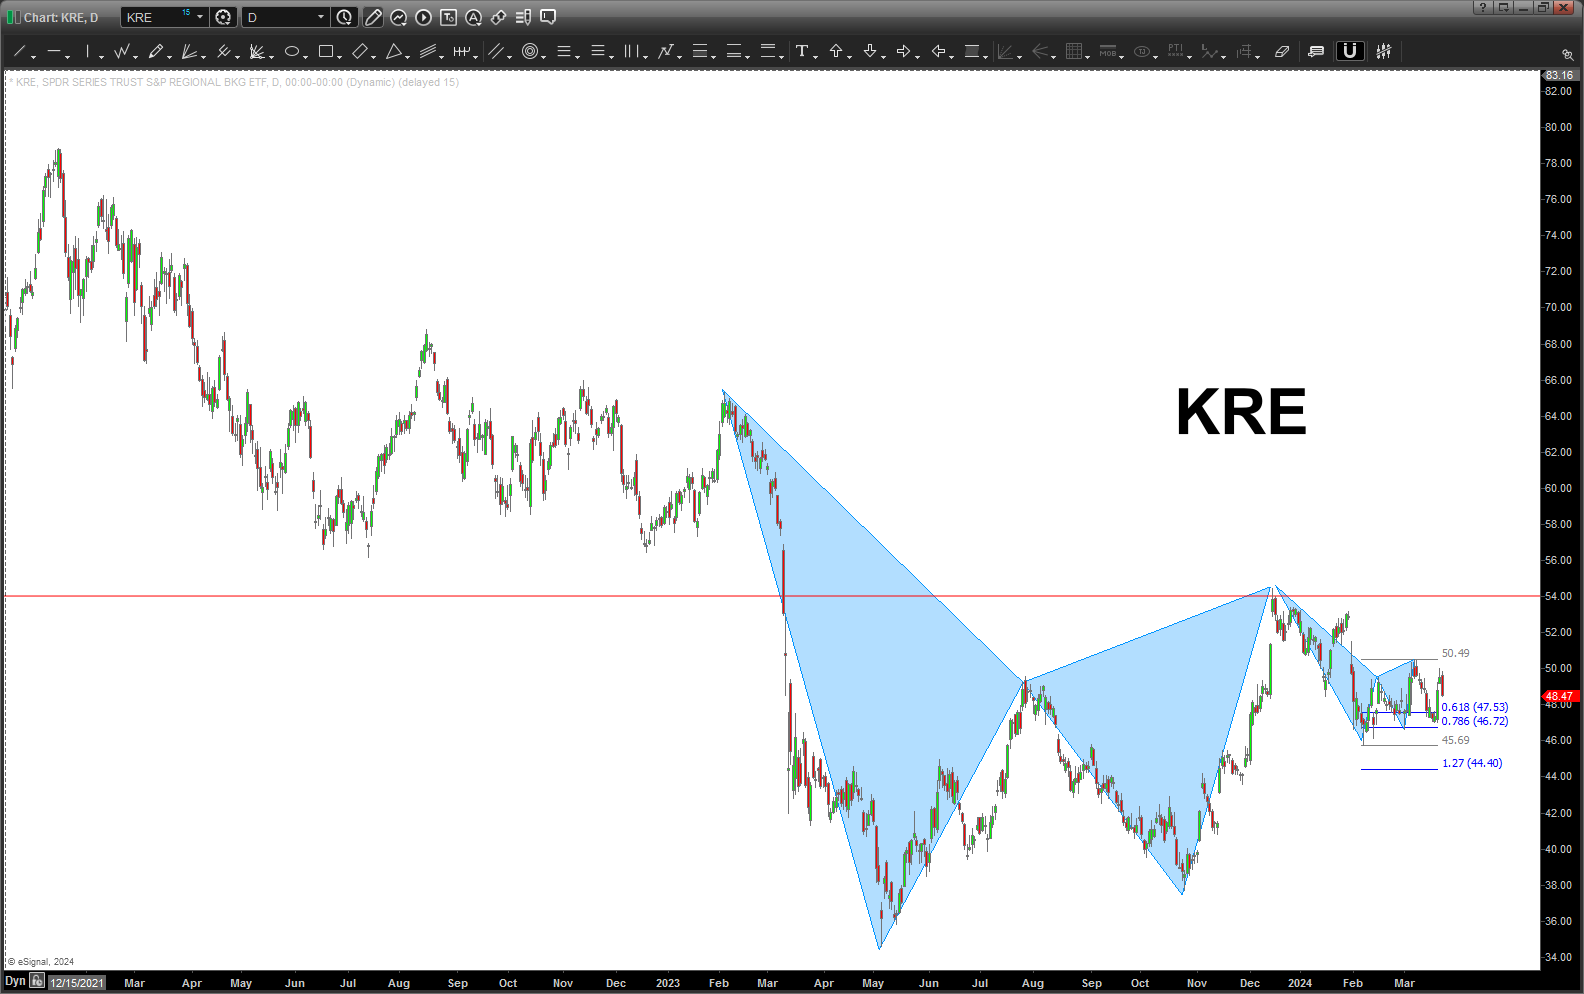
Where are you Mr. KRE?
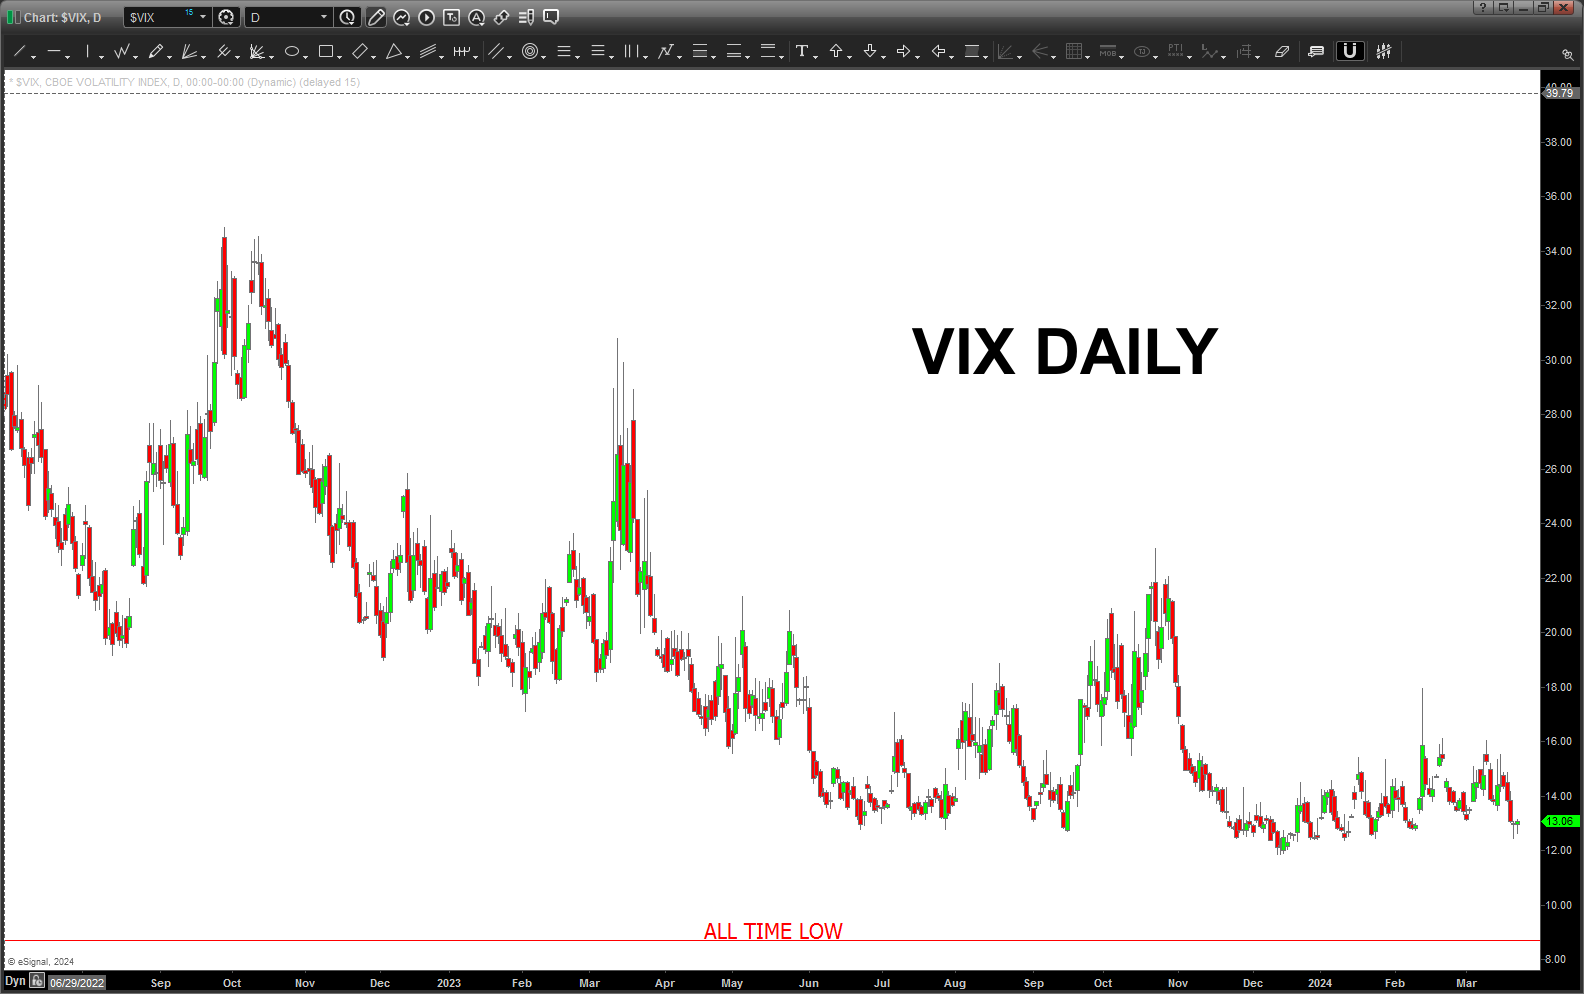
The VIX is/has been flirting w/ going single digits but, it’s been LOW for a very very long time. There is NO FEAR in the market right now.
The sentiment/ fear-greed/bullishness is at MAX levels … NOBODY is bearish.
I was on my good friend Larry’s show and we were discussing he unrelenting advance present. He mentioned, in some weekend mail traffic that the last week on WED-THS there was the HUGE rallly of over 1o0 handles in the S&P500 while awaiting the FED’s decision/action. On both of those days the cumlative net open interest dropped.
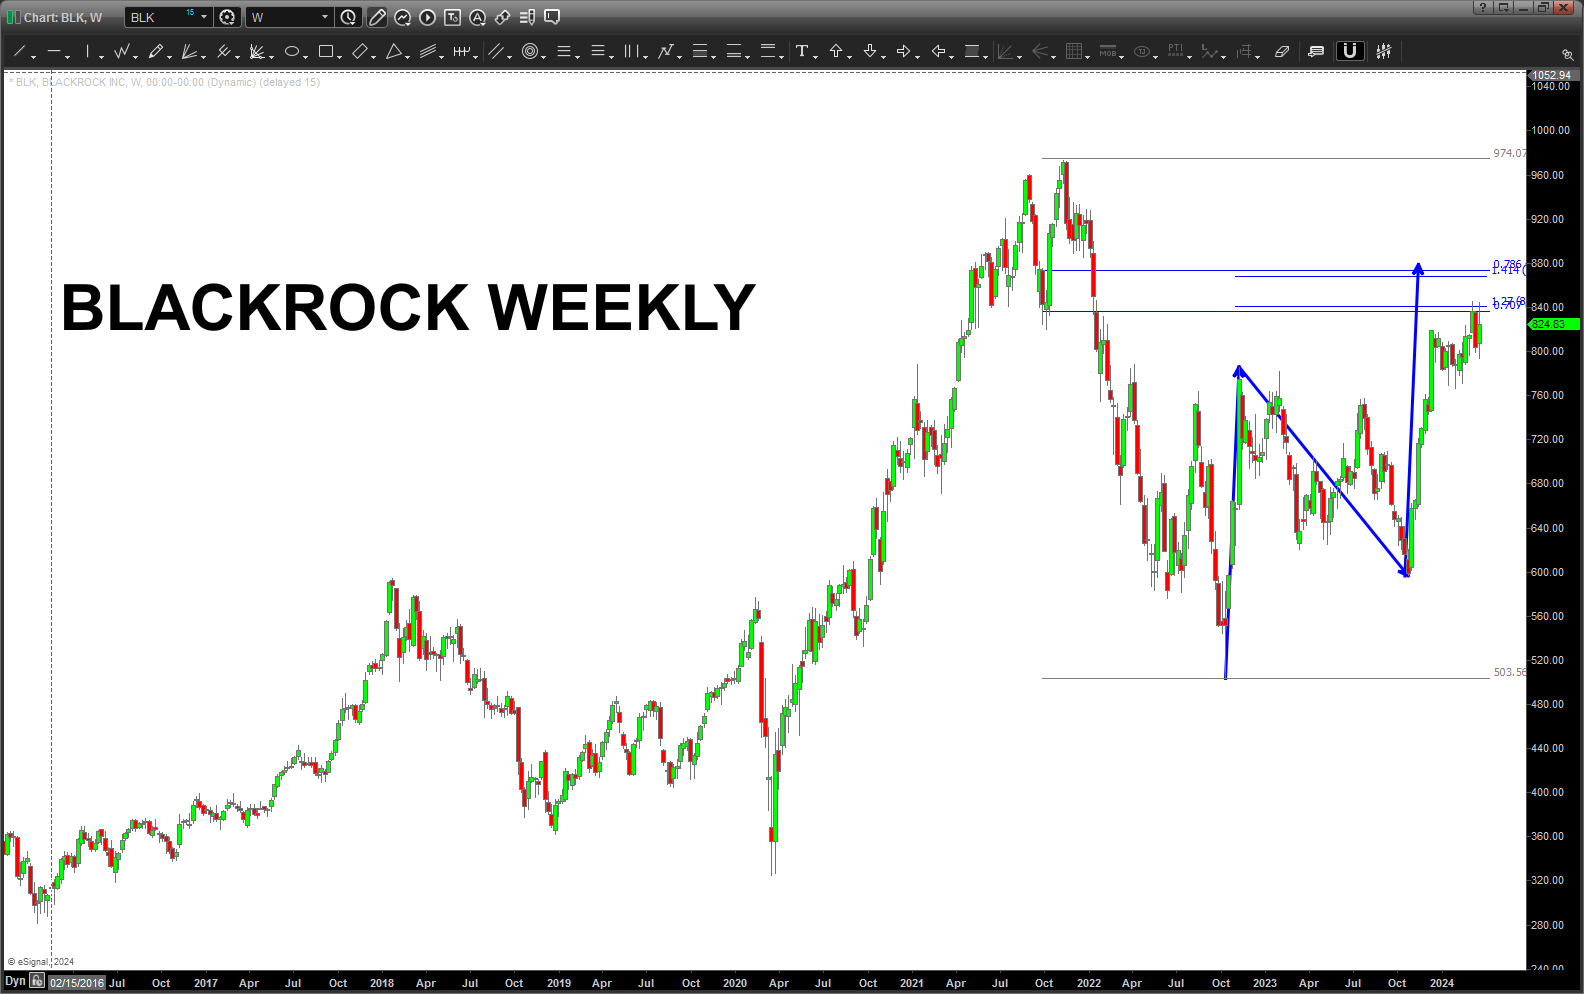
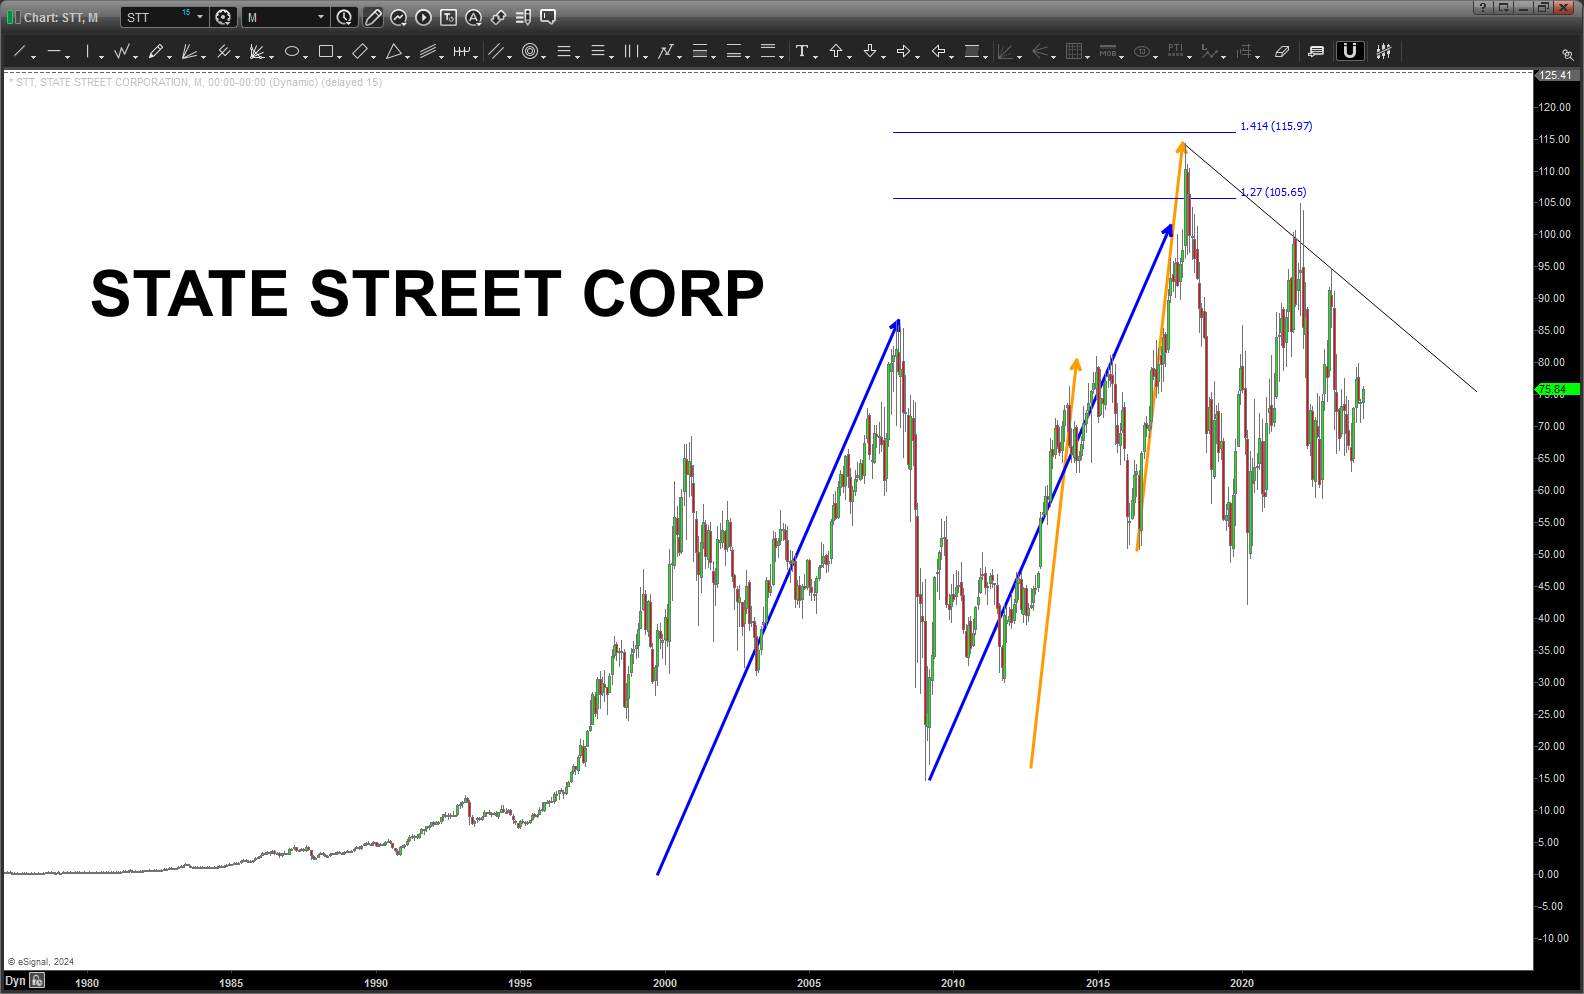
We need to also pay attention to the companies that are, basically, controlling the market as custodians. Vanguard, State Street and Blackrock control roughly 70% of all trading going on … One would think that these would be at new highs …like everyone else?
Larry showed this over the weekend:
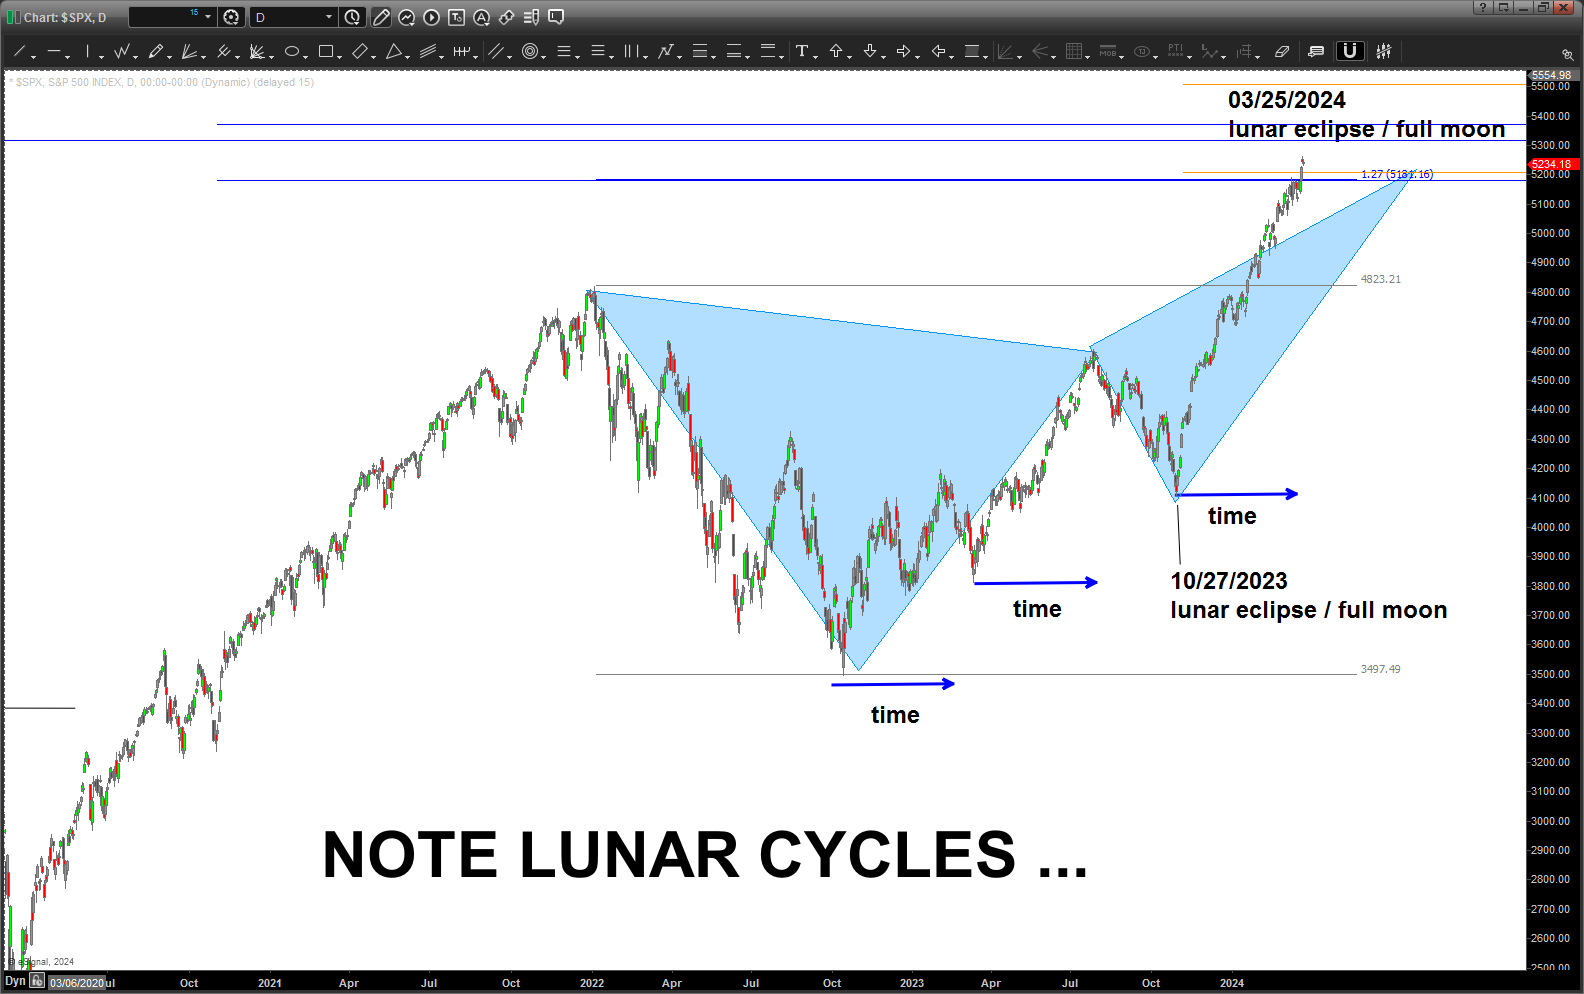
when we look at the shorter term cycles … we can see this one going on w/ the S&P500. Notice the harmony w/ the lunar eclipse and the moons synodic cycle:
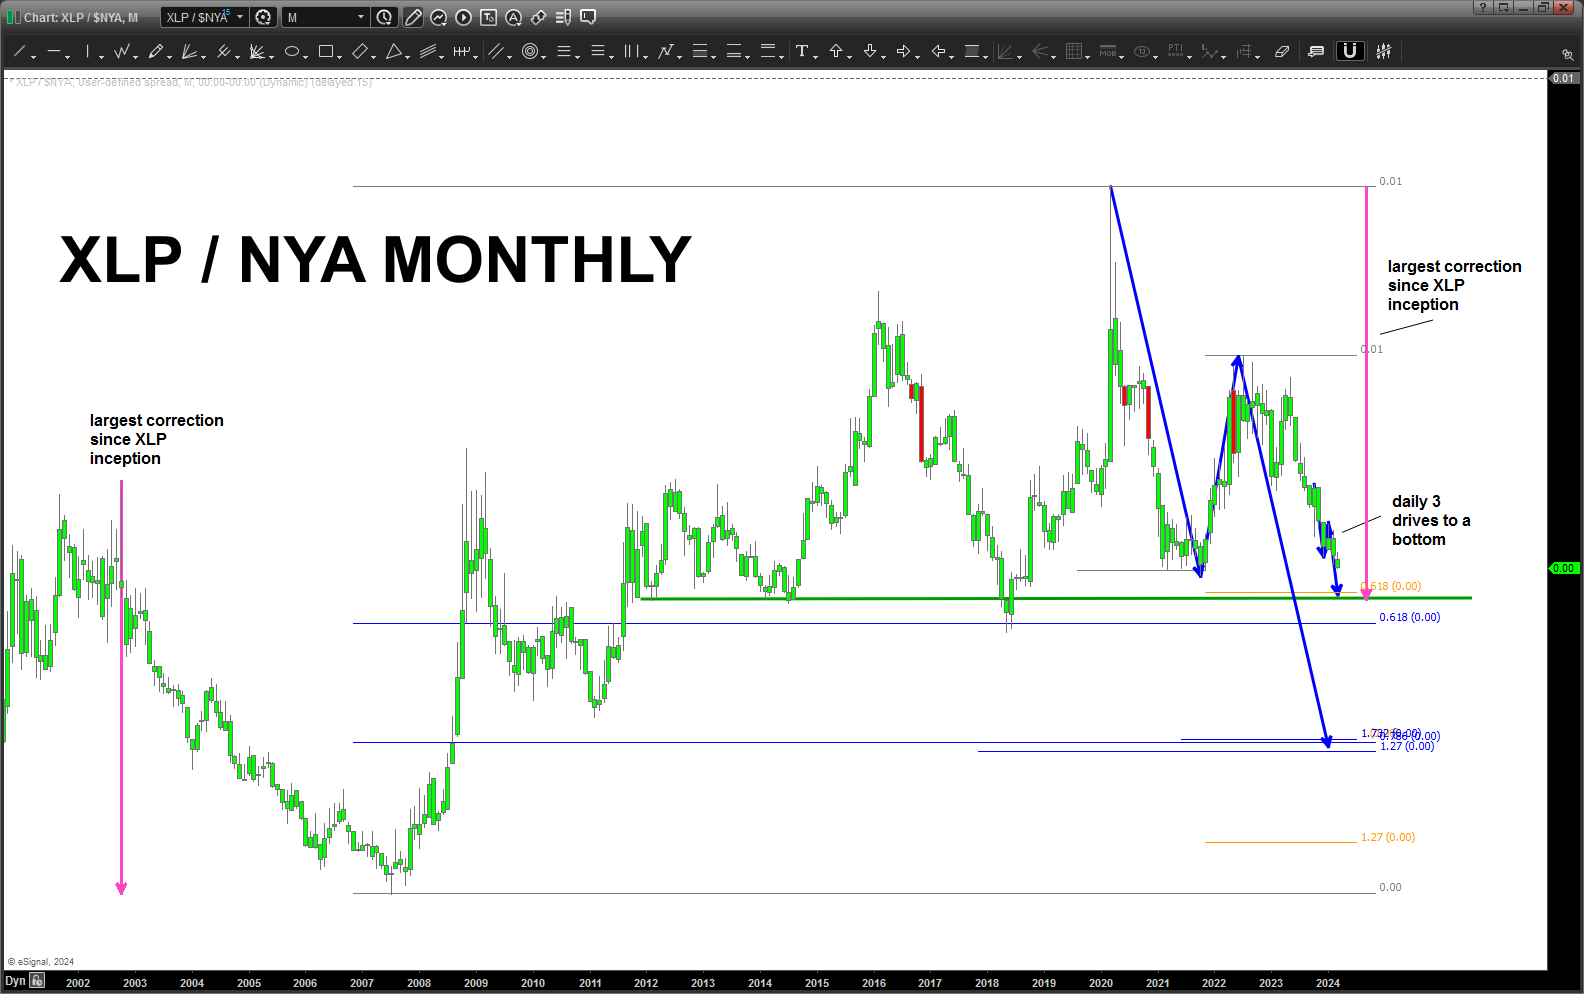
A non-correlated, but a goody, at looking for both bullish and bearish inflections in the market – ratio analysis of XLP/NYA is VERY close to MAJOR support which, in the past, has been “bearish” for stocks. Again, it’s a “institutional gauge” of risk/risk off.
When it’s risky – the smart guys like Tim but toilet paper …the XLP does WORSE (from a relative strength standpoint) than the overall market and vice versa.
The target appearing on the XLP/NYA is the LARGEST MEASURED MOVE correction in the ratio since the inception of the XLP. PAY ATTENTION TO THIS LEVEL and the .618 retracement (from the all time low) a little lower.
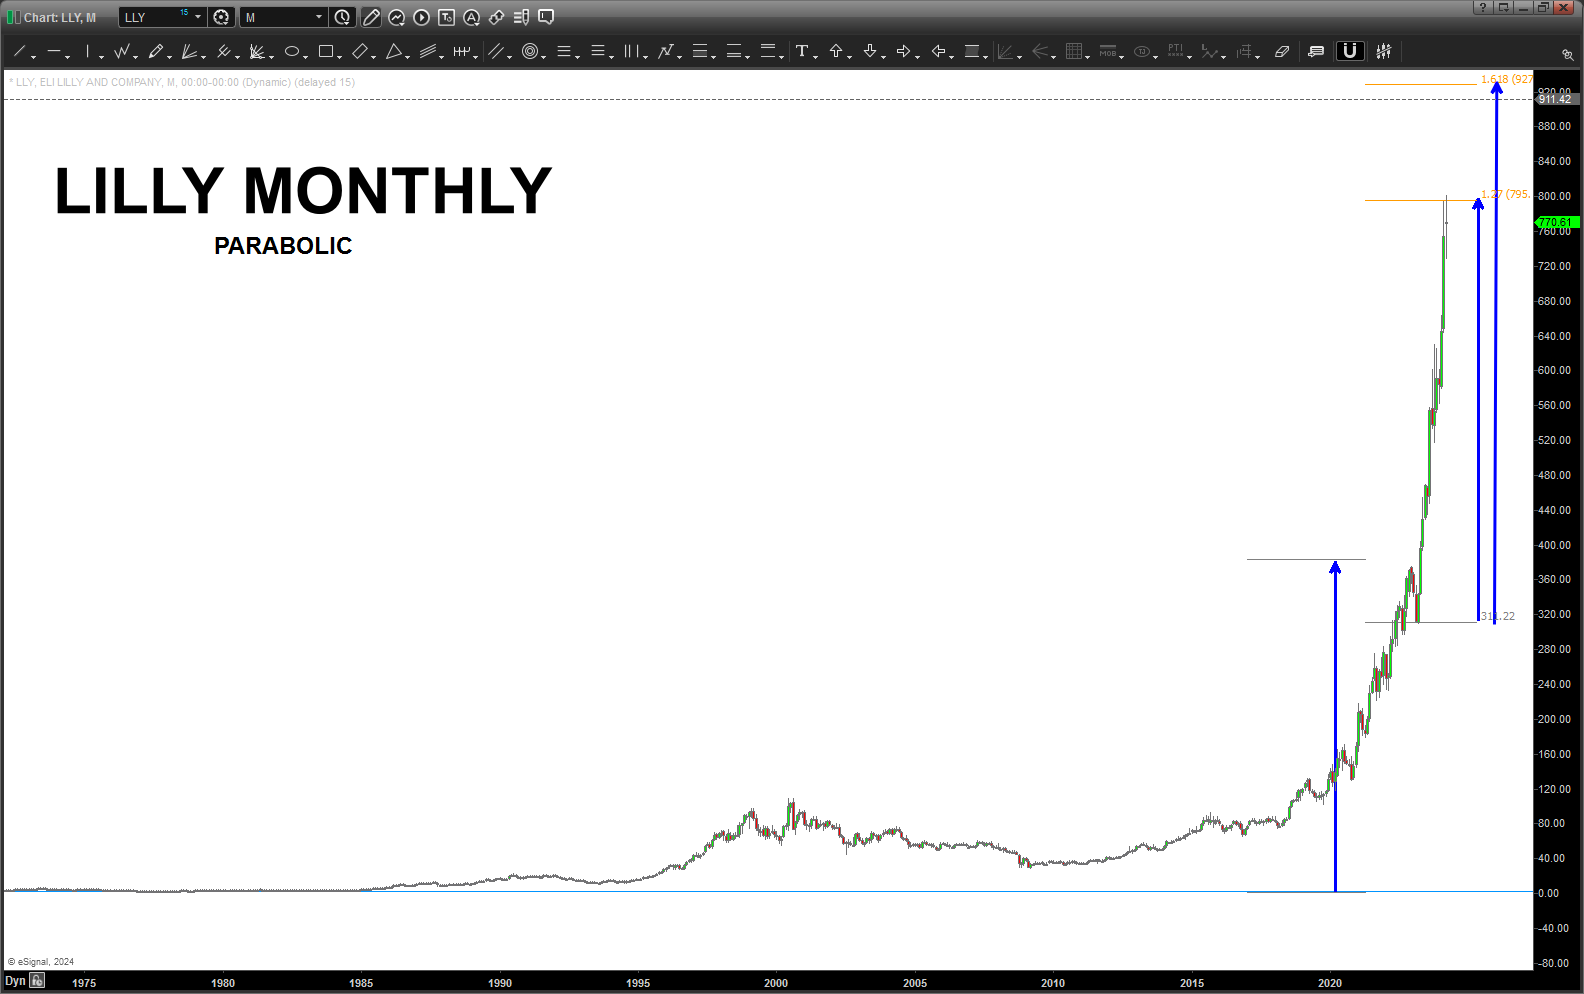
There are MANY stocks that are manically parabolic … stocks like LLY will crumble and fall like a stone. As demonstrated before, the parabolic moves, from a pure subconscious level, have to balance and that massive move up will be followed by a big correction. It happens, every time …
NVDA will do the same … yes, I believe NVDA is going higher BUT I think we need a good ole’ corrective move to cool everything down.
Here’s LLY parabolic:
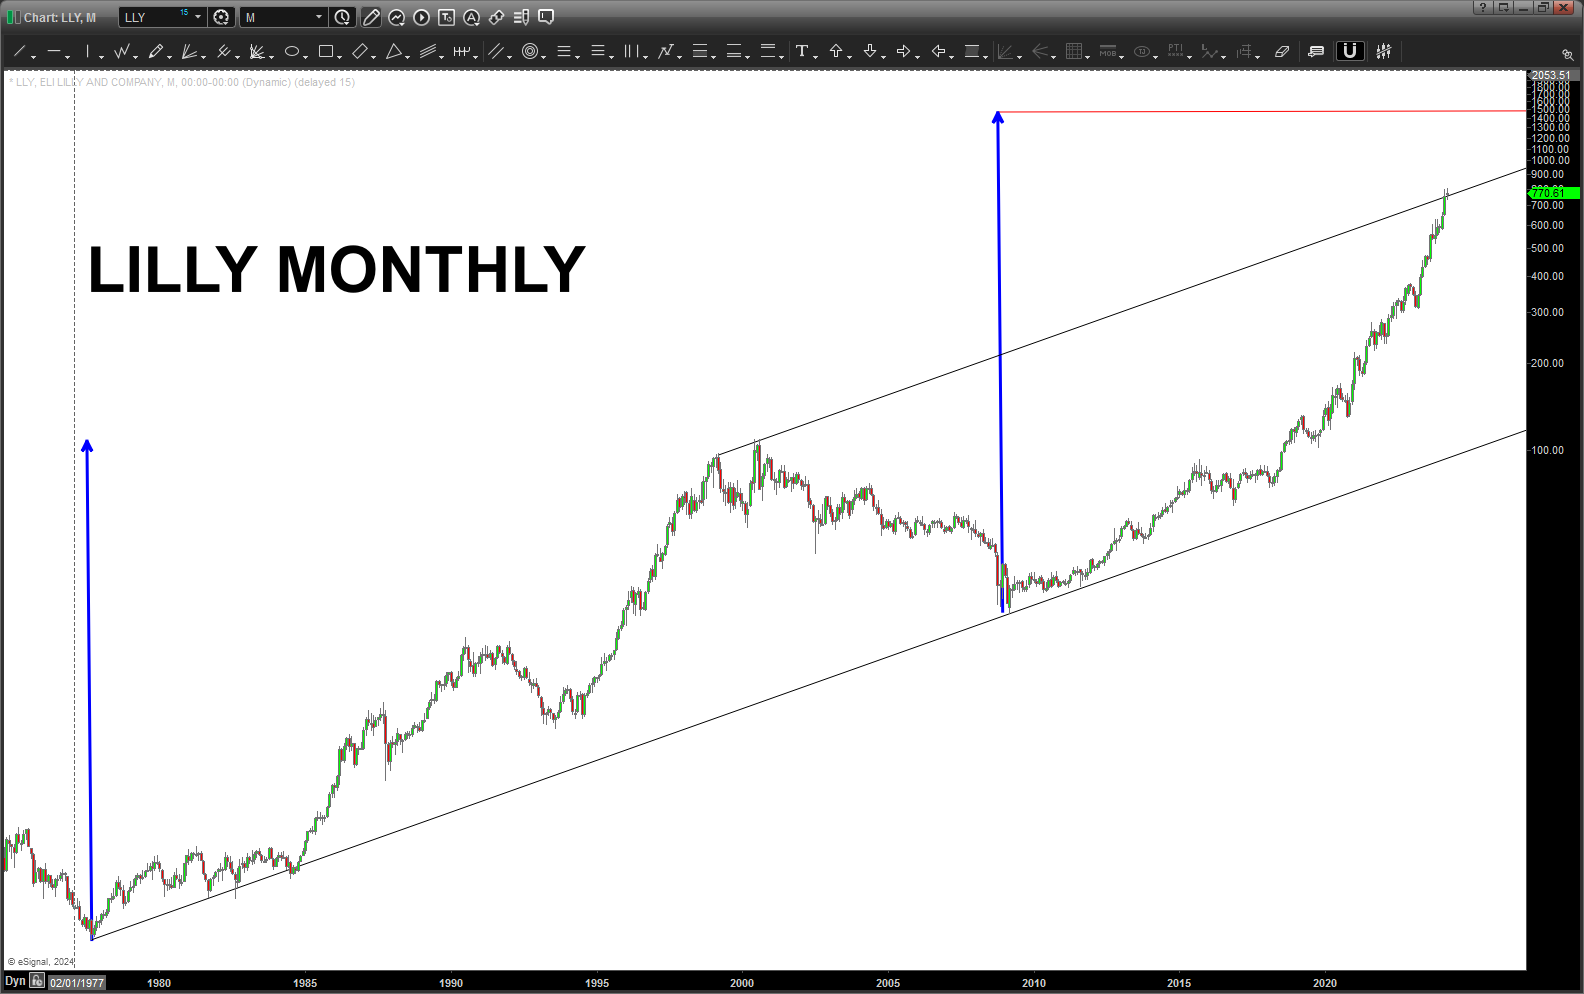
Here is LLY in MONTHLY LOG scale .. bumping right into the upper channel:
The market is overextended. Large, monthly targets are being hit.
If a perennial bull – think of taking profit or have some sort of “loss” stop in mind. Some are calling for a MASSIVE TOP and others are saying this bull market continues for years.
I try, the best I can, to just look for patterns.
ACROSS THE BOARD SELL PATTERNS HAVE AND ARE APPEARING …
IF they work, THEN – at a minimum – expect a good 6-8 week “pullback” that must be bought. LET’S JUST WAIT FOR THE FIRST BUY PATTERN TO APPEAR AND LET IT RIP.
IF the fail, THEN – this market could explode higher … into a parabolic run up that will put the 2000’s to shame.
MANAGE THE RISK … that’s all we can do.
