Ratio Analysis – October 21, 2023

One of the best things I learned going thru the CMT process was the use of Ratio Analysis to look for relative strength.
If you’ve been following me you know I enjoy the ratio XLP (Staples) / NYA (NY Stock Exchange Index)
Here’s the theory:
In times of RISK ON (bullish) – the institutions rotate out of “safety” and into more riskier names. When the world gets crazy they need to go somewhere ..right? Go to toothpaste, toiler paper, soup, etc. STAPLES …
In times of RISK OFF (bearish) – the institutions rotate into “safety” and out of riskier names.
BULLISH – the ratio goes DOWN.
BEAIRSH – the ratio goes UP.
Now, in the midst of this continual bullish mania, where has this ratio gone? Nowhere … hmmmm.
Now, just 2.5-3% lower is a THE measured move that represents the biggest correction in the ratio since the inception of the XLP. We also have a .618 monthly price projection at that same level. This SHOULD act as support which SHOULD cause stocks to pullback. Pullback could be BIG.
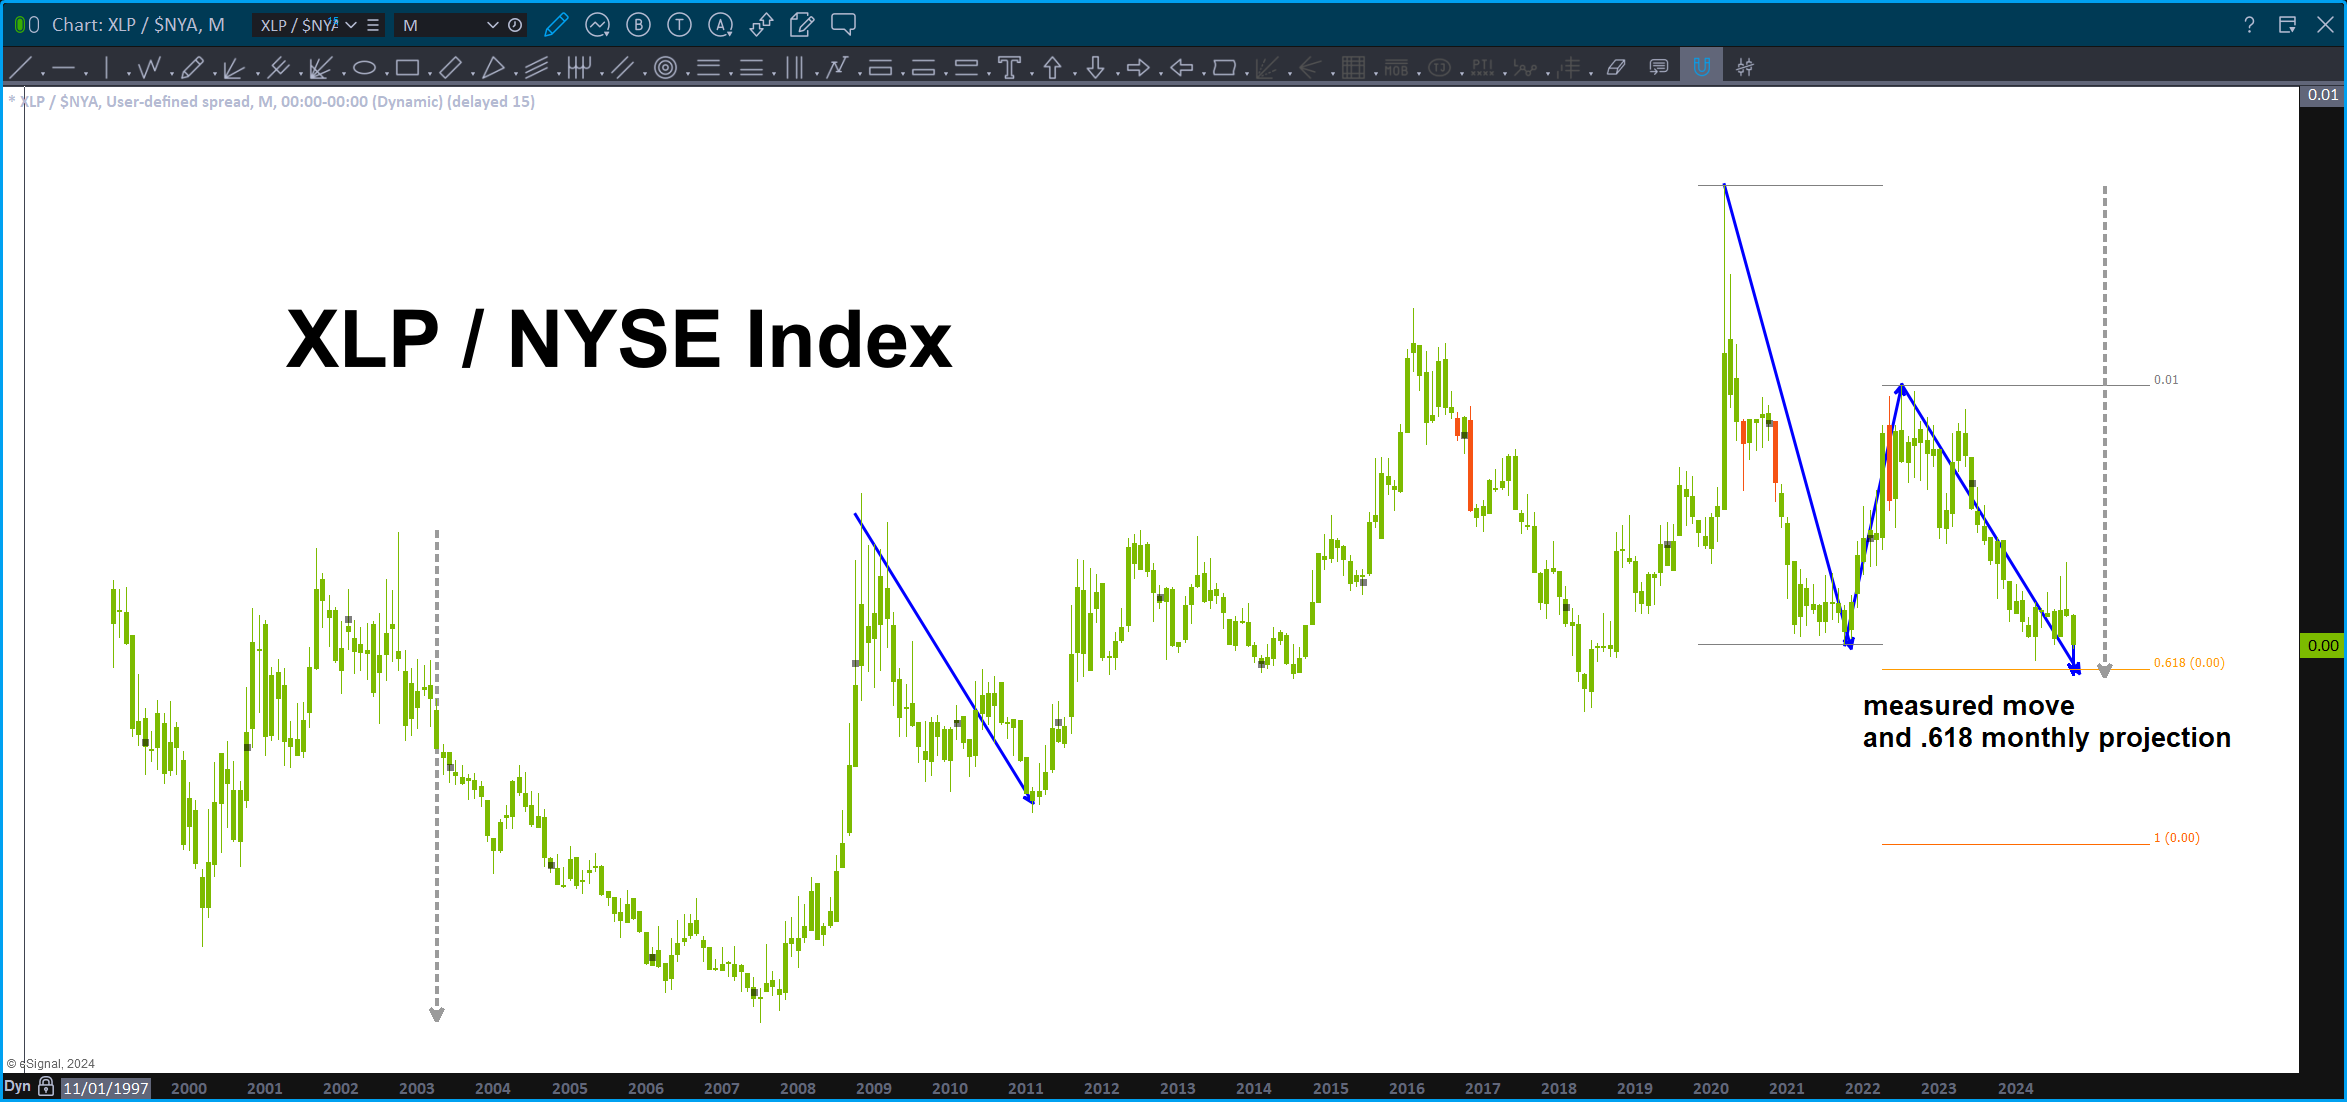
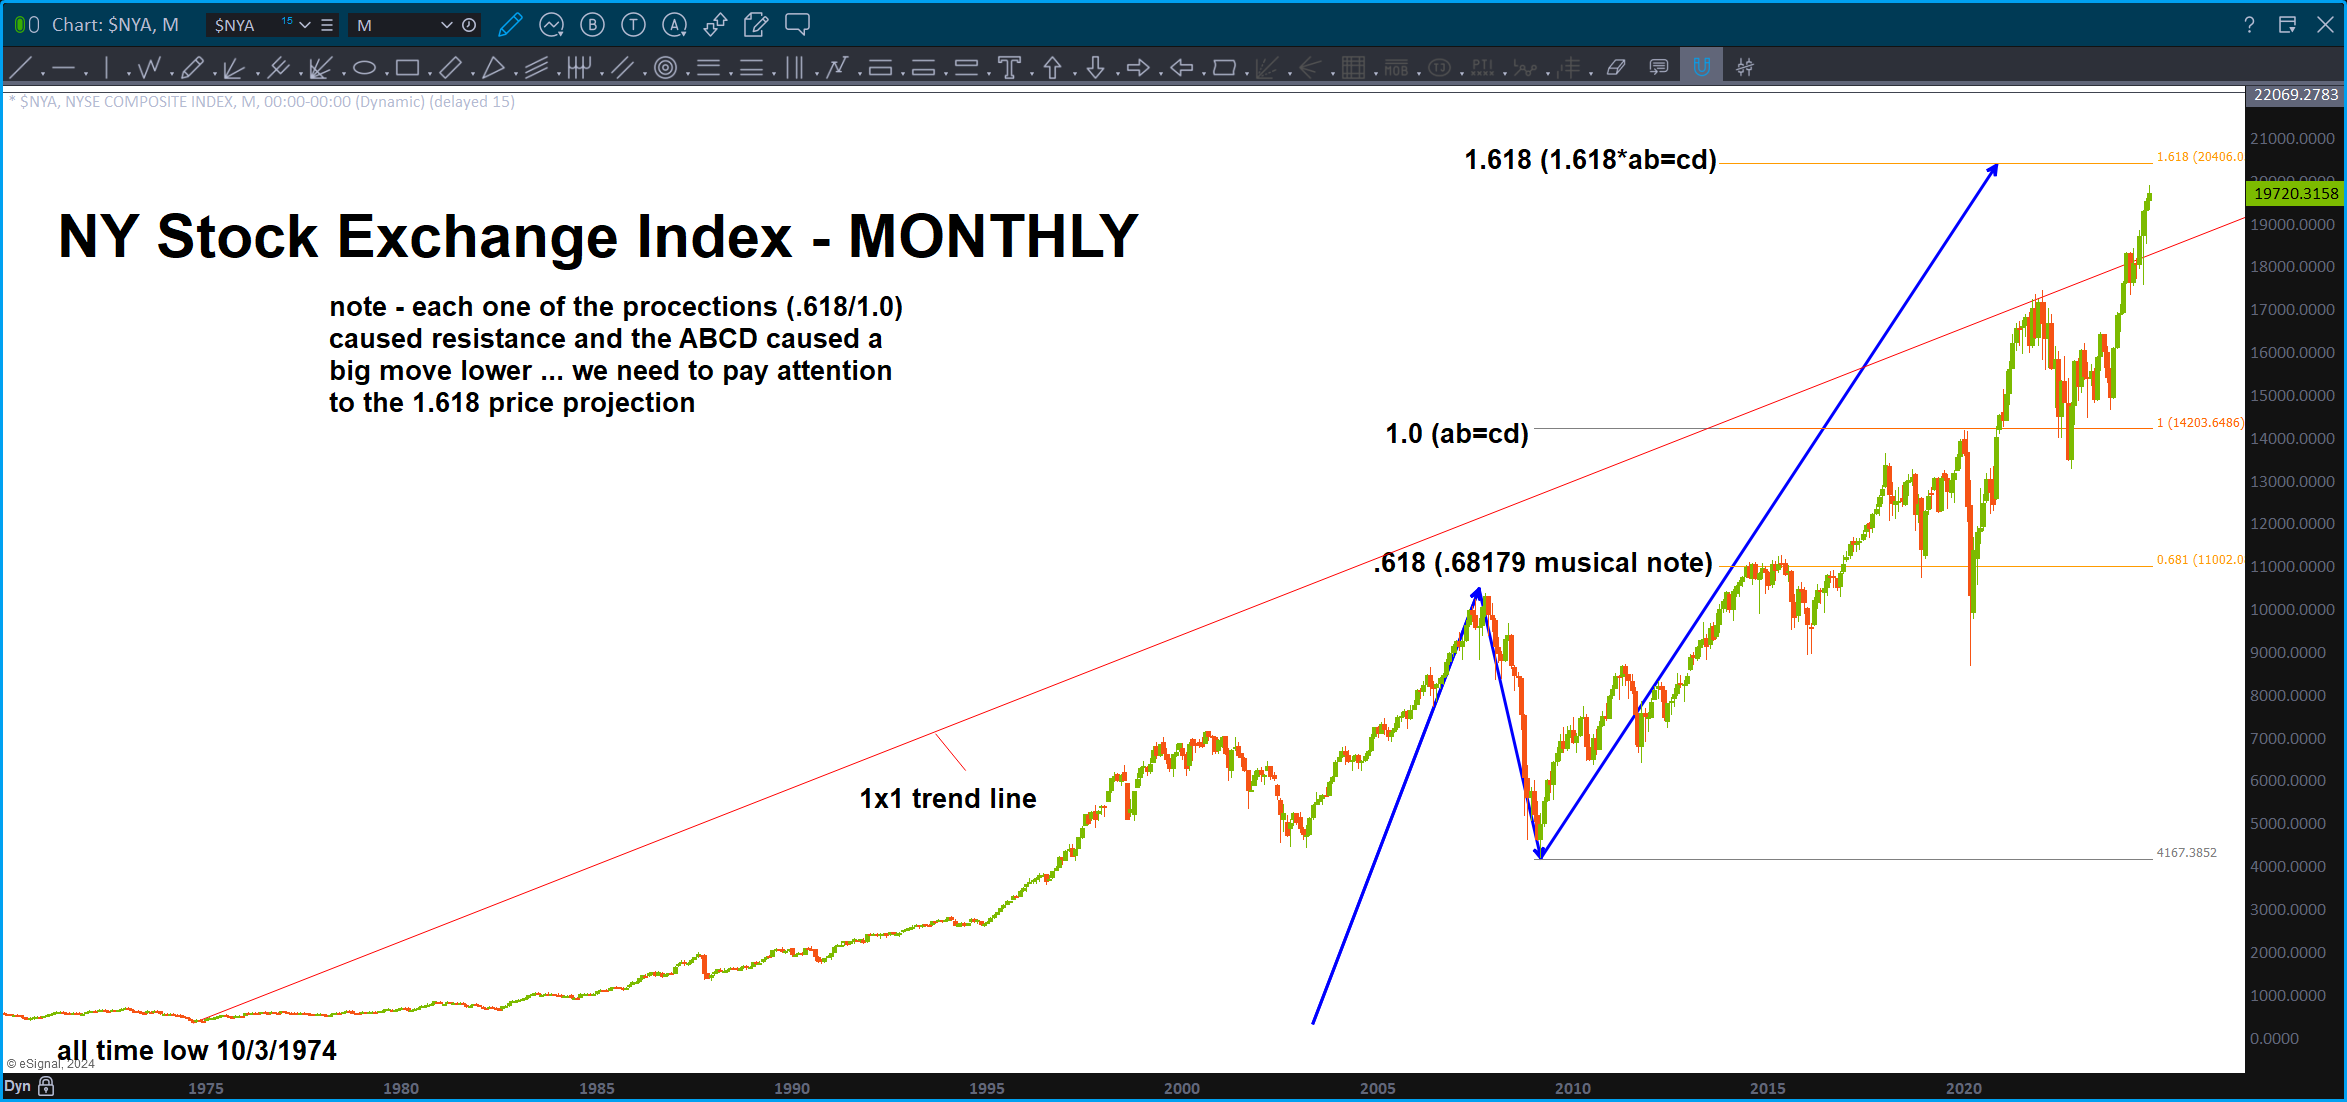
Is this 2.5-3% lower stand alone … nope. What makes this VERY interesting is we have a 1.618 price projection from the all time low on the NYA … 2.5-3% higher.
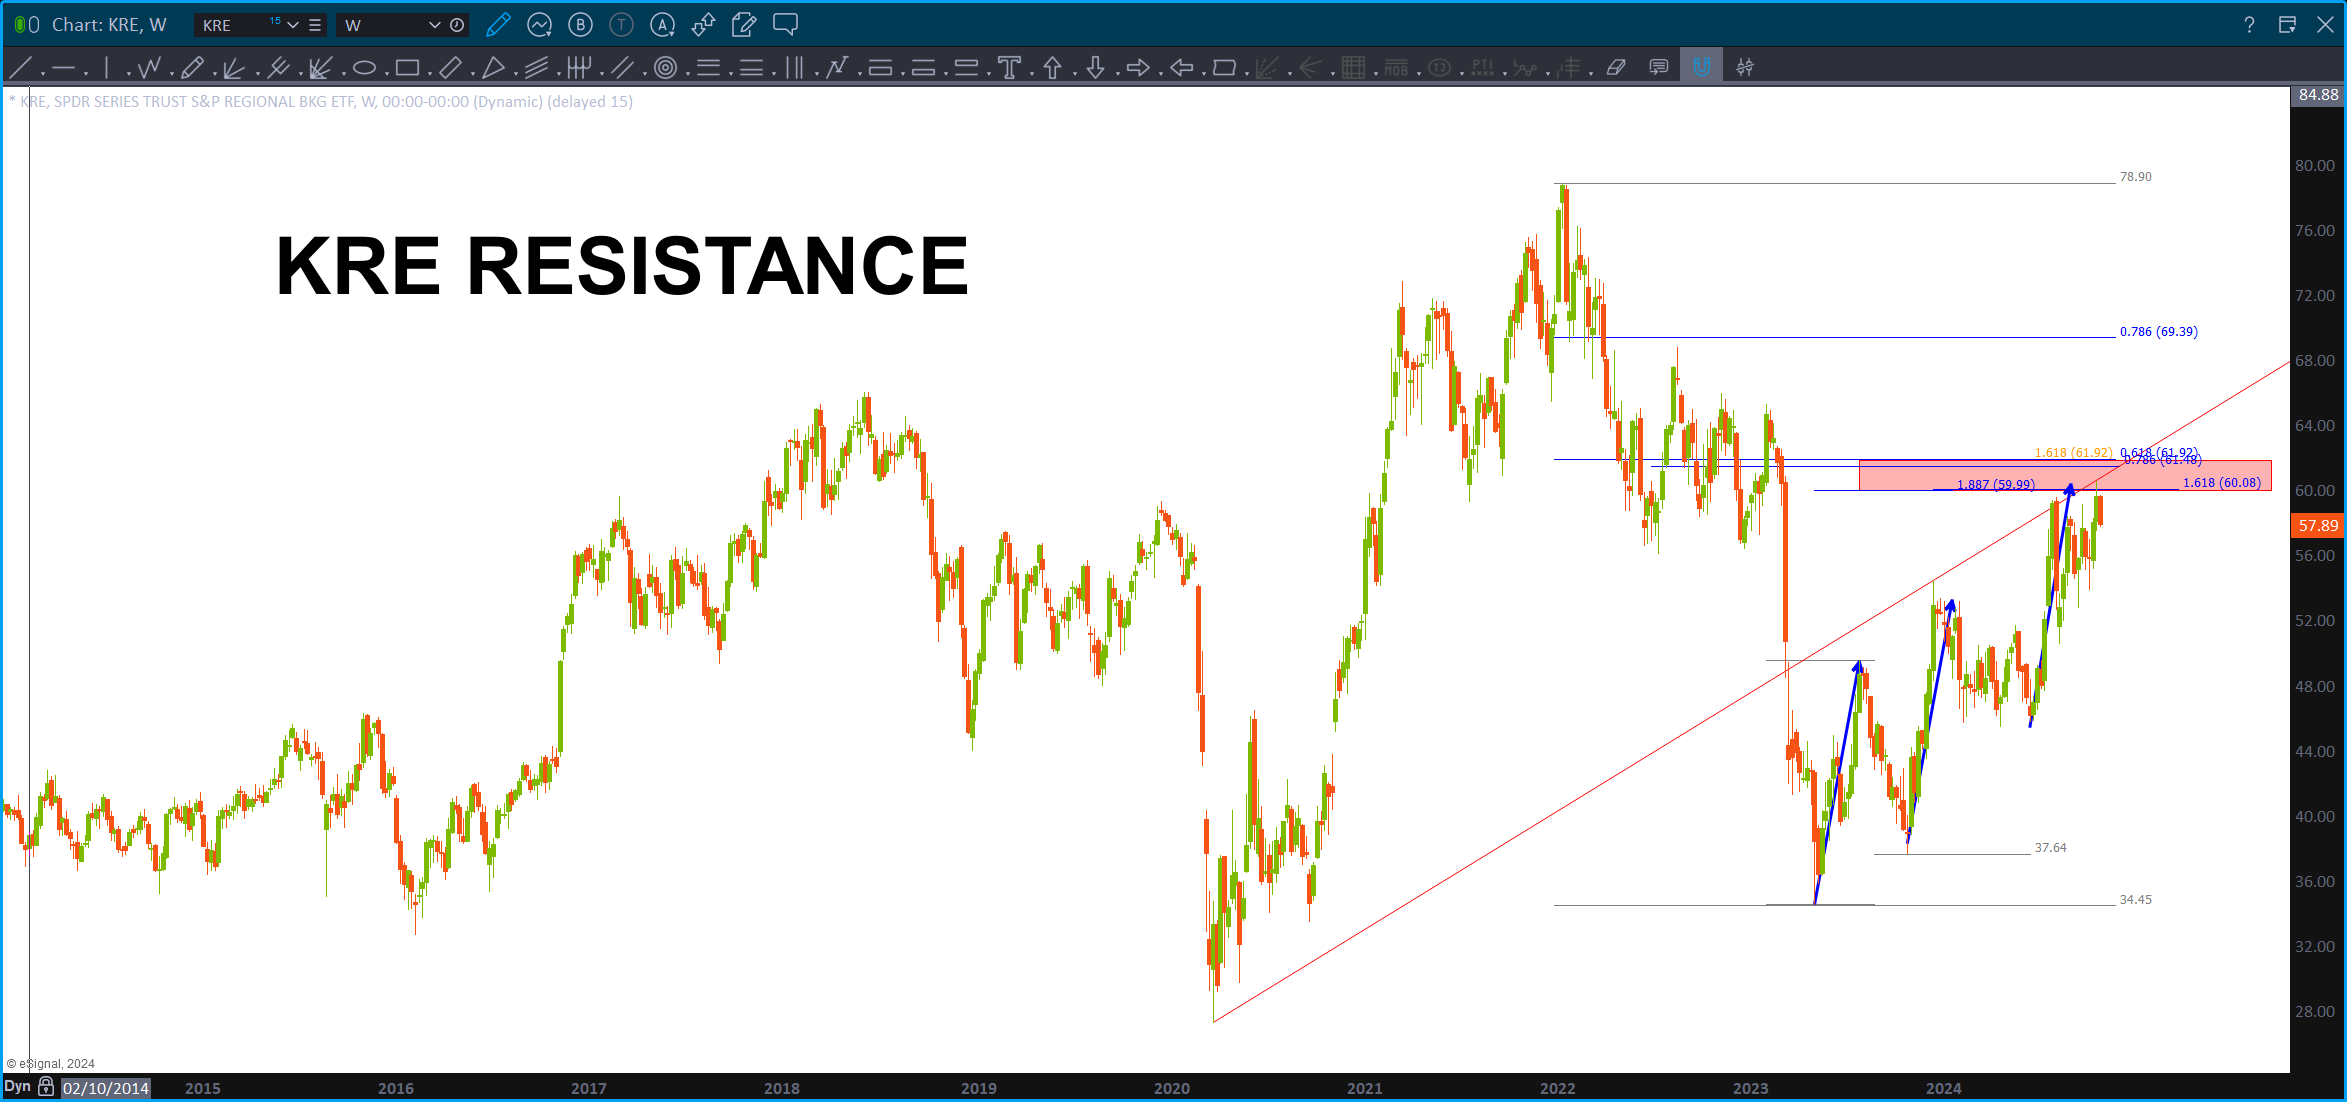
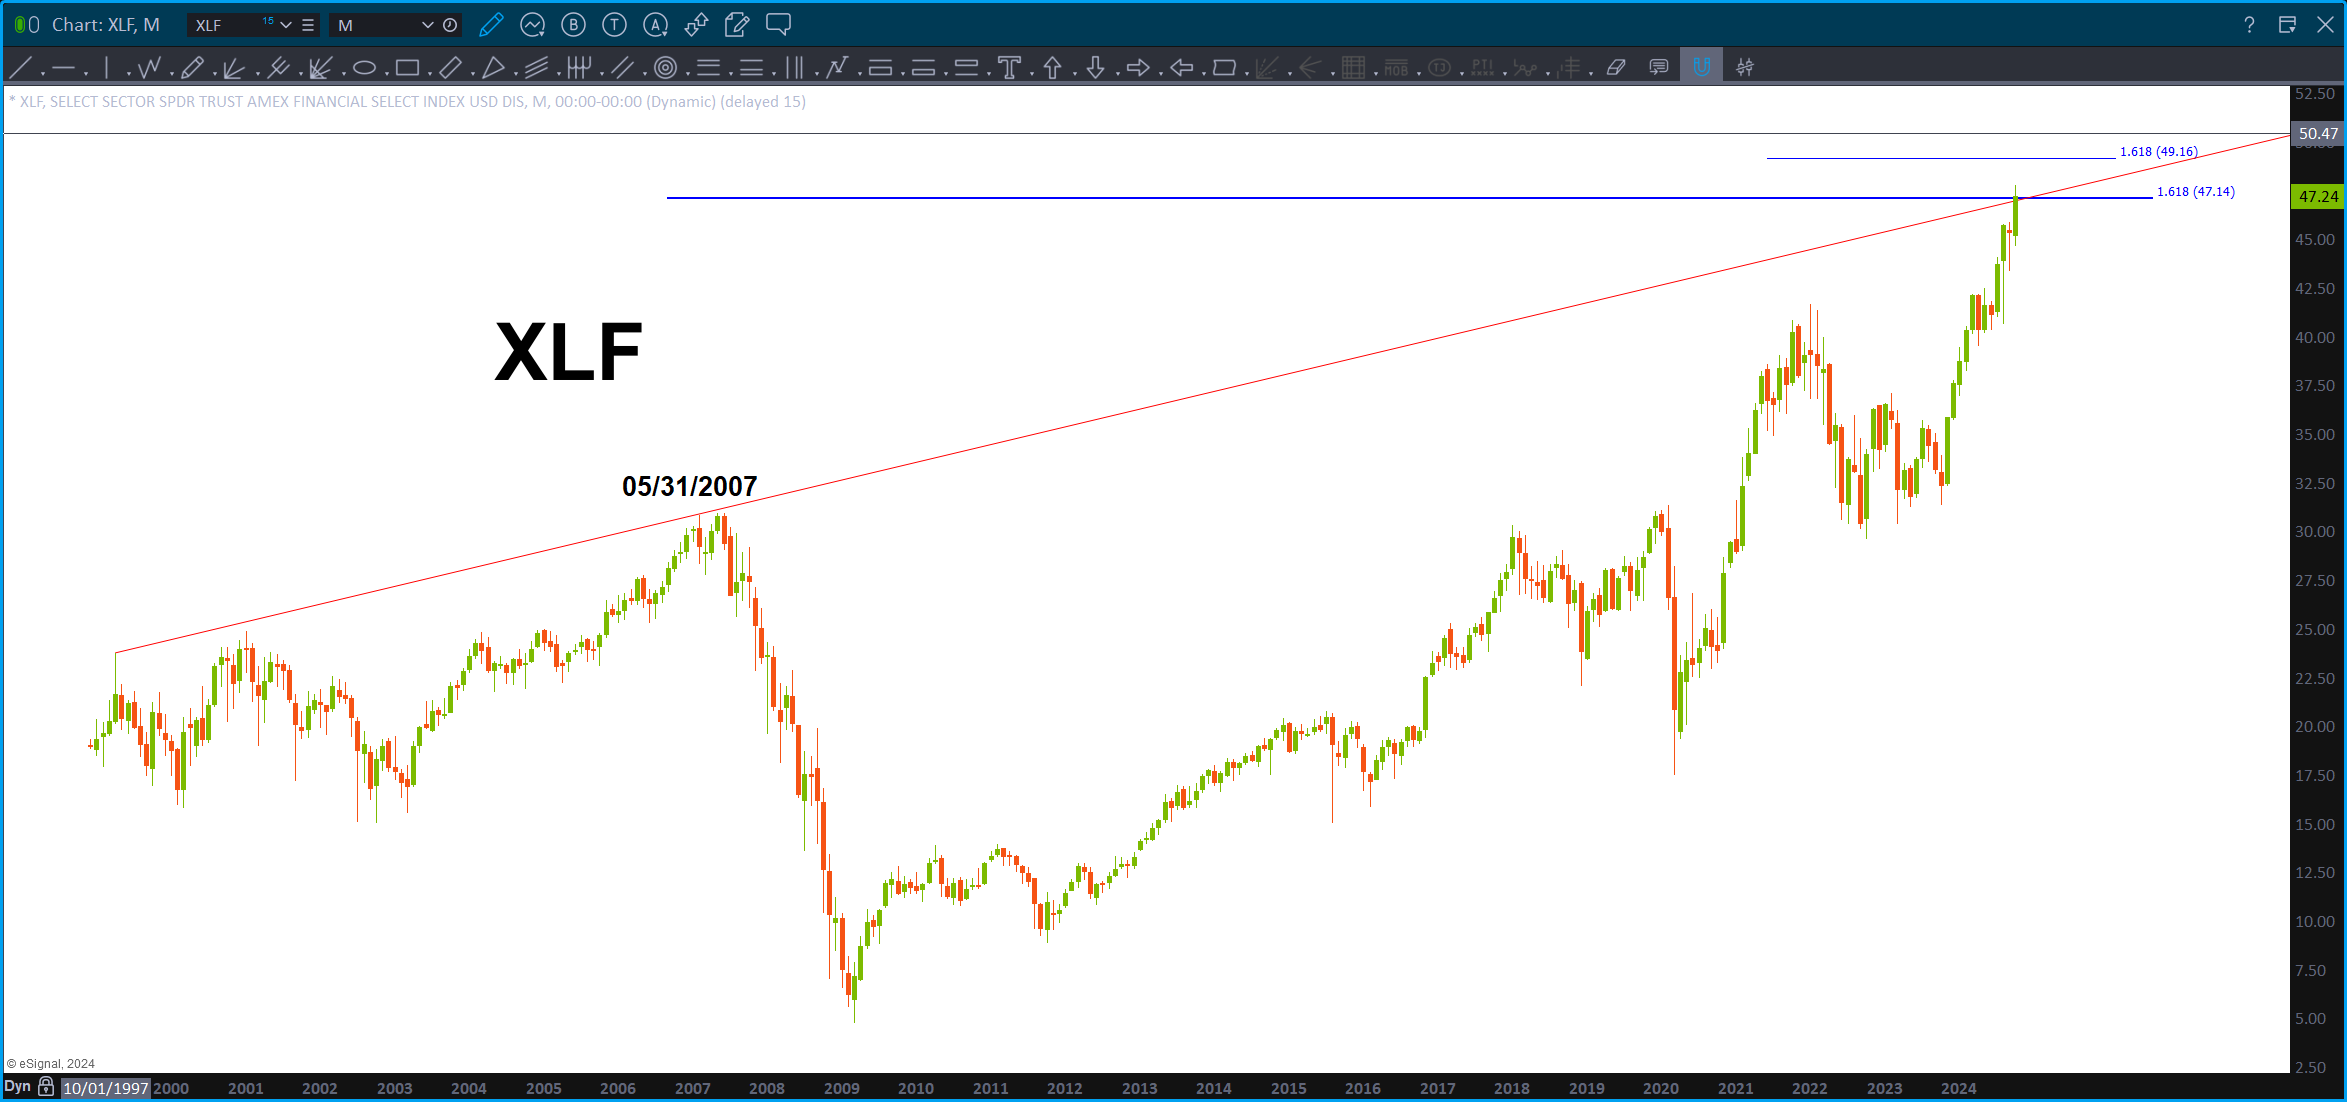
We also need to watch the banks and financials … KRE, XLF and the Banking Index are all hitting BIG resistance.

Nice call on metals!! Thanks for your work it’s great
Kris – thanks for visiting the site. I was talking to my buddy Ponch when they cut the rates .50 and I was like, “I know, but we need short bonds.” Even in the midst of a rate cut …? “It’s just a pattern …” So, that seemed crazy but it worked …the topping of silver and gold, especially now, also seems crazy but the pattern is the pattern – correct? IF (they still could/might) they fail THEN they will take off in a parabolic fashion and then THUMP even harder … so, thanks for taking the comment and take care – Bart