Gorilla’s put dynamite down for now …reload after dollar pulls back. (the dynamite is the 4 trillion/day FX market)
Summary: perhaps, it’s my background as a Naval Aviator for 11 years. I just read a post about “fighter pilots and organizations” and one of the points was the art of the debrief. so, as I post “stuff” on this blog I attempt to make it all “real time” because those snap shots allow me to “adapt and overcome” (my favorite Naval Aviation saying) and see where we are in the game plan moving forward.
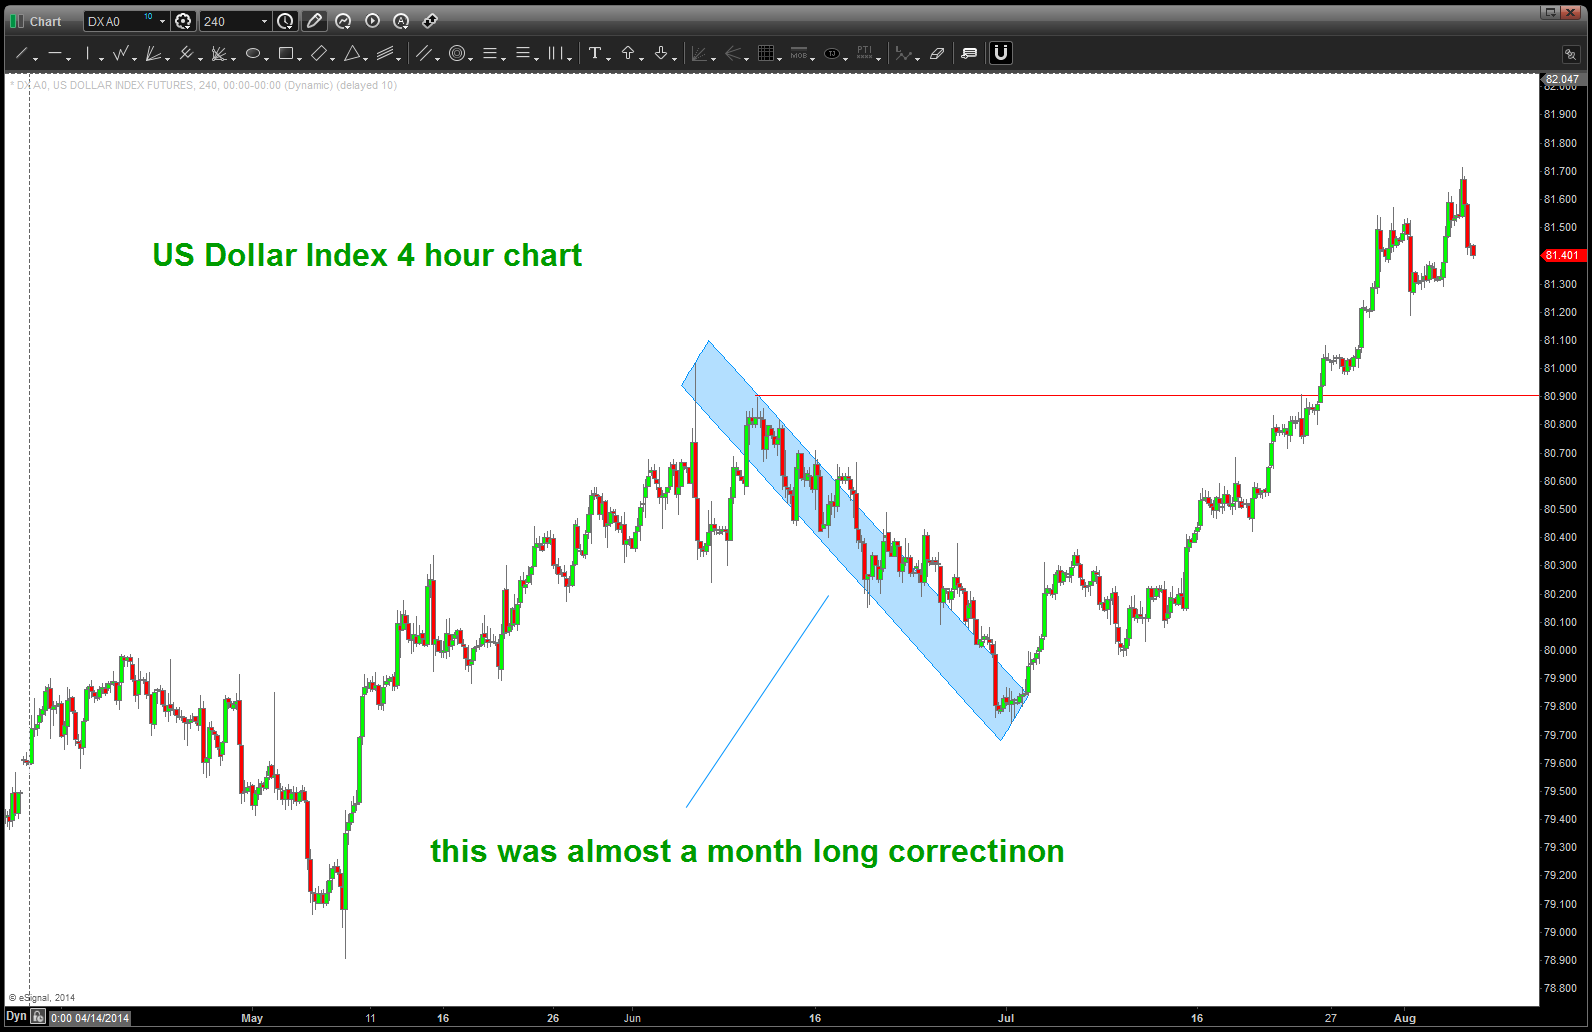
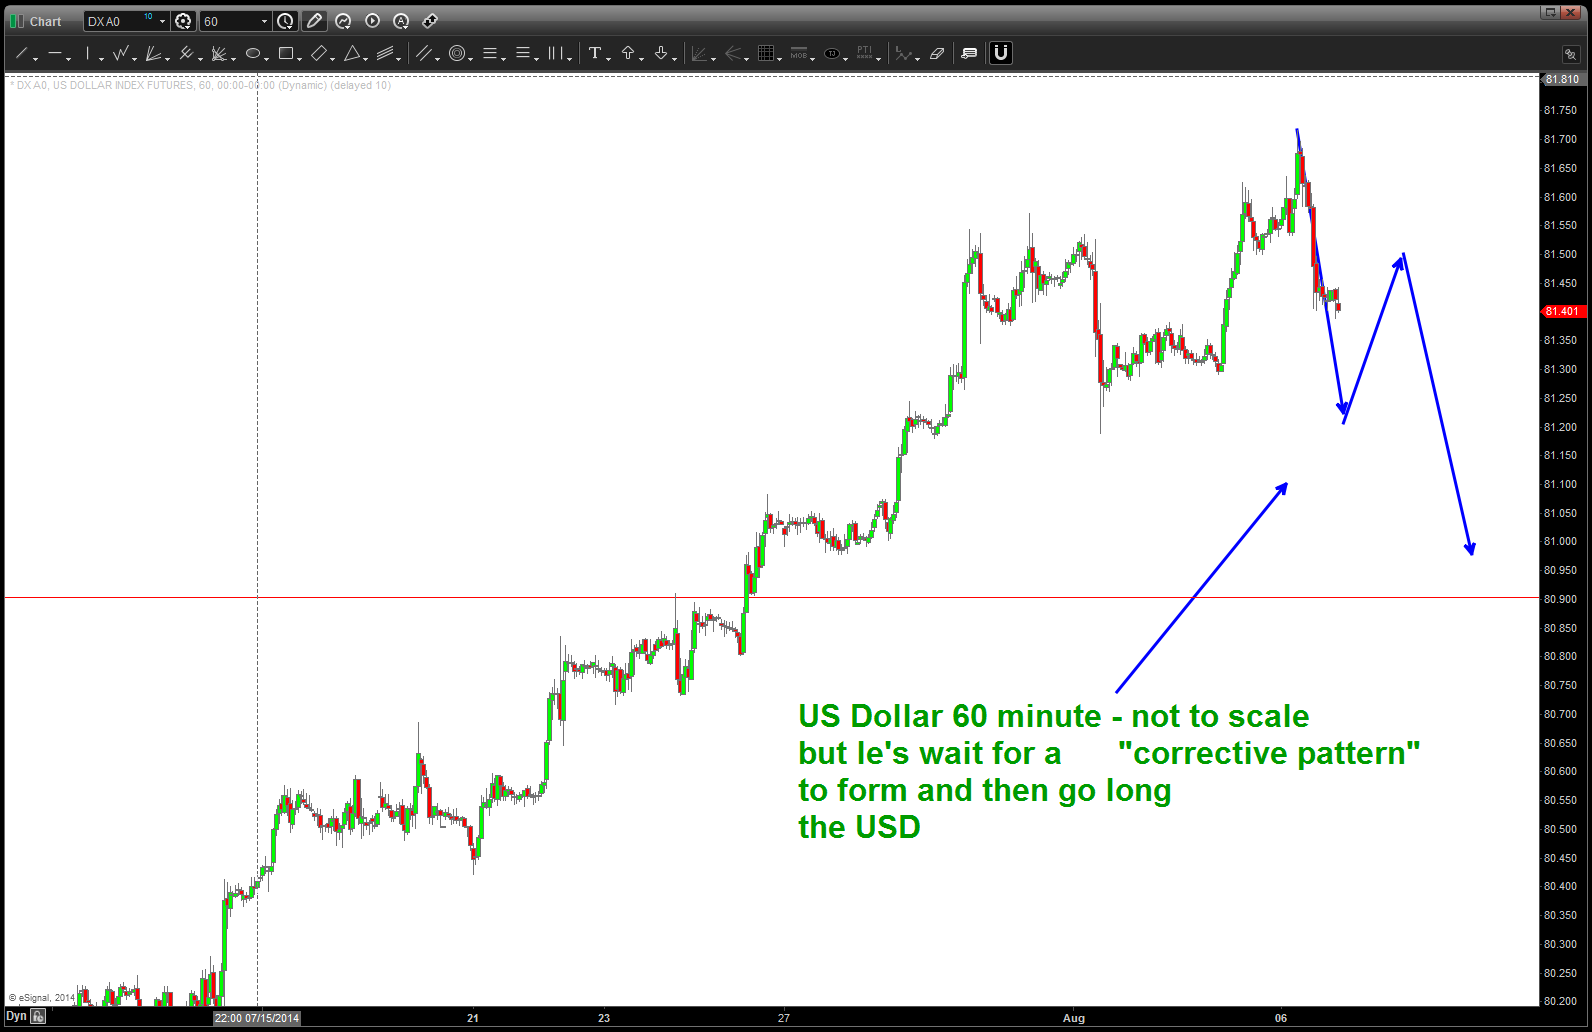
Cliff notes: the first target we had for the dollar index has been taken out but we have another target, shown below, that “should” cause resistance/pull back. Folks, this thing could break wide open and explode (reference HD pattern) but I’m looking to “enter” and will wait for a pattern to form so I can MANAGE RISK. I will not “just enter” and put a random stop “there” …. no, I will wait and wait and wait and wait and wait till the pattern appears. So, here’s another one below:
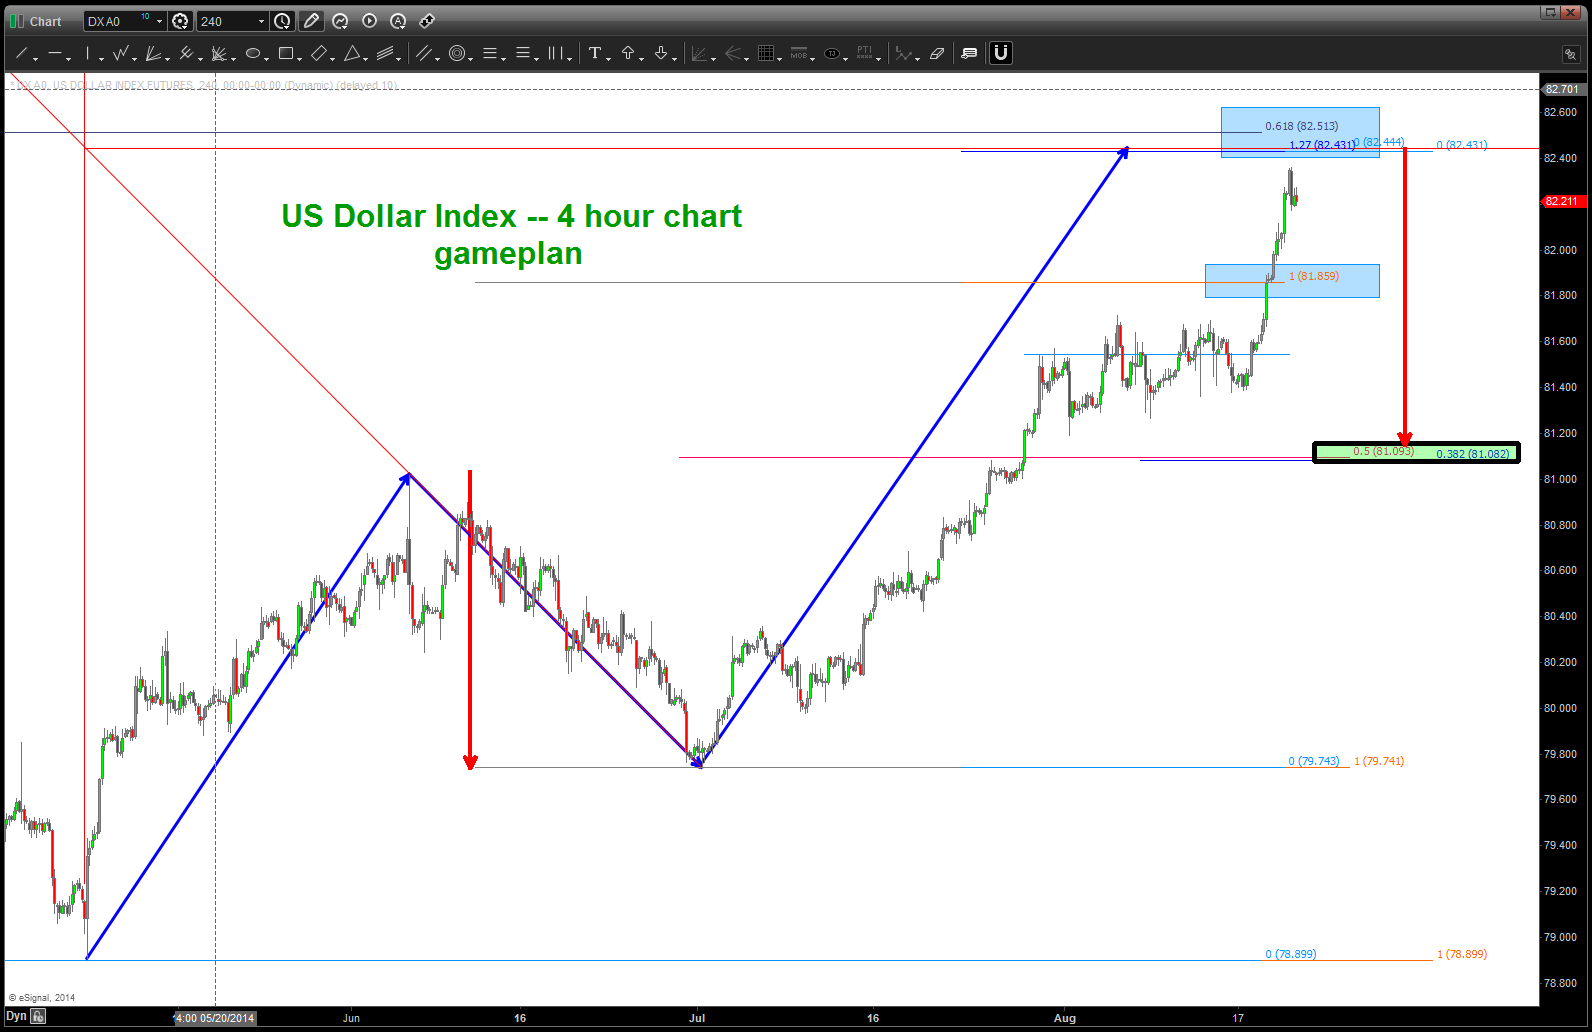
a POTENTIAL gameplan …up to 82.40-82.50 and then BUY at/around 81.09
Euro makes up, roughly 50%+ of the index so what is going on there ….?
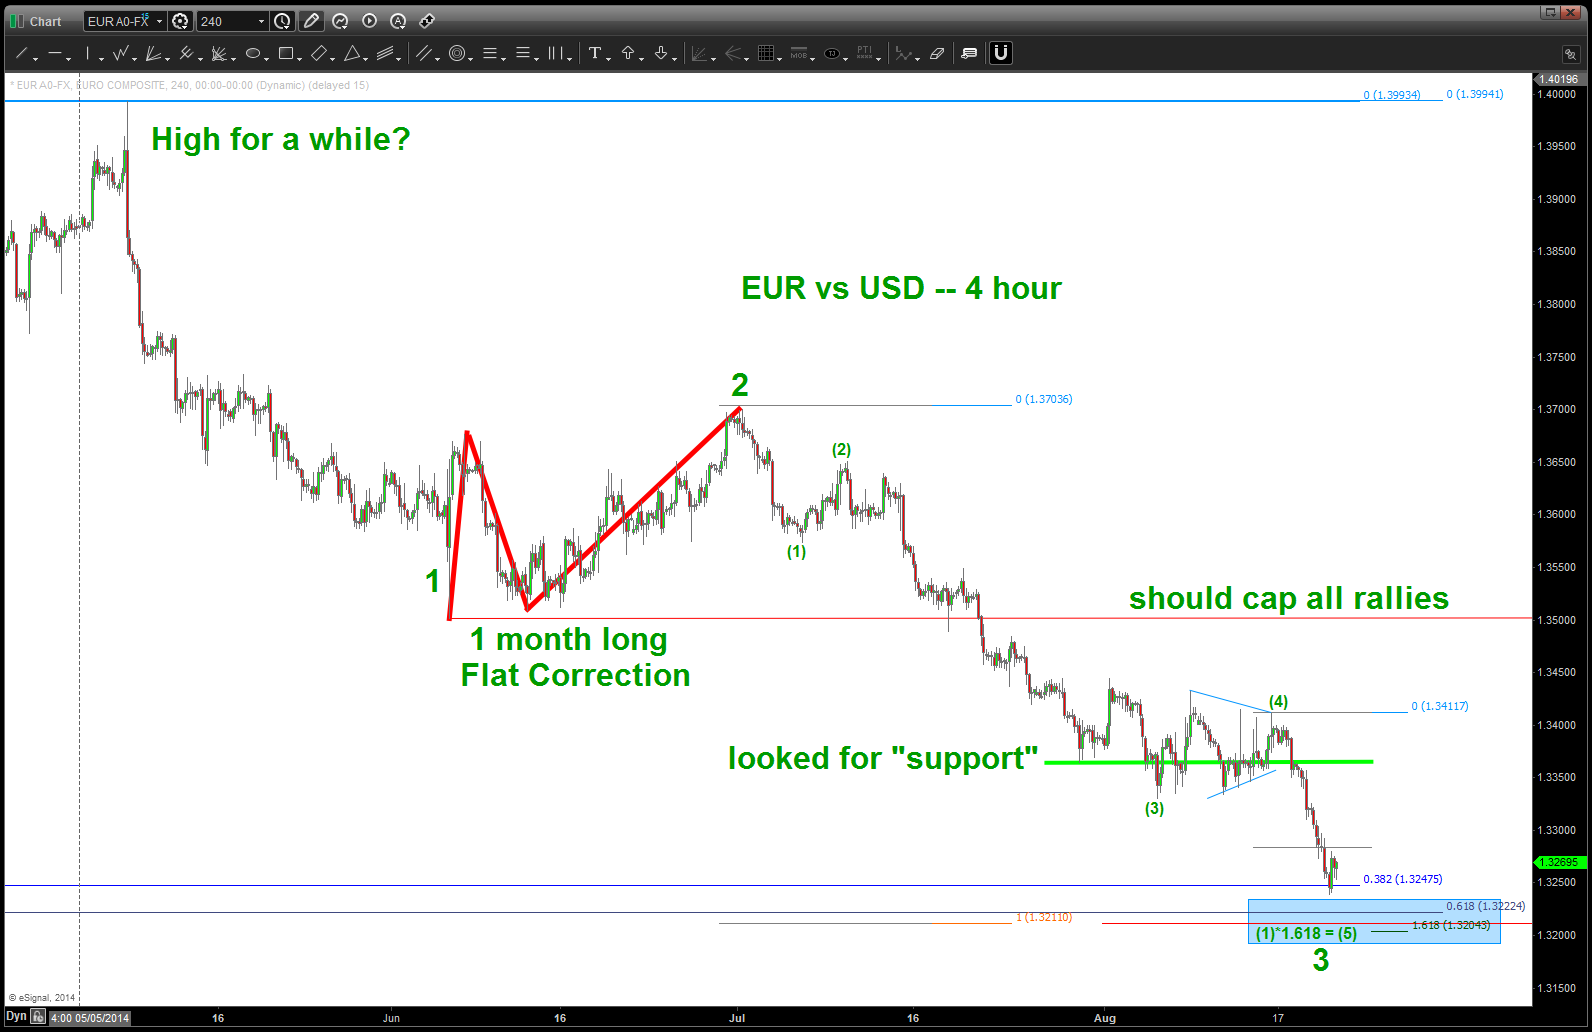
EURO vs USD – finishing a 3rd for a bounce … ?
how about the Swissy …?
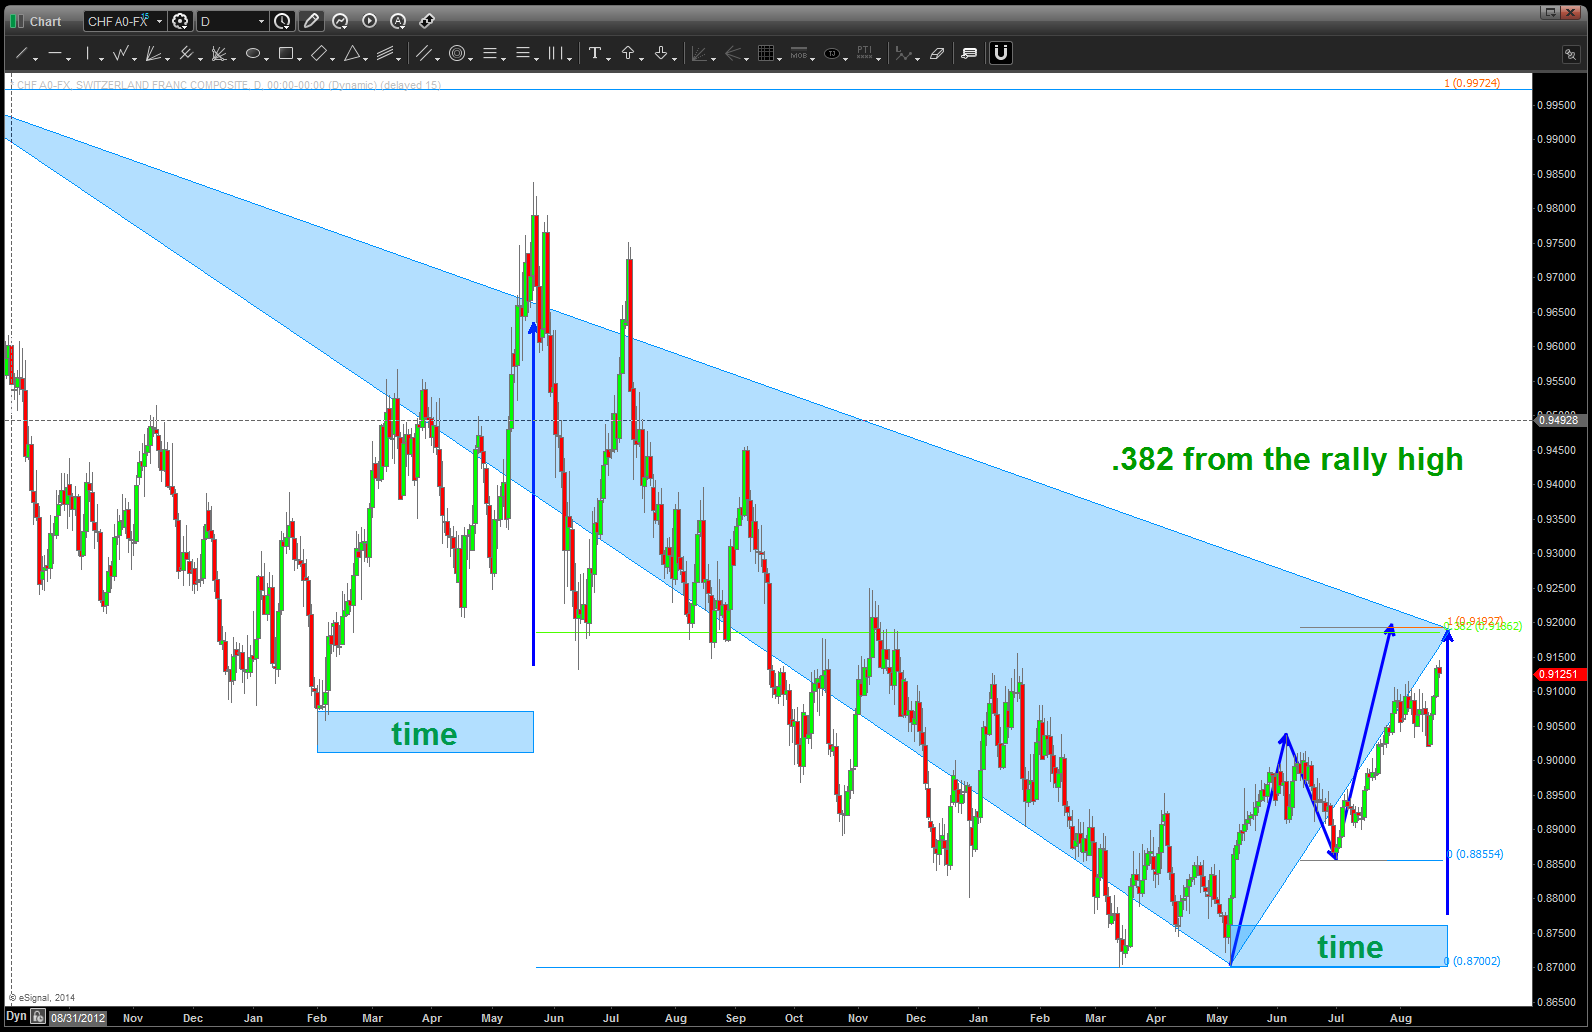
Swissy … pattern just a little higher?
how about the GBP vs USD?
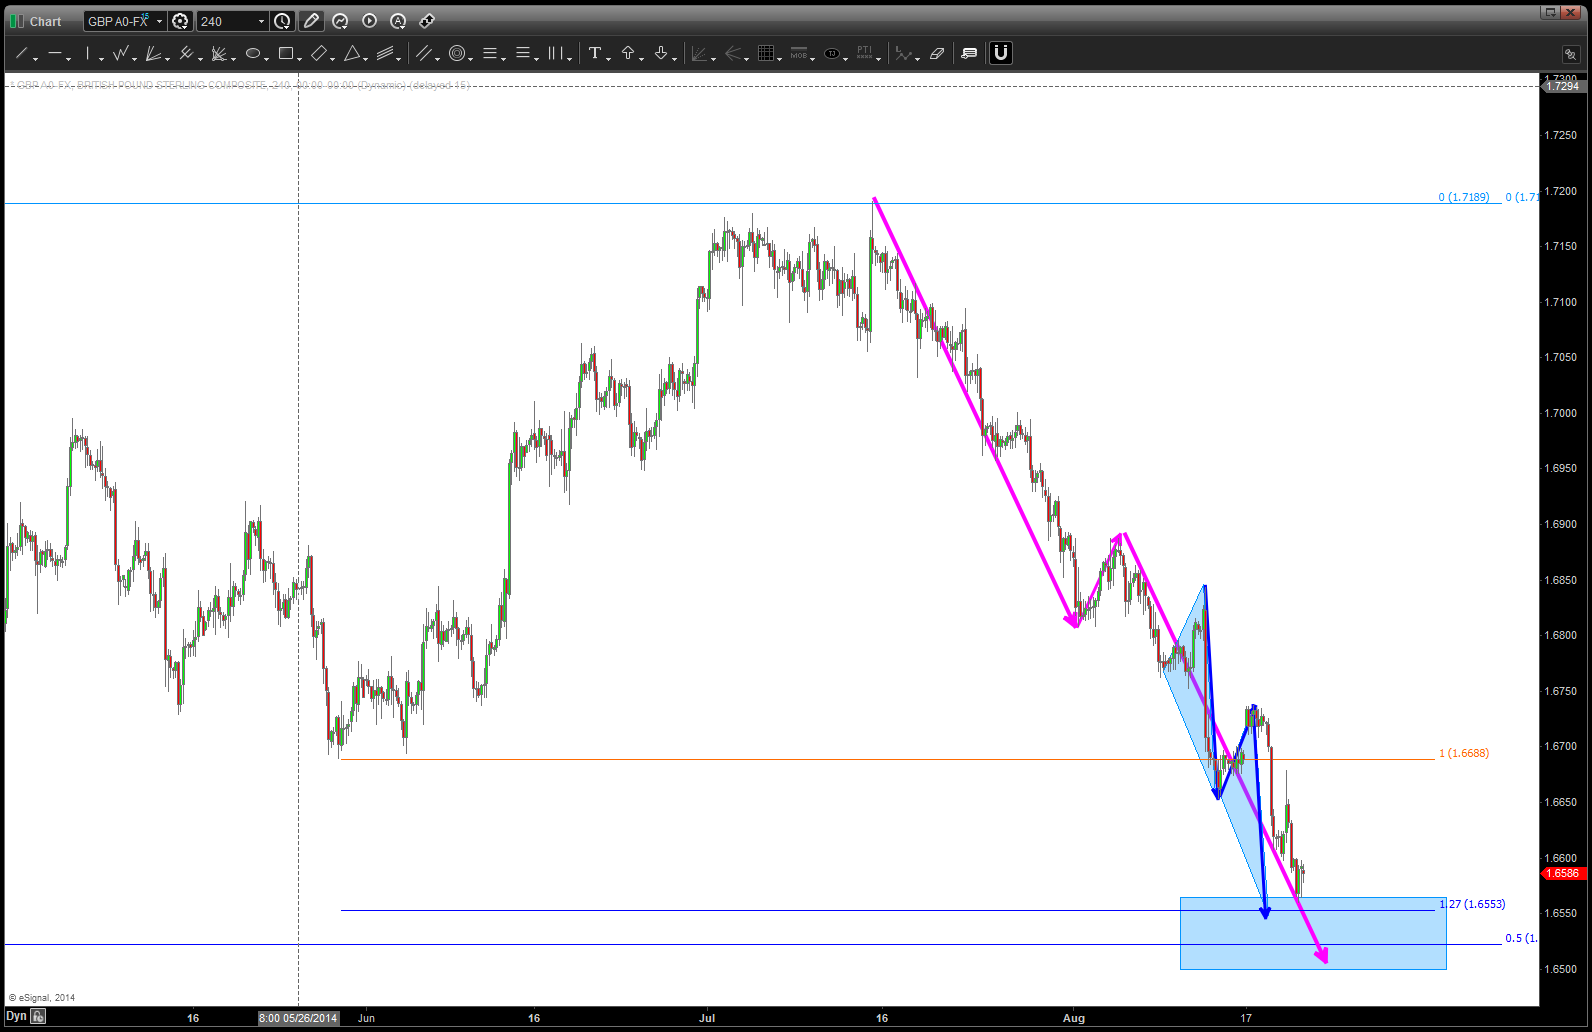
GBP showing some signs of a little lower … bounce
YEN vs USD …. nice little pattern up here (note NK225 yet to hit .786 and make higher highs …)
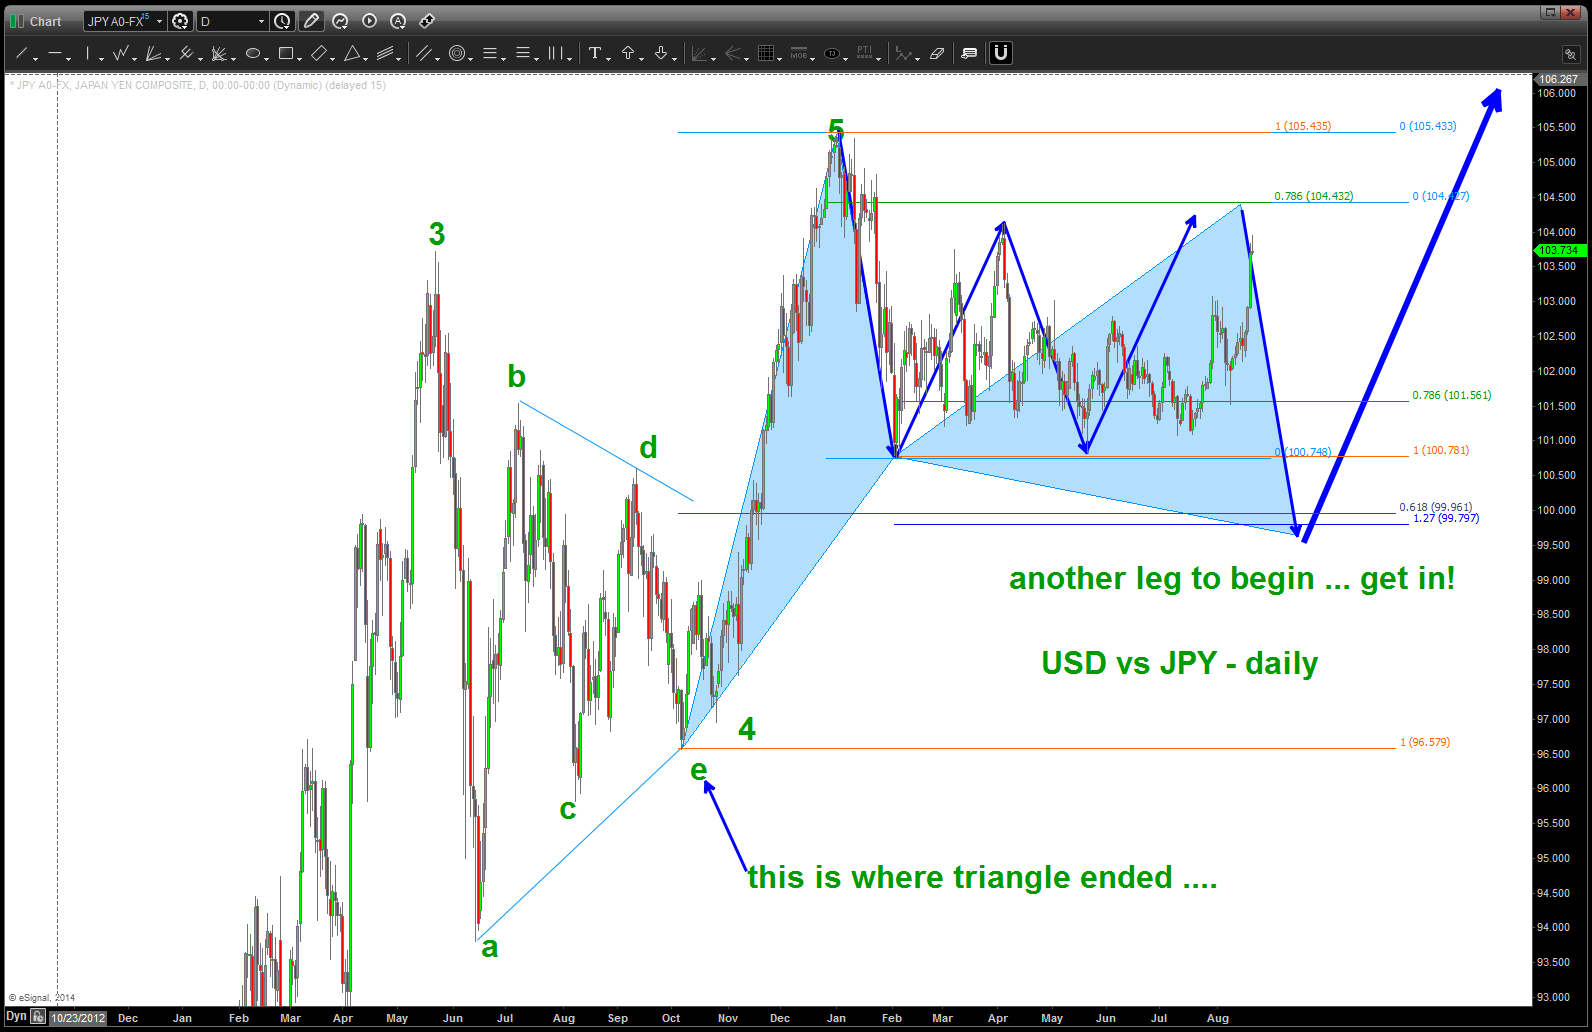
if we lose 104.43 to the upside then big potential the next move has occurred, looking for gameplan above to unfold
USD vs CAD — either a flat to end at 1.0850 or lower. Key is simple .. WATCH FOR 5 WAVES TO UNFOLD DOWN and then BUY at/around levels indicated for another run …
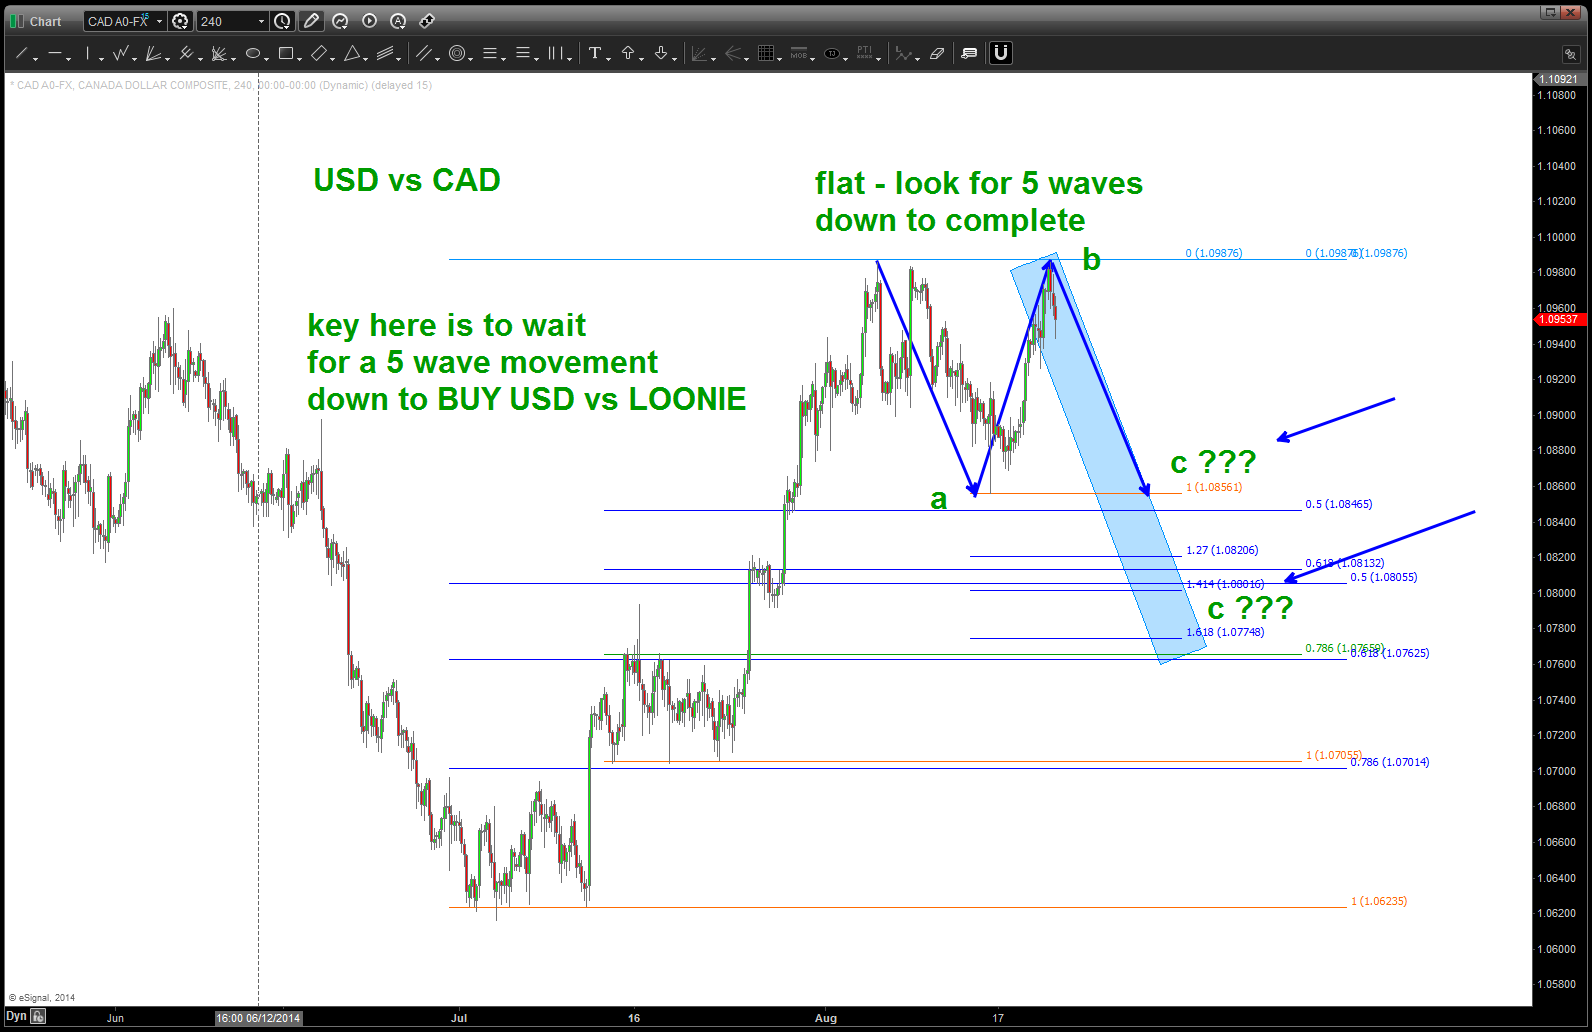
USD vs CAD
Aussie vs USD ….
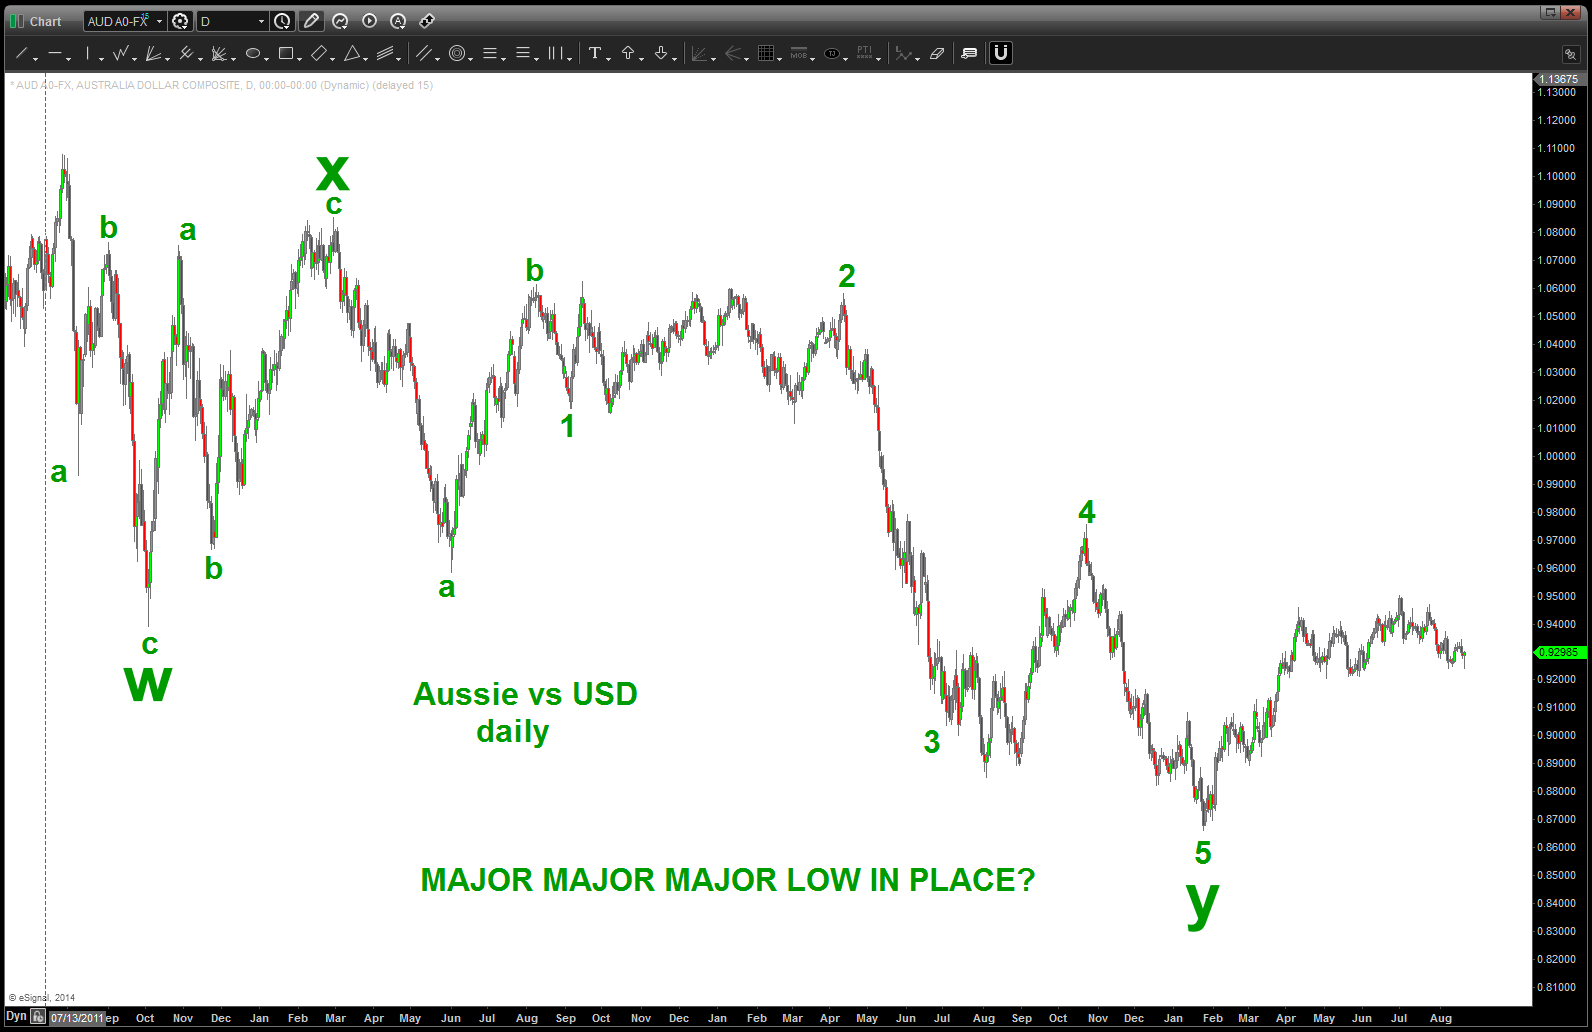
AUSSIE major low …?
the post below is from February 13, 2014 and I believe it’s important to rehash the most recent moves in the US Dollar. Believe this move has room to go, however, we need to patiently wait for a corrective pattern to form.
this move in the dollar is real so try to get long in the most risk adverse manner possible. as you can see from the post below as the 79 level was repeatedly getting tested I did, admittedly, start to question my strong dollar scenario. that was surely one ugly level for a while but I do think the dollar will strengthen into the low 90’s target that we have been calling for.
take your time and go thru the post below …some AMAZING geometry. Also, remember, ALL of my charts are REAL TIME w/ no backward look .. they are as I saw it.
Bart

February 13, 2014
used GOOGLE to look for a picture of Gorillas Juggling dynamite – this is the best I could find
Early in my career I had the wonderful opportunity to get training from Joe Di Napoli (www.fibnodes.com) Highly recommend learning some of his techniques but, most importantly, his understanding of the market structure and the players in the game. One of his favorite sayings is we must realize that “you are entering into a world where the market is truly a caged gorilla juggling dynamite and – the dynamite is lit!”
Additionally, if you have been reading this blog you’ll realize it’s focused 1) 100% on PATTERNS and 2) it’s unique value is tying PATTERNS into the circle of life (fixed income, equities, commodities, FX). W/in the context of the circle, the gorilla is the Foreign Currency Market. According to the Bank for International Settlements – the preliminary global results from the 2013 Triennial Central Bank Survey of Foreign Exchange and OTC Derivatives Markets Activity show that trading in foreign exchange markets averaged $5.3 trillion per day in April 2013.
The Dollar Index is somewhat important as it represents a basket of 9 currencies – the Euro representing a vast majority of it at 58%.
For all intensive purposes – it’s been “stuck” in a 4 cent range but PATTERNS suggest we are “prepping” for a big move … so, in order to get a “feel” for where we MIGHT be let’s go back to the “beginning” at 71 ish and work thru to present…
PATTERN at after the 71 low
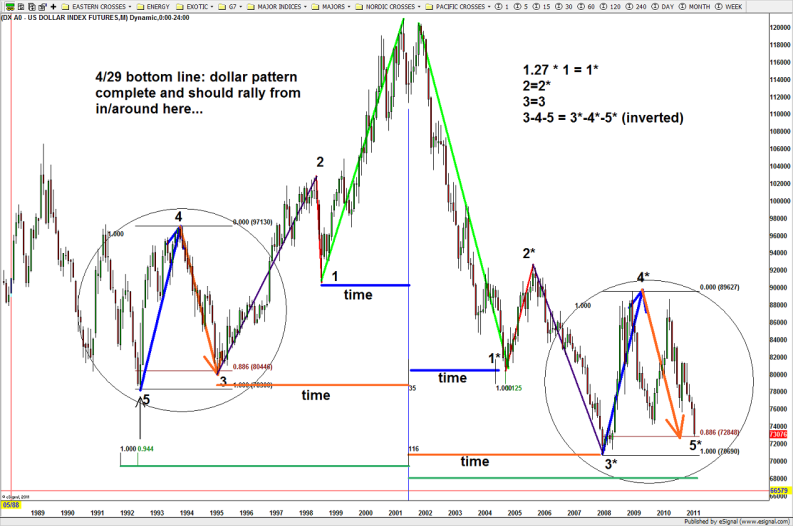
more detailed look at the mirror image foldback present in the US Dollar
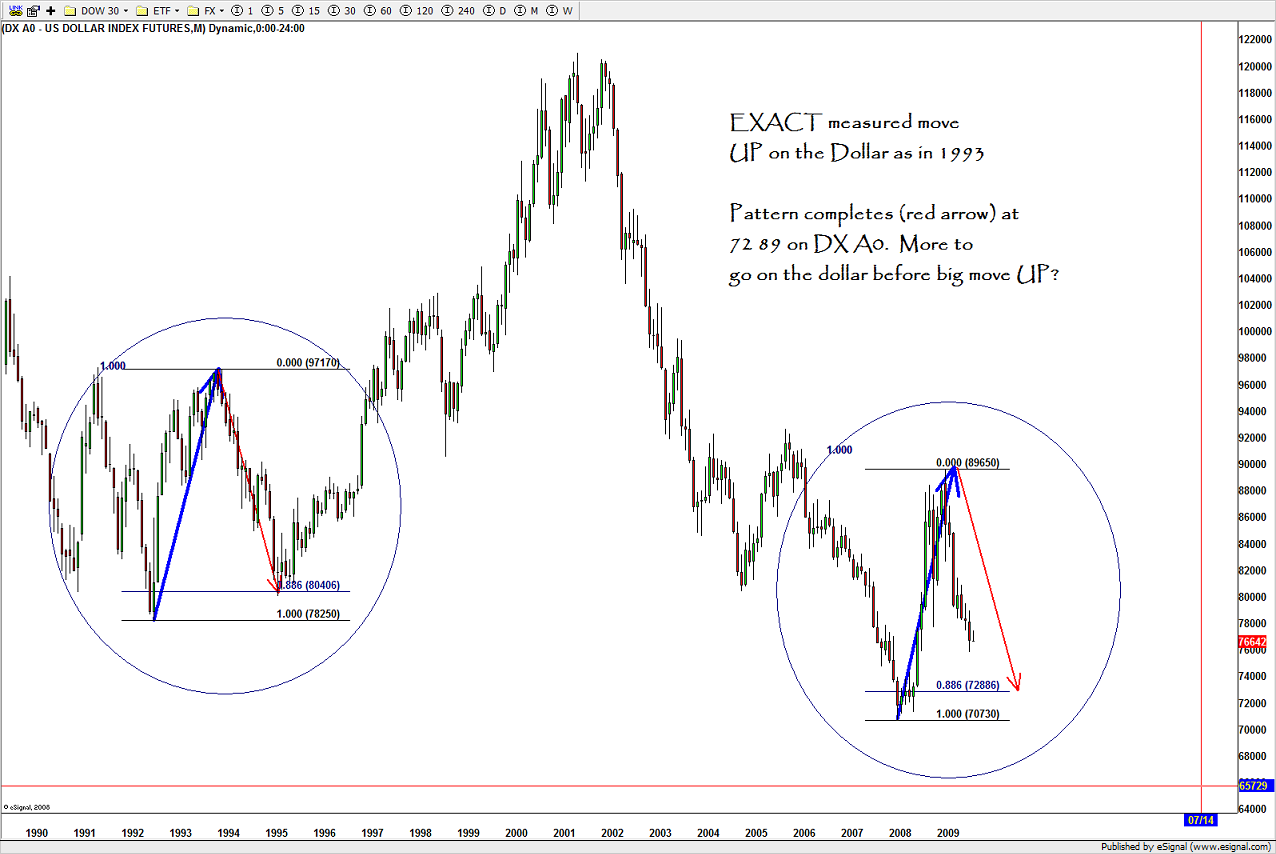
CLIFF NOTES: the BULLISH thesis is that after the 5 waves down from 121, a 3 wave (at a minimum) corrective pattern should ensue (A-B-C) and therefore the bounce has farther to travel. Additionally, it could mark a MAJOR low and we are starting back up for 5 waves. The BULLISH consensus for the US DOLLAR is that this move UP is not complete. Please see this chart below … and, notice the EXACT move up from the PATTERN shown above at the “2 or B” level.
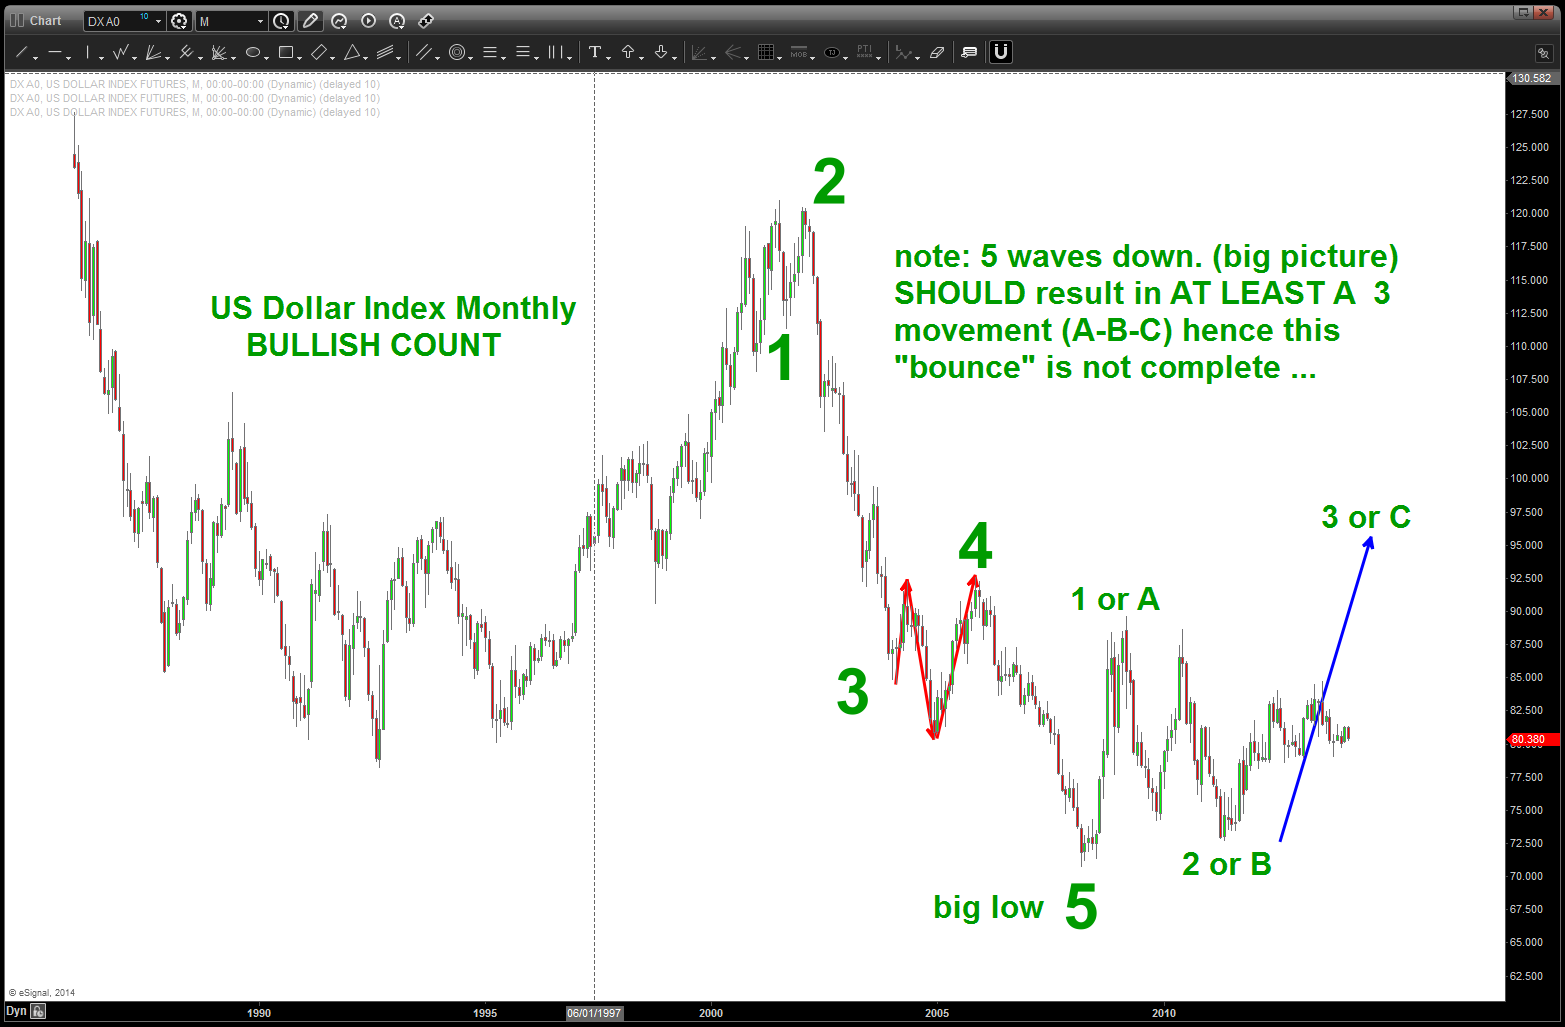
note a clear 5 waves down should lead, big picture, to a 3 wave move up (at a minimum)
so where are we now? Without showing an “elaborate” count, we can see by the chart below that we smacked right into a “big picture” .618 price projection that had it’s genesis from the 71 price low.
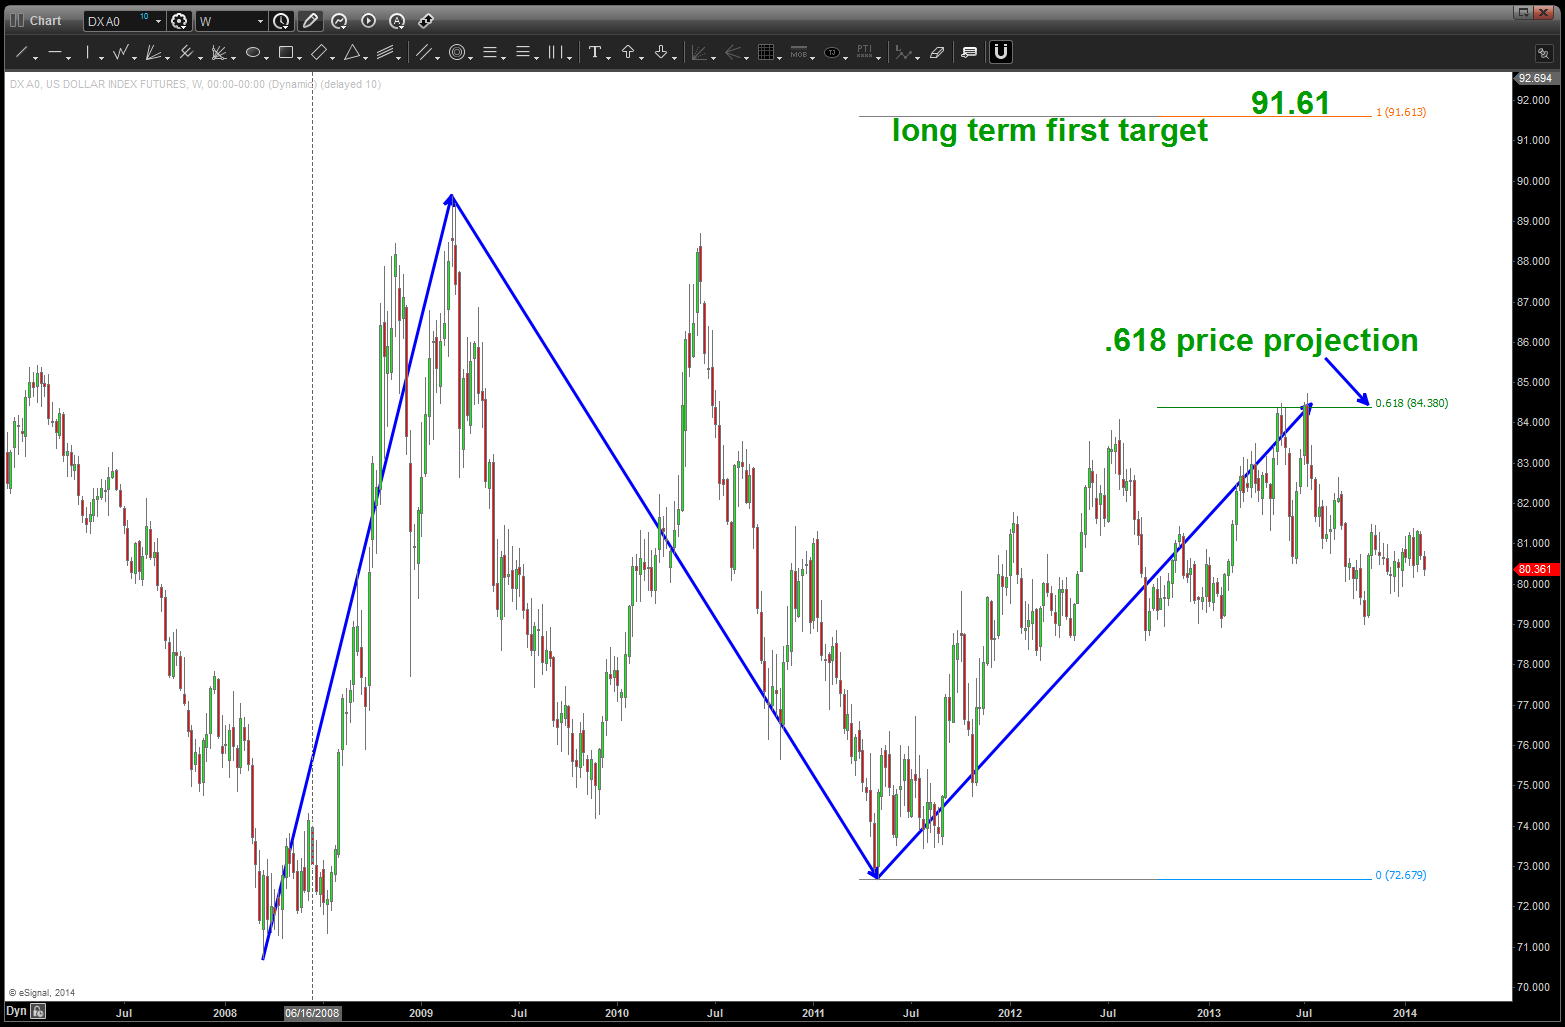
.618 price projection on the US Dollar causing the resistance
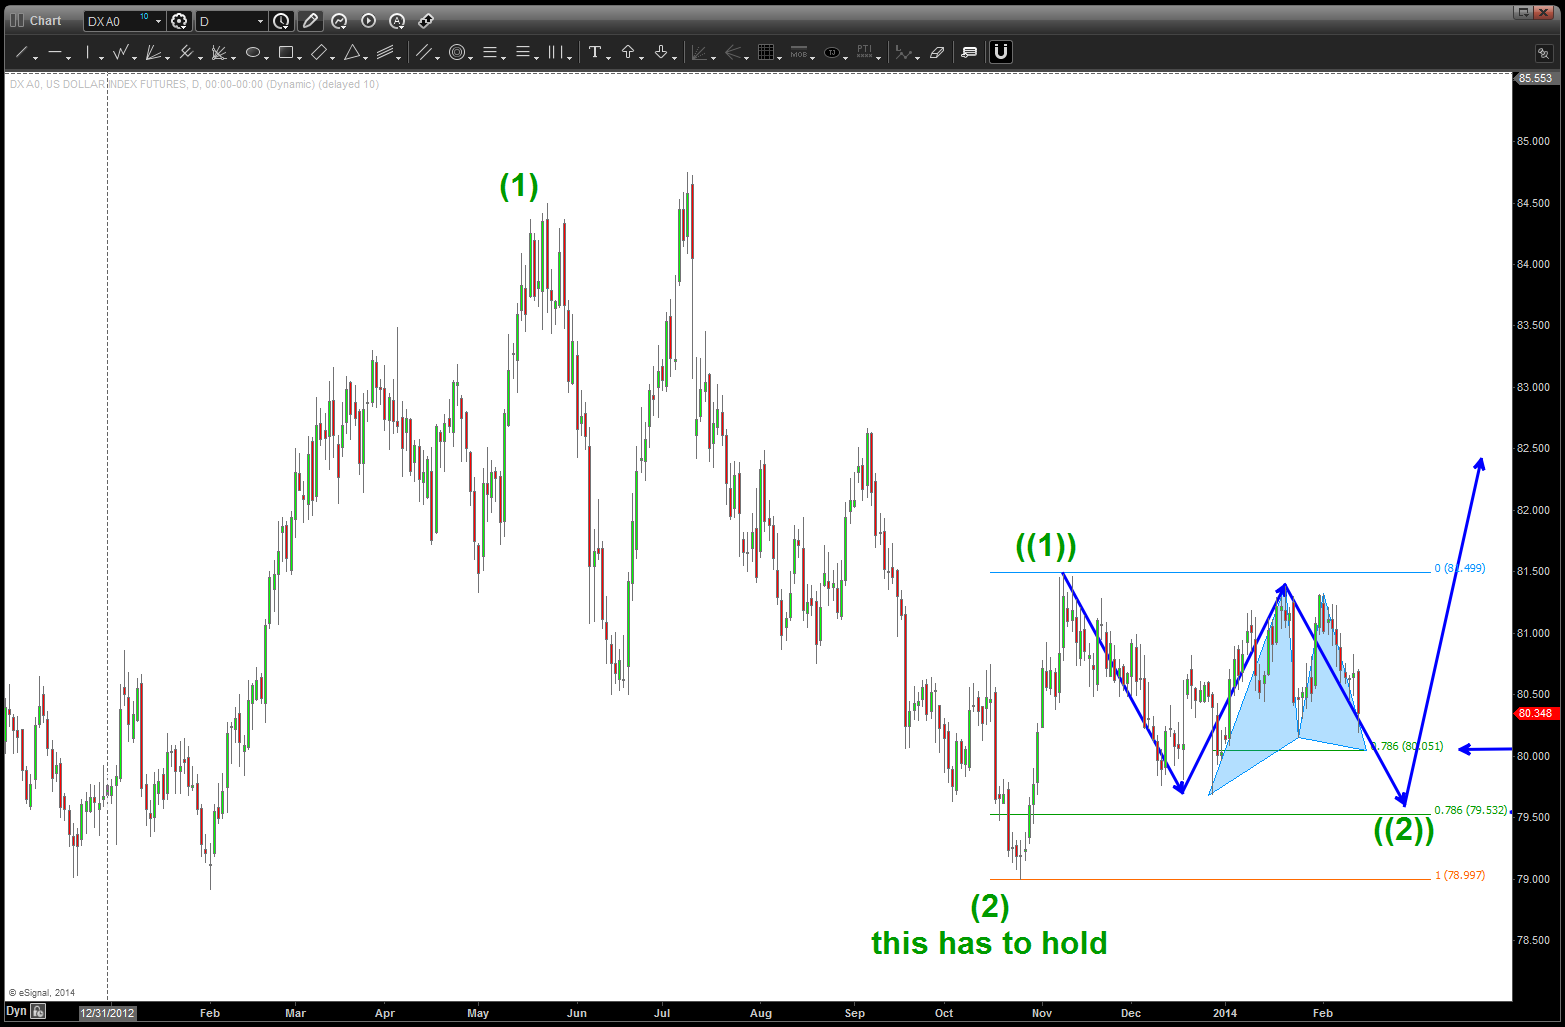
here’s the possible bullish count from the “2 or B” low that shows a POTENTIAL 3rd wave underway. IF the count is correct, then the 79 level has to hold and is very crucial as it suggest that the 3rd wave should begin …soon and UP we go.
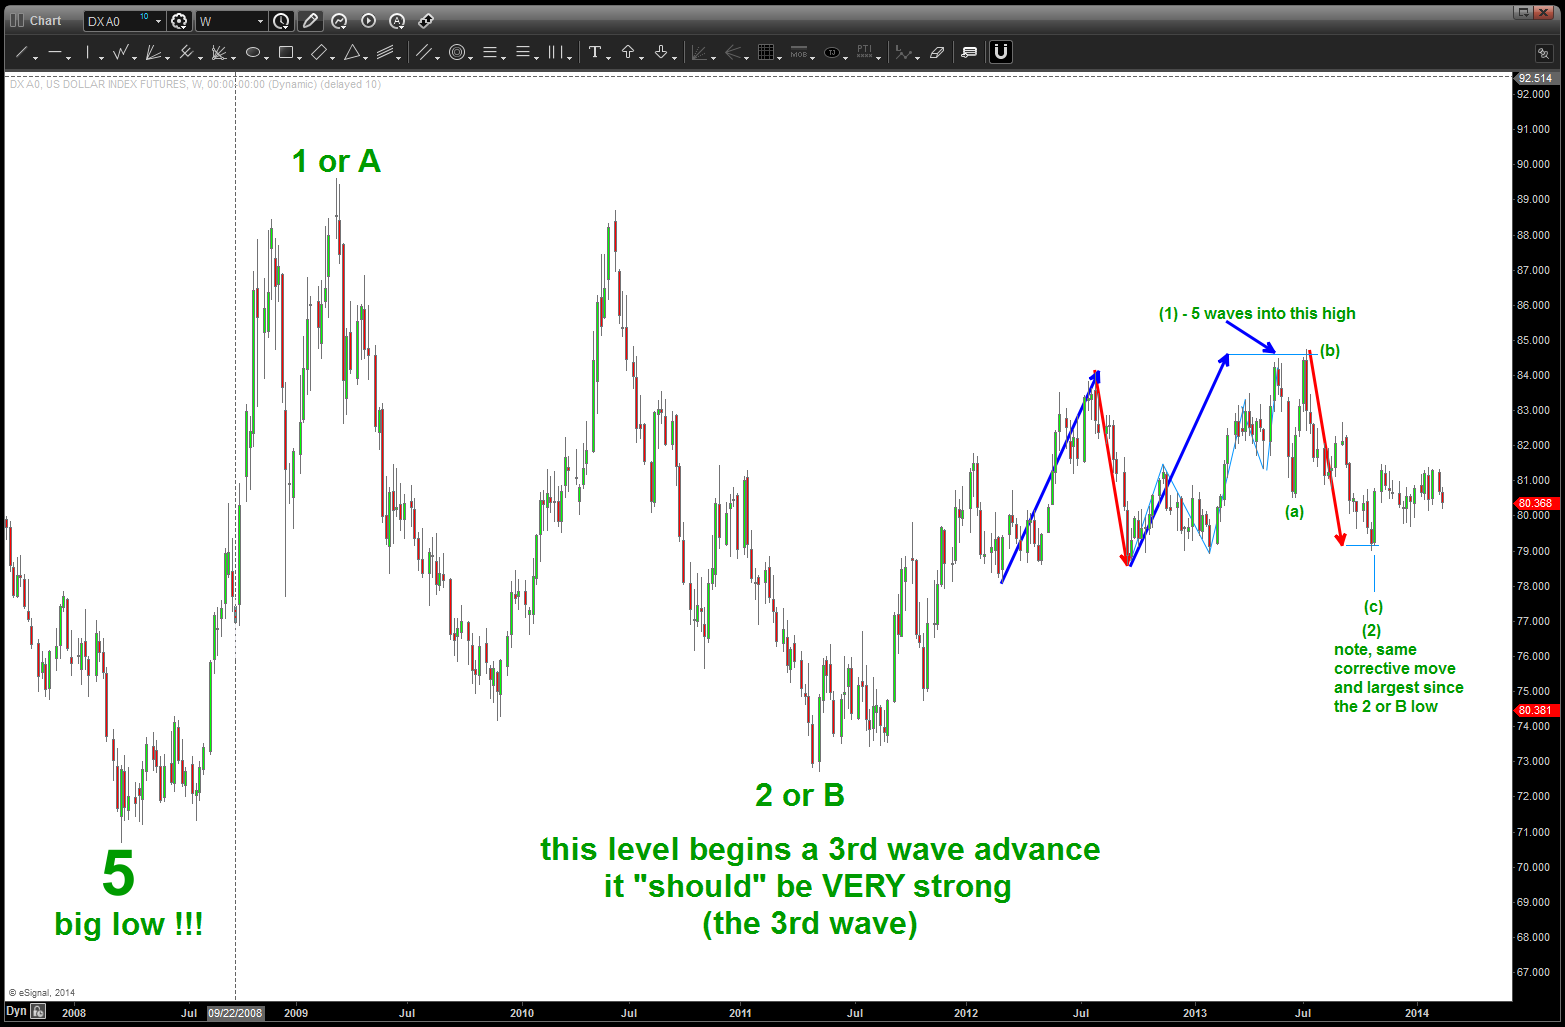
potential count showing a bull move
now, we need to drill down one more time frame – that of the 240 minute chart to see what we have going on. YES, we have a BULLISH PATTERN on the US Dollar at 80.05-80.08. In order for this entire thesis to be correct, then I believe this pattern needs to hold for the strength in the US Dollar to begin…
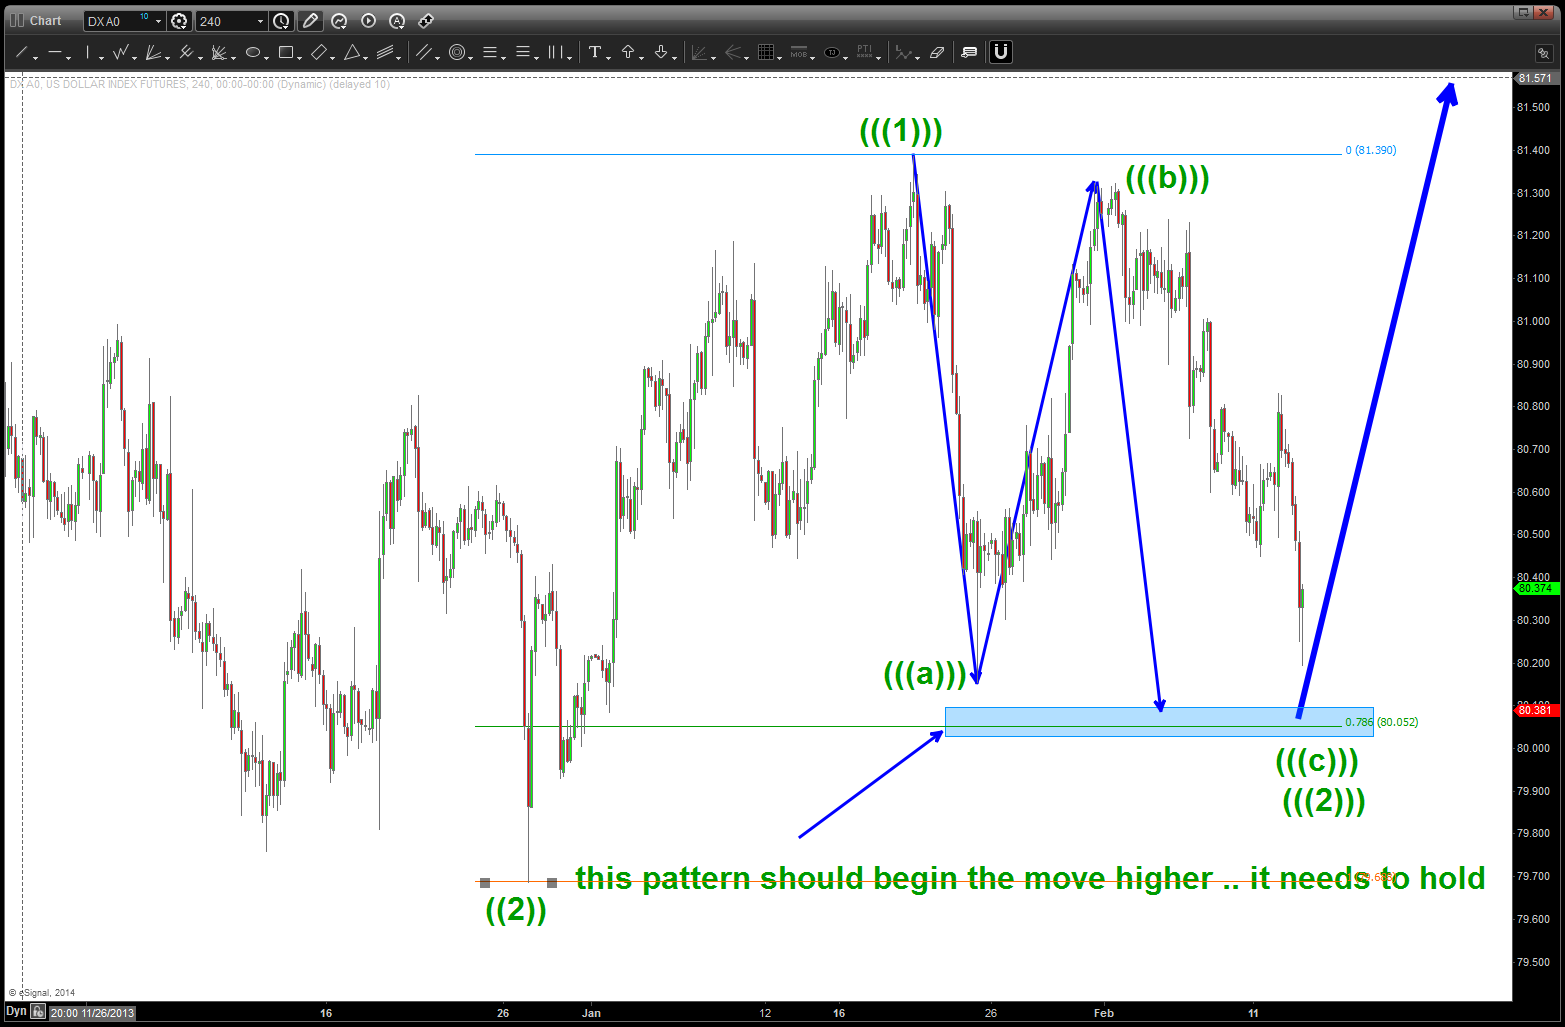
BULLISH BUY PATTERN PRESENT]
the last BULLISH PATTERN present …
PATTERNS fail …they are an EDGE and over time they have been statistically proven to give us an edge. But, what if this pattern does fail? Take a close look at the following two charts … I have not shown this before, but we need to take into account the 5 wave move down from 121 and the .618 price projection — they are starting to form a huge B wave triangle. The 5 wave move into the low is a BIG BIG A and then current structure is forming a BEARISH TRIANGLE w/ the ‘c’ portion just completing (due to the exact nature of the .618 price projection) and ‘d’ and ‘e’ to come …also note the purple trend lines. One forms a head and shoulders and the other is showing the support for the US Dollar since the ‘b’ wave low …
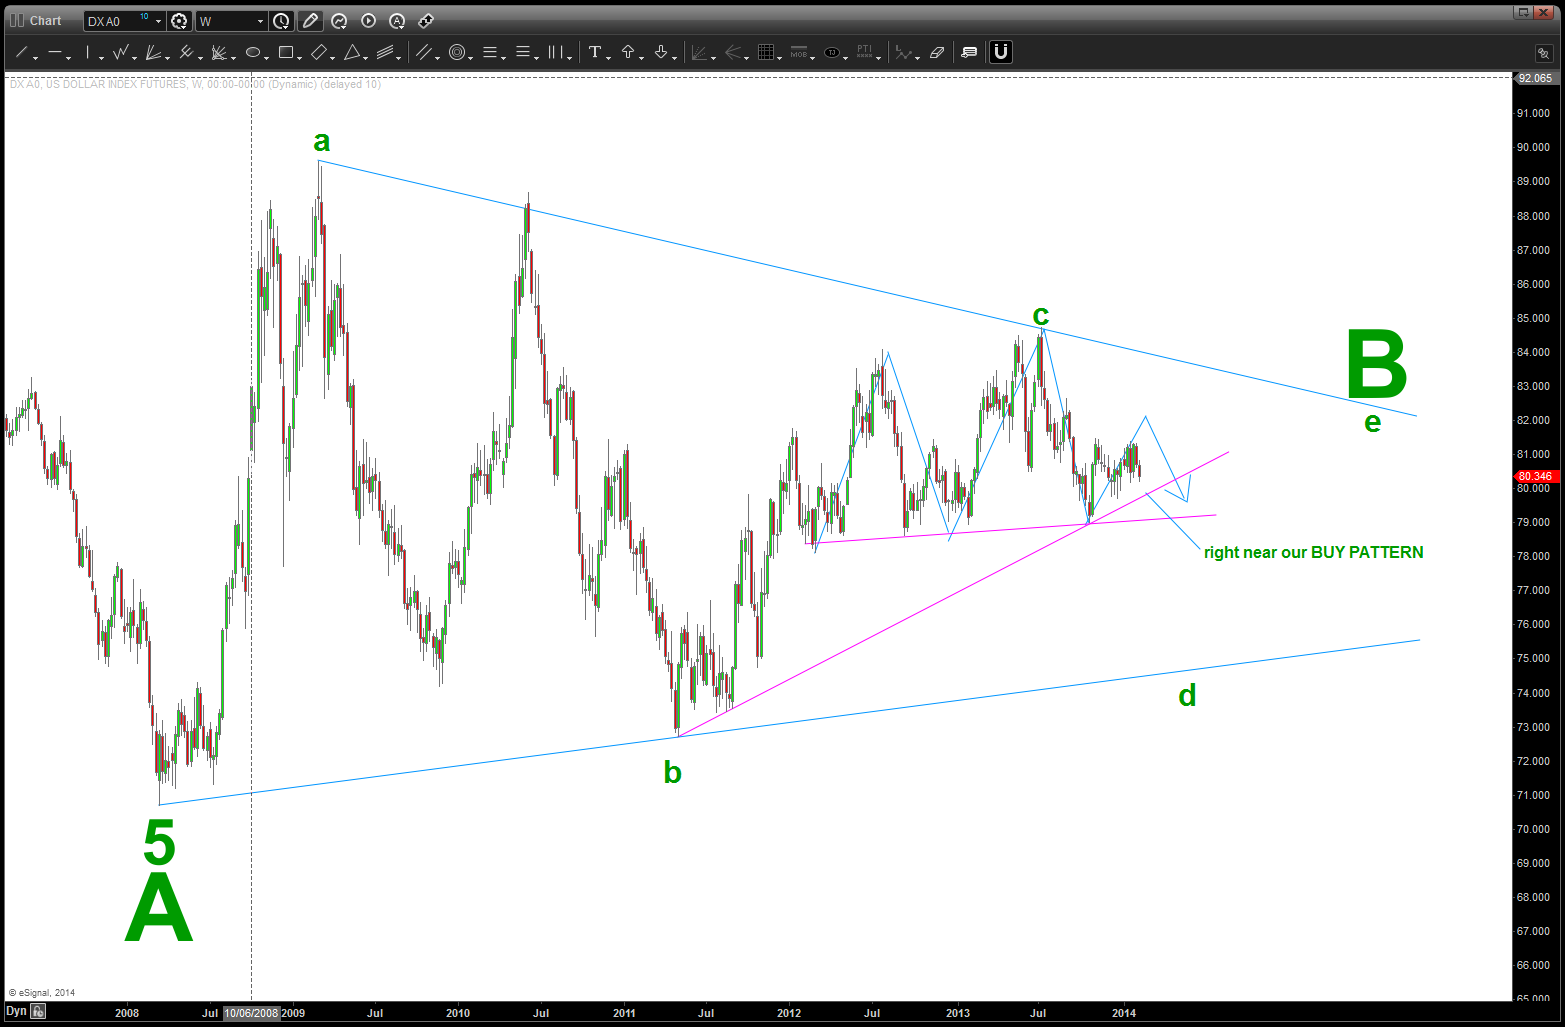
do we have a multi year bearish triangle forming?
here’s one last thing to consider …. take note of the measured move UP move from the past and what happened after it completed … a bearish omen?
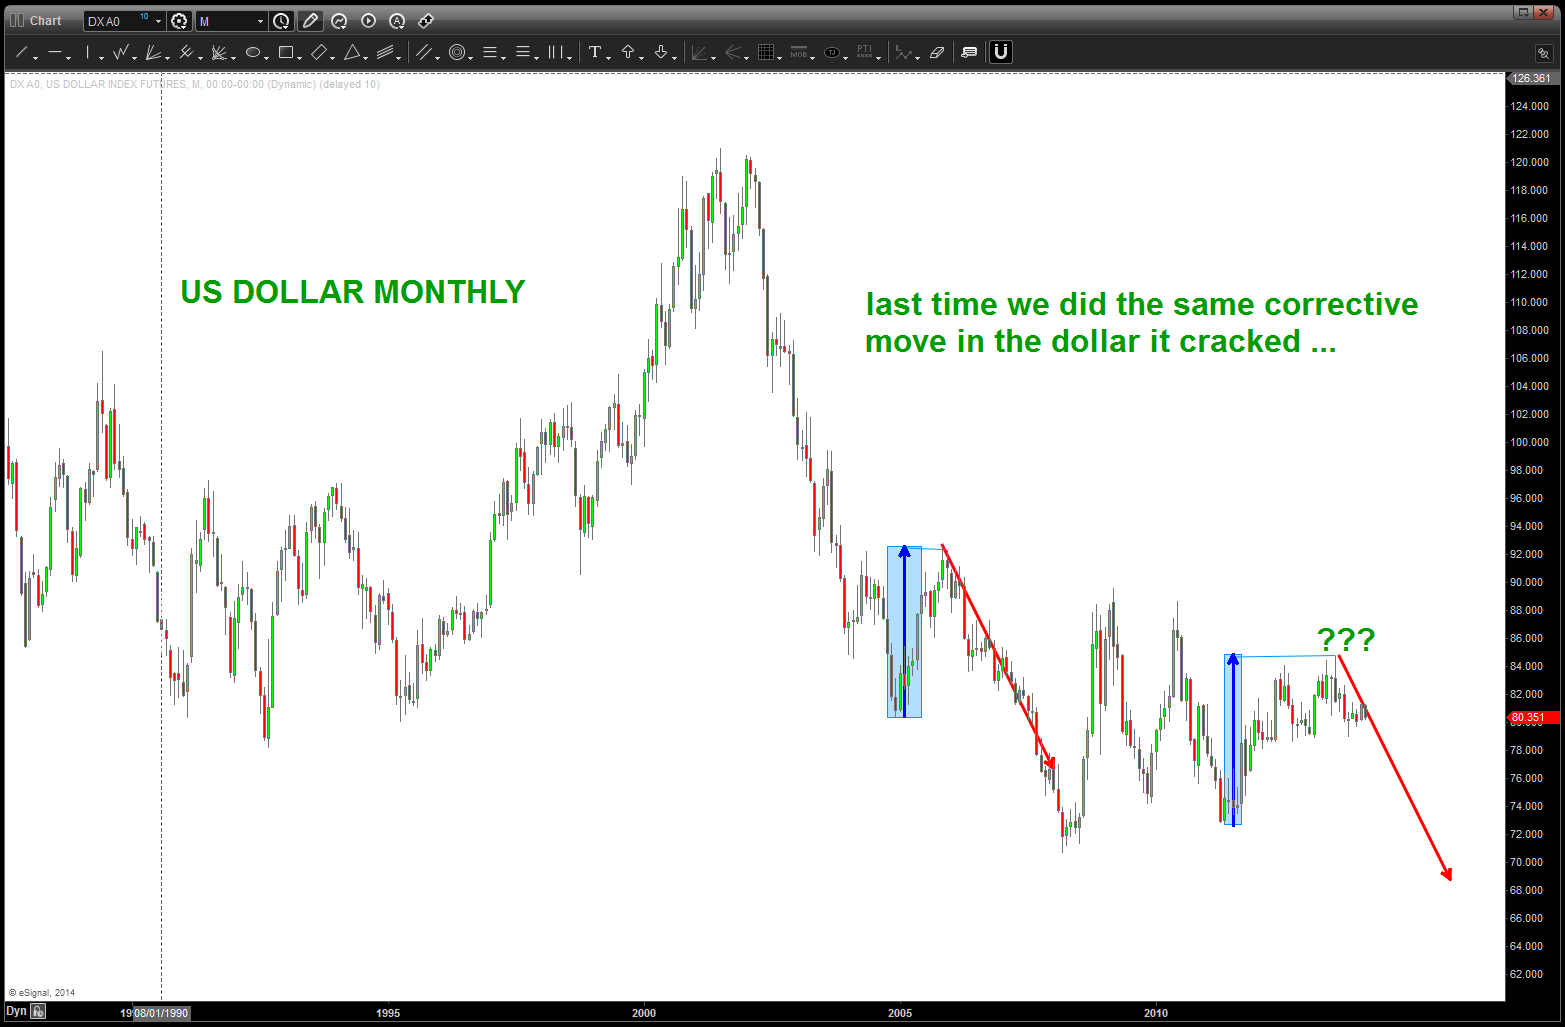
a measure move omen ?
CLIFF NOTES:
- w/ the deflationary forces present, the dollar SHOULD strengthen. A well formed count supports that and a PATTERN very very close also holds that thesis as correct and positive. The first is the once completing at 80.05 on a shorter time frame and then 79.53 on the daily. They need to hold – w/ the 79.53 as the major pattern if the bullish thesis is correct. Remember, w/ our rules we could go all the way down to 79 again so, for all intensive purposes the 79 level is the line in the sand. We have two symmetrical BUY patterns present …
- HOWEVER, if we lose the 79.53 level THEN it will open up some serious selling. PATTERNS will then shift to the B wave triangle thesis …
- Last, we have MAJOR patterns complete across the indices and they are “acting” like the double tops that formed in 2000 and 2007. We have the Dow Jones Transports finishing a pattern from the late 1800’s, we have a potential generational low in interest rates complete and PATTERNS suggest one more wave lower in the commodities …
It’s all coming together and one of the circle of life gorilla’s is going to drop their stick of dynamite and big old explosion is going to occur …
