GFI – Gold Fields – March 24, 2025
Posted on March 24, 2025 Leave a Comment

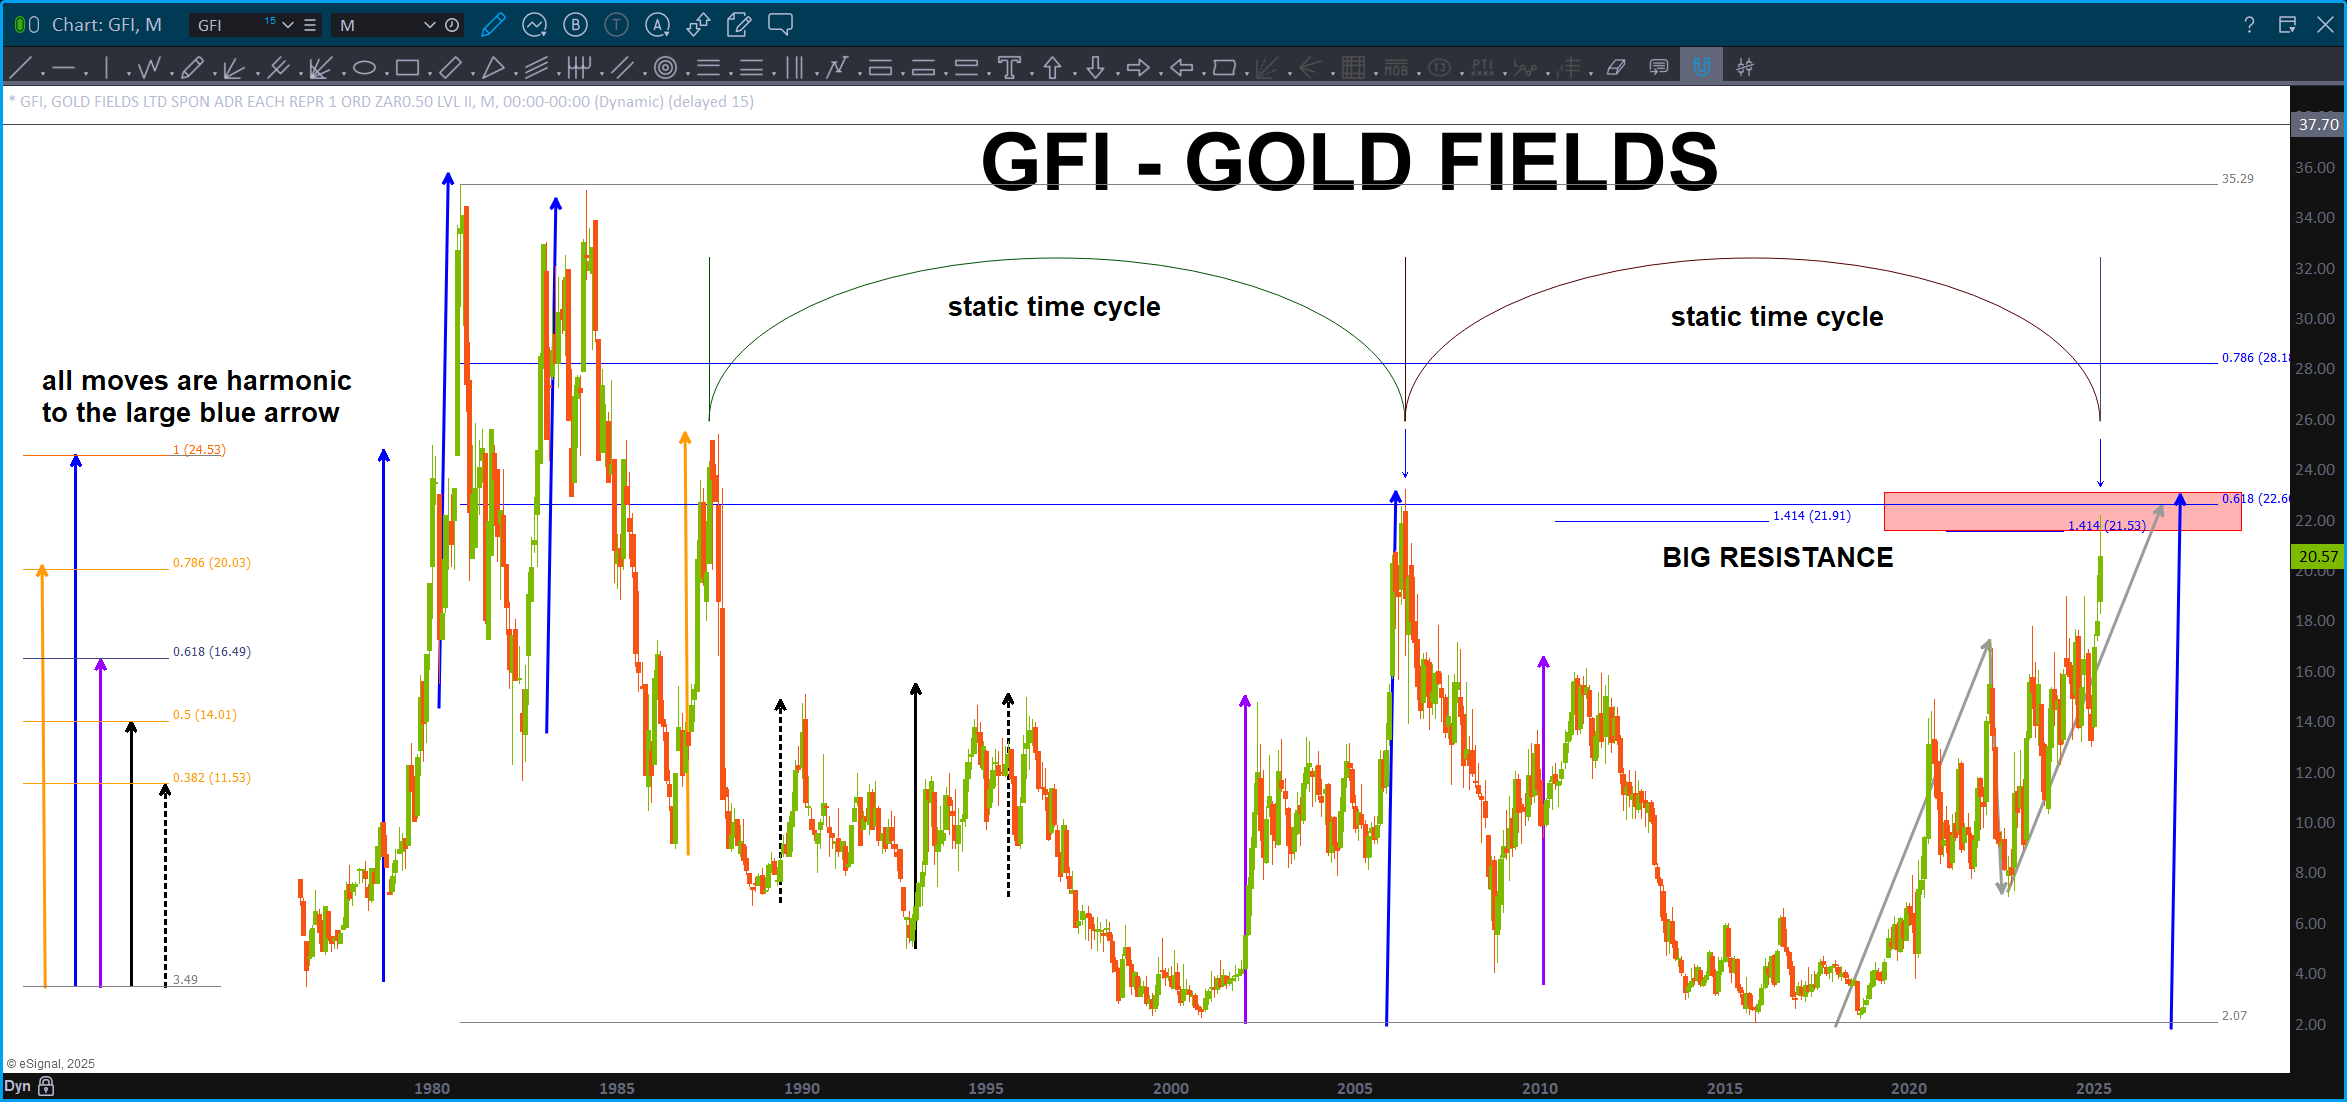
Note the harmony of all the moves … all from the ‘large blue’ arrow. You realize, now, that it could be any of the moves as they are all FRACTALS of each other based on Metatron’s Cube and the Giza Complex. I’m not kidding ..
Speaking of the Pyramids, again (yes, I know), did you know that the entire Giza complex is laid out according to Metatron’s Cube? Yup … I bring all this up because me and my friend/journeyman, Ponch, had Mr. Alan Green on the No Way Out podcast and we discussed the REAL (yes I just typed that) message of the America Codes. Will you all do me a favor and LISTEN TO IT! It’s so powerful …
Somewhat puts what was ‘supposedly’ discovered underneath the Pyramids in perspective.
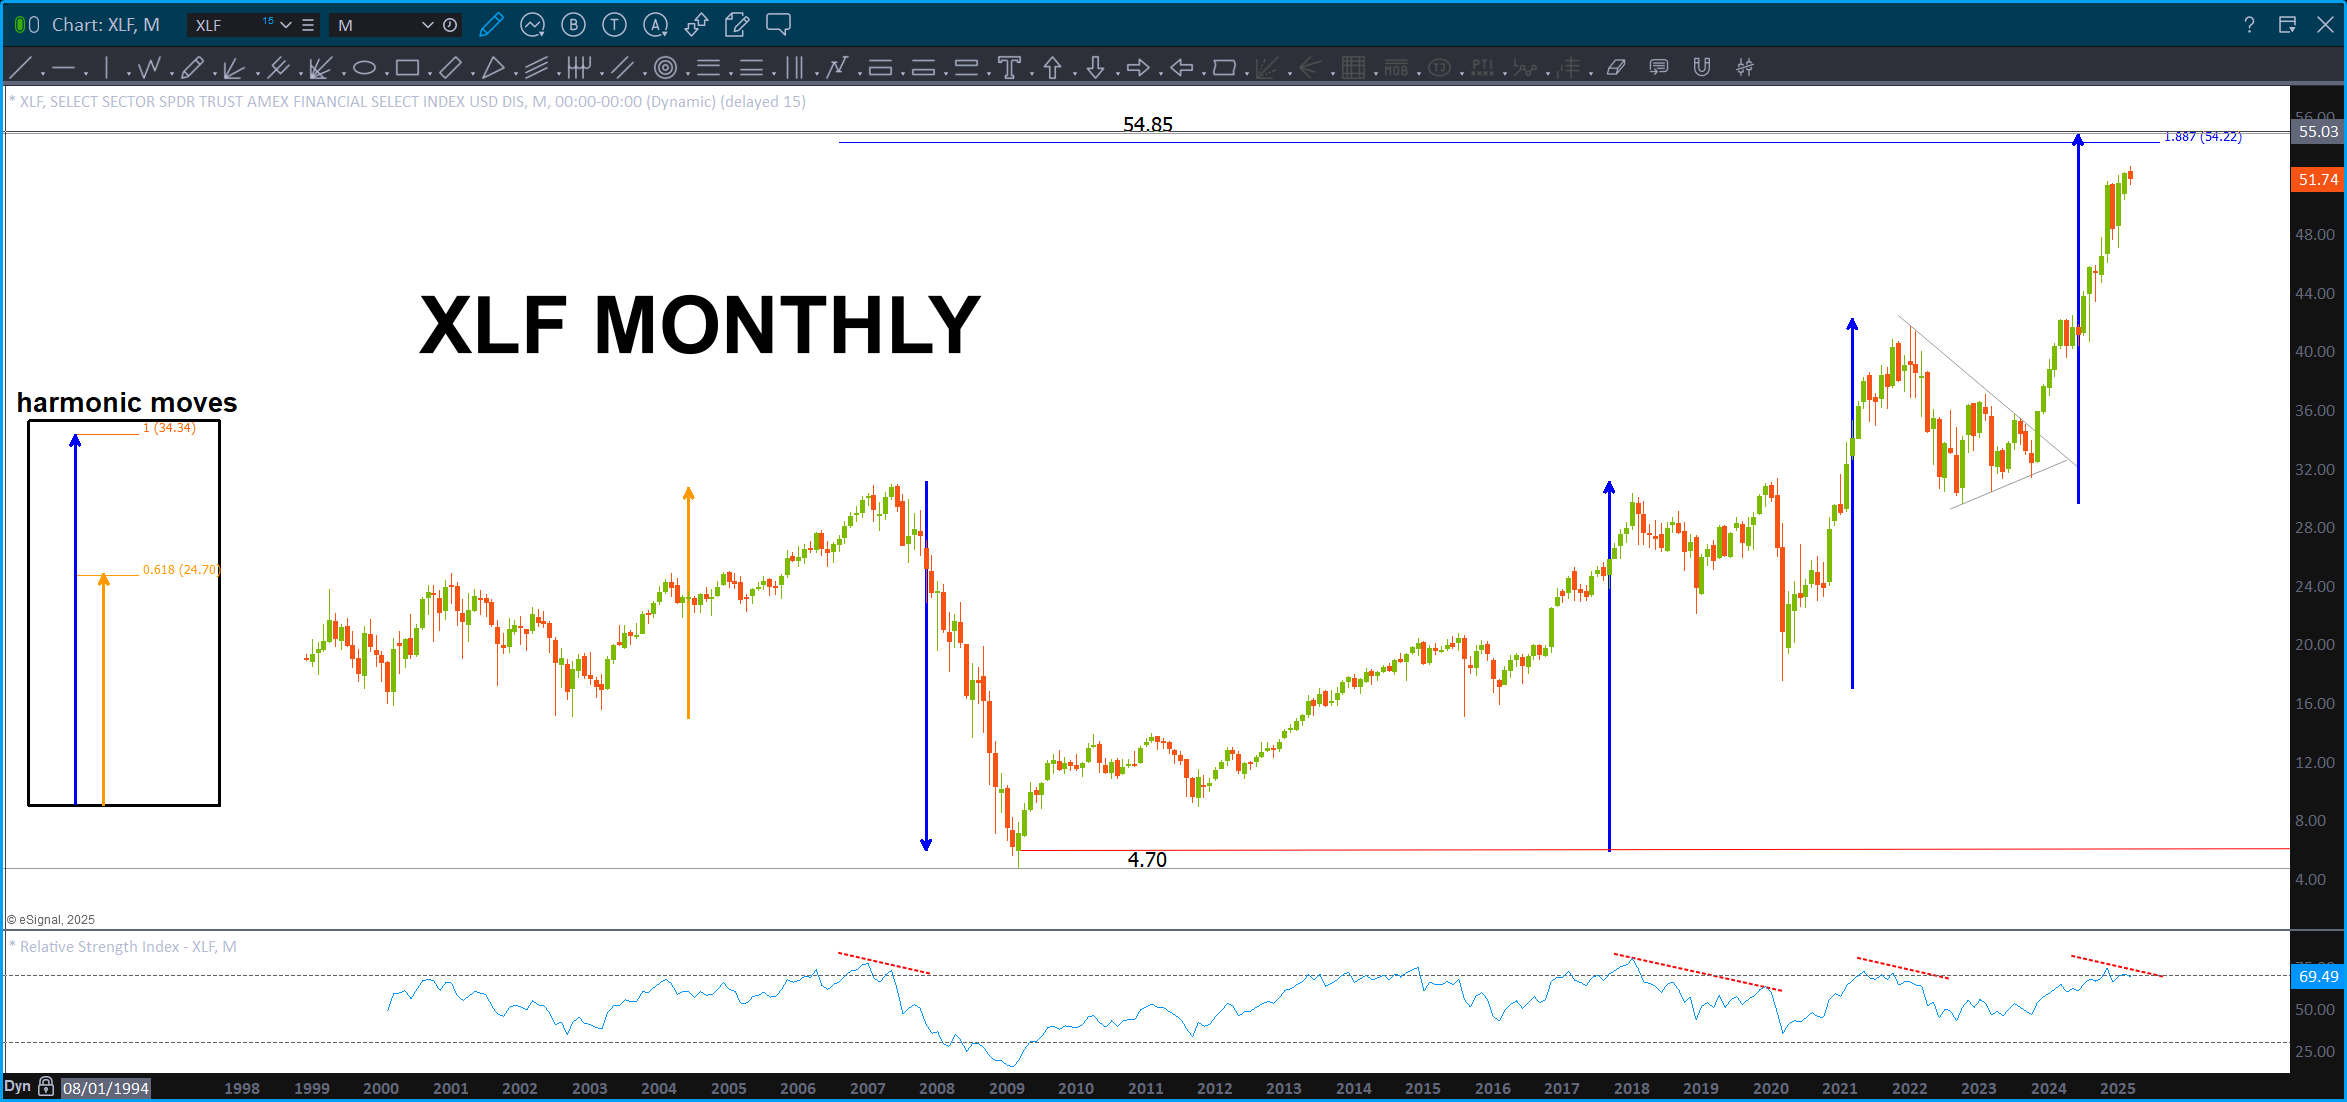
GFI – Should be banging into some big resistance. “Should” is always the operative word, you all know that, but w/ the ‘grey’ projection, into the measured move and a .618 retrace w/ the square root of 2 extensions (1.4142) along w/ the ‘static’ monthly time cycle … I’m thinking it hits a brick wall.
Now, if it gaps and goes …this puppy could really run. The probability (and that’s all it is) is it does what it’s always done once it completes the long big blue arrow – corrects or ends a move.
Gold and Silver- March 20, 2025
Posted on March 20, 2025 Leave a Comment

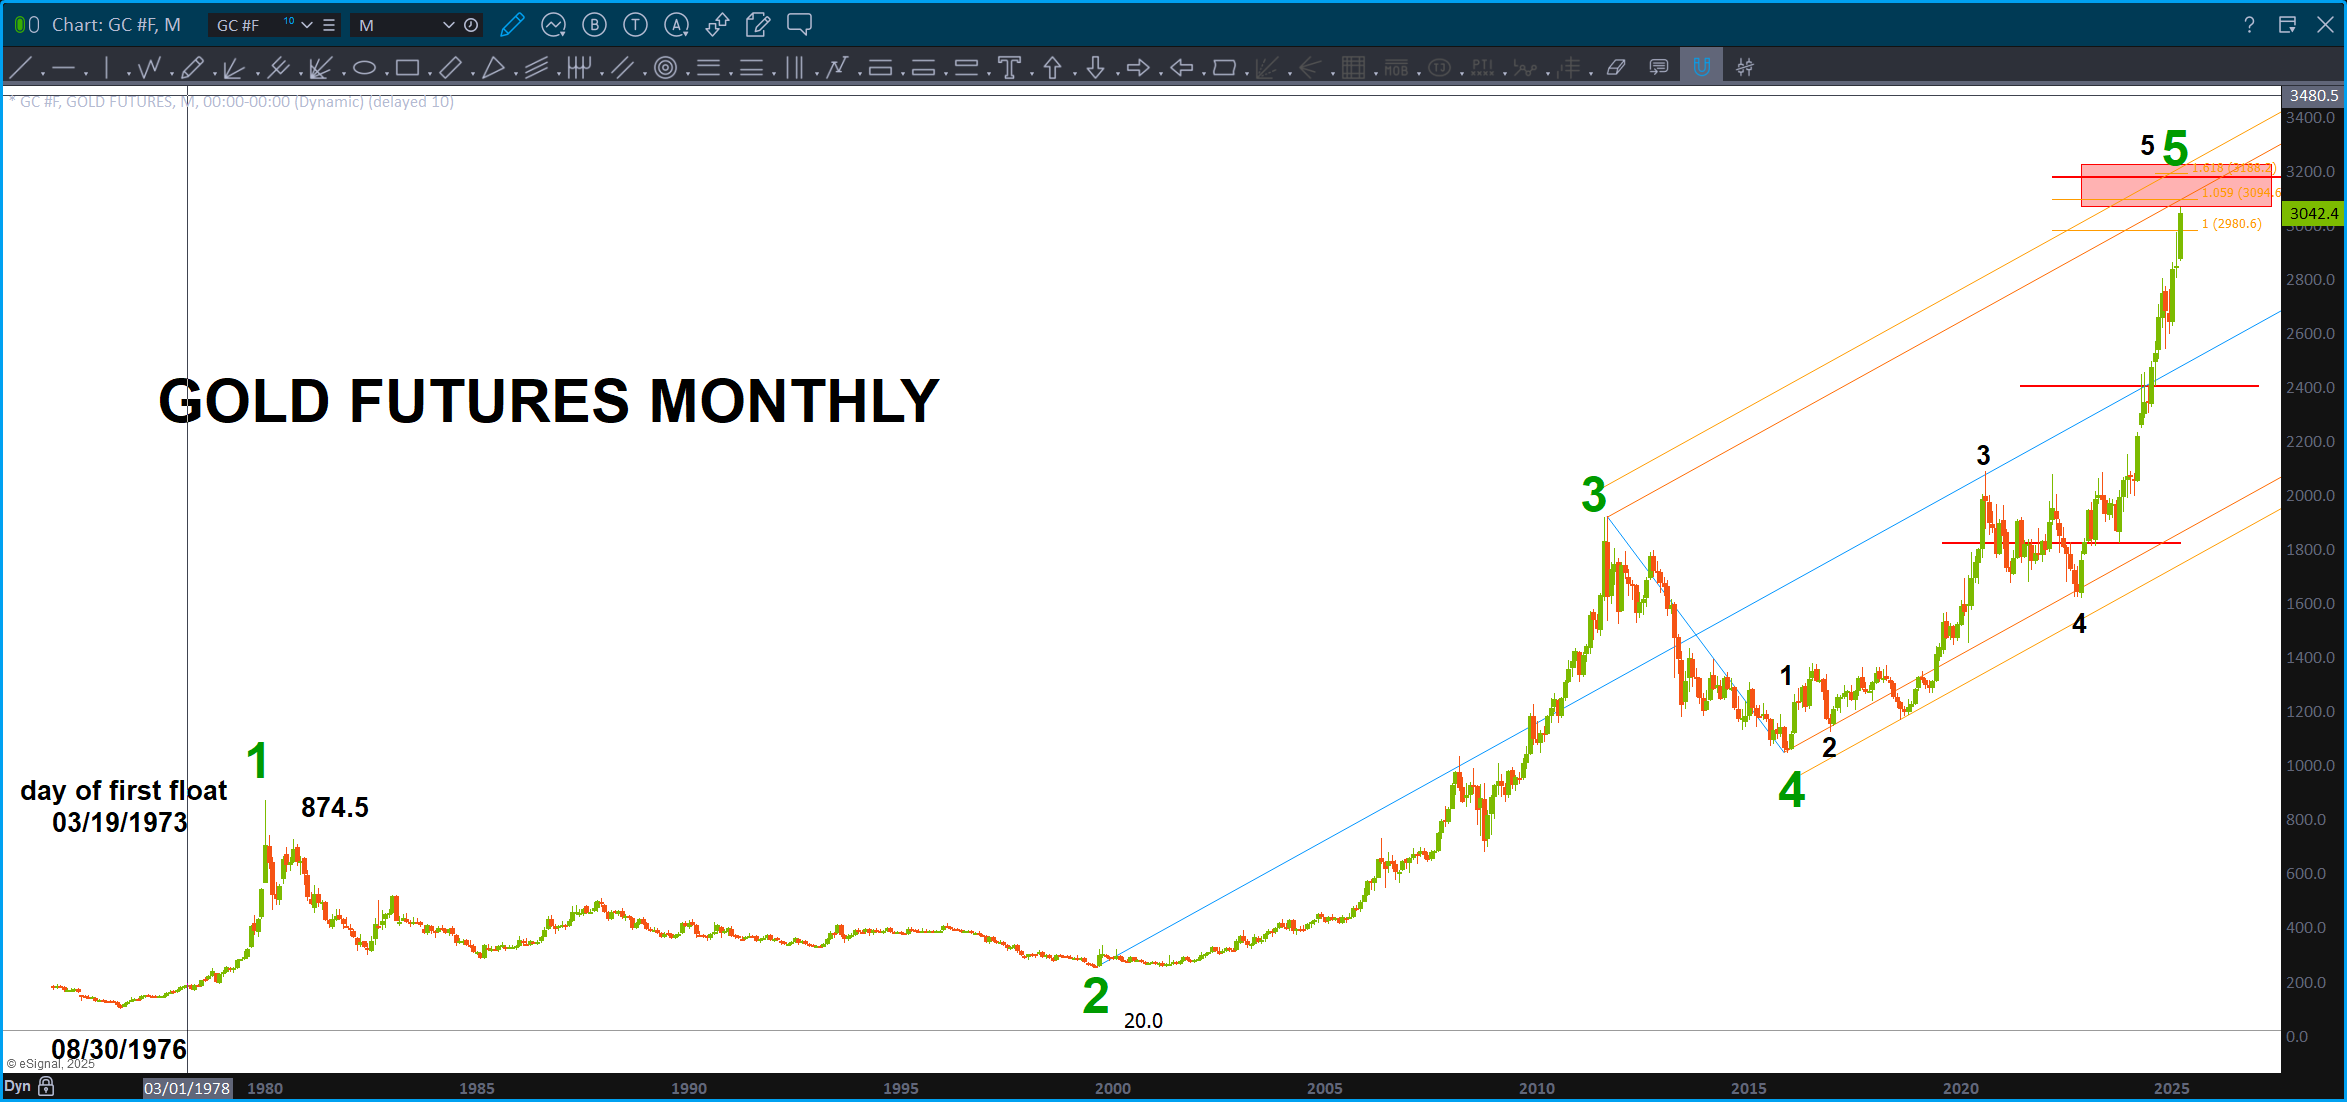
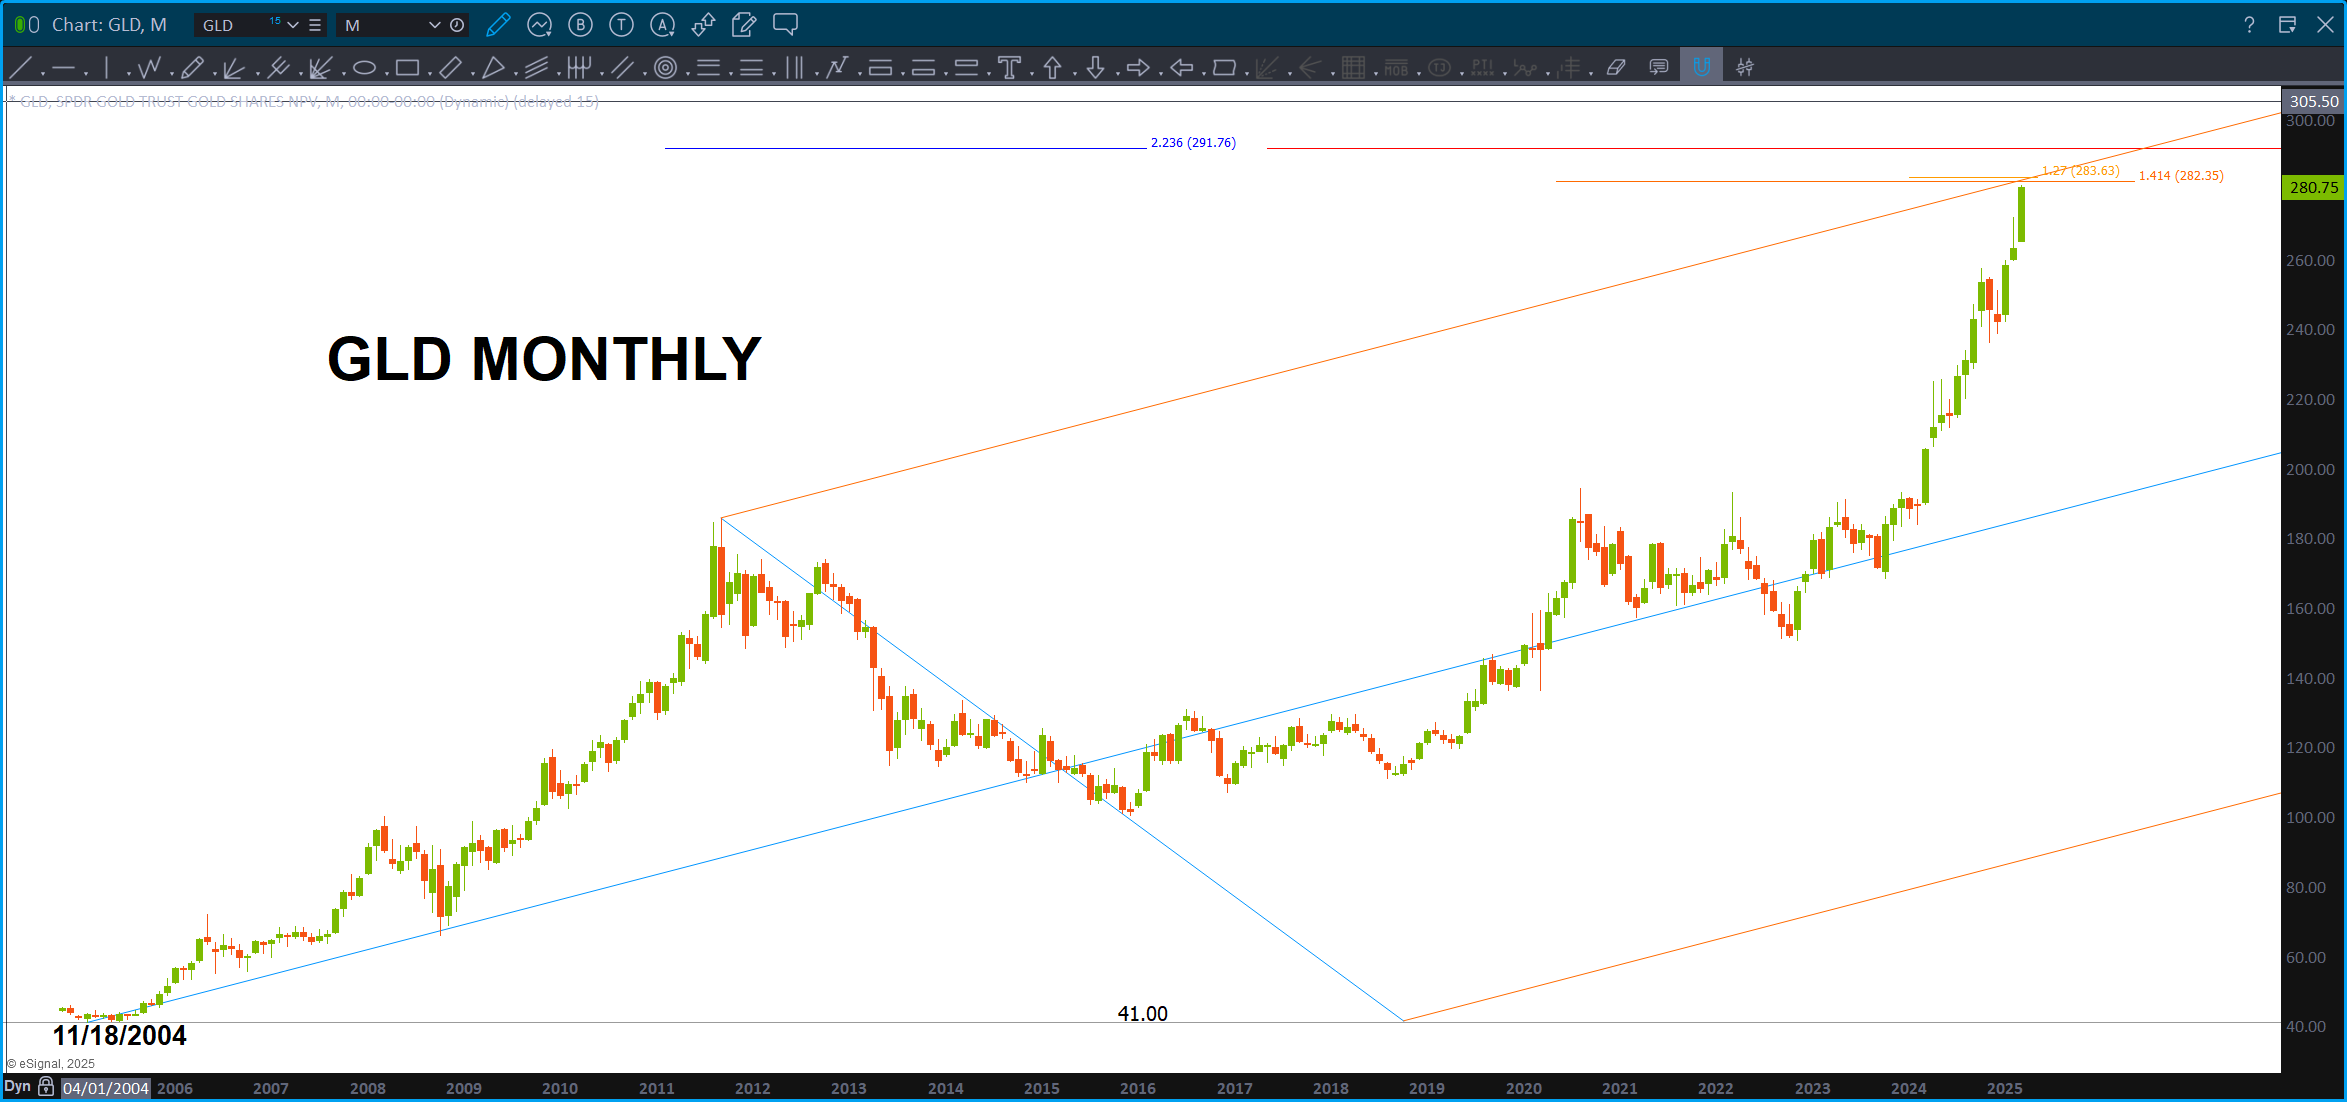
Gold is strong and might never come down … yes, that’s what it seems like but as Mr. Larry P always says “trade what you see.”
I see a LONG TERM pattern completing/completed. Note, often times, the market will pierce thru the ABCD and continue up to 1.05946AB=CD. The 12th root of 2 is 1.05946 and that is the ratio we use to move up and down the equal octave scale of music.
I would not short, nor take profit, until we get a weekly or, dare I say, monthly signal reversal candle (SRC) The SRC being in this case, when the low of the candle that made the high is taken out to the downside on a weekly or monthly close. No need to step into the freight train, but the pattern is there so only time will tell.
Nobody in their right mind (is mine right? :)) believes in shorting gold but just calling it like I see it.
Cheers – B
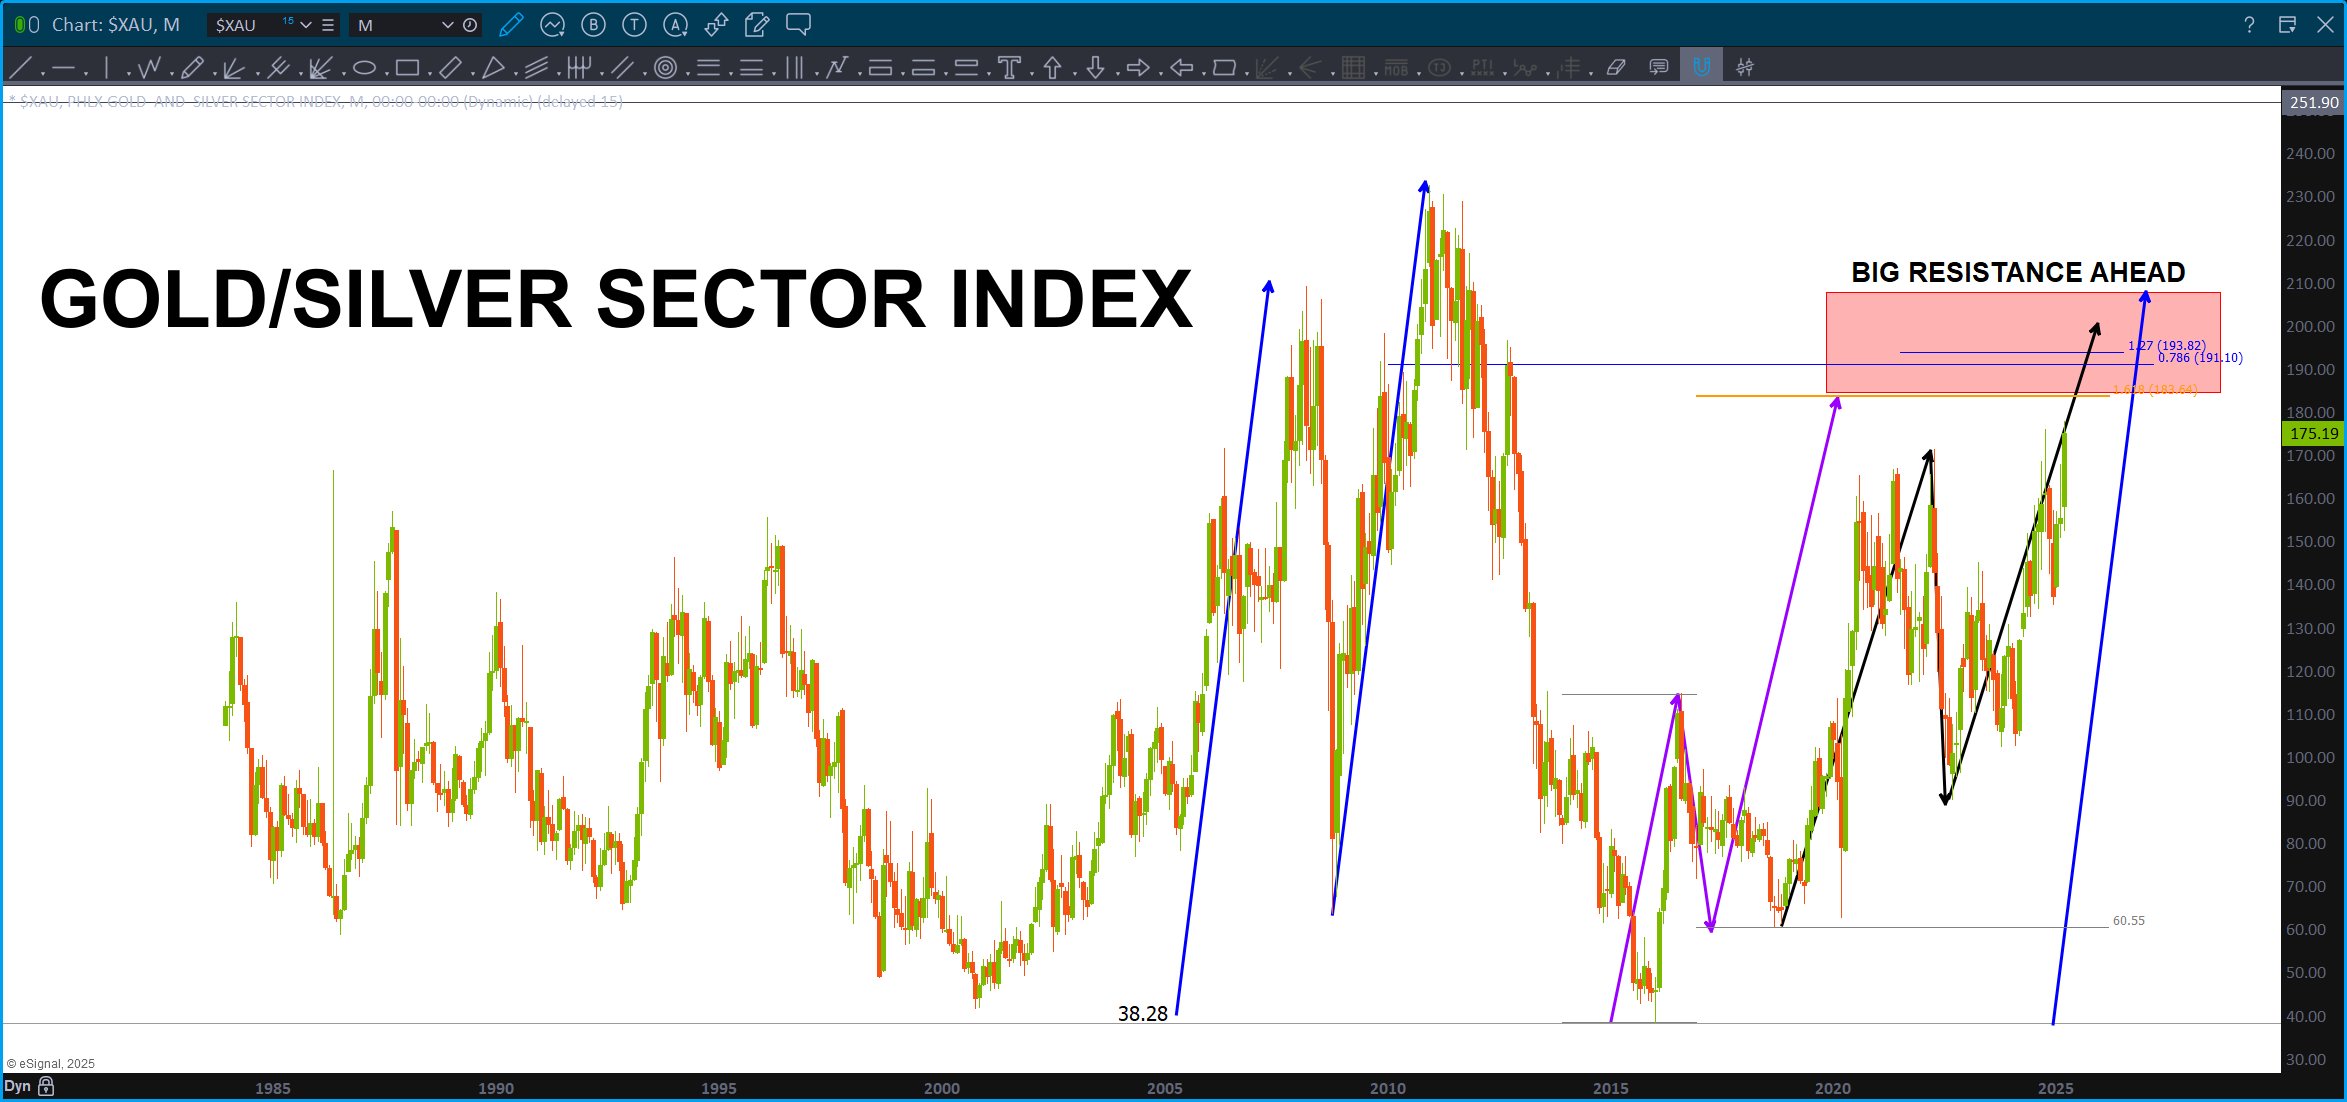
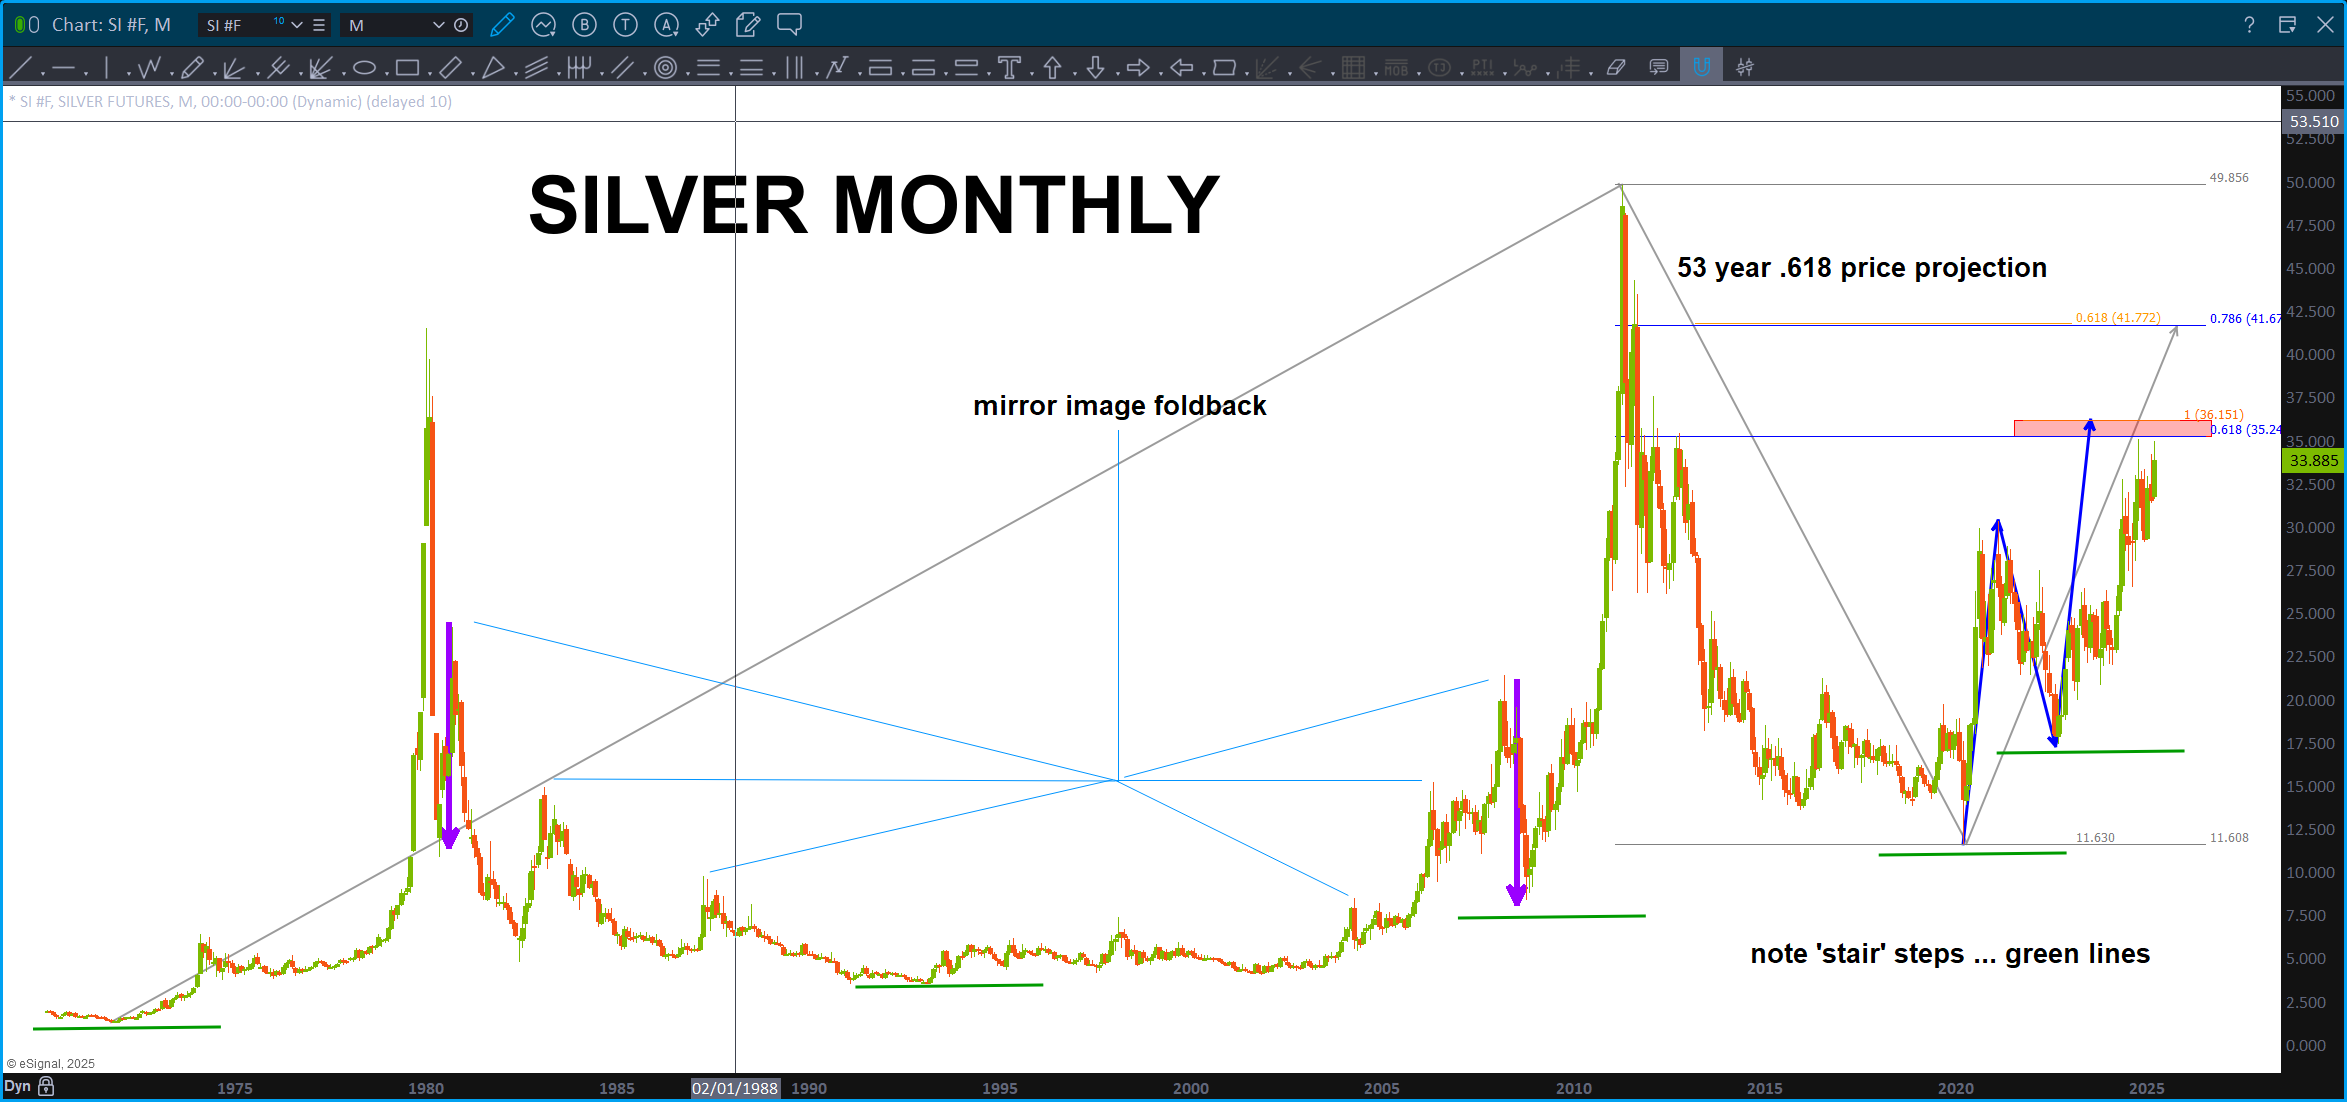
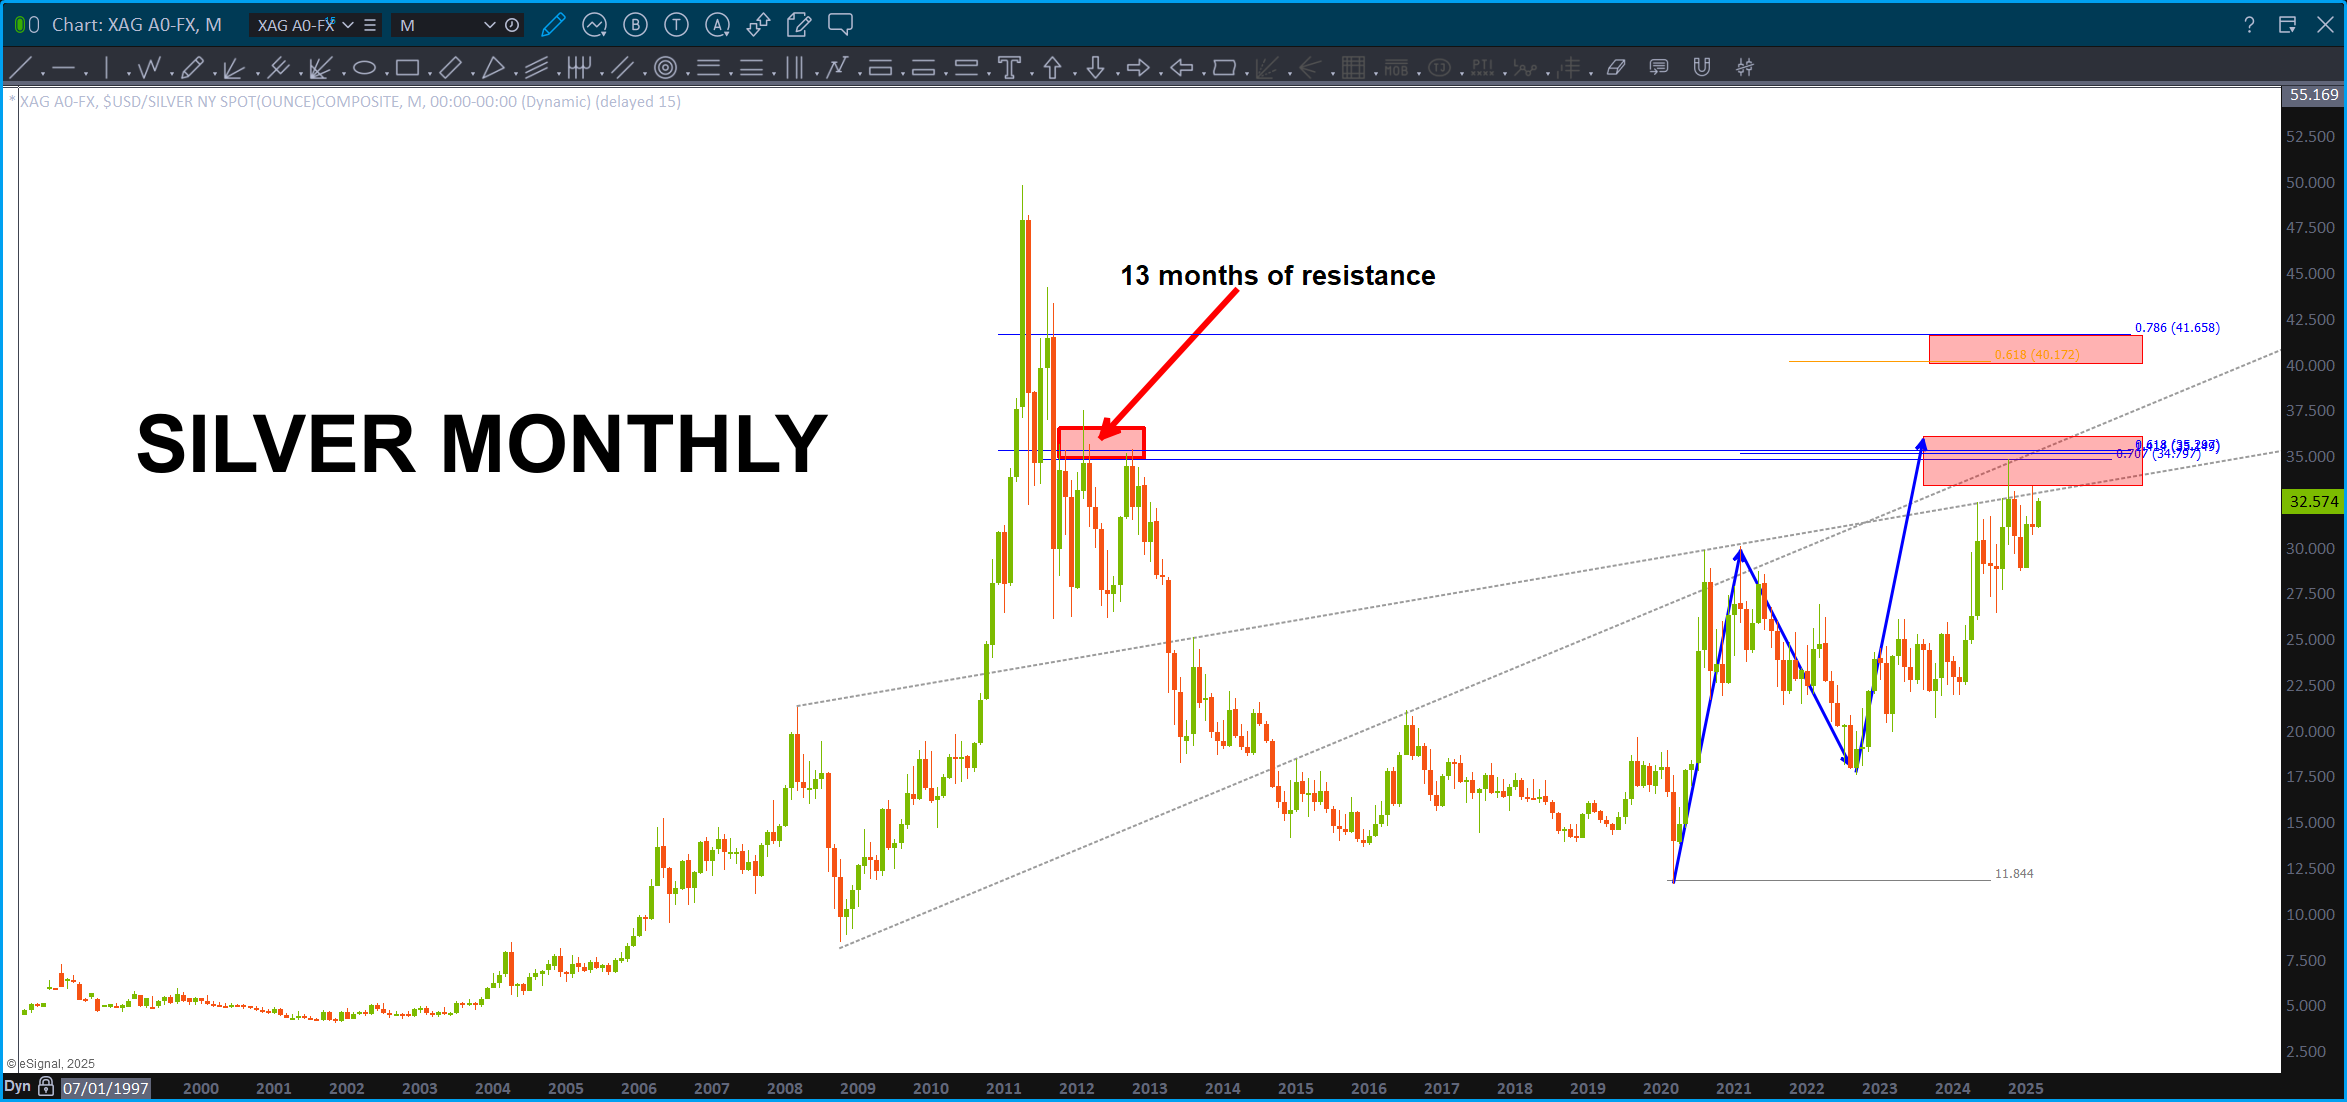
Last but not least, the silver market is not even close to new highs and has/is completing a sell PATTERN.
Geometry – March 11, 2025
Posted on March 11, 2025 2 Comments

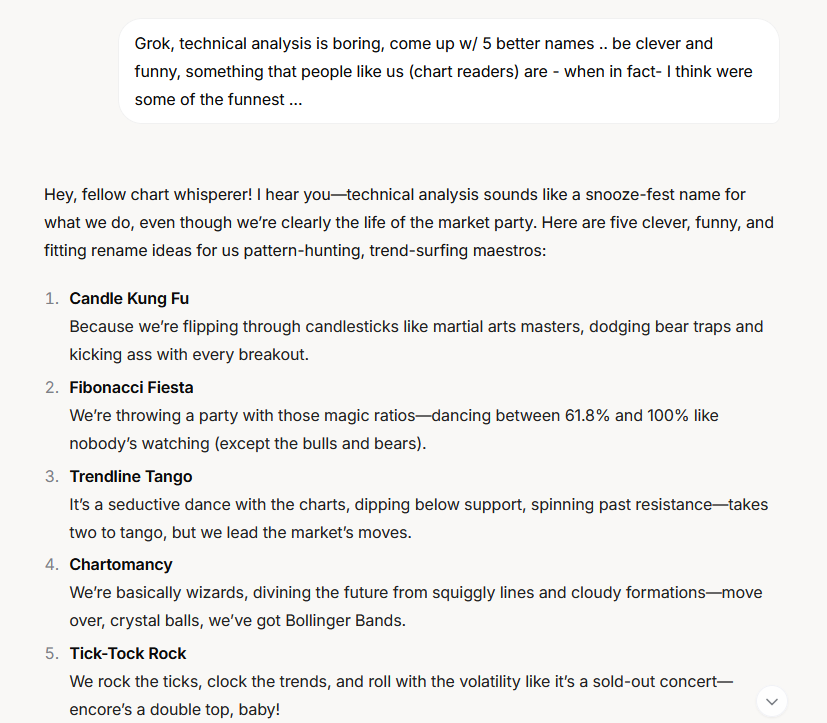
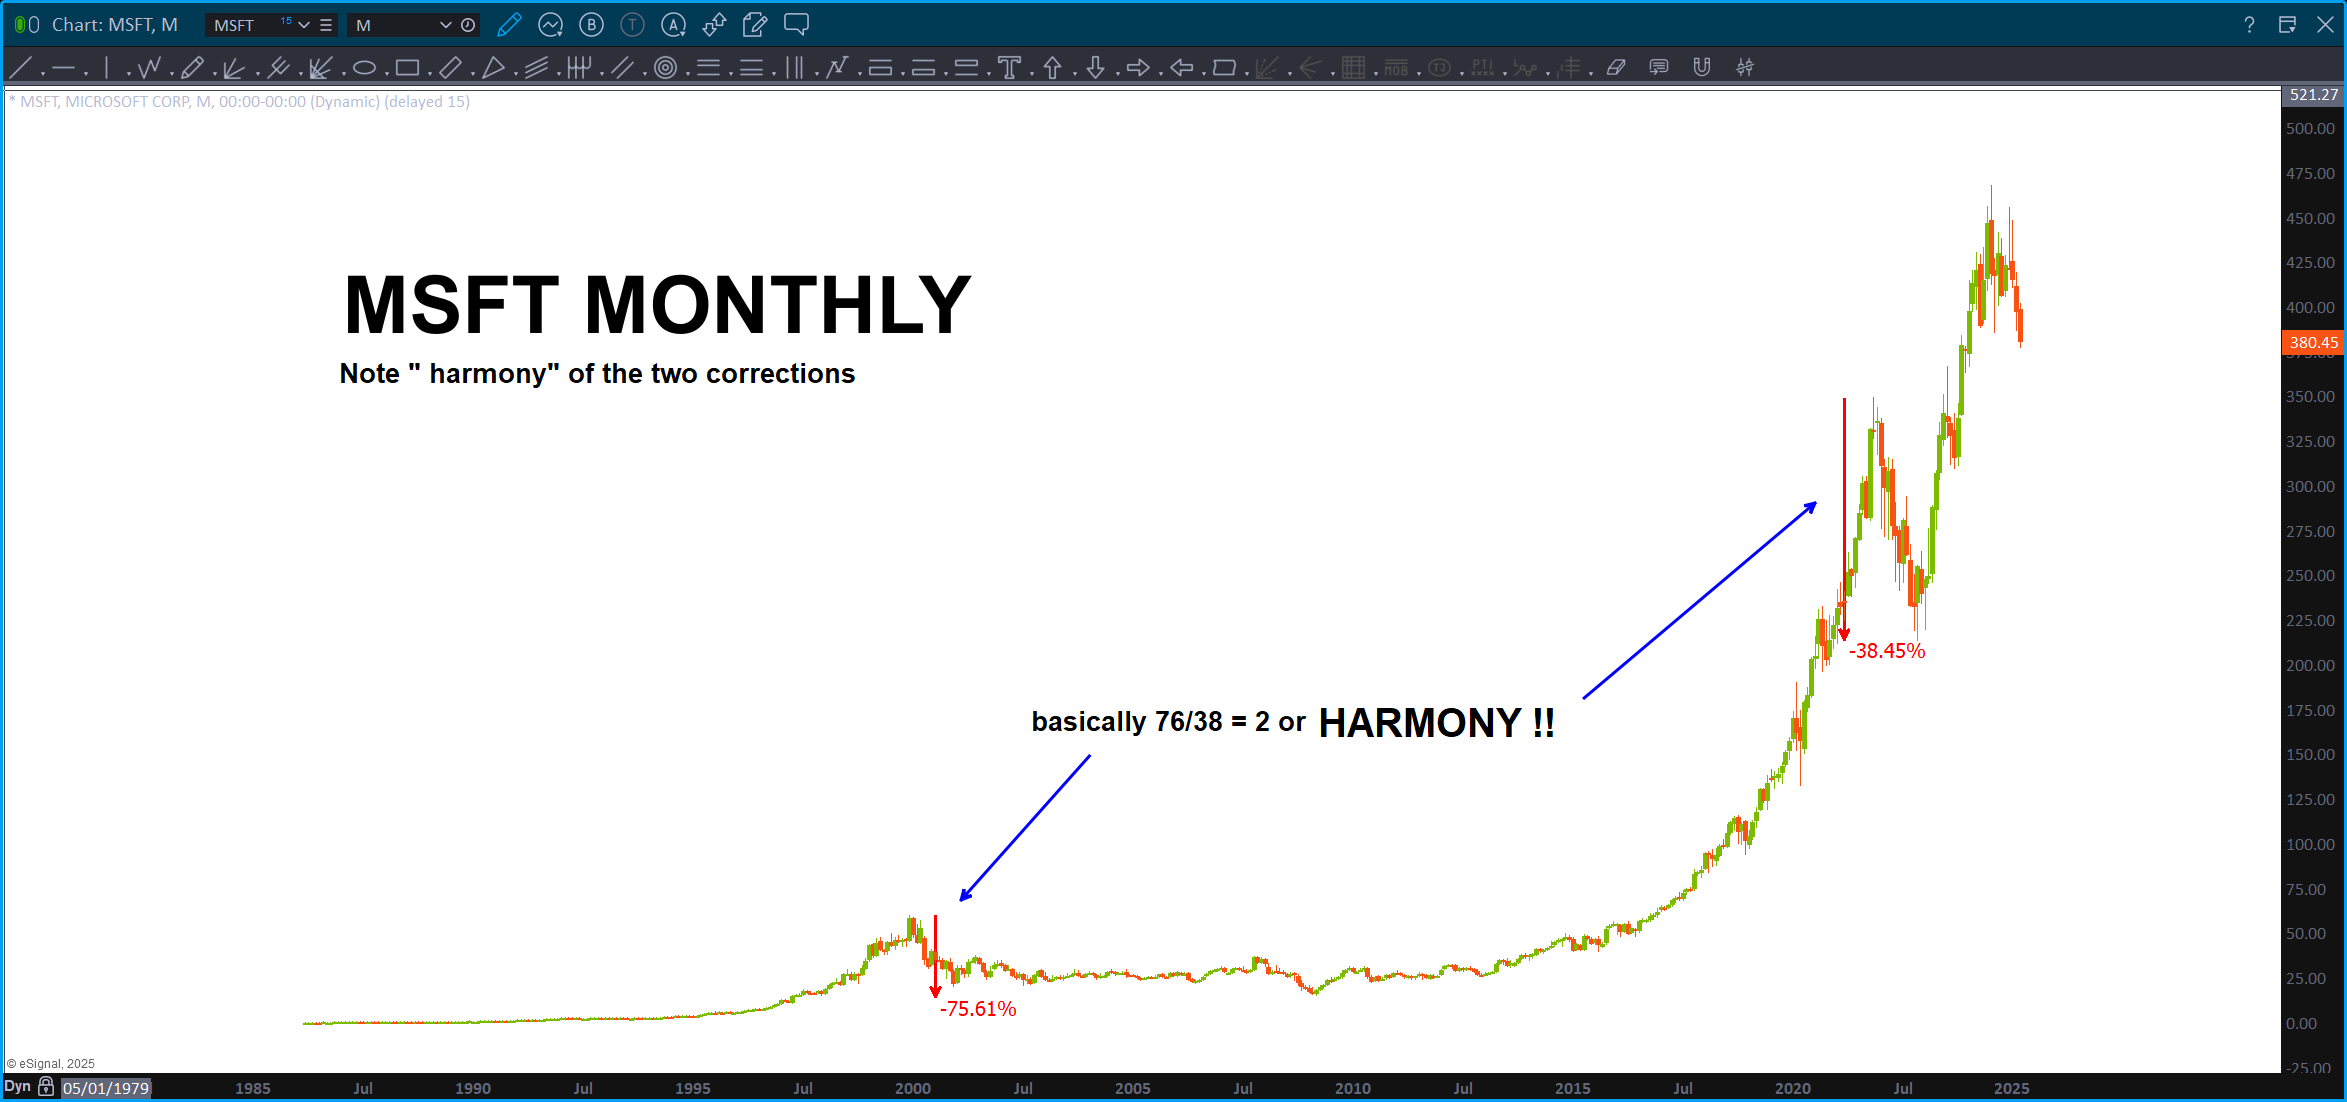
Tonight, I was taking a peak at MSFT and I was just in the zone and thought – this would be a good moment to post something fun – dare I say interesting – about the ‘right brain’ aspect of Technical Analysis? Man, we should come up w/ a different name …time out.
Back, time for some Fibonacci Fiesta …!
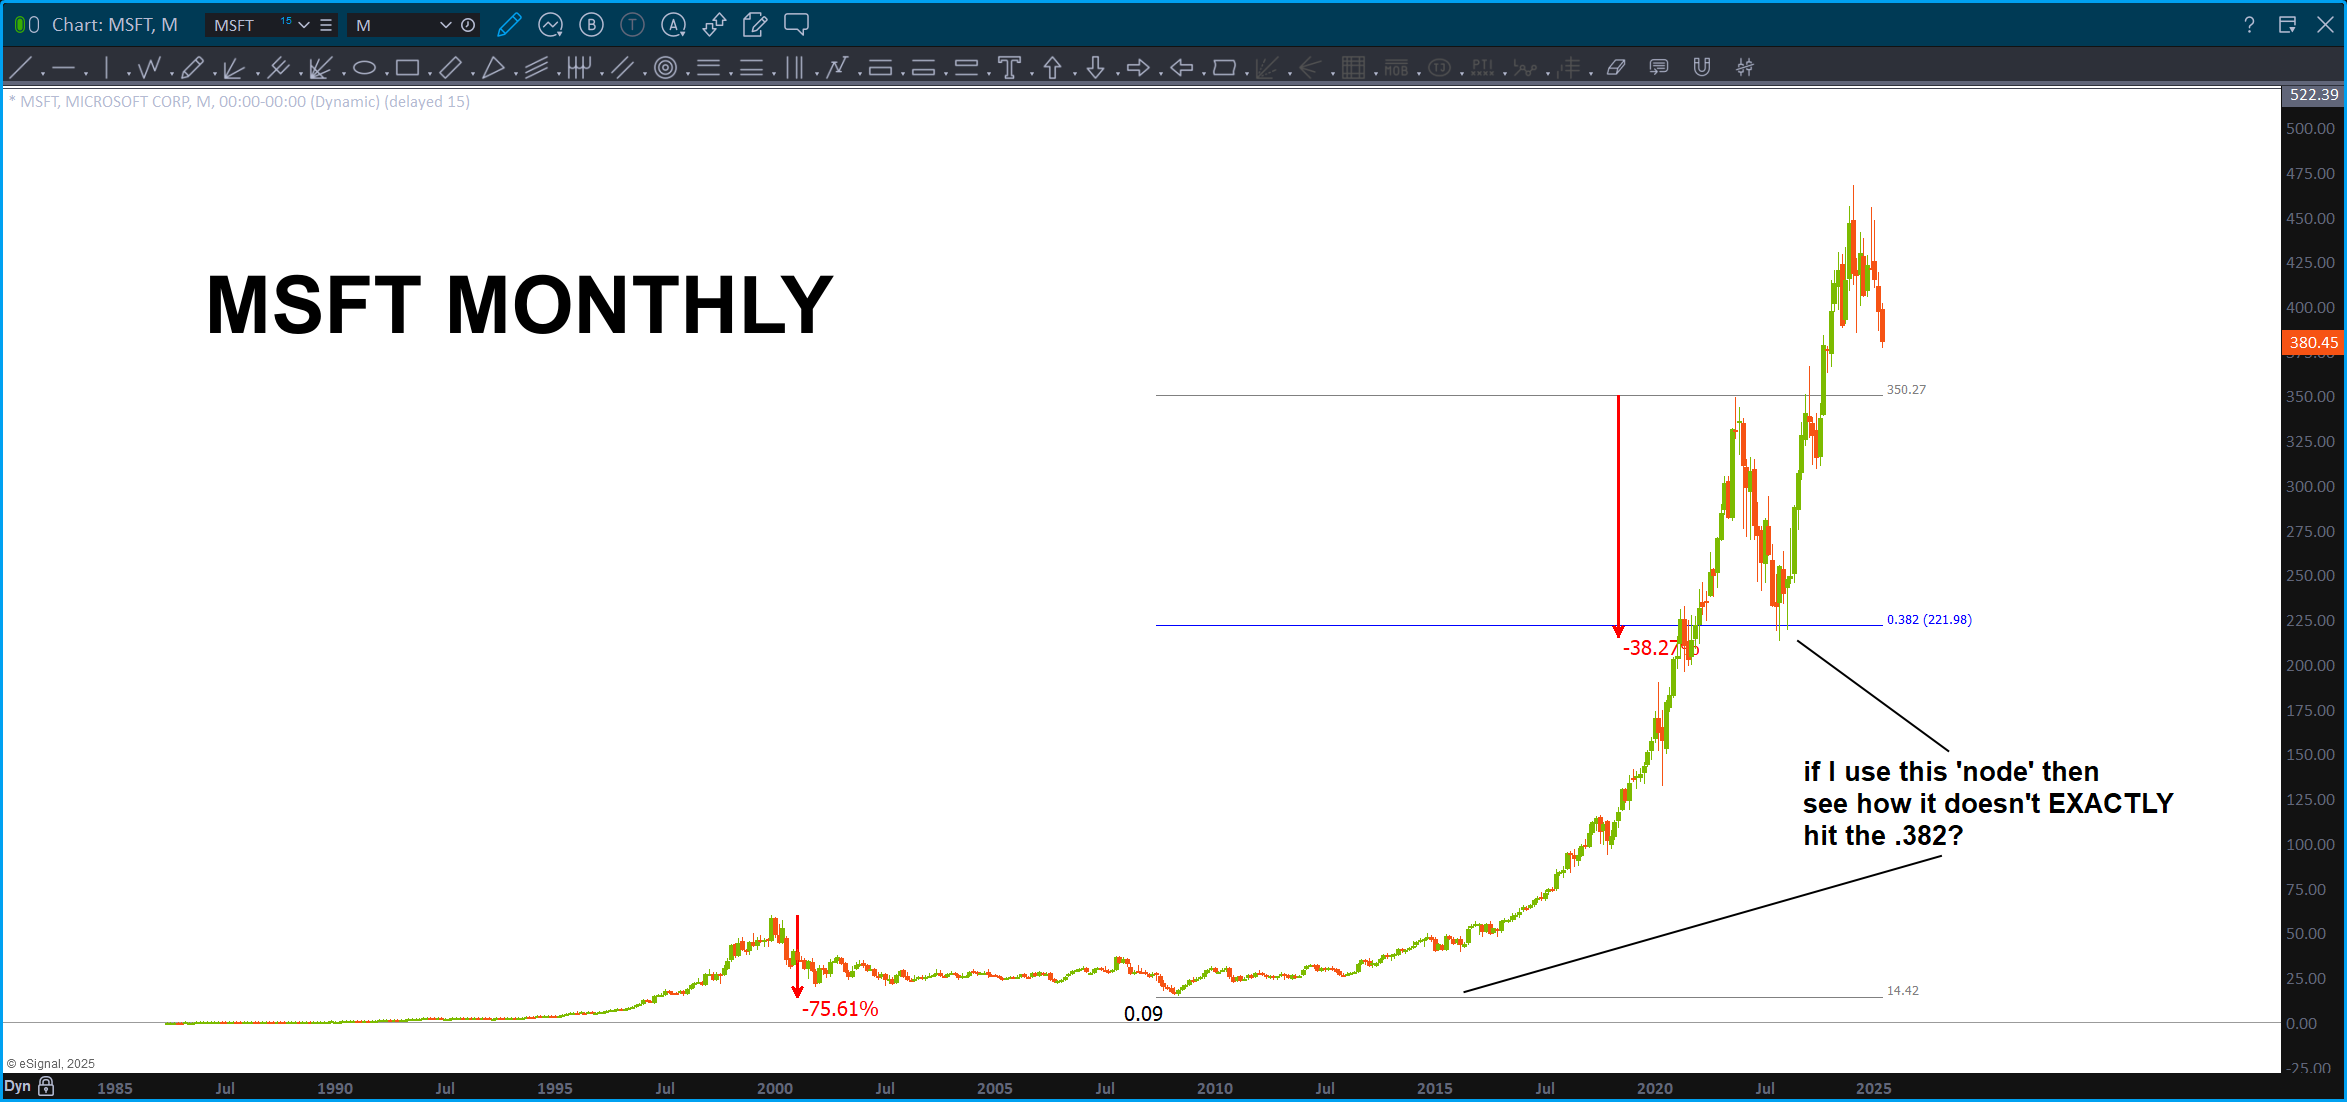
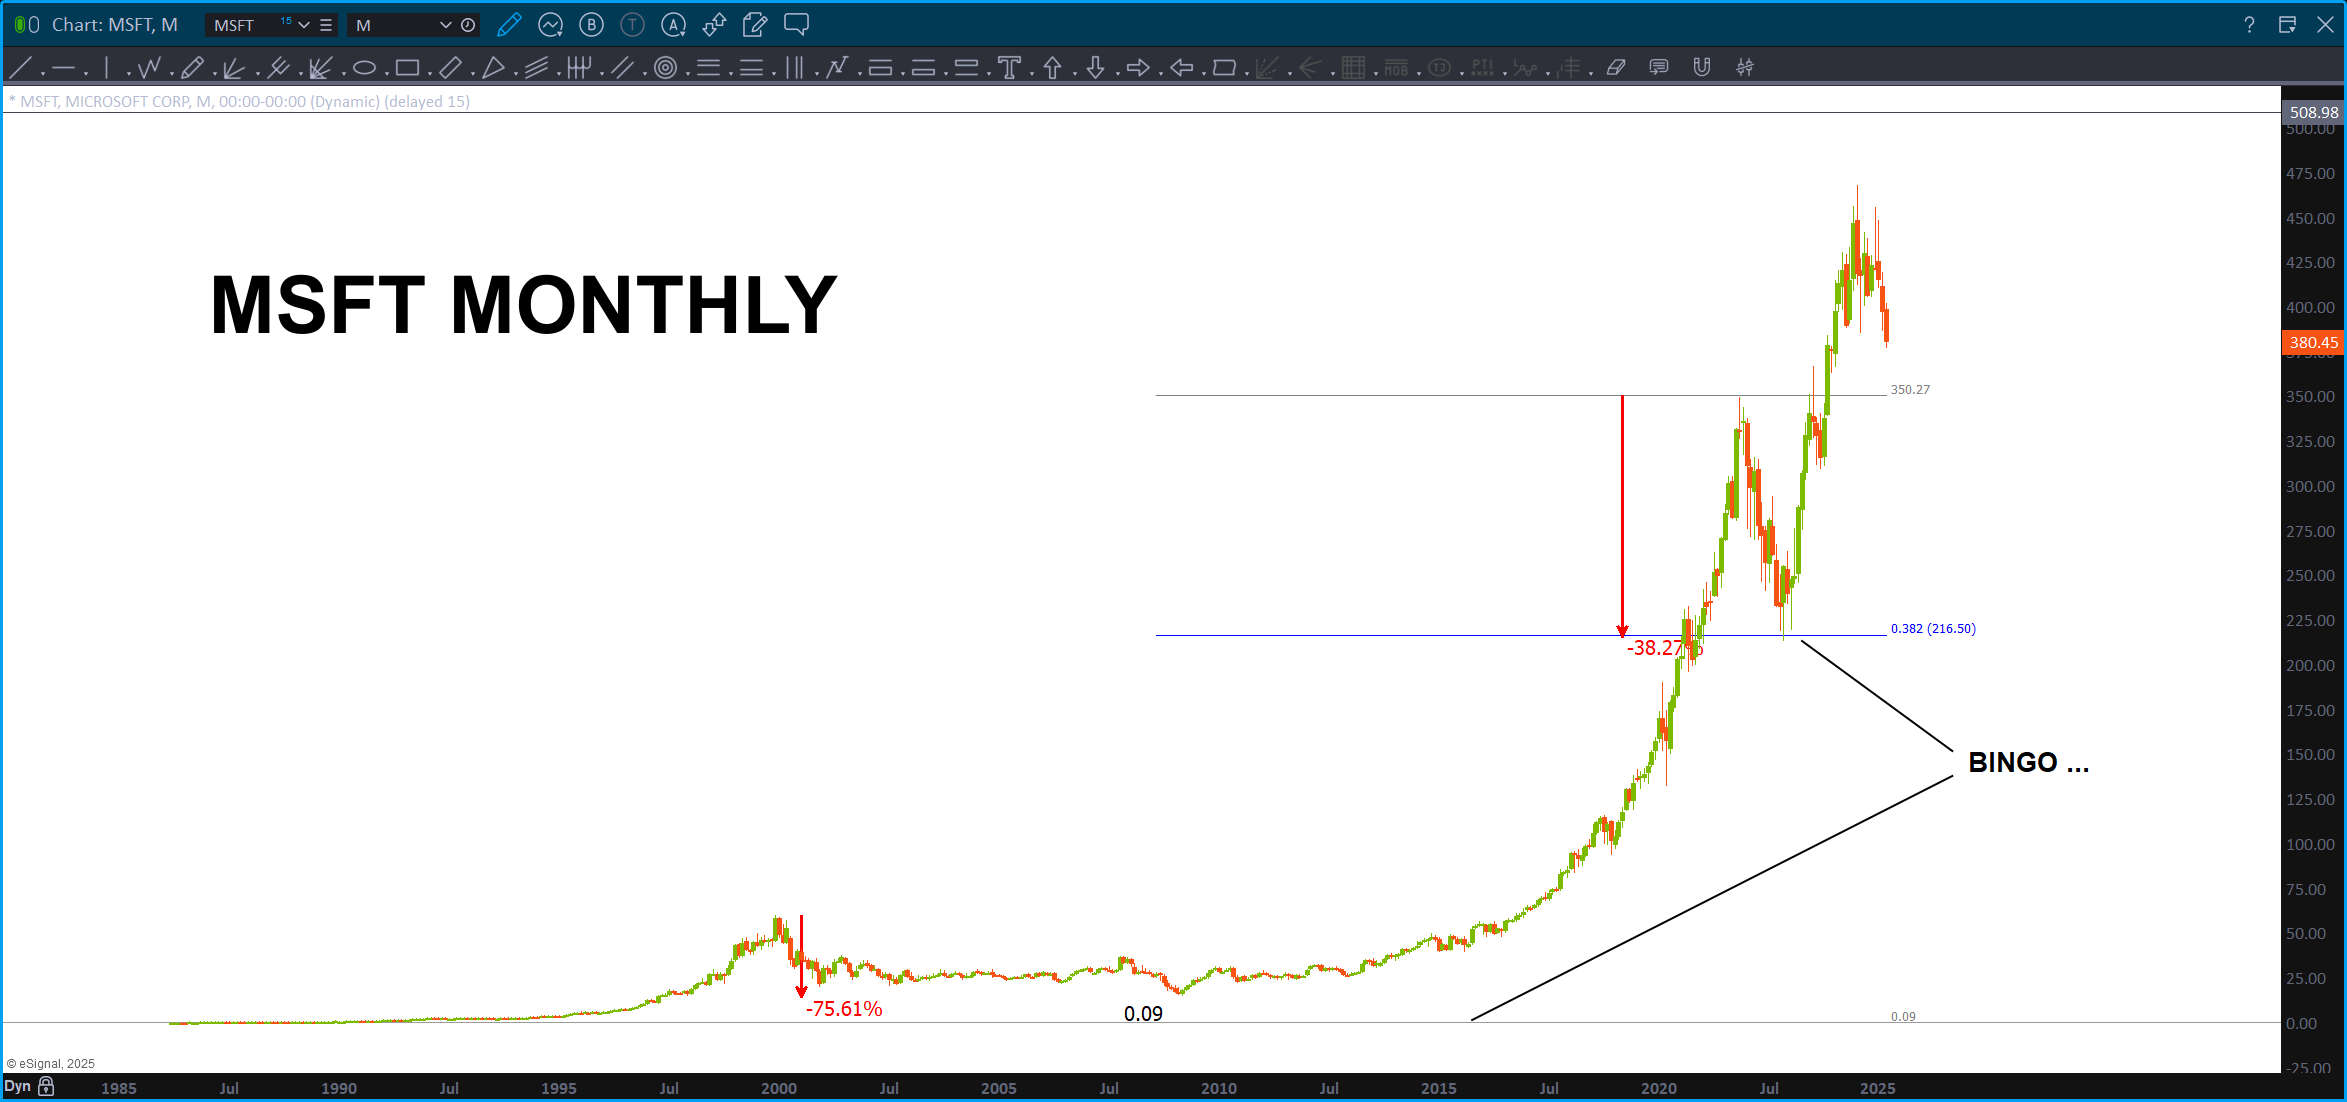
So, I really like to use LOG charts for percentage move corrections and projections – in fact – I just did it w/ the NFLX post. Anyhoo, I noticed that the last “big” percentage corrective move was .382. That doesn’t happen often …
Why is that a big deal? Because now I have the correct ‘node’ to use and that ‘should’ increase the probability for a nice BUY w/ a couple good projections down …
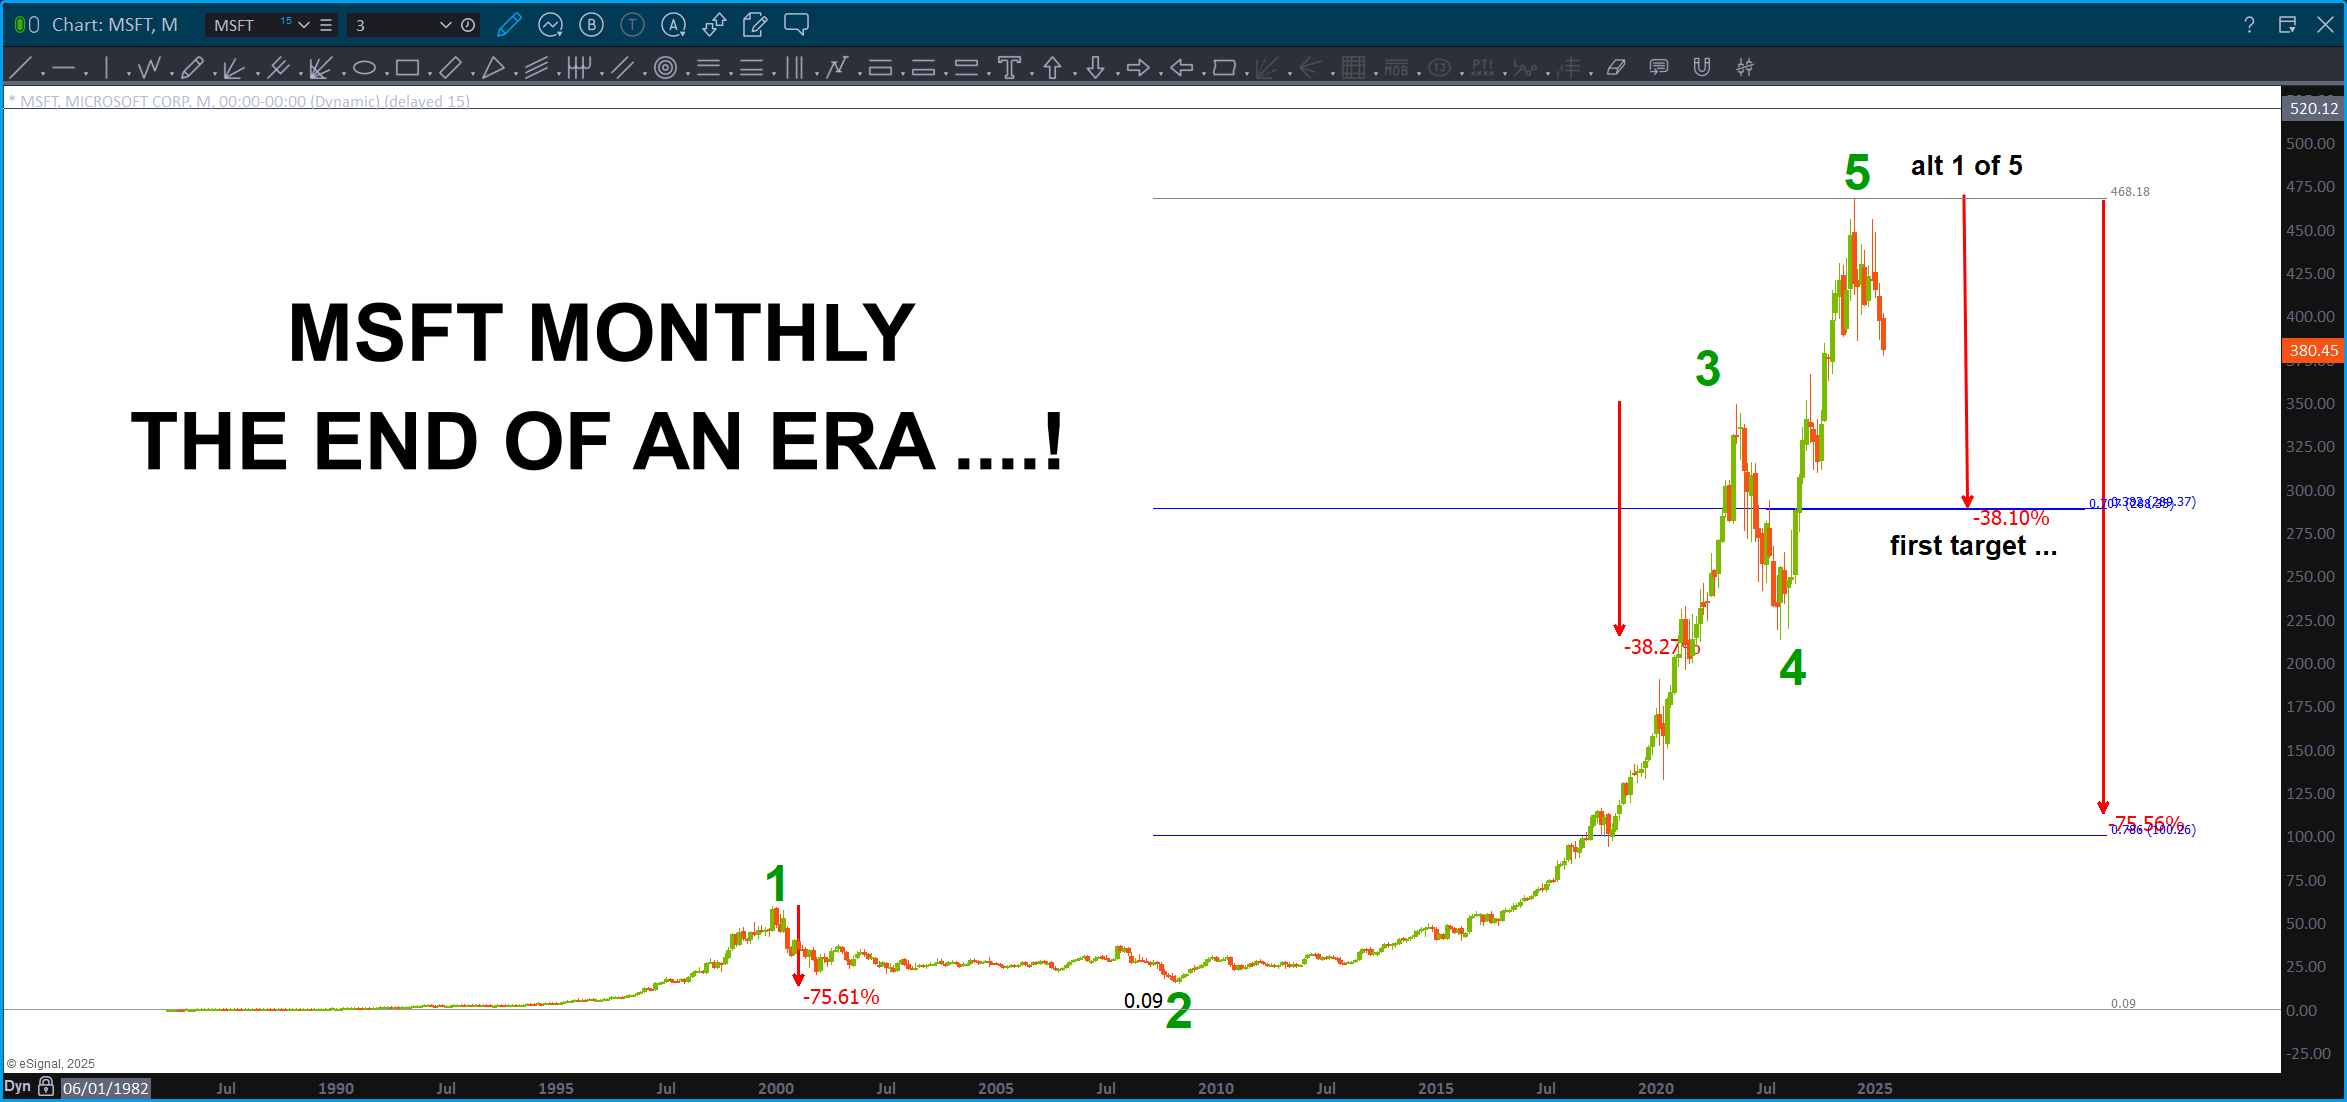
This is how I got the ‘first target’ … amazing when you step back and look at that chart that some MAJOR technological shift is going on right now folks. I’m calling it … you wait. Where am I wrong on this count?
I’m wrong that this is – perhaps – the 1st wave up. OK, sure but I sense/ feel a rough wave 2 down.
Nah – something is up at MSFT or … soon there will be …or, I’m dead wrong! Always told ya my counting was like my golf game folks …
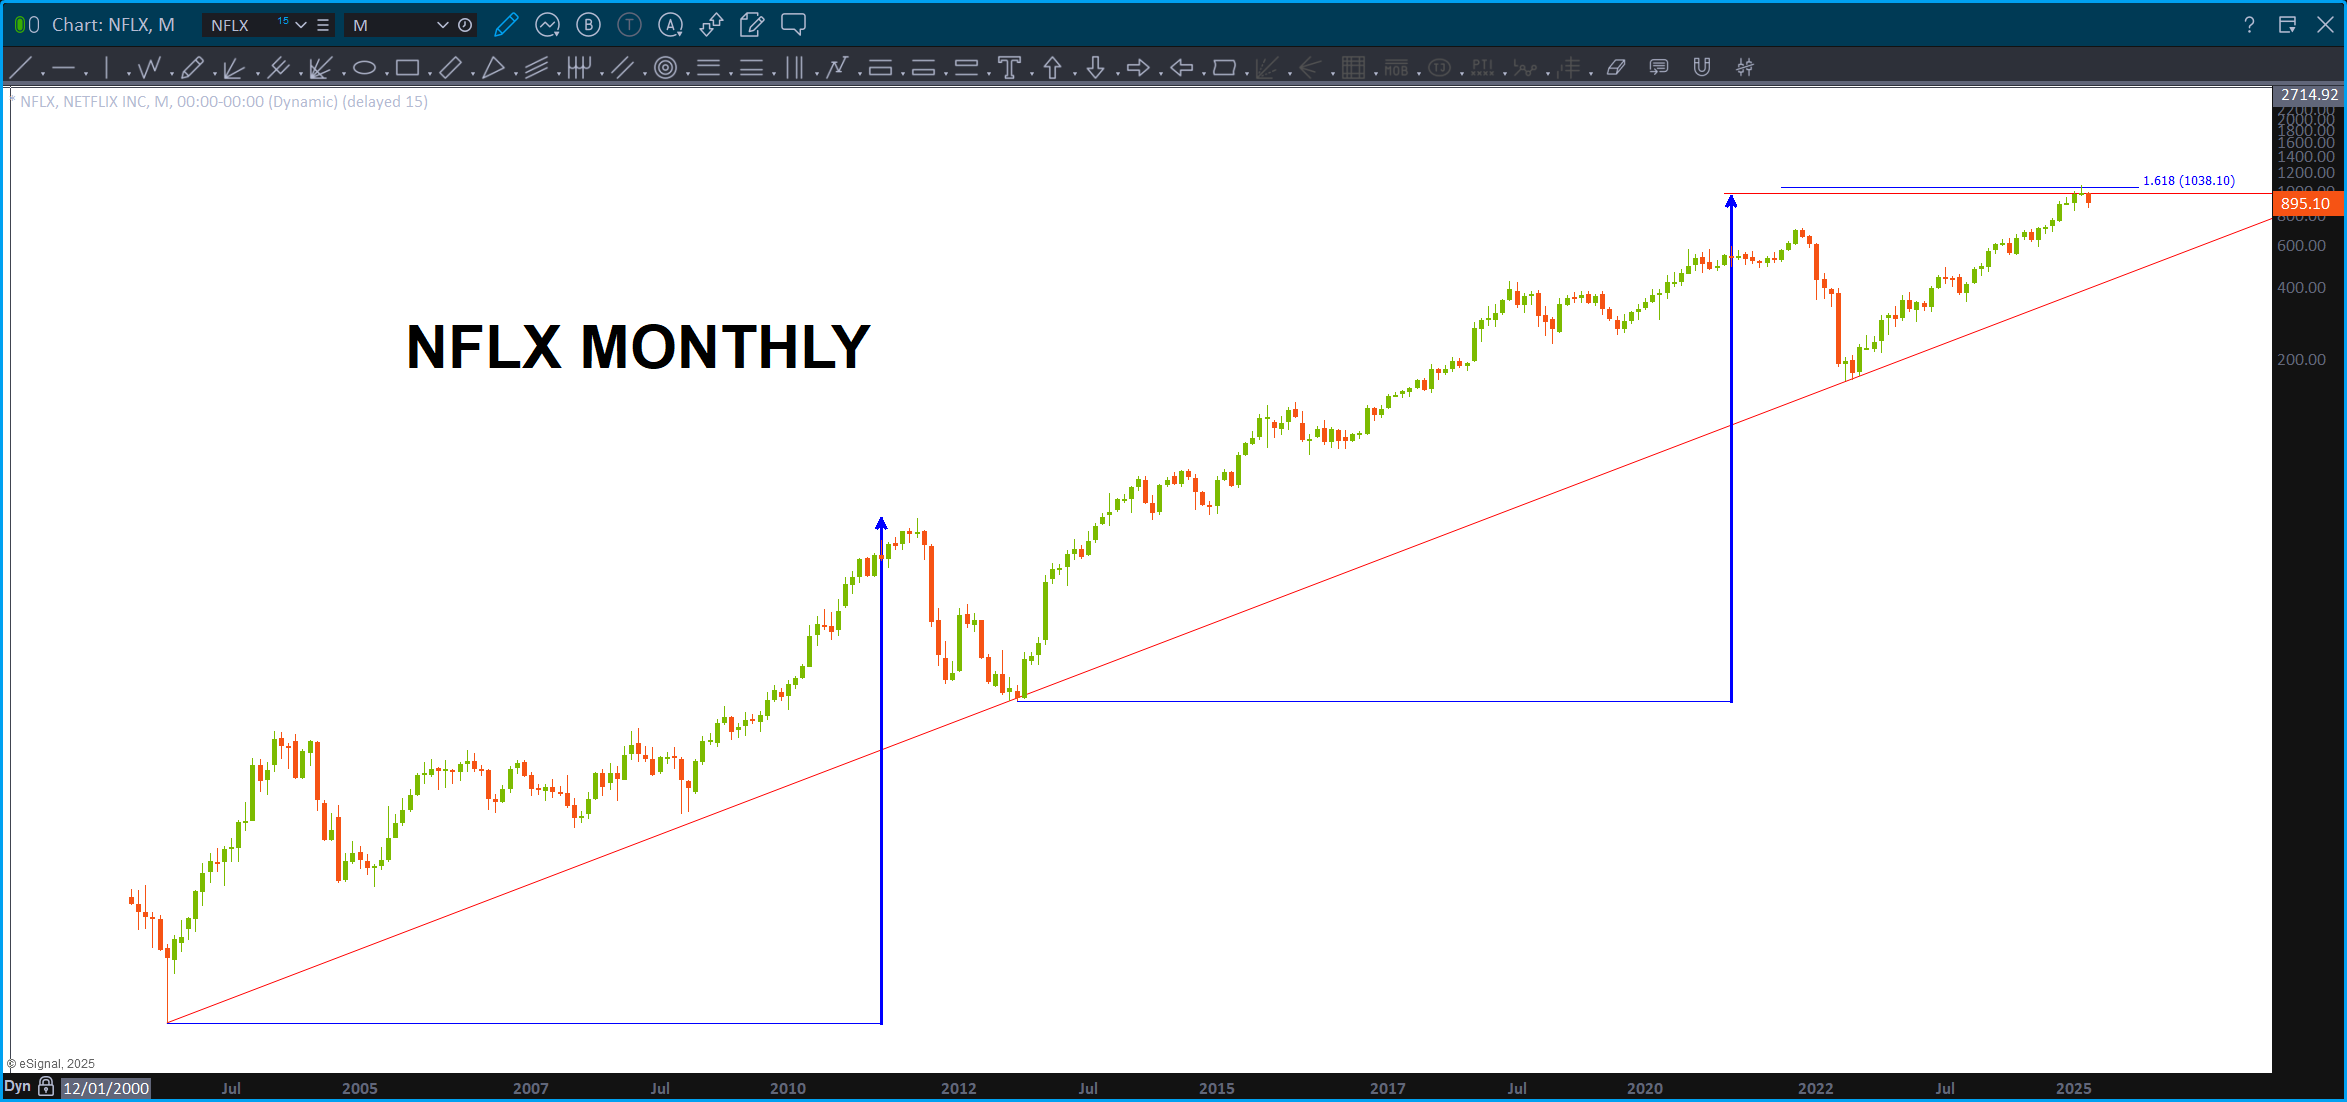
NFLX – March 11, 2025
Posted on March 11, 2025 Leave a Comment

I think the blue arrows are significant.
NYA, YEN, XLF, Ratio’s – March 10, 2025
Posted on March 10, 2025 Leave a Comment

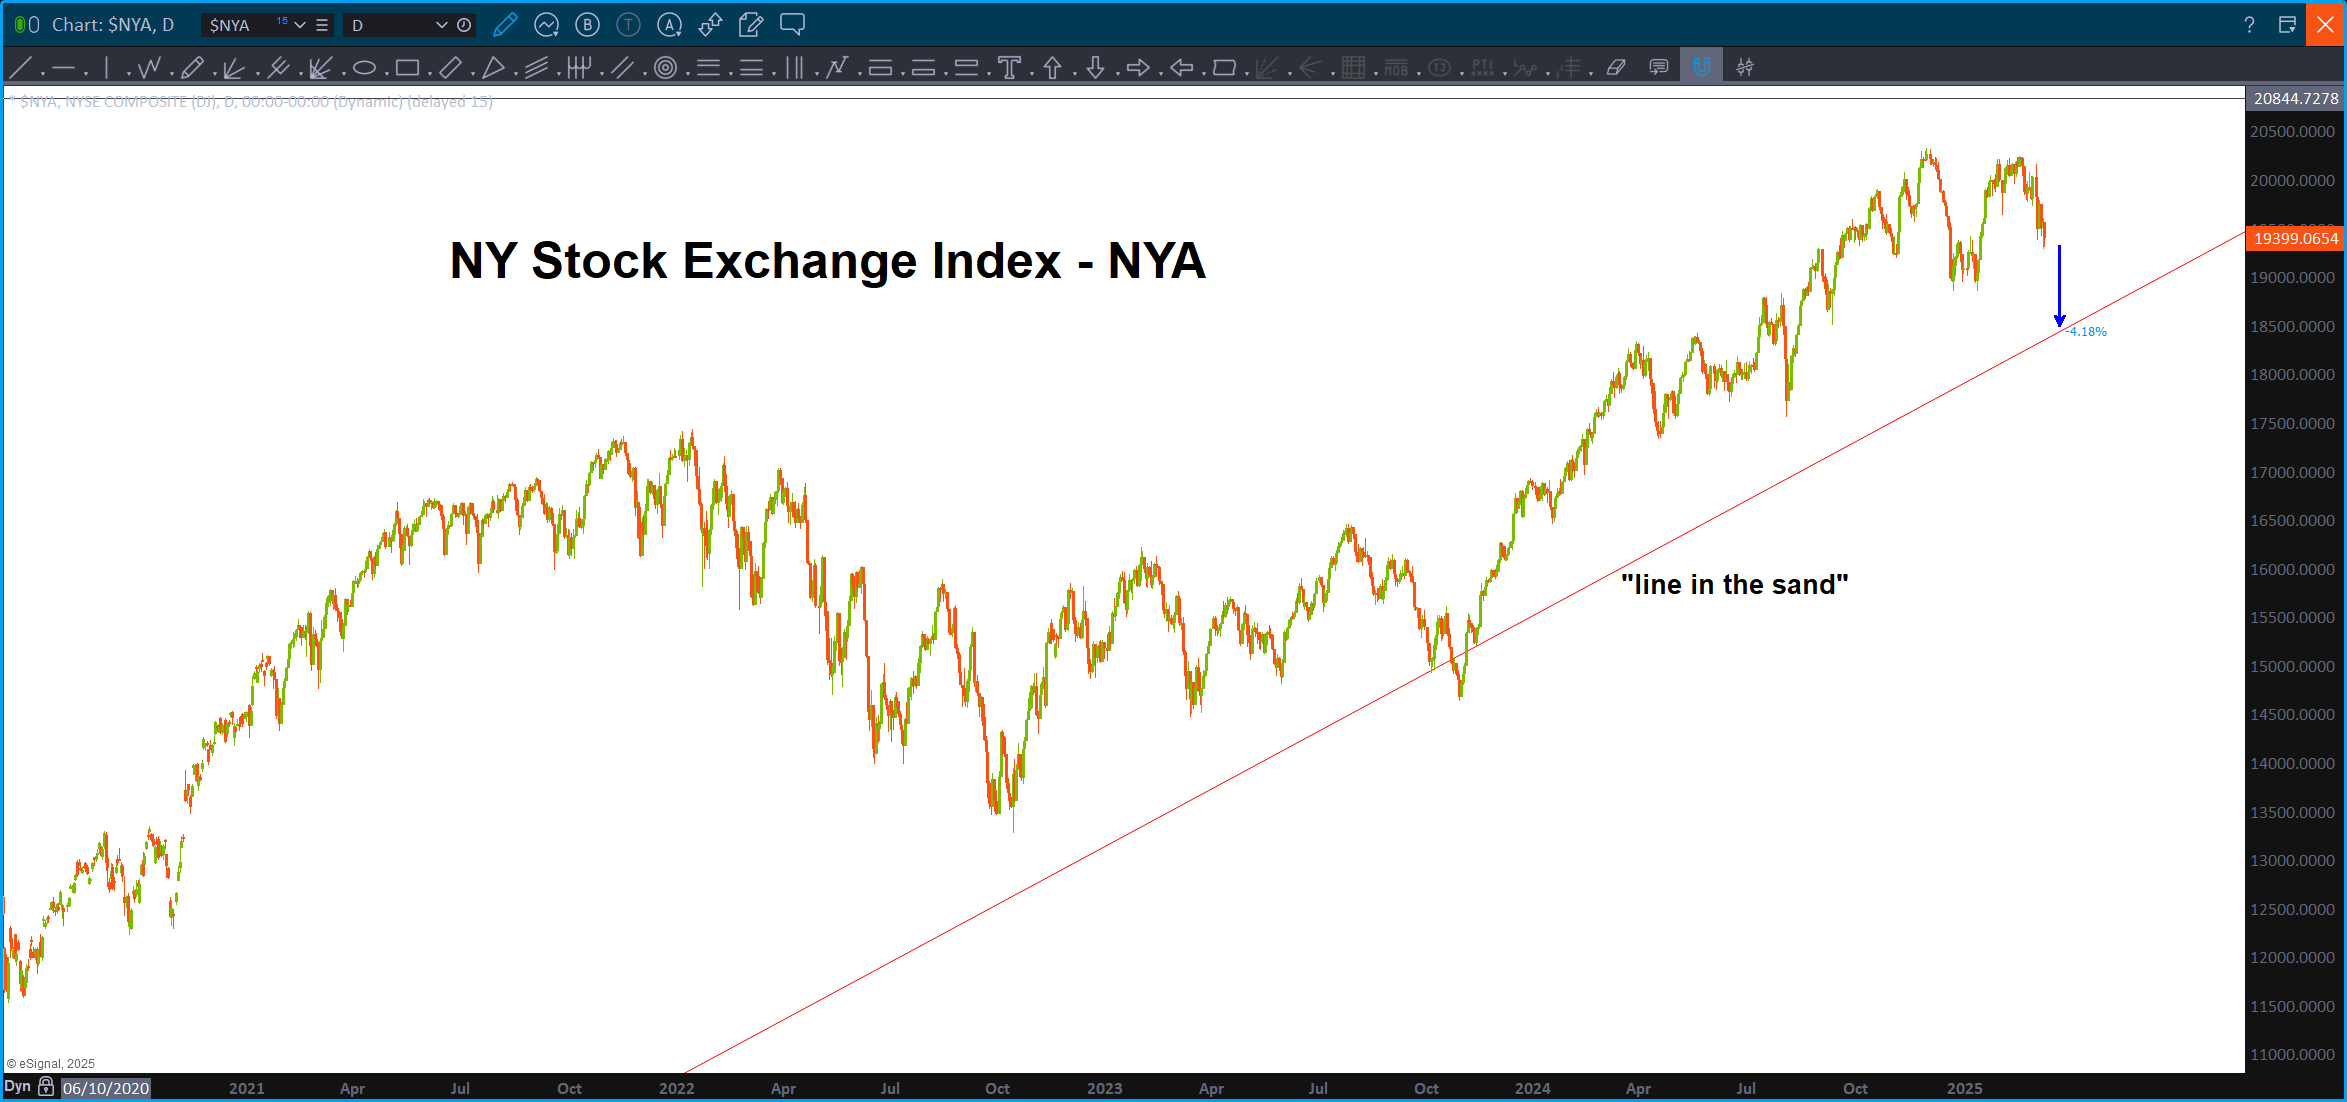
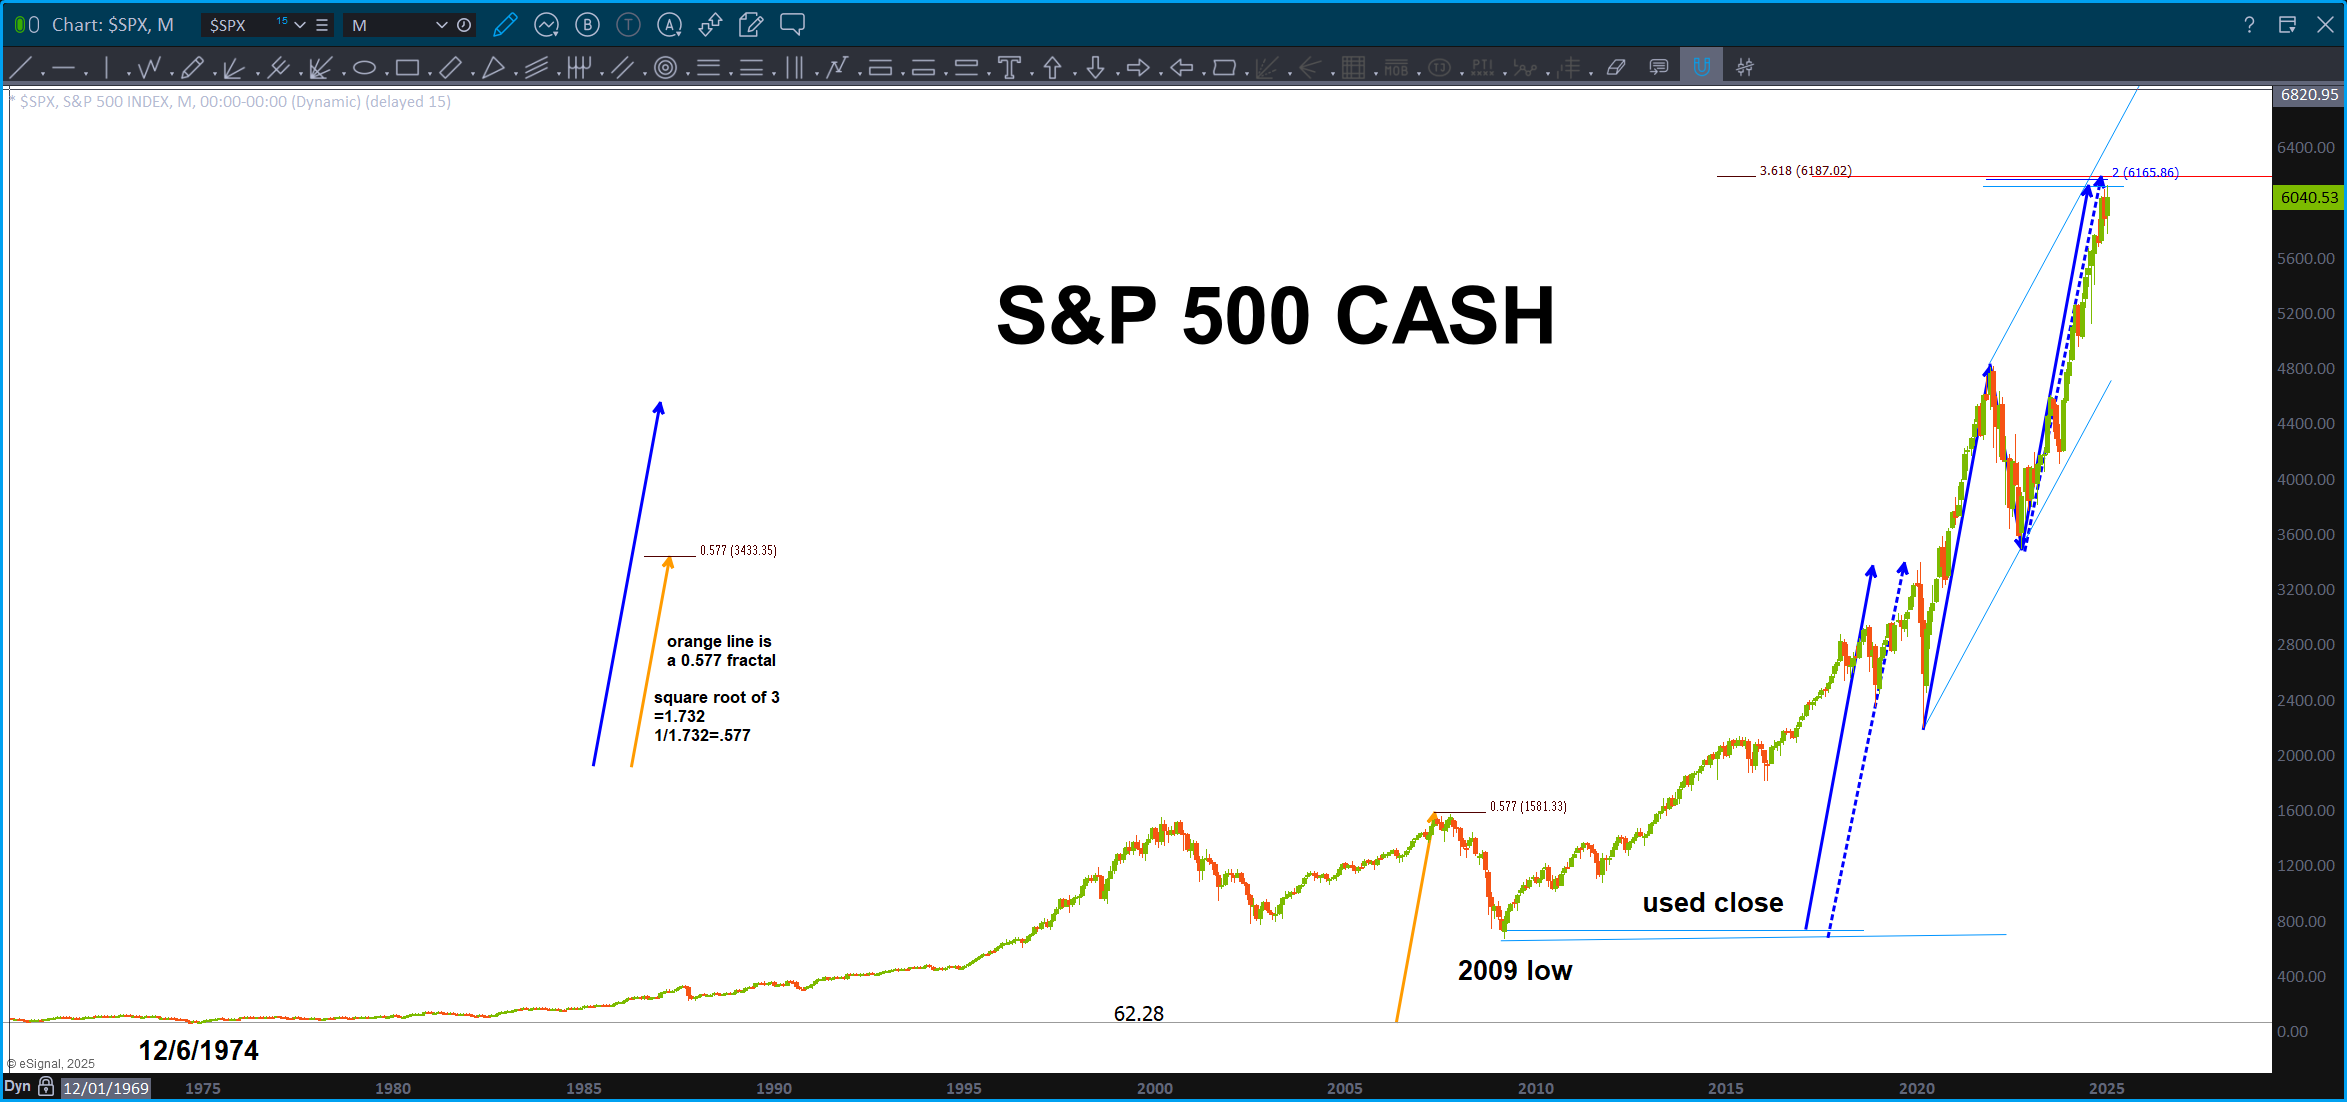
Well, that accelerated quickly. I was briefing some amazing peeps last night on Stock Market Media and was fully expecting a rally into, at least, a .382. Scratch that …
Perhaps the ‘set wave’ that I was discussing last night is upon us?
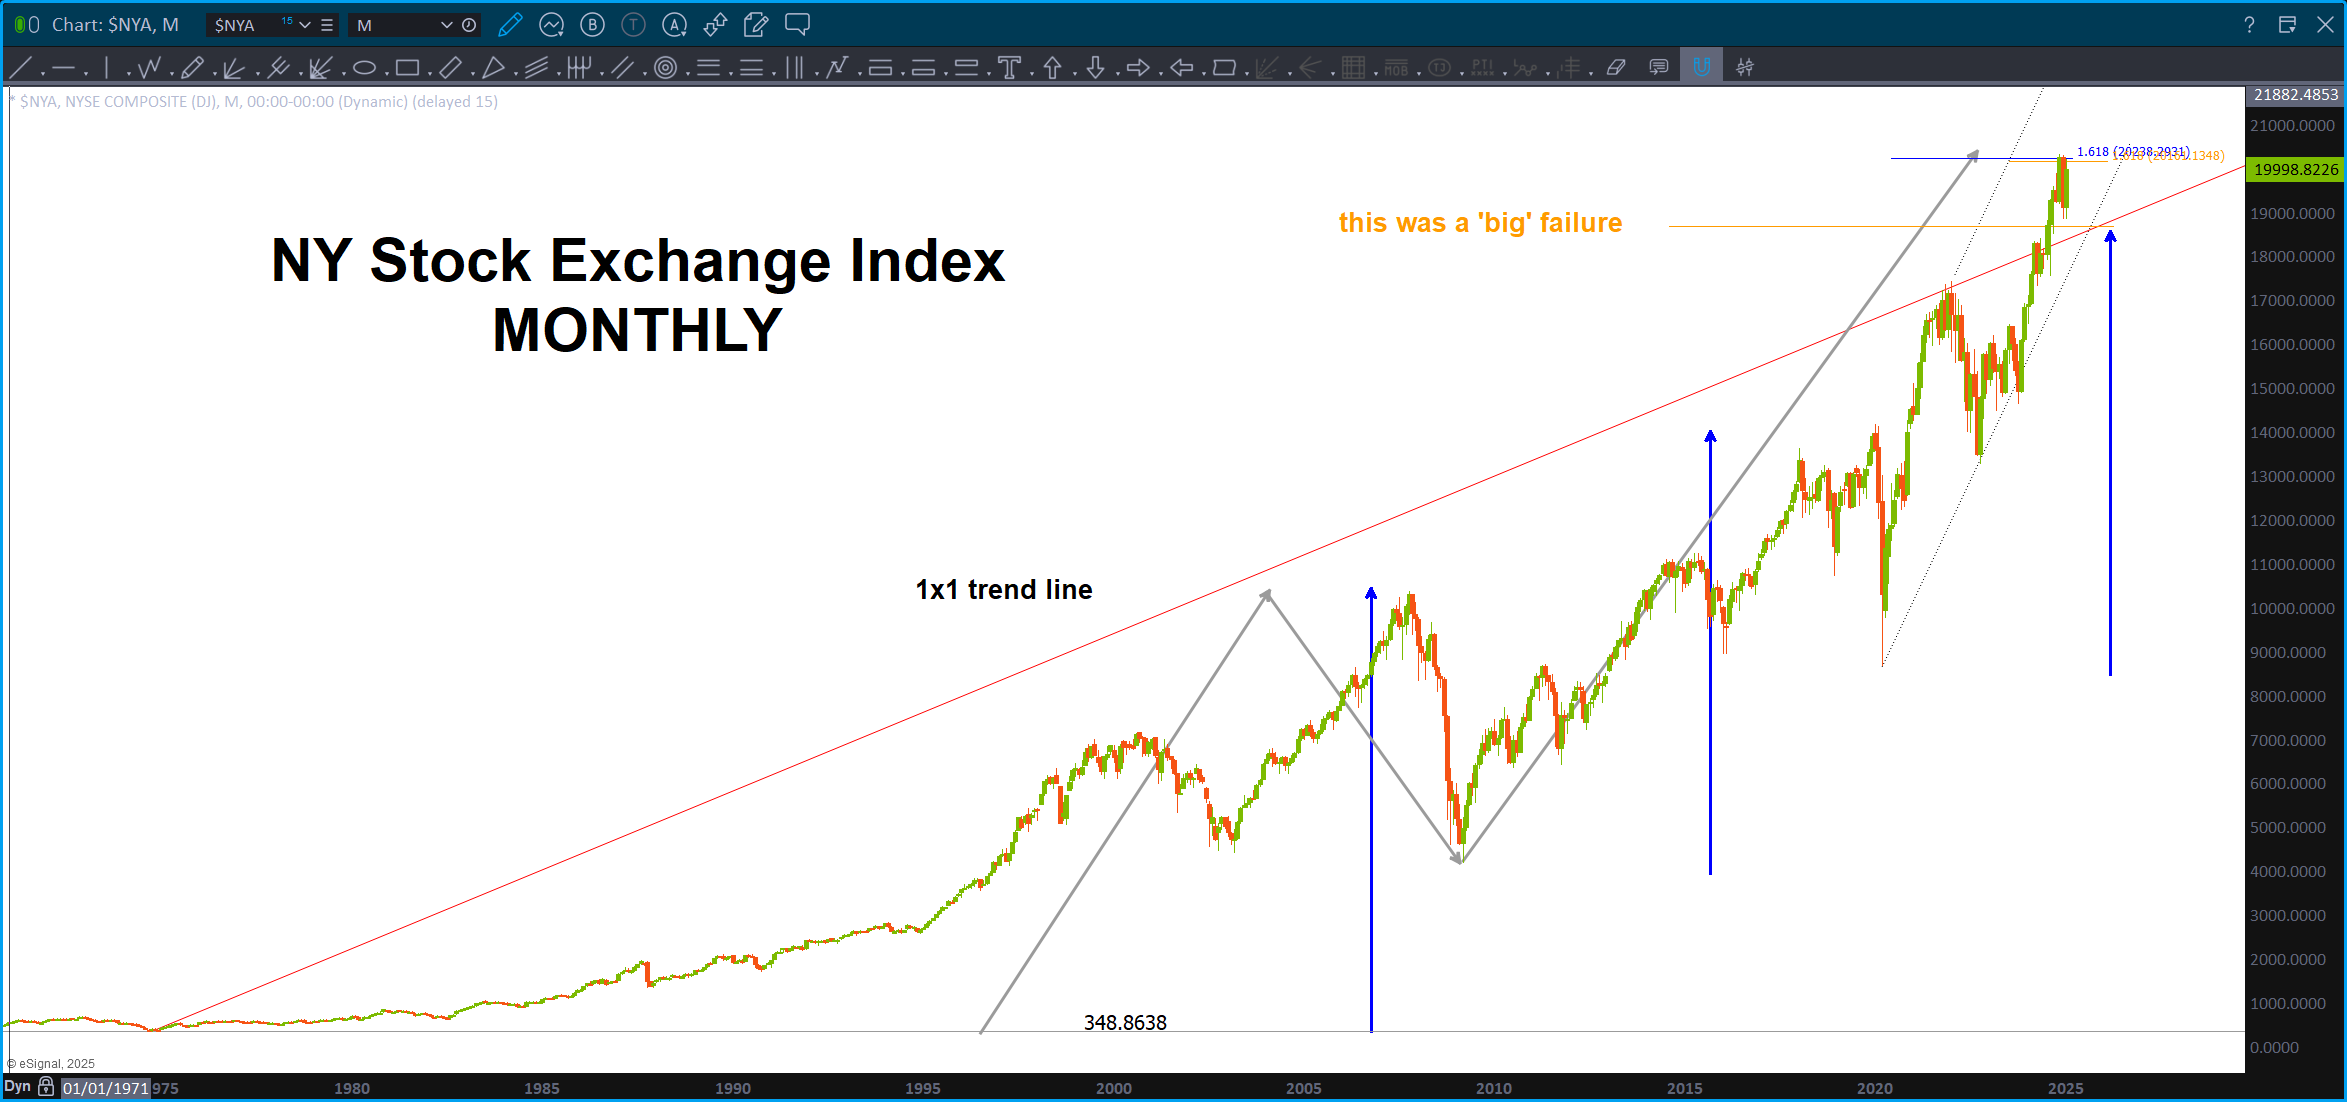
What’s important, now, is the 1×1 trendline from the all time low …to keep the bull rollling I would expect it to hold as support … a weekly close below, we could be looking at a 30% correction. Why 30%? That’s what all the others one have been of late …
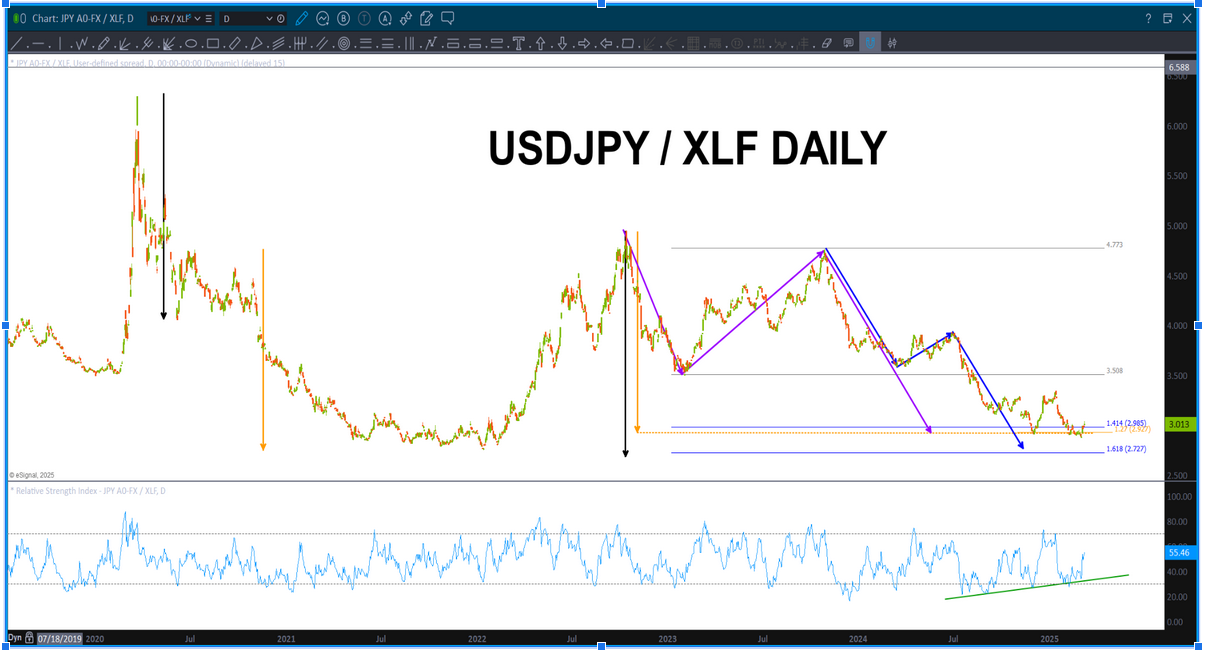
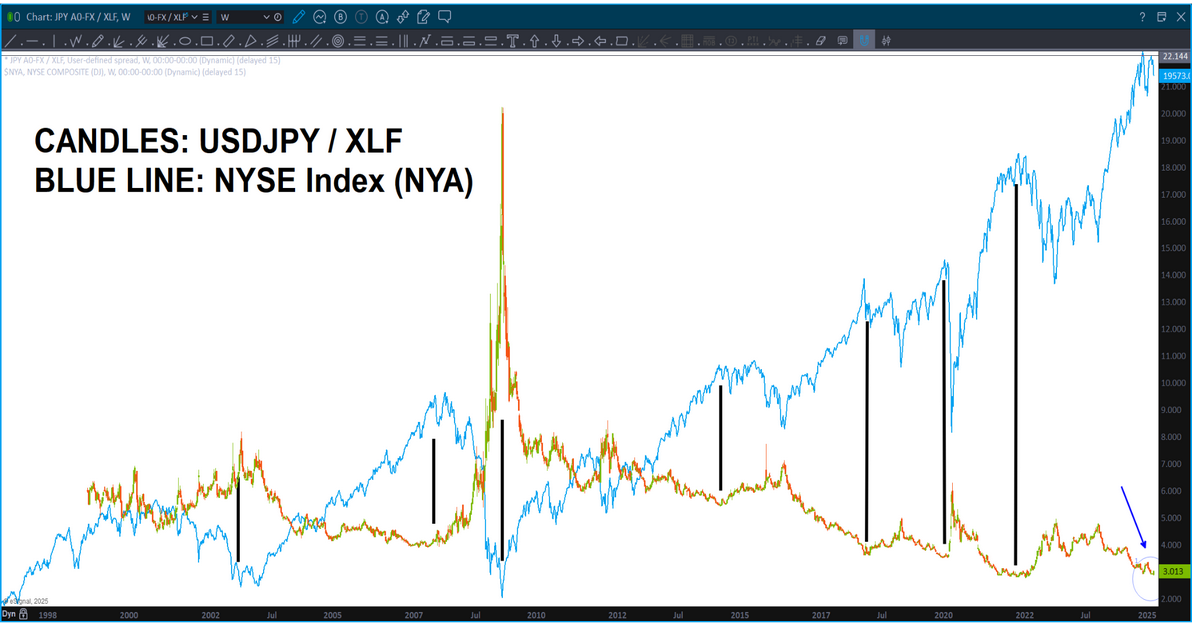
Something else to watch, YEN and the banks. When the YEN has strengthened (from a relative strength perspective) against the XLF we have hit stiff resistance. Note, the ratio is JUST starting to turn up so … keep an eye out for this ratio.
Note – doesn’t look like the XLF is going to make that upper target anytime soon, at least on this run.
No kidding, I’m going to grab a surf … a LOT of rain for SoCal inbound …
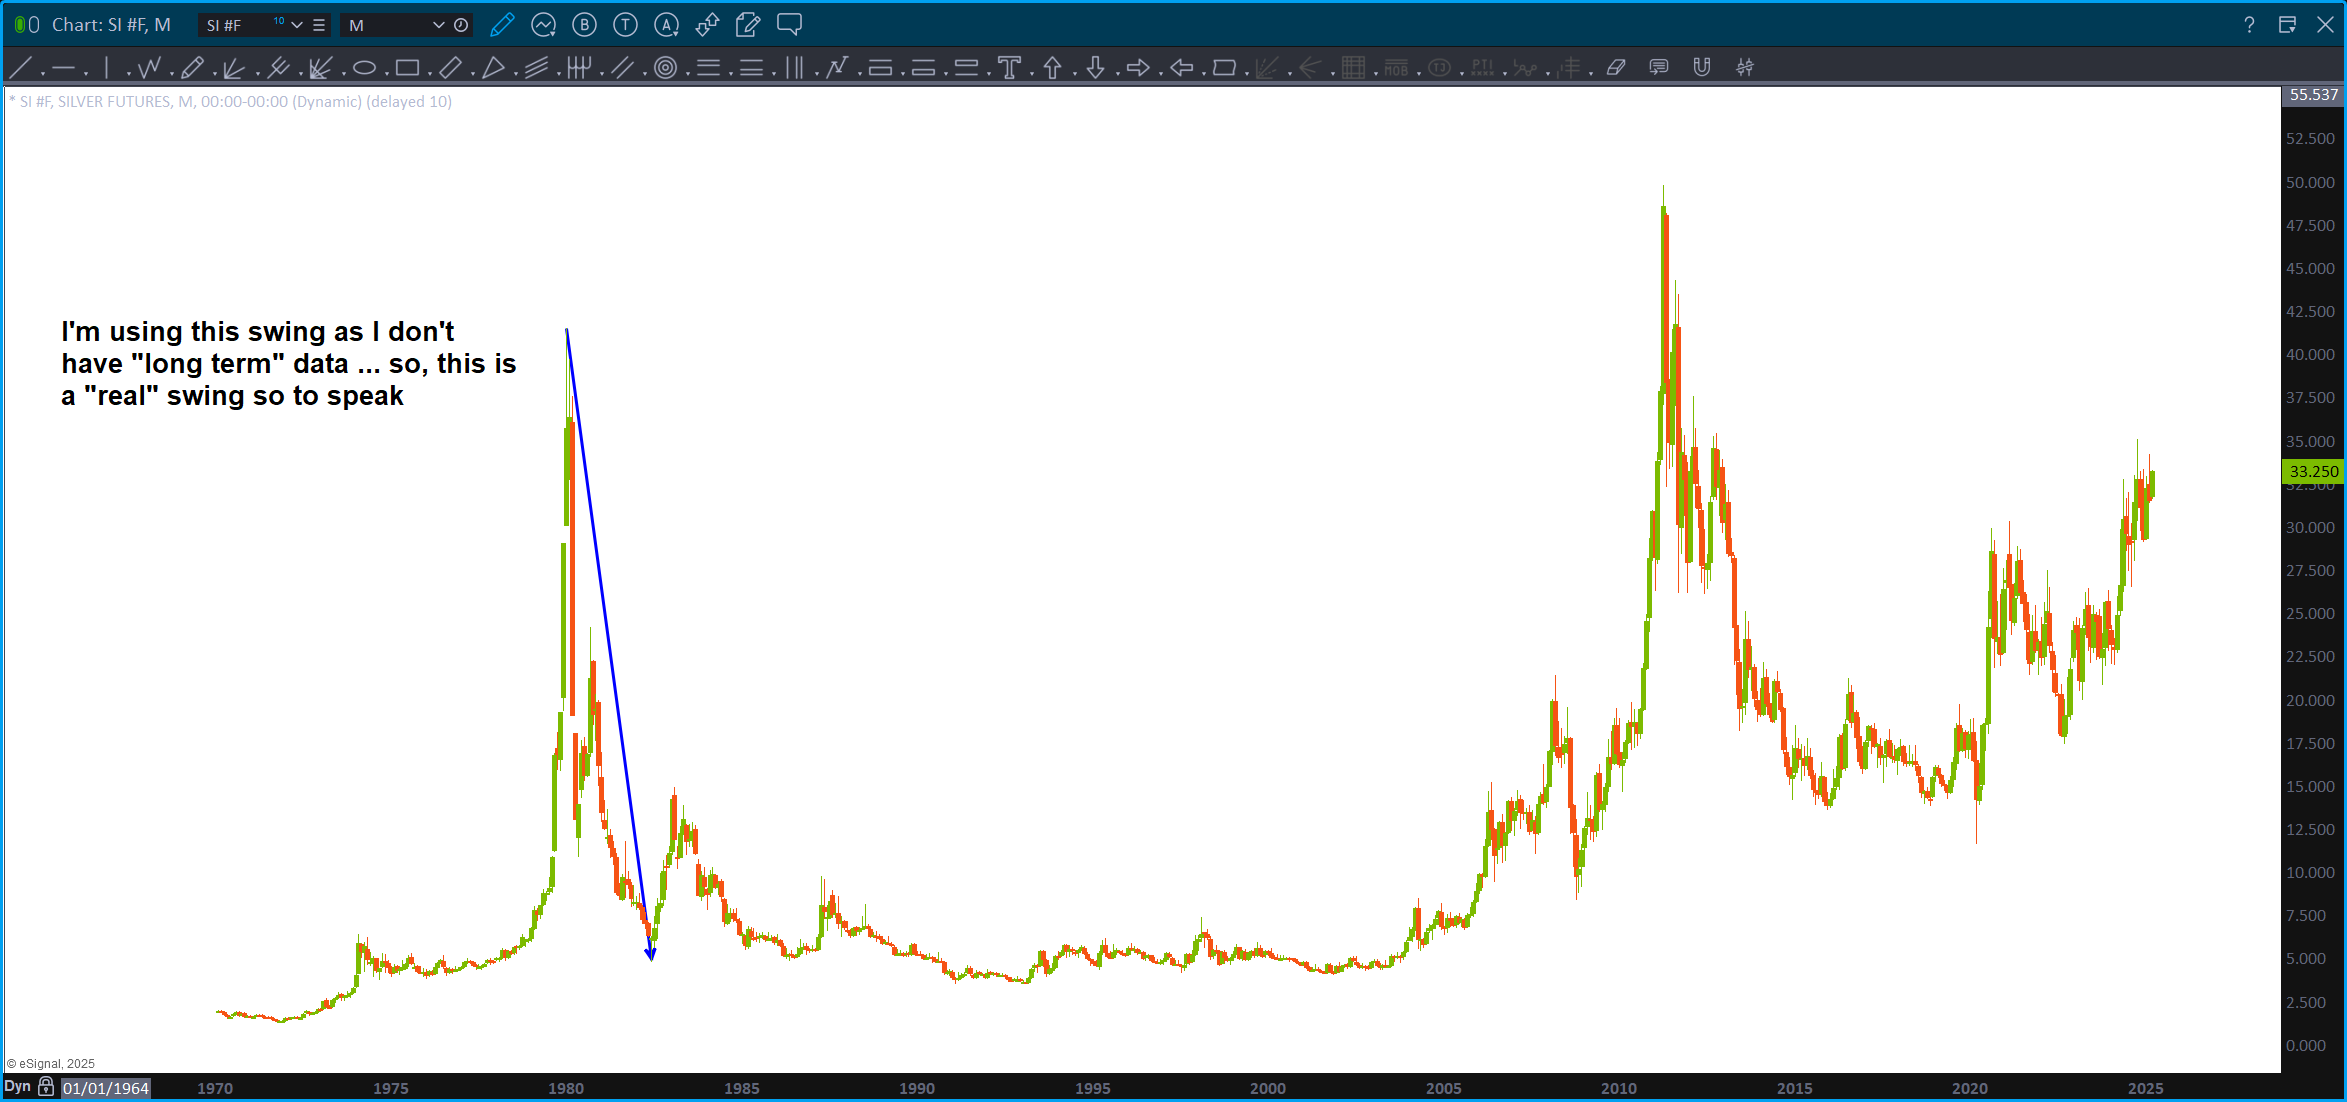
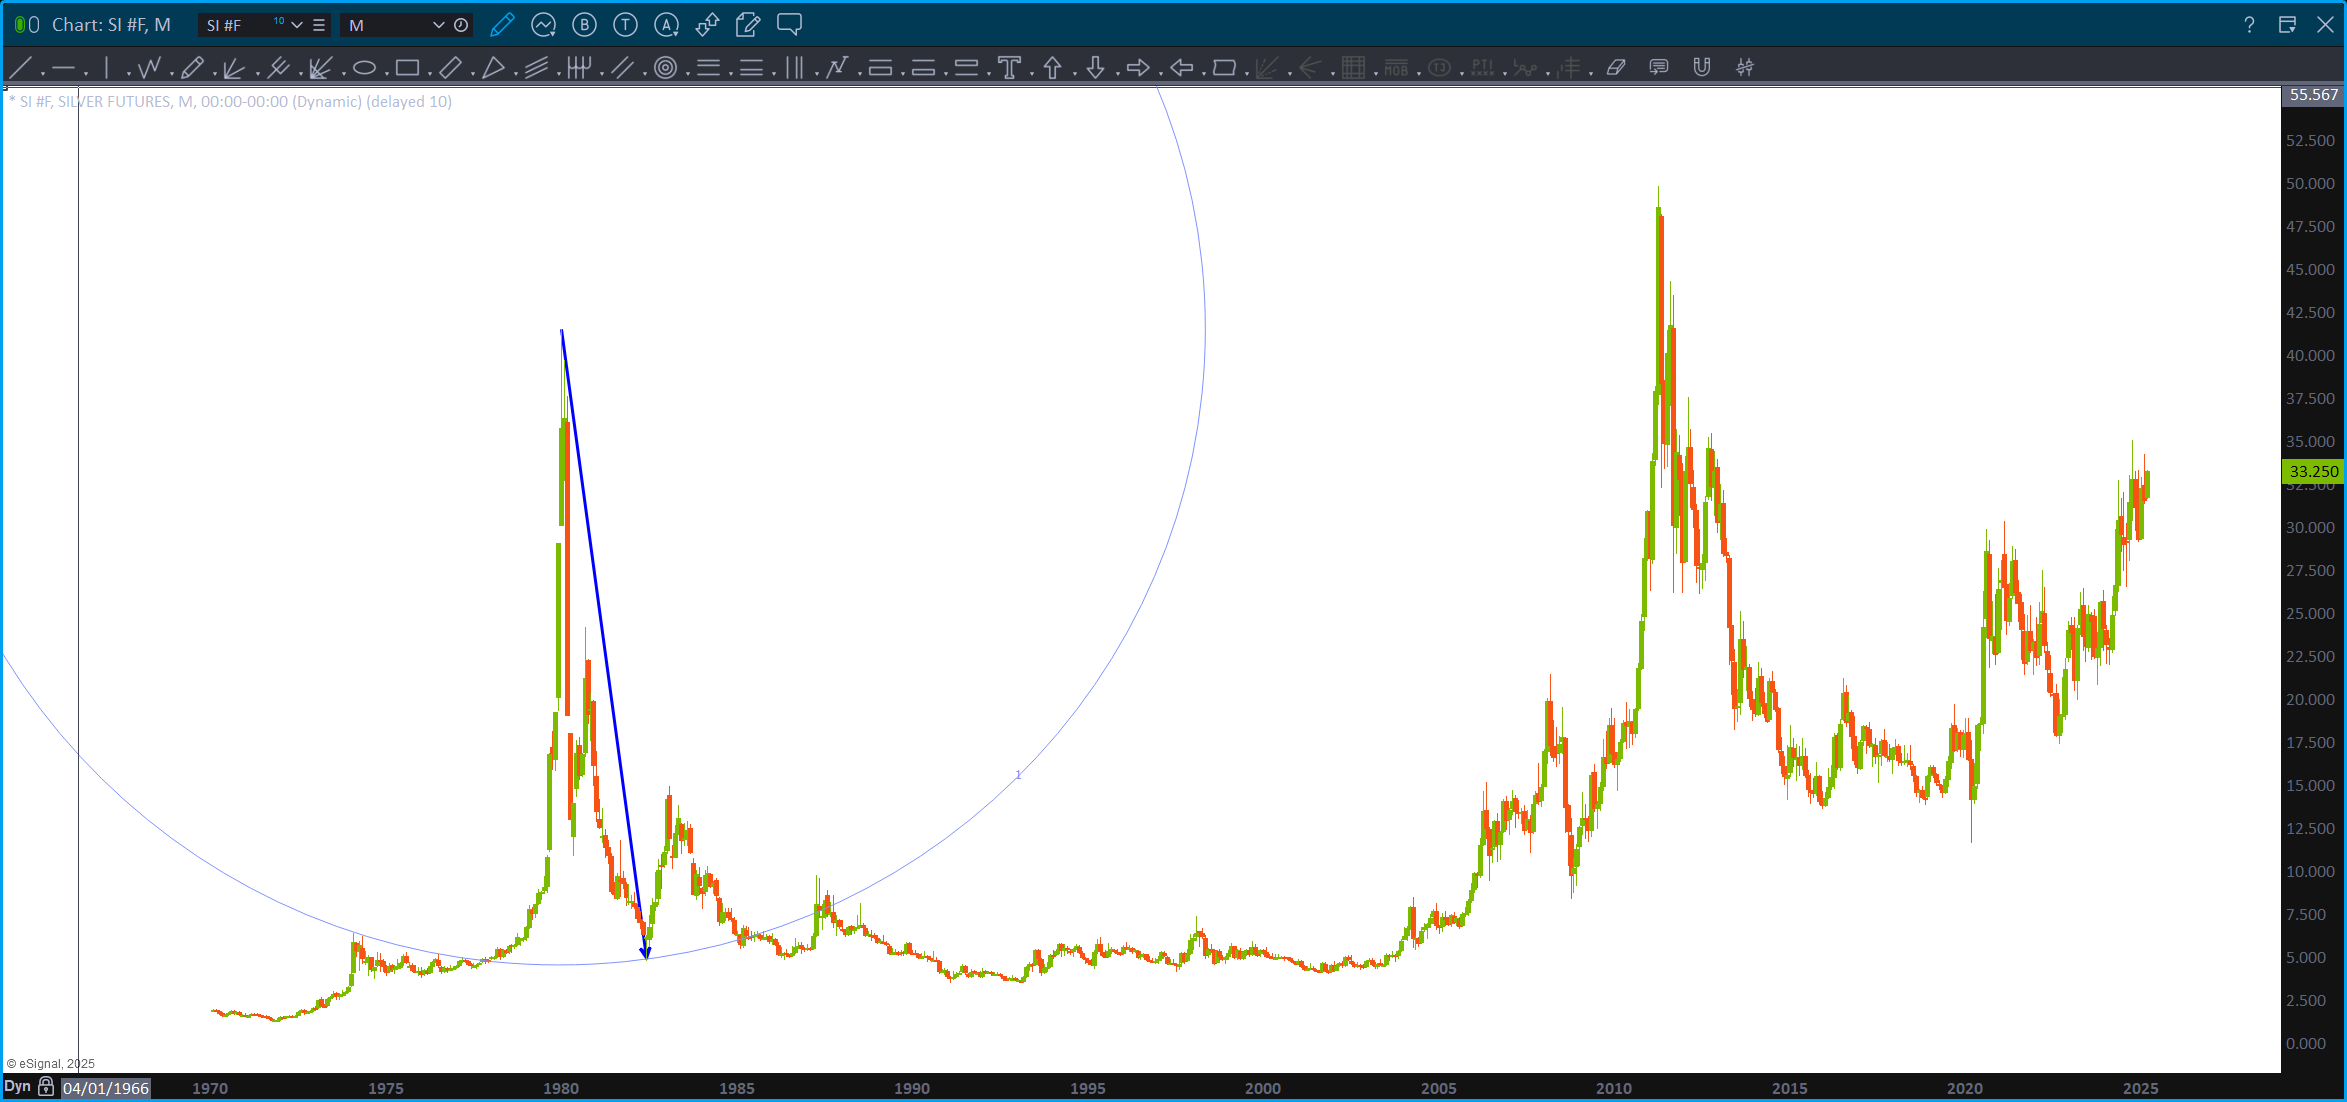
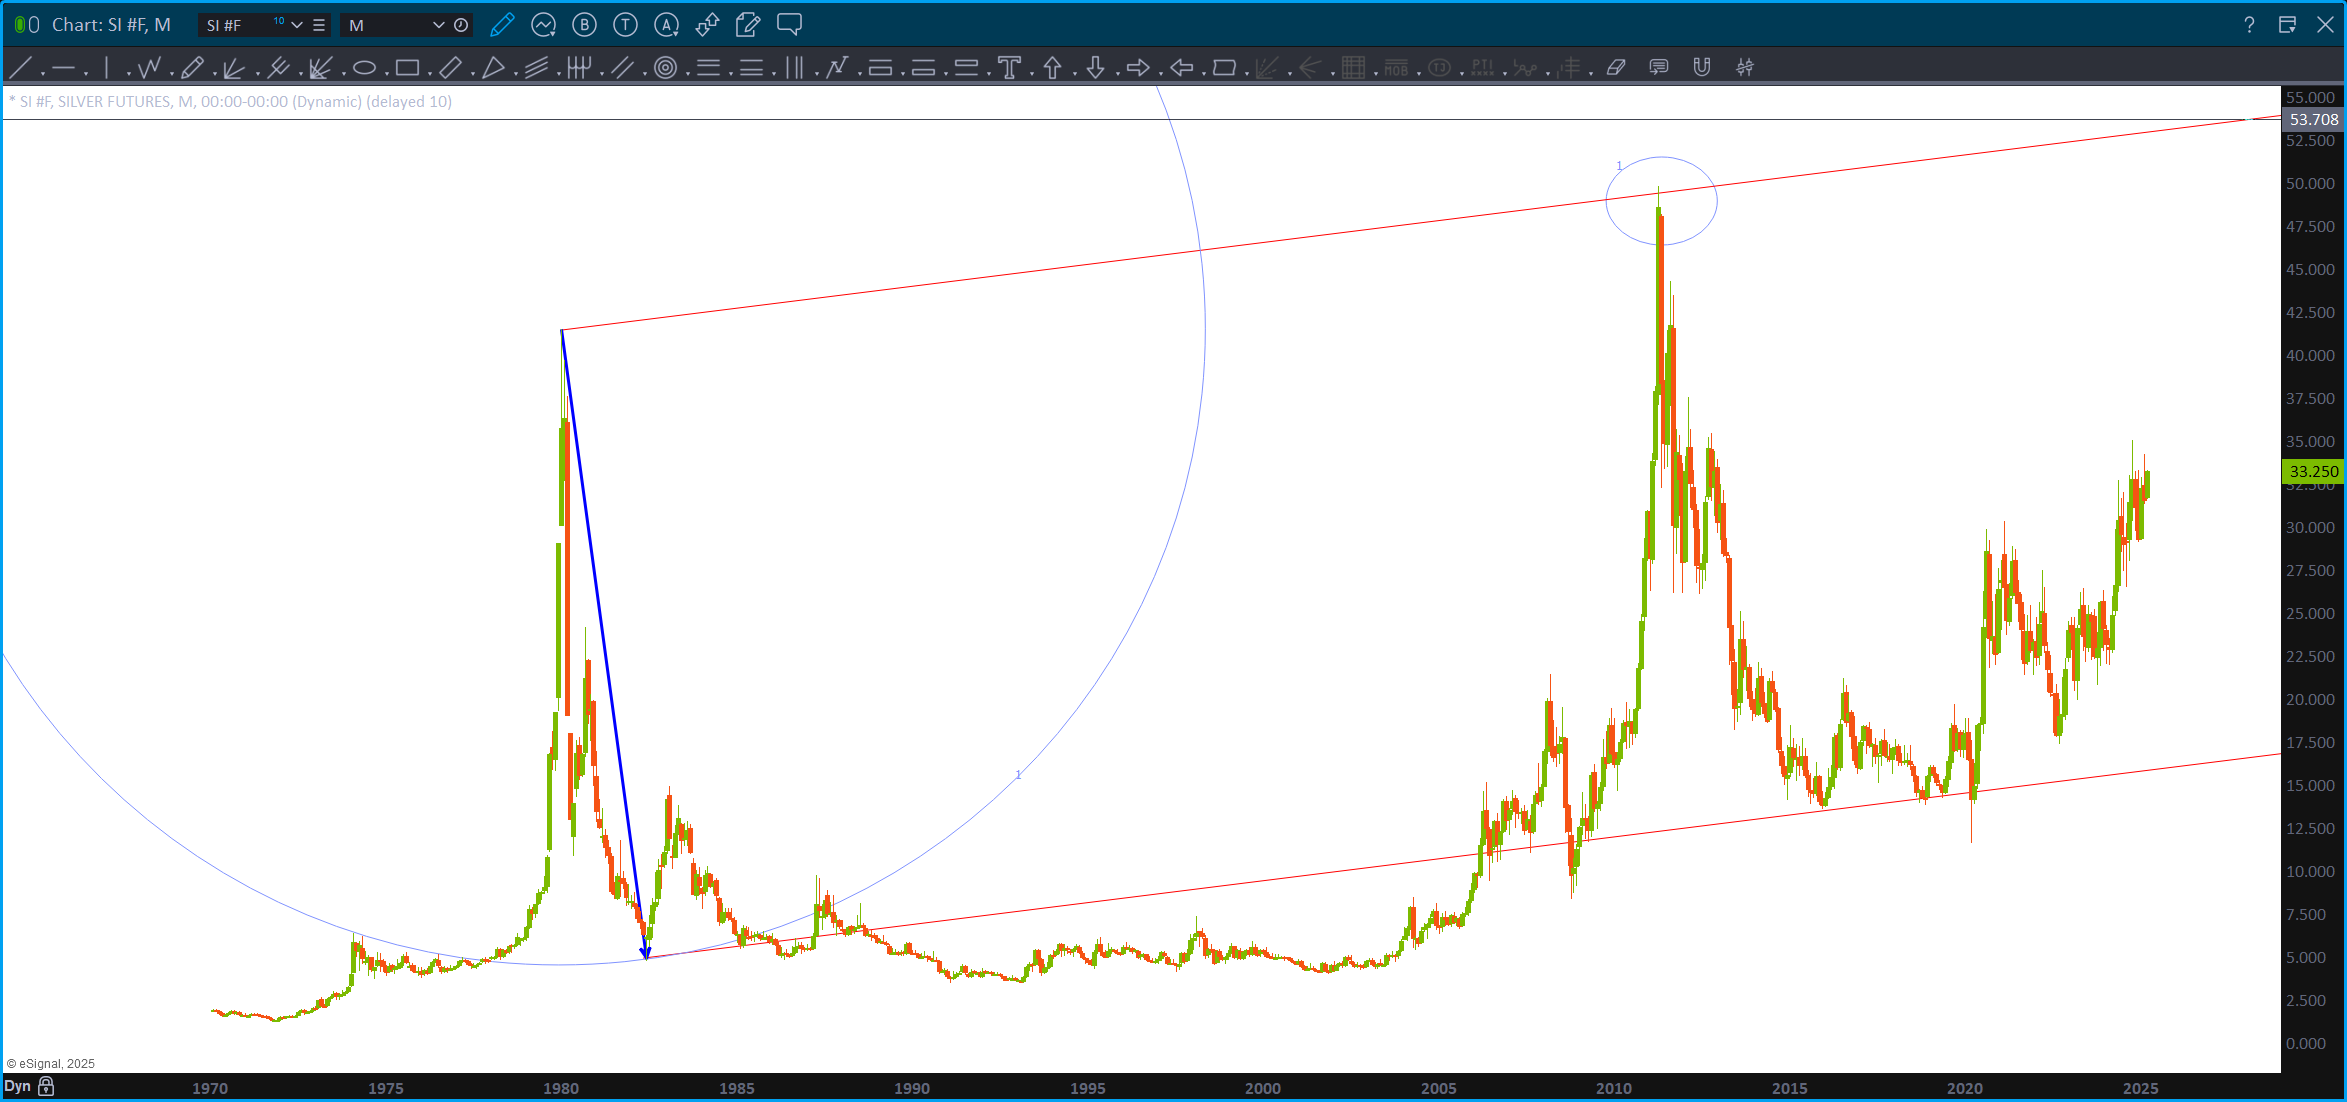
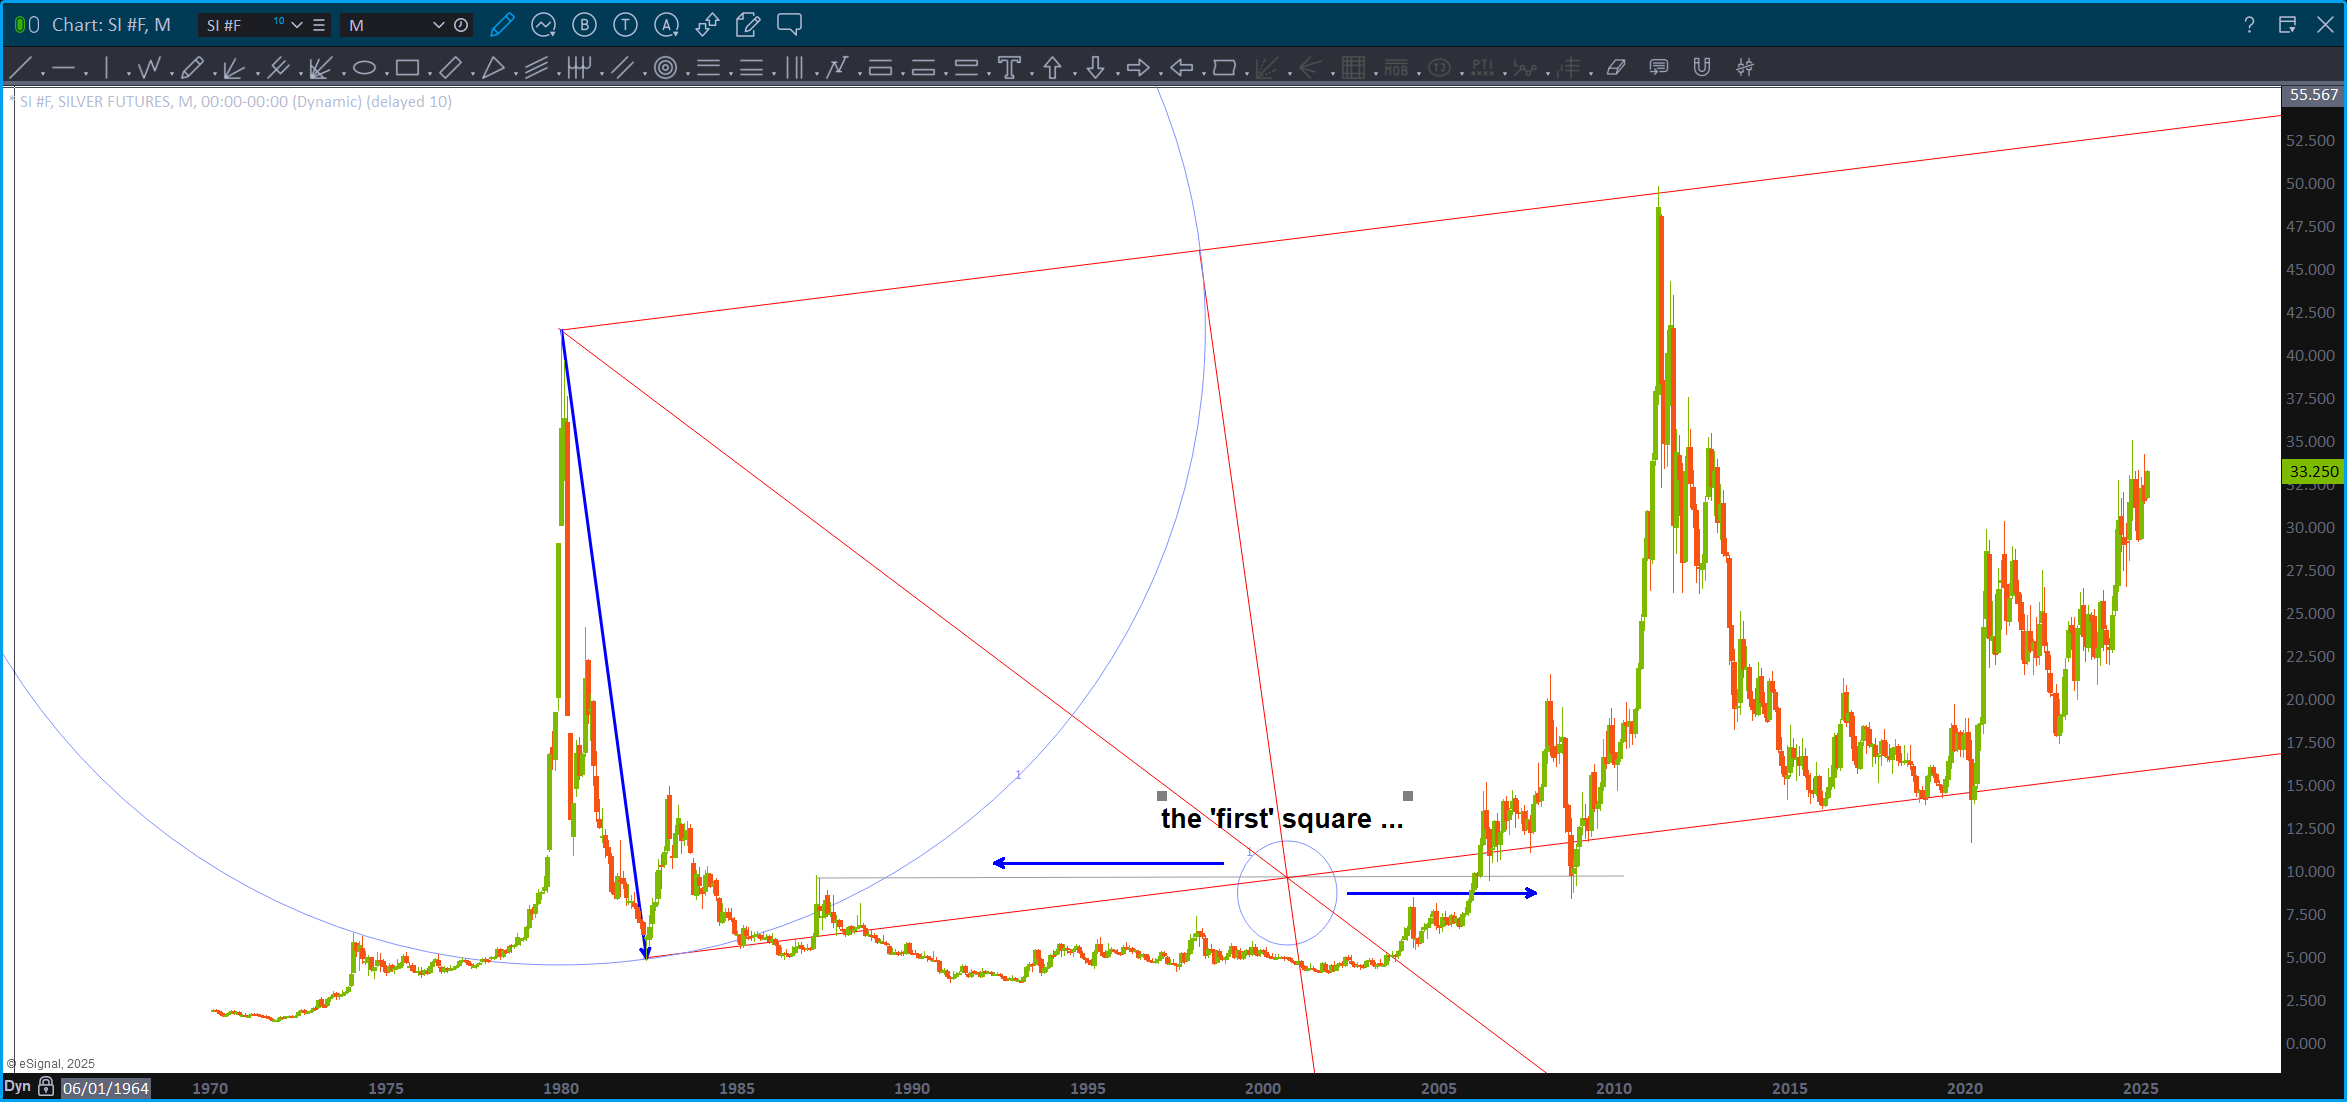
Geometry – March 5, 2025
Posted on March 5, 2025 Leave a Comment

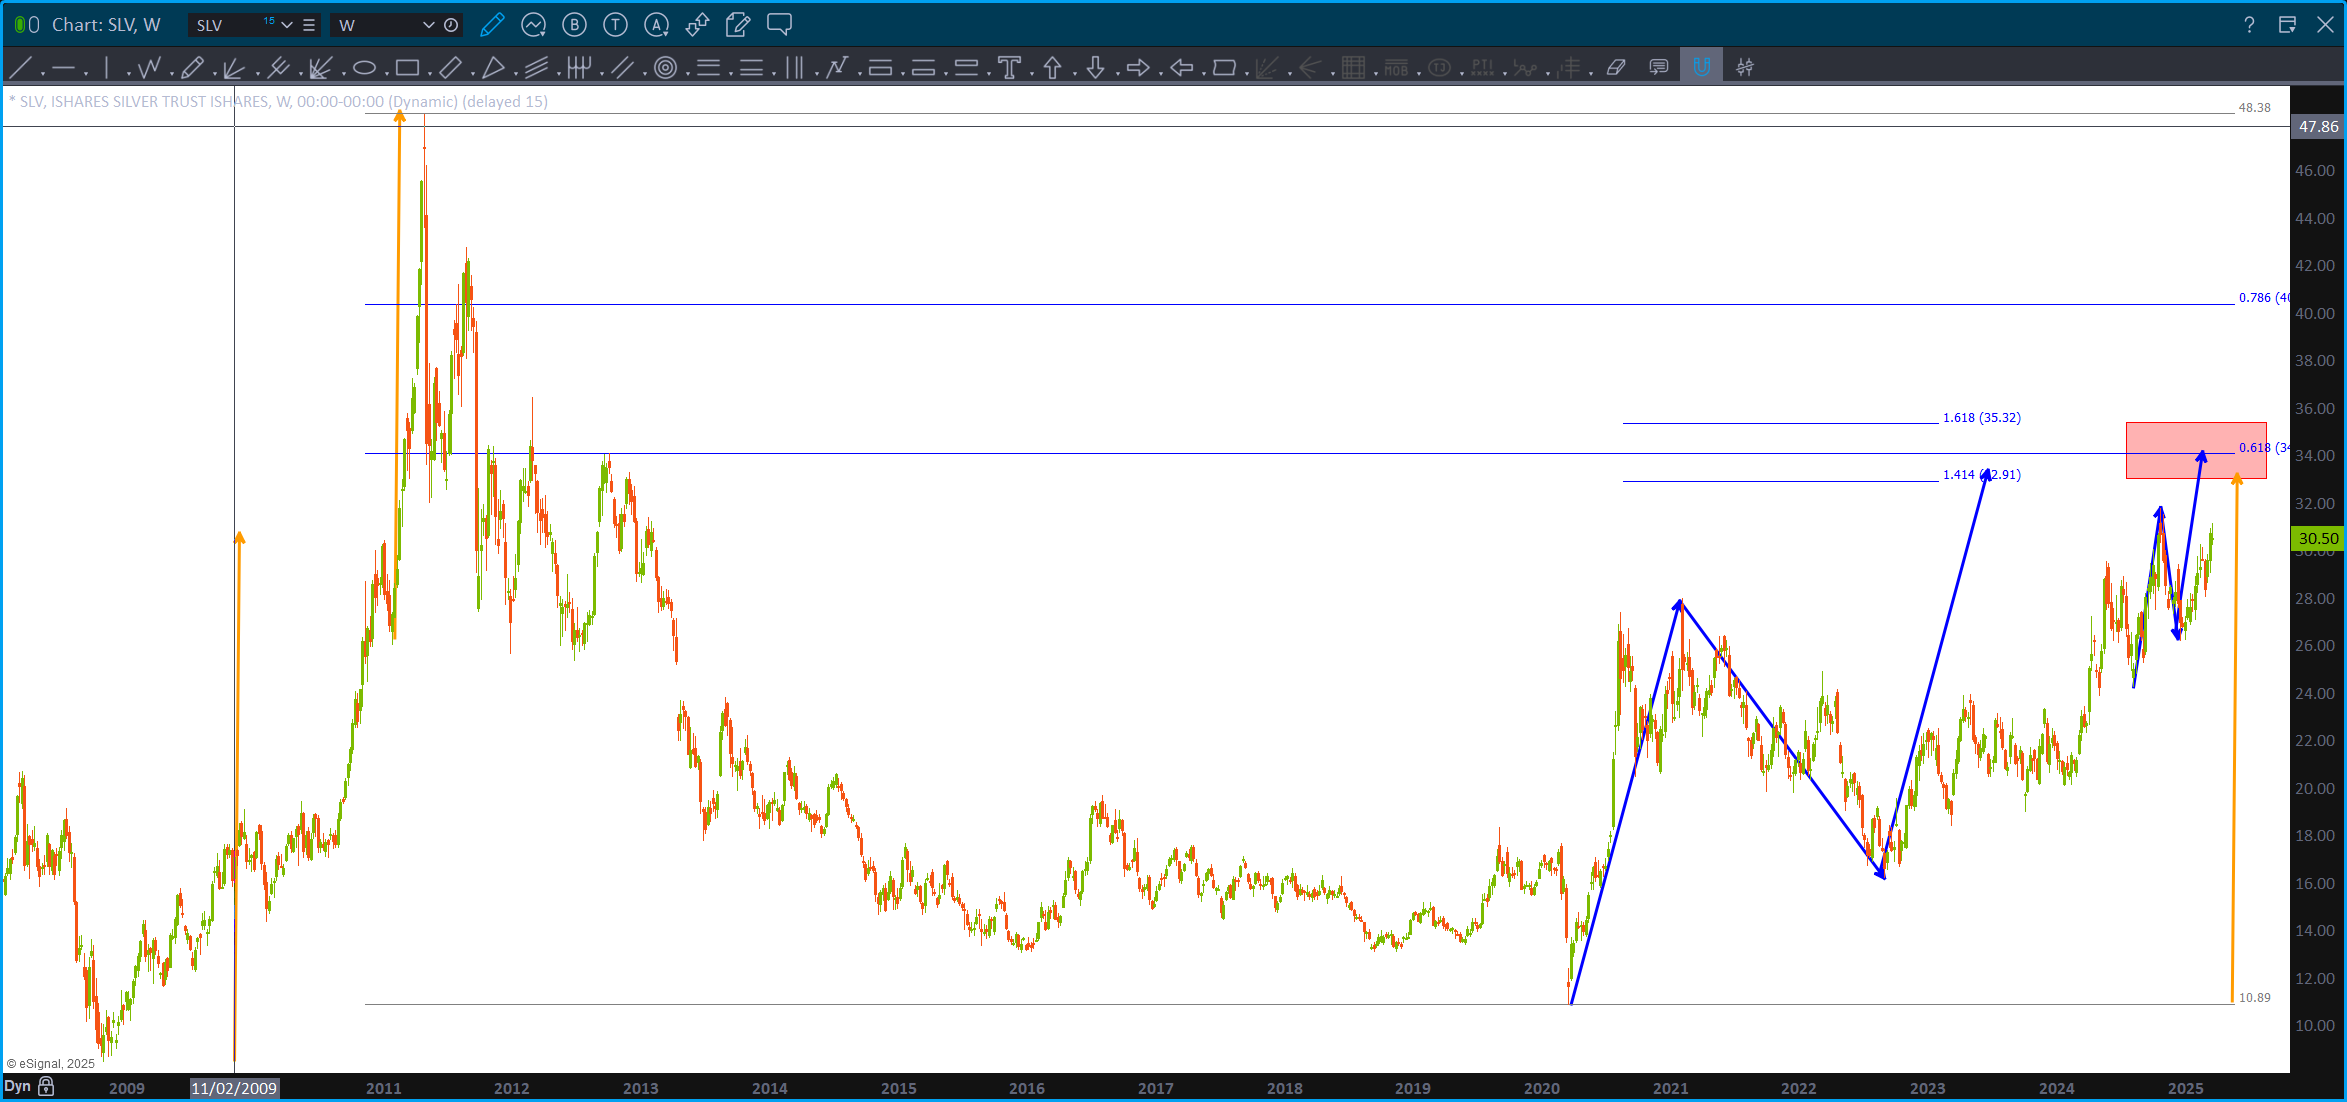
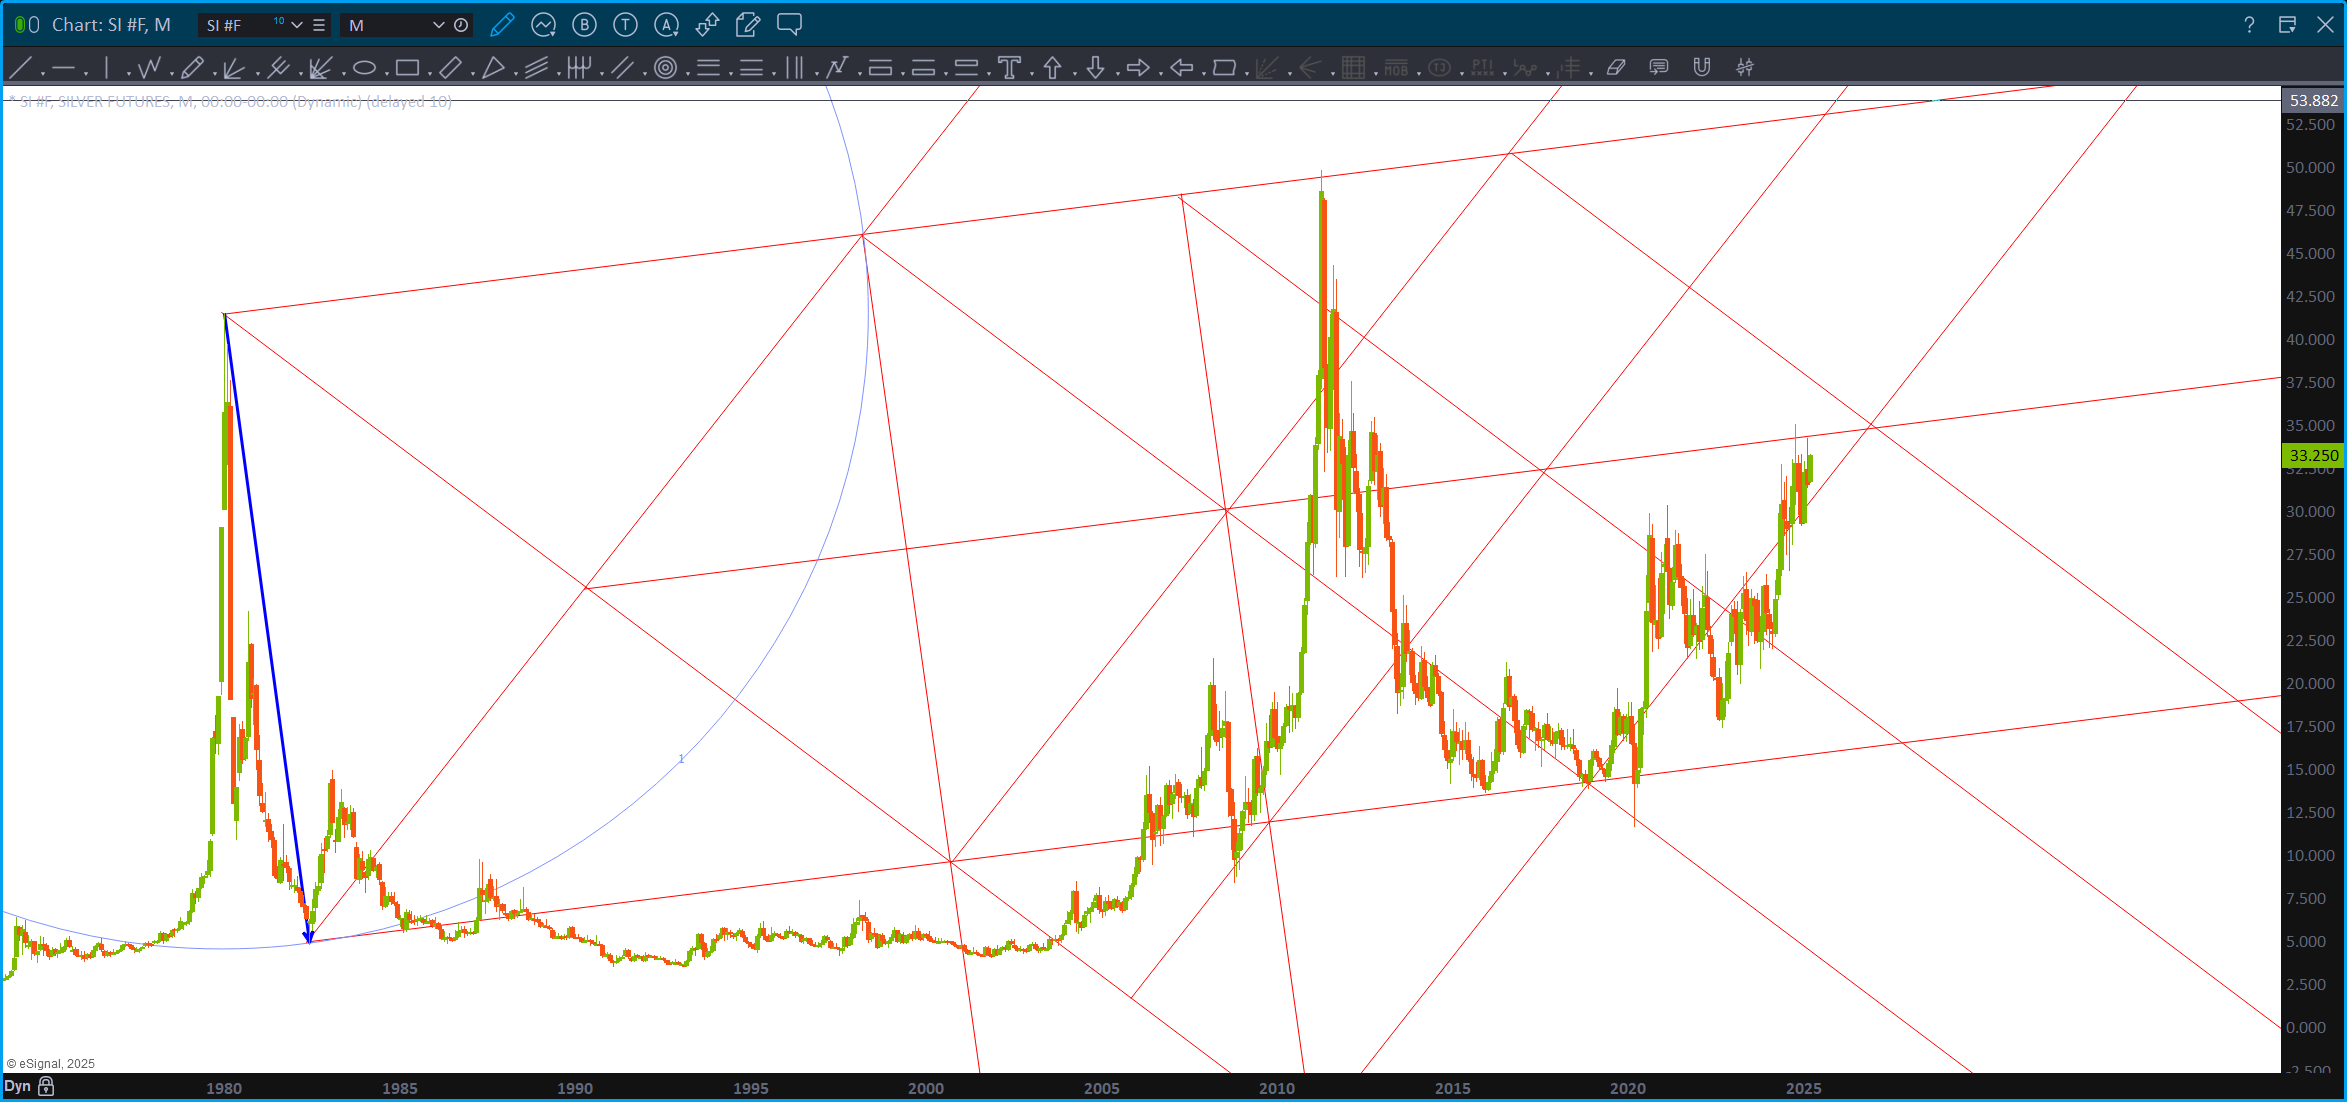
Was asked to take a peak at the Geometry of Silver:
YEN – March 03, 2025
Posted on March 3, 2025 Leave a Comment

The YEN, across the board, respected the PATTERNS and strength for the YEN has happened across the board.
It’s fallen out of the ‘hype cycle’ since last July … I think its about to get in the news again.
Going to go a little esoteric on you but I want us all to understand the potential move that is going to occur.
BLUF: high probability of a year+ (?) move in the YEN – strength.
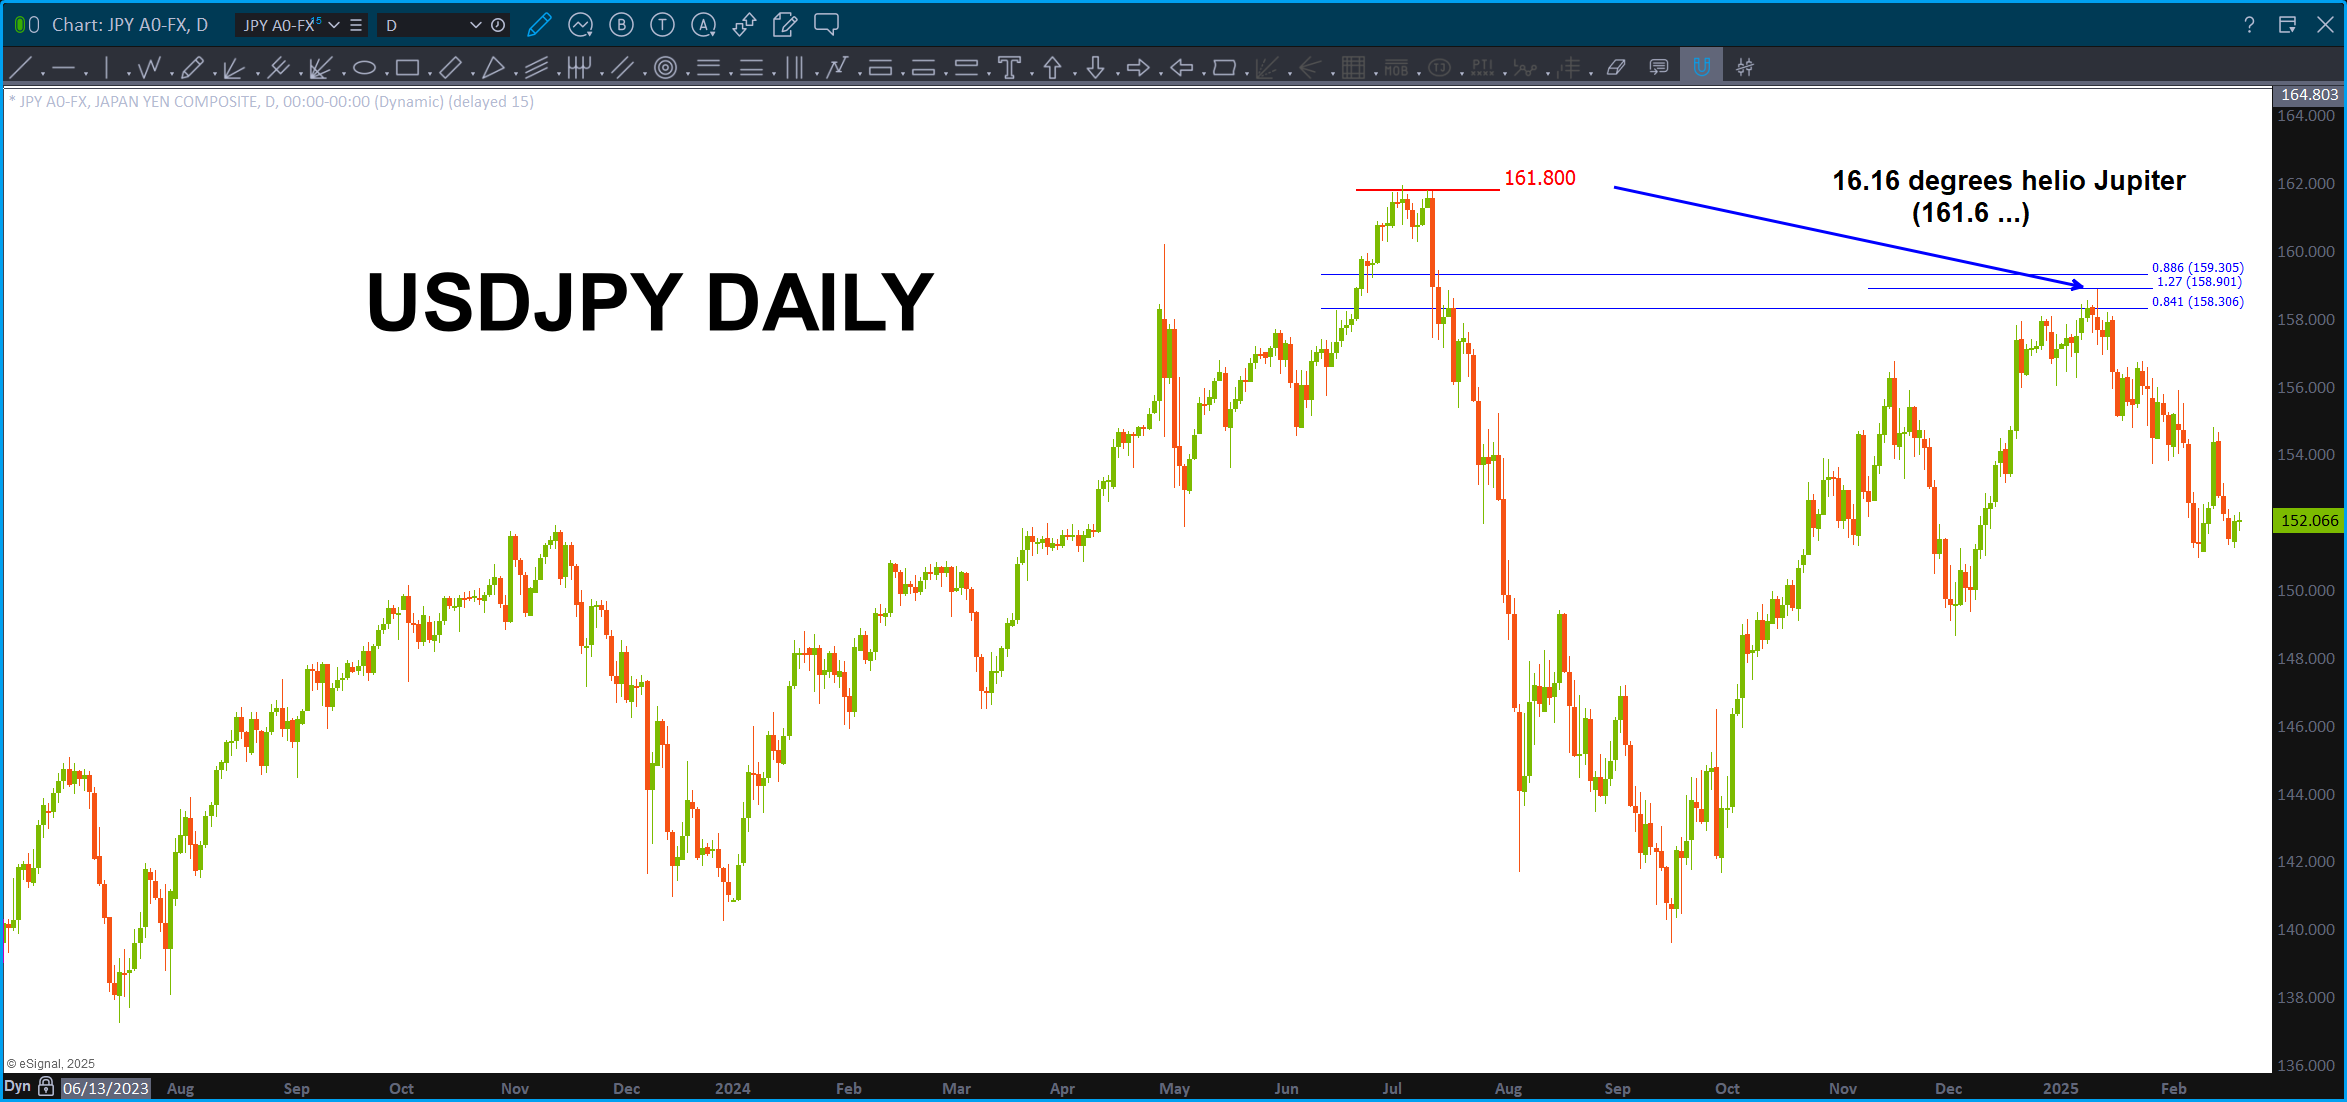
But, let’s take a step back to the magical 1.618.
The USDJPY topped at 161.8 or 1.618.
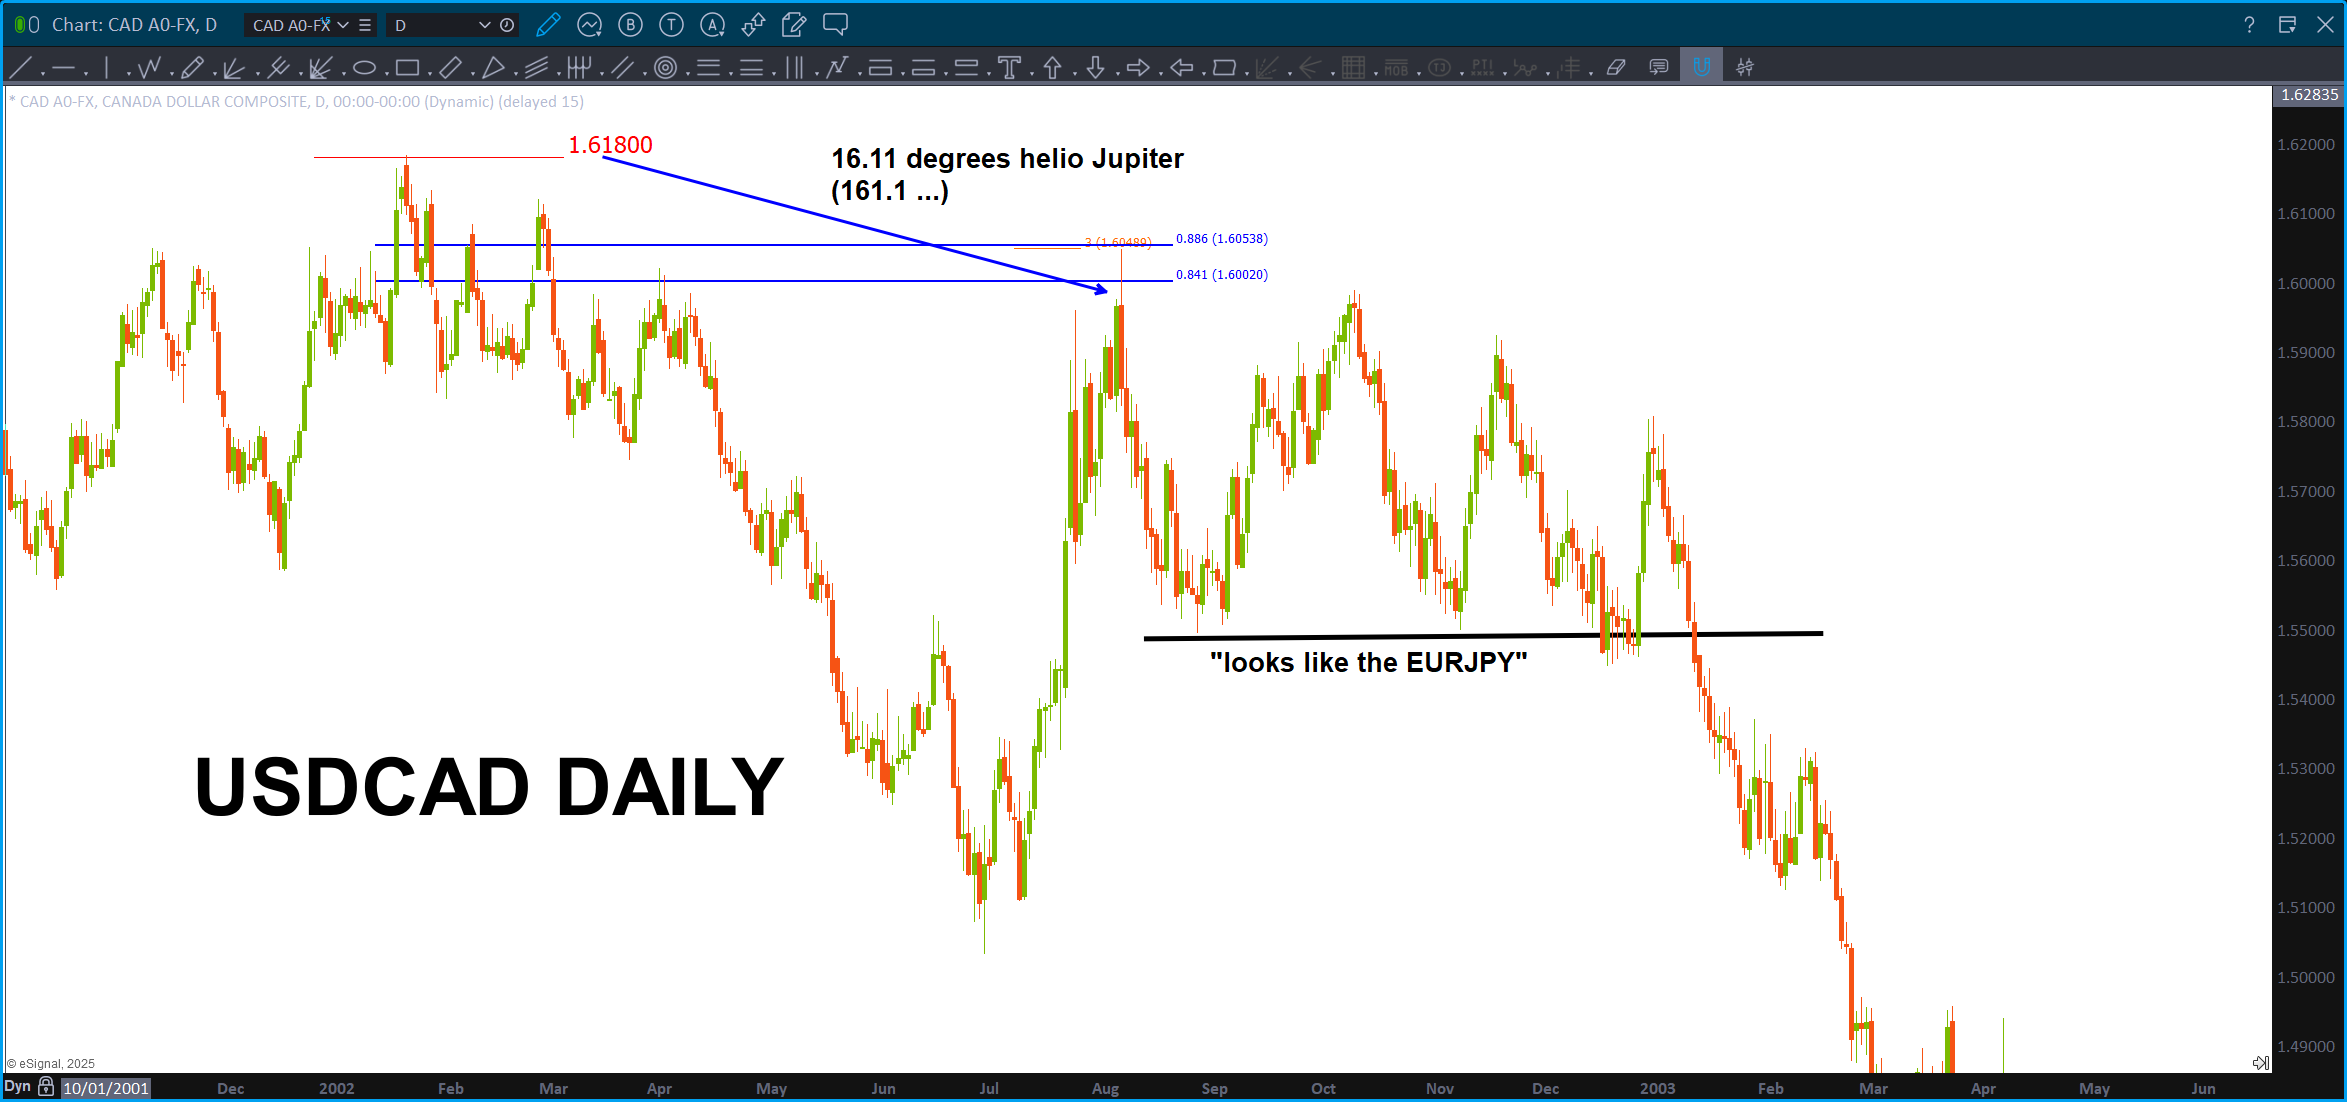
The all time high on the USDCAD? 1.618. Yup, no kidding.
So, as I was looking at the two charts I thought – that’s a very important number. What really caught my eye was the harmony and moves after the high at 1.618. Both fell, then came back right up into the .841-.886 retracement level.
Then, I though, I wonder if the SAME planetary vibration is present. See for yourself folks – Jupiter Helio squared the high – both times.
Now, put your eyes on the EURJPY – it’s the SAME picture that the USDCAD had (almost exactly) and that, folks, makes the probability of a big YEN MOVE coming, higher. Remember, it’s just a pattern … watch the cliff of the EURJPY peeps ….!!!
Check this out folks …
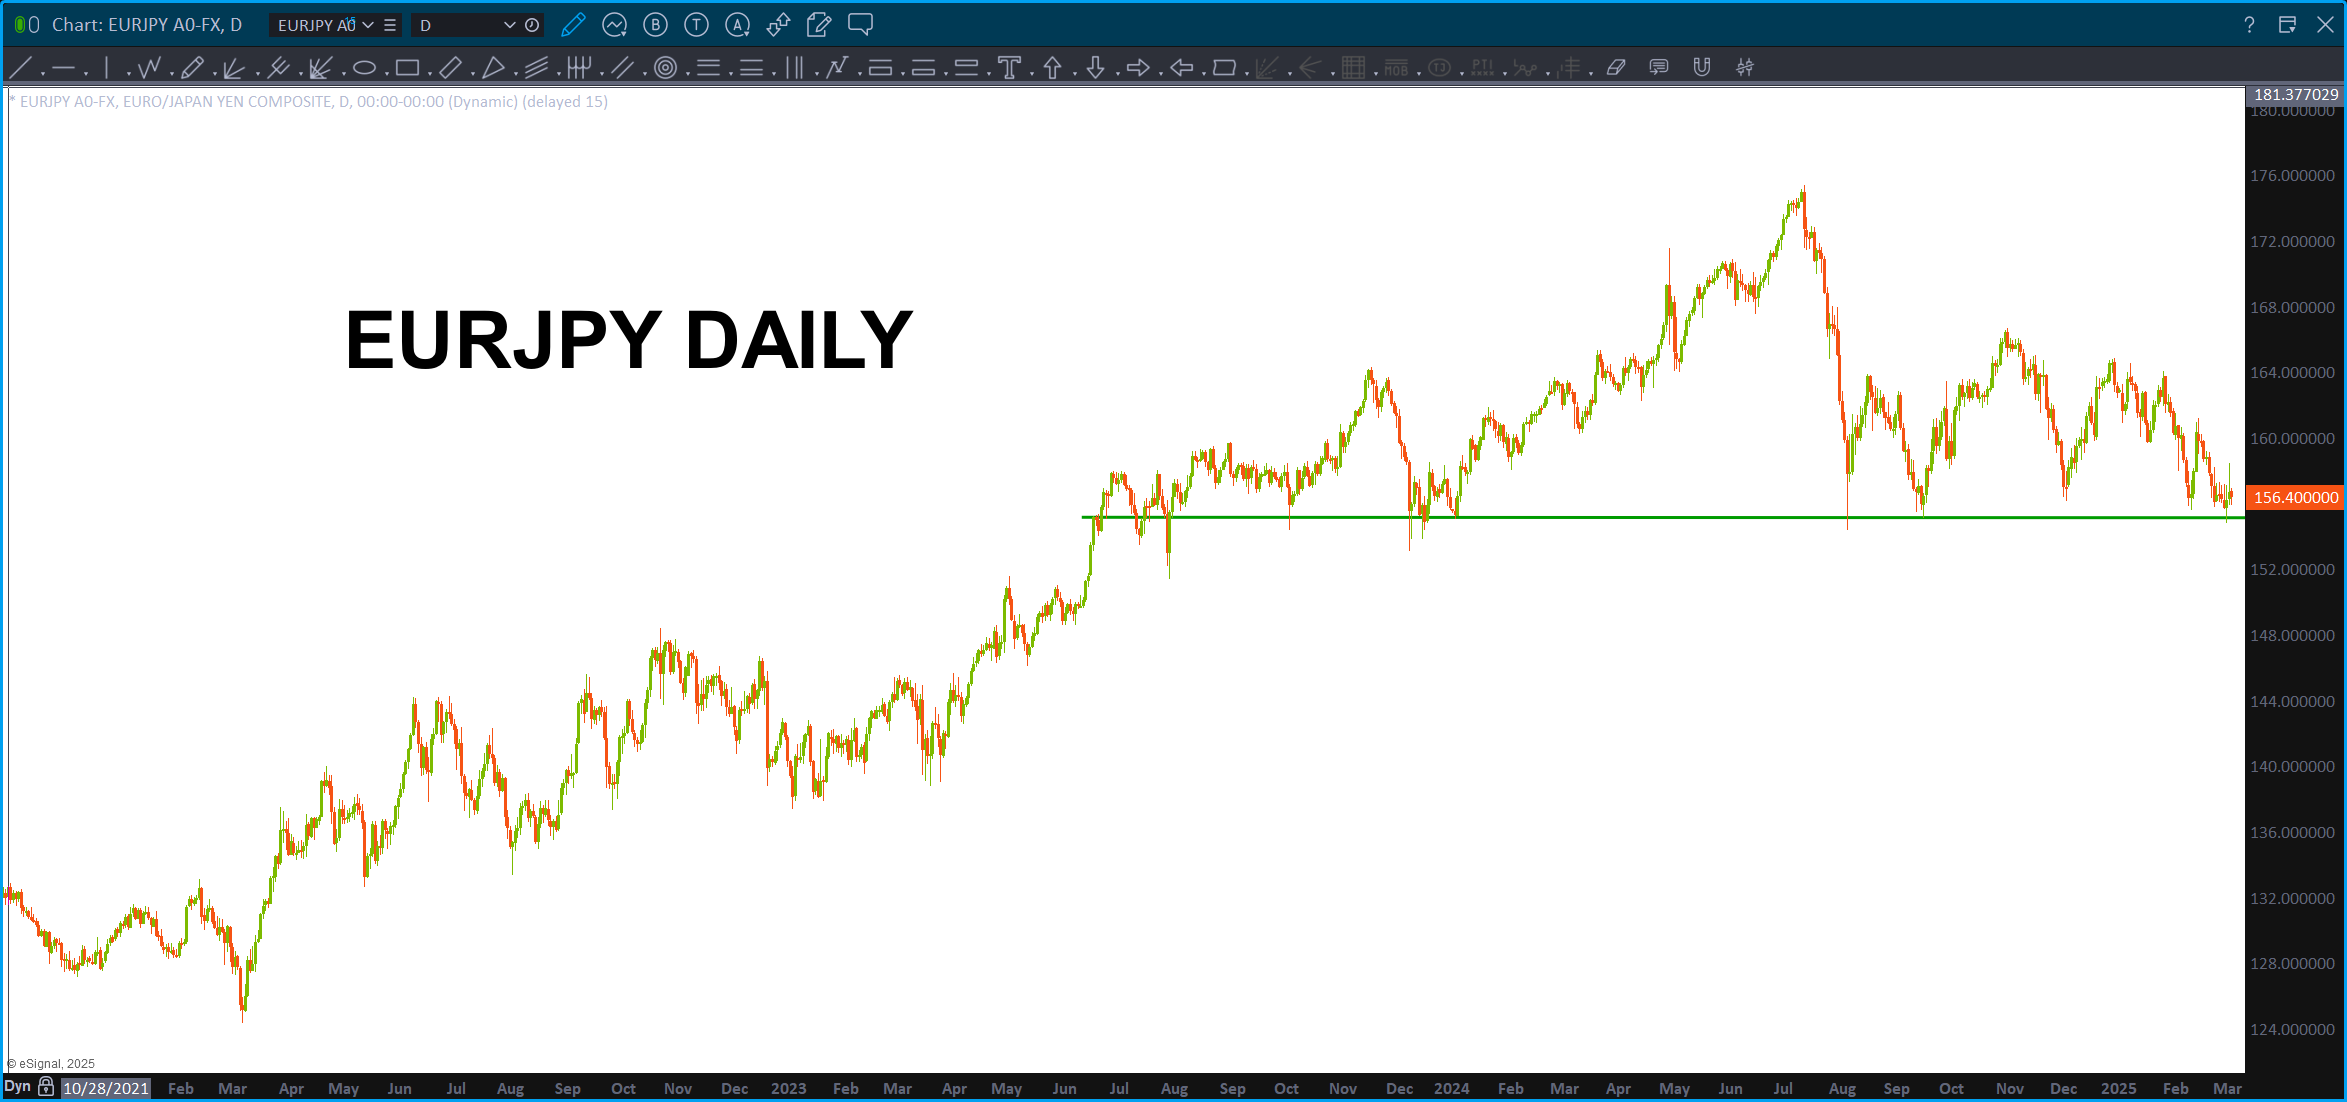
WOAH …
XLF – March 03, 2025
Posted on March 3, 2025 5 Comments

Couple things …
1/ As many of you know, surfing has, frankly, changed my life … for me, there is NOTHING like catching that perfect wave. I truly feel like I’m on the “echoes” of the Big Bang – and GOD said “let there be light.” The VIBRATION caused light … thru the medium of a surfboard and water, you get to ride the wave. It’s the PERFECT balance of your right and left brain. The left brain is working to literally perform the geometry and physics of positioning the board in the right position to catch the wave … the right brain takes over on the wave and a canvas of water is laid out in front of you and … the Architect says ‘here you go Bart, what ya gonna do …’ and you go and CREATE. The key, as taught by Kanga Cairns is to catch the correct wave. There is a LOT to that … ultimately, you stand (I SUP SURF) in the lineup and you keep “looking out back” for the bump on the horizon.
“Ahhhh, yes, here come the sets … let’s f’ing go….”
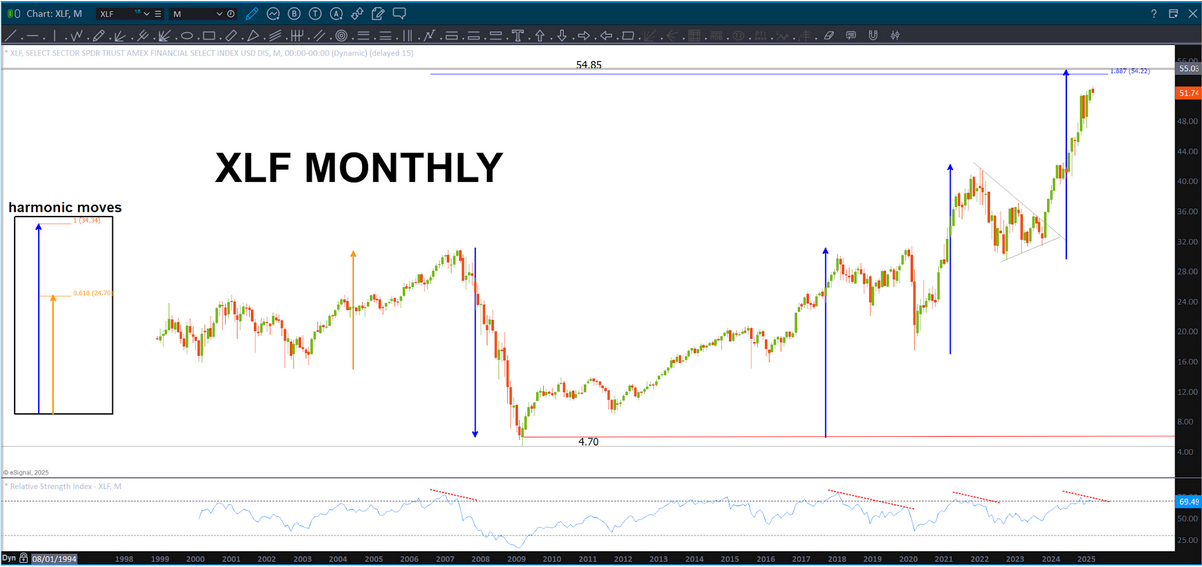
I’ve been watching a lot of waves go thru the line up but, honestly, I’ve been waiting for what we call the SET wave. This wave is the XLF. Come to poppa …
Surfing has also taught me, multiple times, how to be humble. I’ve missed more waves than I have caught (just like the markets 😉 ) and I’ve almost drown more than a couple times getting “ahead of my skis” so to speak but I keep charging …
So for those of you sitting in the lineup w/ me waiting for the wave … XLF is getting very very close.
2/ Just look at the XLF chart. It’s just so easy … after 24 years (yes folks that’s how long I’ve studied it) I’ve distilled the sacred geometry, numerology, quadrivium, astro, kabalah, biblical cycles, etc. etc. to the measured move. I’m a slow learner.
EVERY MOVE IN THE XLF HAS BEEN HARMONIC .. dont’ trust me, look at the chart. What are the odds that XLF will blow thru that measured move target a little higher? I truly have no idea … but we have a ‘set wave’ coming at us peeps …
Also, nobody is talking about the Yen vs the world … I’ll post about that later.

Markets Part II
Posted on February 2, 2025 Leave a Comment

Last post on the Markets: https://atomic-temporary-44460632.wpcomstaging.com/2024/12/17/markets-december-17-2024/
6 weeks later …
The big one to watch is the PATTERN FAILURE on the European Banks.
Banks/Financials are still key.
GAIA – February 2, 2025
Posted on February 2, 2025 Leave a Comment

OK, where the heck did January go … WOW. Blink ..
For those of you who might be interested, CODE-X II by Robert Edward Grant will be airing in a few weeks.\
Ummmm, your going to want to watch this …
A very awesome and fun new friend, Riley, shot over a chart of GAIA (had no idea they were publicly traded) and asked if I would buy.
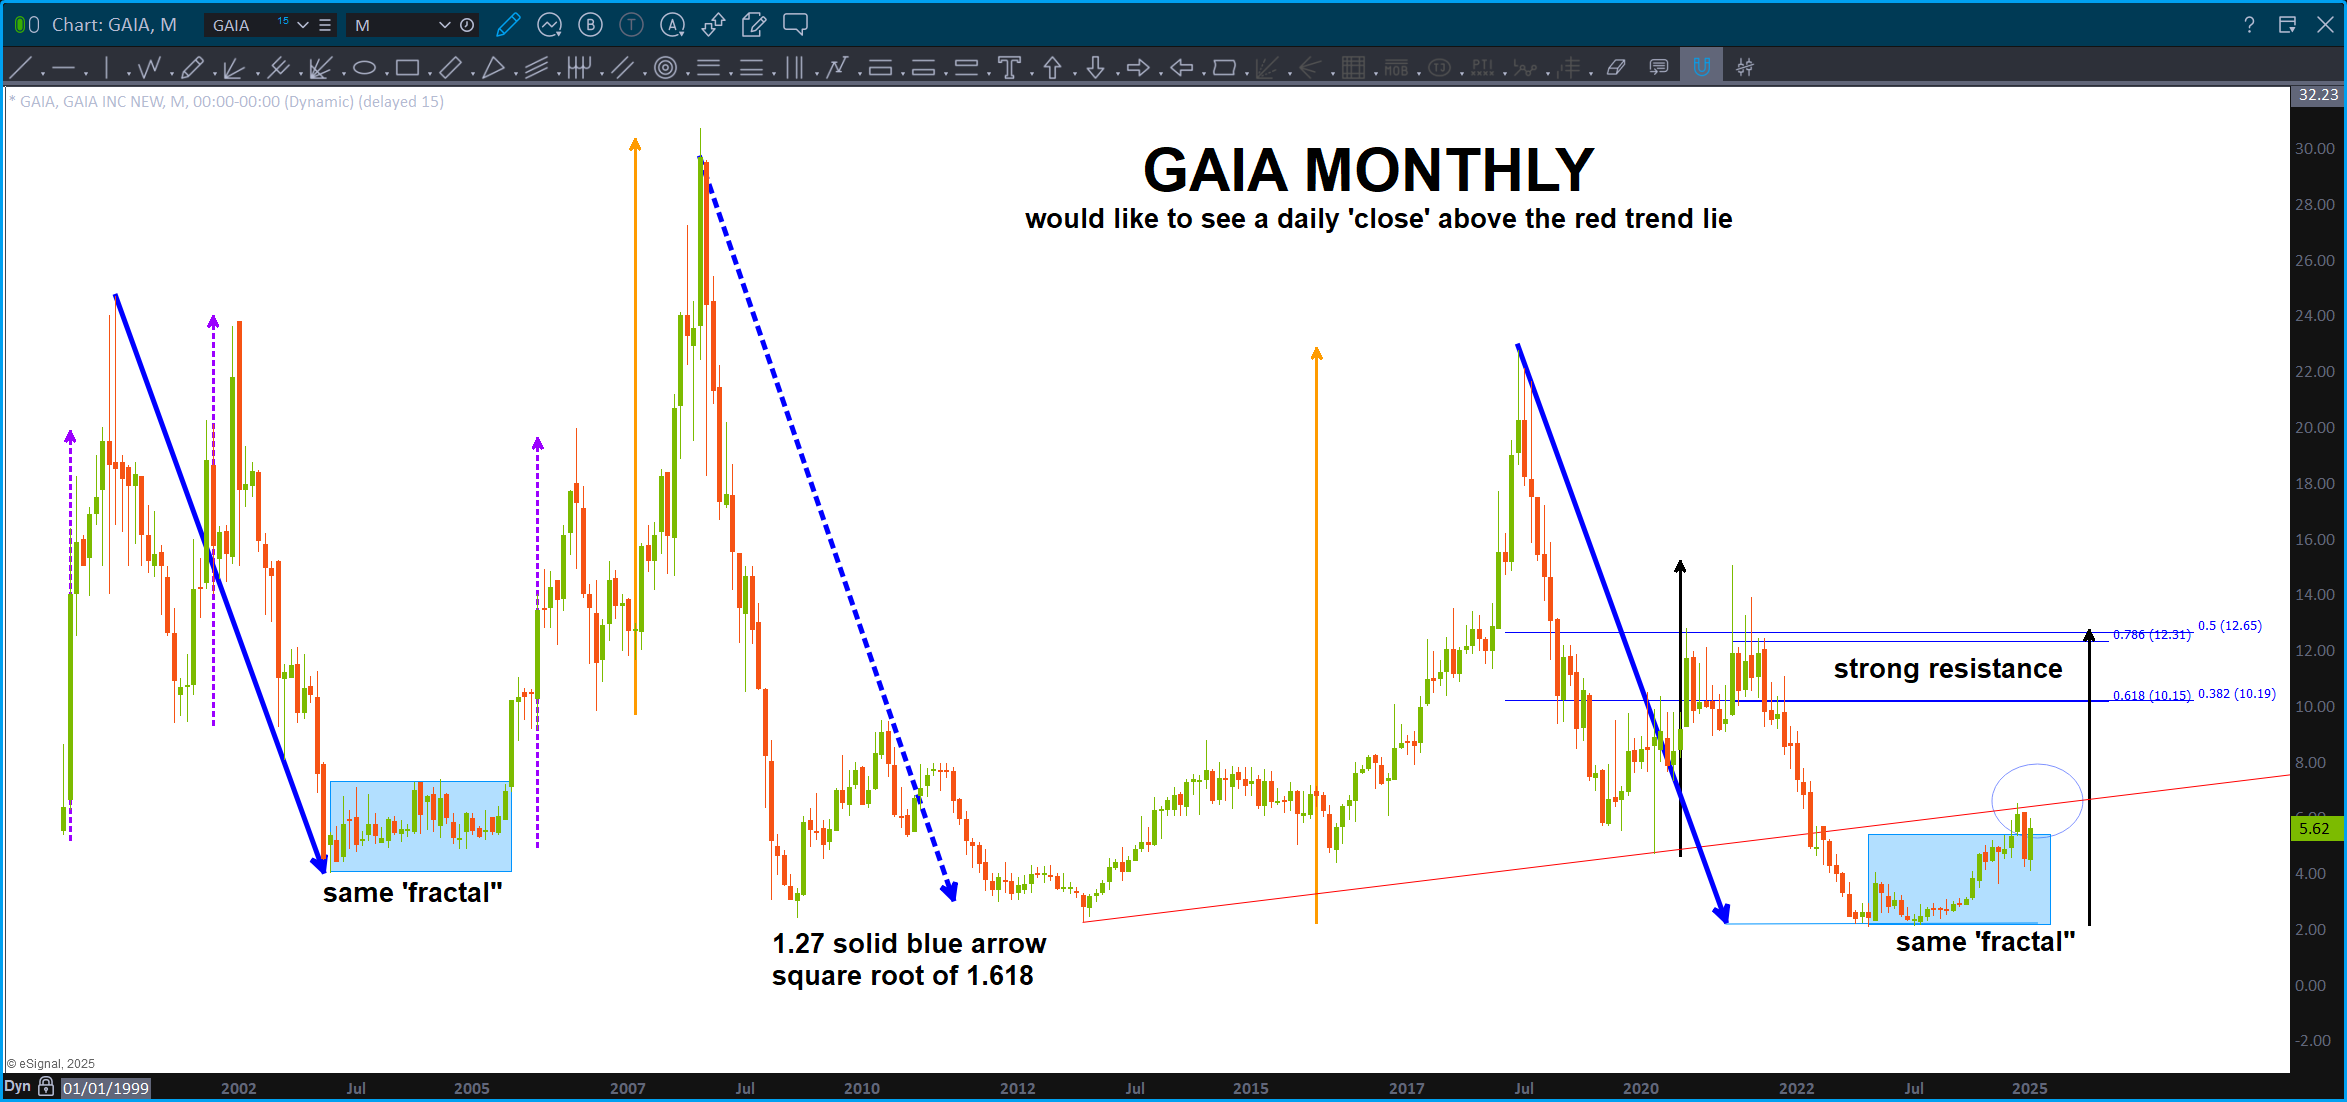
Didn’t take long … based on the content of the Gaia channel (trippy) not surprised that the stock is harmonic! Note we just completed the exact same ‘fractal’ (solid dark blue line) and then we had ‘somewhat the same fractal in the light blue rectangle area so … yes, I’d be a buyer and would really like the red line to get defeated as resistance on a daily close above.
Strong resistance is higher but, perhaps, we have another move higher like we did the last time this fractal completed. Or not …
Bart
