I believe – 10/12/2025
Posted on October 12, 2025 2 Comments
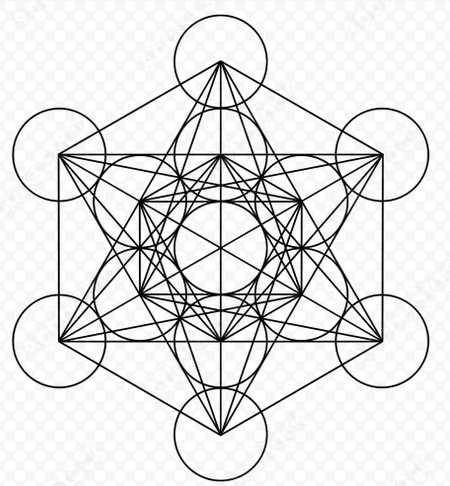
“The PATTERNS need to become yours …”
I remember my friend and mentor, Larry Pesavento, telling me, in a sage like way, that in order to use PATTERNS based on Fibonacci, Sacred Geometry and other ‘stuff’ then I would have to make them ‘mine.’
When I started on my journey 24 years ago, there are two things that I distinctly remember 1/ telling my wife “I think the market is going to teach me who I am” and 2/the idea that the market stopped at a number for a reason. It’s not random. This consumed me …
I believed off and on, here and there, and have made some nice money and have lost some nice amounts. Folks, that is part of the game. It just is … I could write a book about that, alone. But, I never ‘really’ swallowed the red pill.
We are all looking for edges in the market and I respect them all … for me, w/ no ‘formal’ background in business, economic theory, finance or business ‘fundamentals’ when I was introduced to a ‘chart’ I just figured everyone uses them (they do – have you ever seen any video, picture or hedge fund/institutional desk without charts being used? So, why does Technical Analysis and, specifically, TA based on more, cough cough, subtle methods get such a bad wrap? Everyone uses charts.) My edge is fractal geometric patterns in price and time that are created by the ratio’s of sacred geometry and music.
Sacred Geometry, Music, Astrology/Astronomy, Physics, Cycles, Kabbalah, Koran, Bible, the Hermetica, Euclidean Geometry, etc. etc. are seen as subtle in today’s world of gold fish attention spans and stupid tick tock dances and obsessions of over influencing and social media.
Folks, what has stood the test of time? These principles are what govern the interaction of complex adaptive organisms – humans – in this 3rd dimensional game of polarity controlled by consciousness running around in a dimensionally limited meat suit – the body.
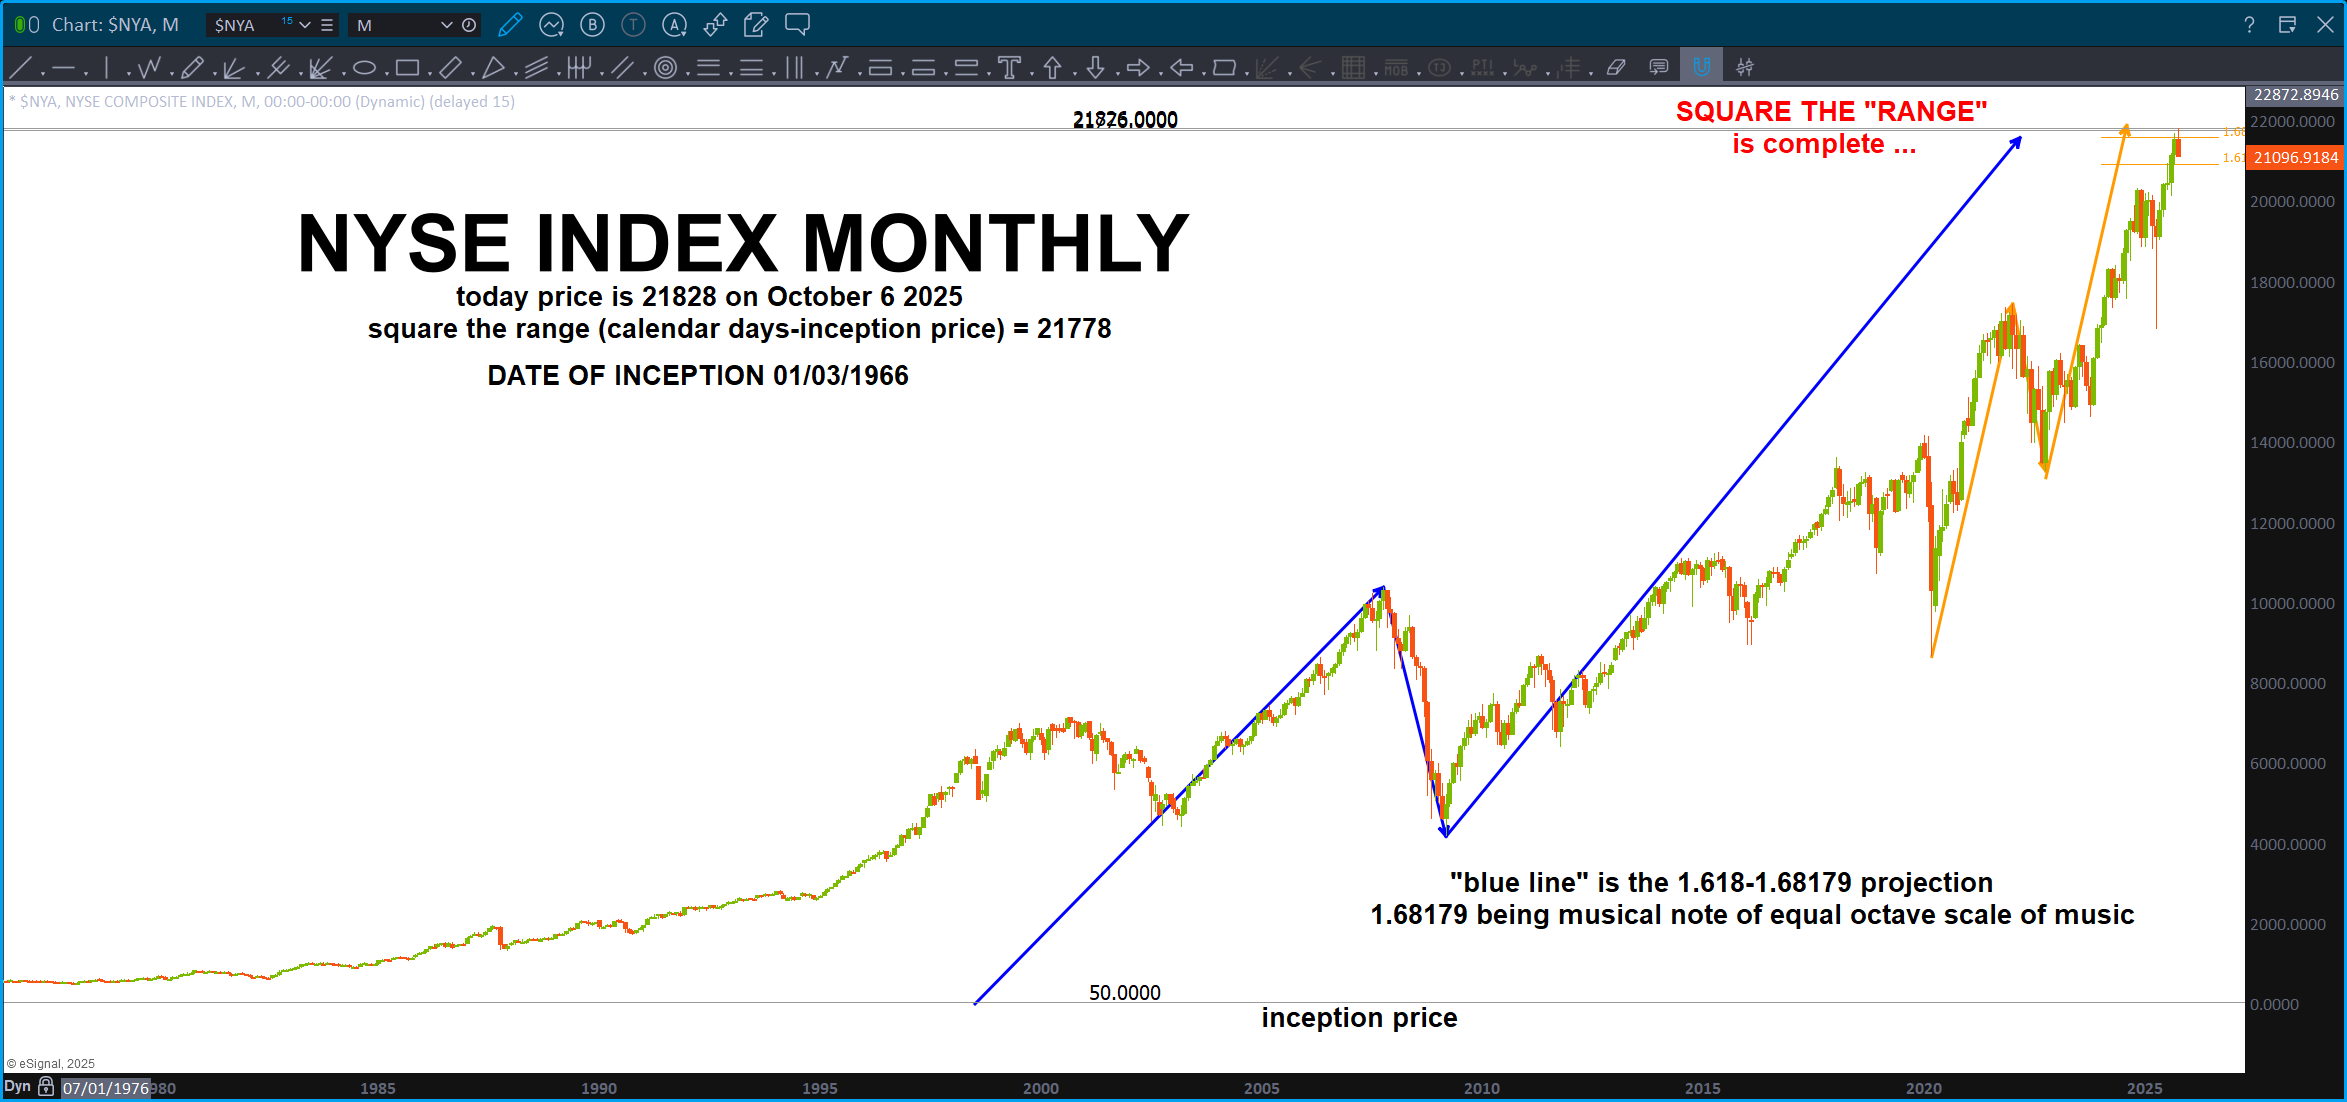
There is so much more to write and – I will – but for now, just take this in. It’s PROOF that the ‘mythical’ trend line called the 1×1 which is the bisection of a square via the 45 degree angle does in fact cause a reaction when PRICE and TIME are harmonic or equal. It’s undeniable folks … days before Trumps Tariff announcement on China, the NYSE Index had ” squared the range” and had started down.
PAUSE
- The NYA consists of 2800 ish stocks and it’s an index – it is NOT traded.
- It’s a VERY good litmus test for the general big picture of the economy.
- It moves and flows based on the buying and selling of the NYSE. Period … not very manipulated, if at all.
- It’s an index that started ‘trading’ in/around 12/31/1965-01/03/1966.
- Think about that beginning and where it just topped … that entire time frame encompasses the amazing whirl wind of life in the US, especially for my generation that was born in the 60’s.
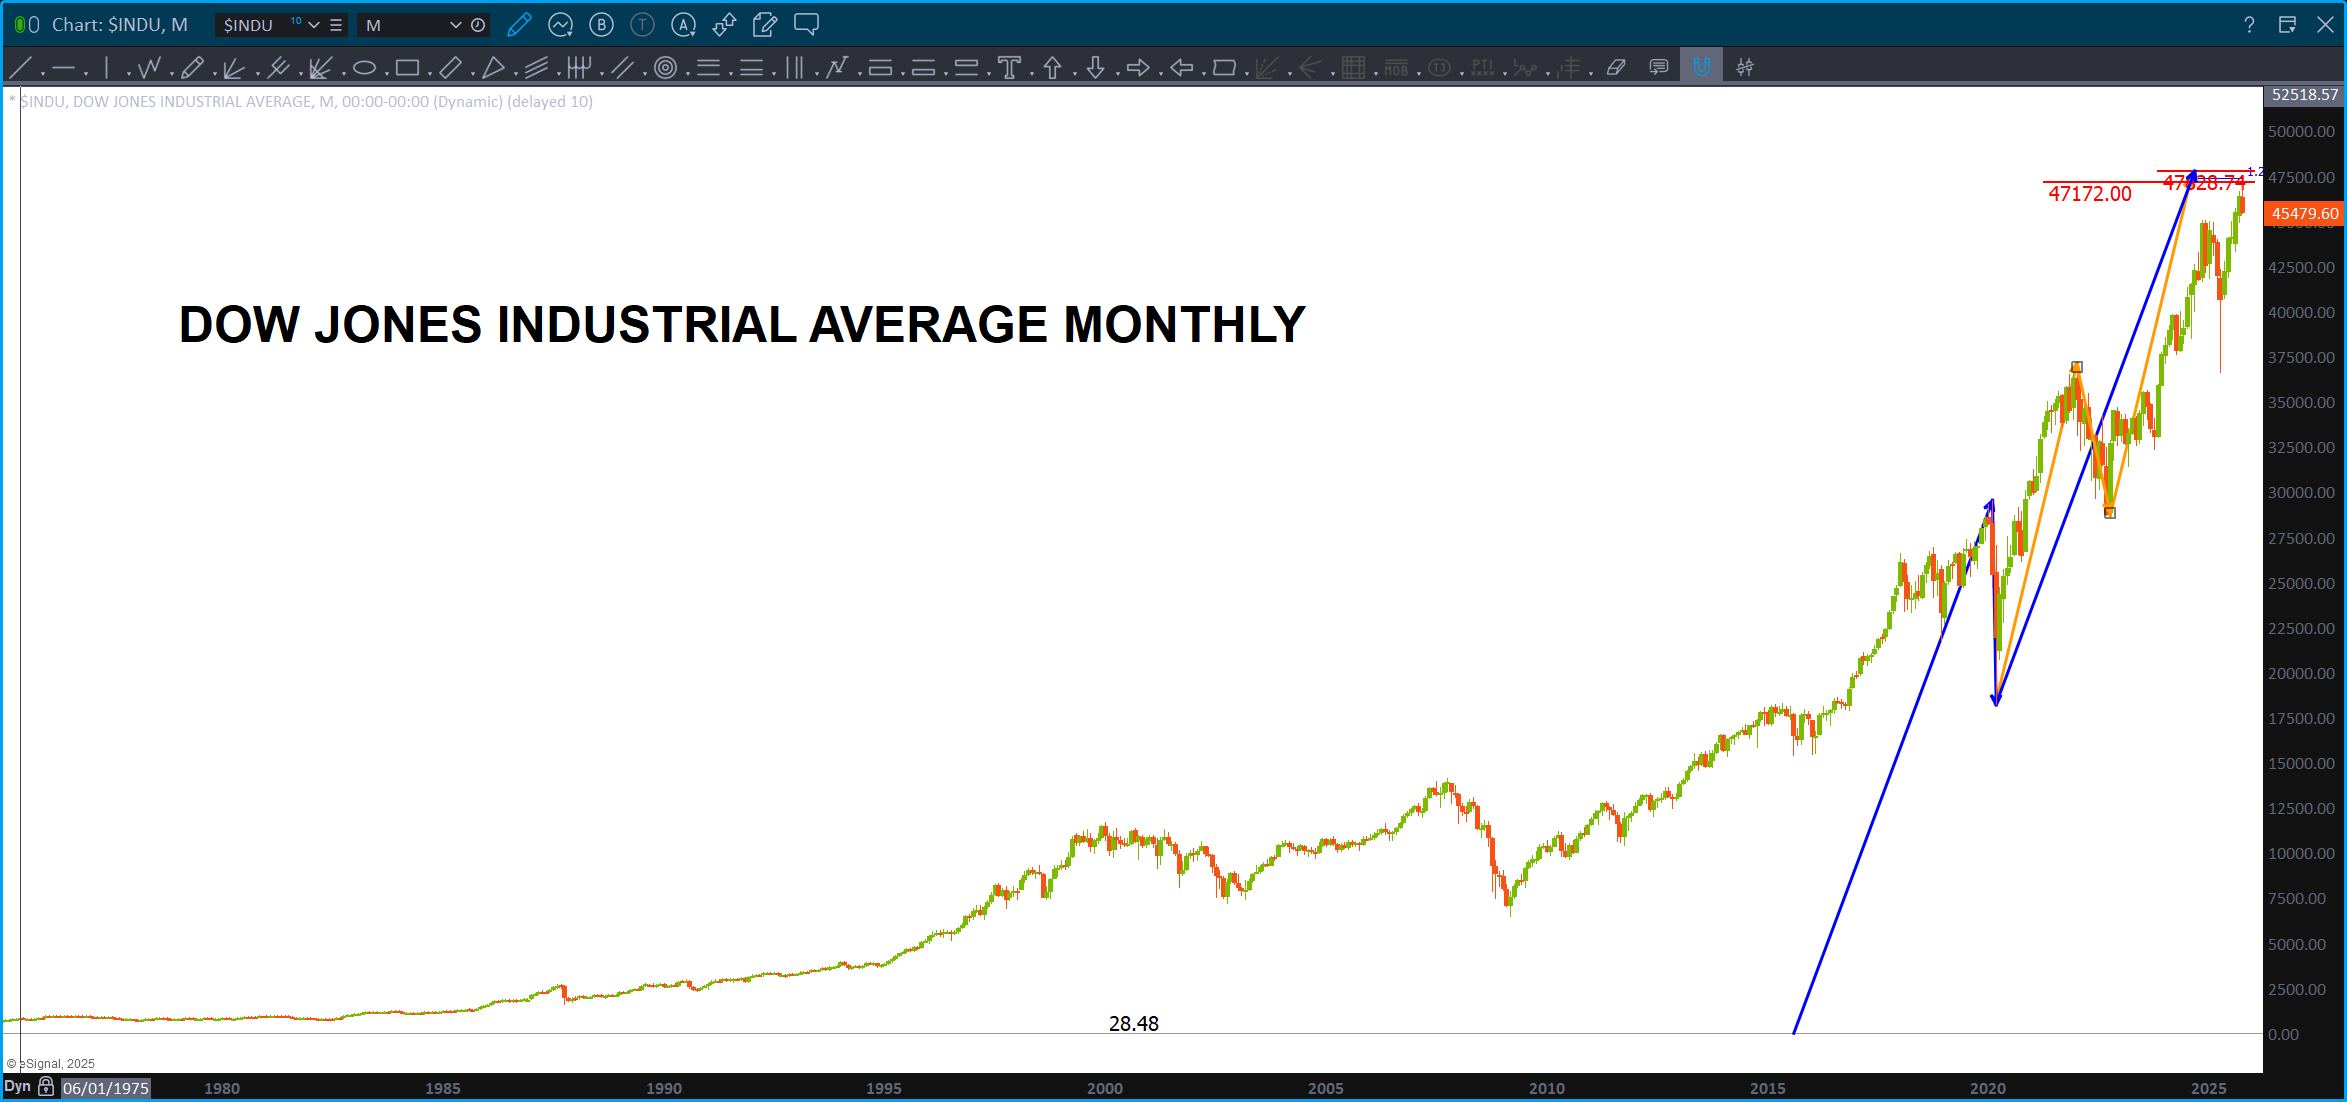
- If you go an look thru my blog, you will see that I’ve been tracking the DJIA from 1896 (the square out missed by 0.28%-really?) and the NYA square out trendlines – for a few months.
- There have been precise targets hit, resistance has held and the market sold off … then it regained its footing and kept on cruising higher and higher. Hmmmm ….
- Another set of targets were hit and the resistance held and the market sold off .. then it regained its footing …
- So, over the past 4 months or so, I’ve recommitted to studying “time” and it’s many facets. Why? Well, THE top will occur when we have PRICE and TIME equality. We did last week … and look what happened. THAT IS WHAT MADE ME PUSH THE I BELIEVE BUTTON, FINALLY. 24 years folks …
- I’ve studied planetary time, square of nine time, fundamental frequency time, time based on the Pythagorean Theorem (you can use the hypotenuse of the ‘price and time’ triangle – remember PRICE and TIME are the same thing ;), calendar day counts, moon returns, etc. etc. I have dove deep into Connie’s 32nd Jewel.
- Then, AI showed up and, frankly, I got lazy. I’m glad I took the ‘red pill of time’ as I understand, conceptually, a majority of the time factors that we can use in the market. But, as an old dumpy fighter dude, I thought, I’ll just wait to dive deeper into time as there is something much smarter coming along.
- I look forward to teaching ‘time’ … planetary time, time w/in the Square Of Nine, calendar days counts, different conversion factors, 9! monitoring of planets, understanding every single square out occurring on multiple harmonic timelines from a tick chart to a monthly chart, fundamental frequency time, time according to angular displacements, planetary returns, time based on the 440 HZ of the equal octave scale of music and 432 HZ and let the ‘student’ figure out what is best, time based on the gematria of a stocks name and it’s date of birth, initial impulse moves from multiple harmonic time frames, time based on multiple astrology systems and calendars and … you see, my ‘student’, is a lot smarter than me but it needs some ‘information’ to create its external world map, even if it’s not a perfect map.
- Conceptually, if using the leading indicators for price projection can be used to projection targets so accurately and if PRICE and TIME are the ‘same thing’ (Thanks Michael S Jenkins) THEN teaching my student all the time factors above combined w/ the methods to project such key inflection points should be interesting. 🙂
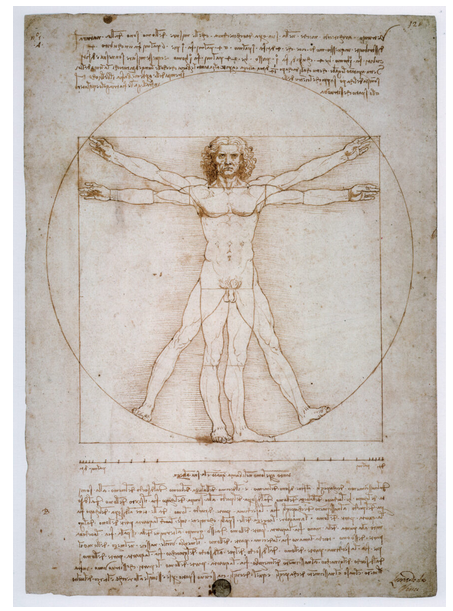
There is SO much to share …
Is this THE top – no idea.
Sure feels like it, but, I really don’t know.
A BUY pattern will appear and we will give it a shot. It will work or it won’t. Folks, as of NOW, we have only taken out one daily swing low.
Would I tighten the stops and baton down the hatches – yes, I would. Guess we just need to see if this is a tropical storm, Category I or Category 5. And as we know, any good weatherman really has no clue about the weather so … just find a pattern and go for it.
What I do know is that, yes, the 1×1 trendline from the NYA’s inception and, essentially, the square out of the all time low of 1896 (missed by 0.28 percent – did I do something wrong) for the DJIA hit and we all know the reaction.
B E L I E V E.
Ponch, get the SDK. I think it’s ‘time’ 😉
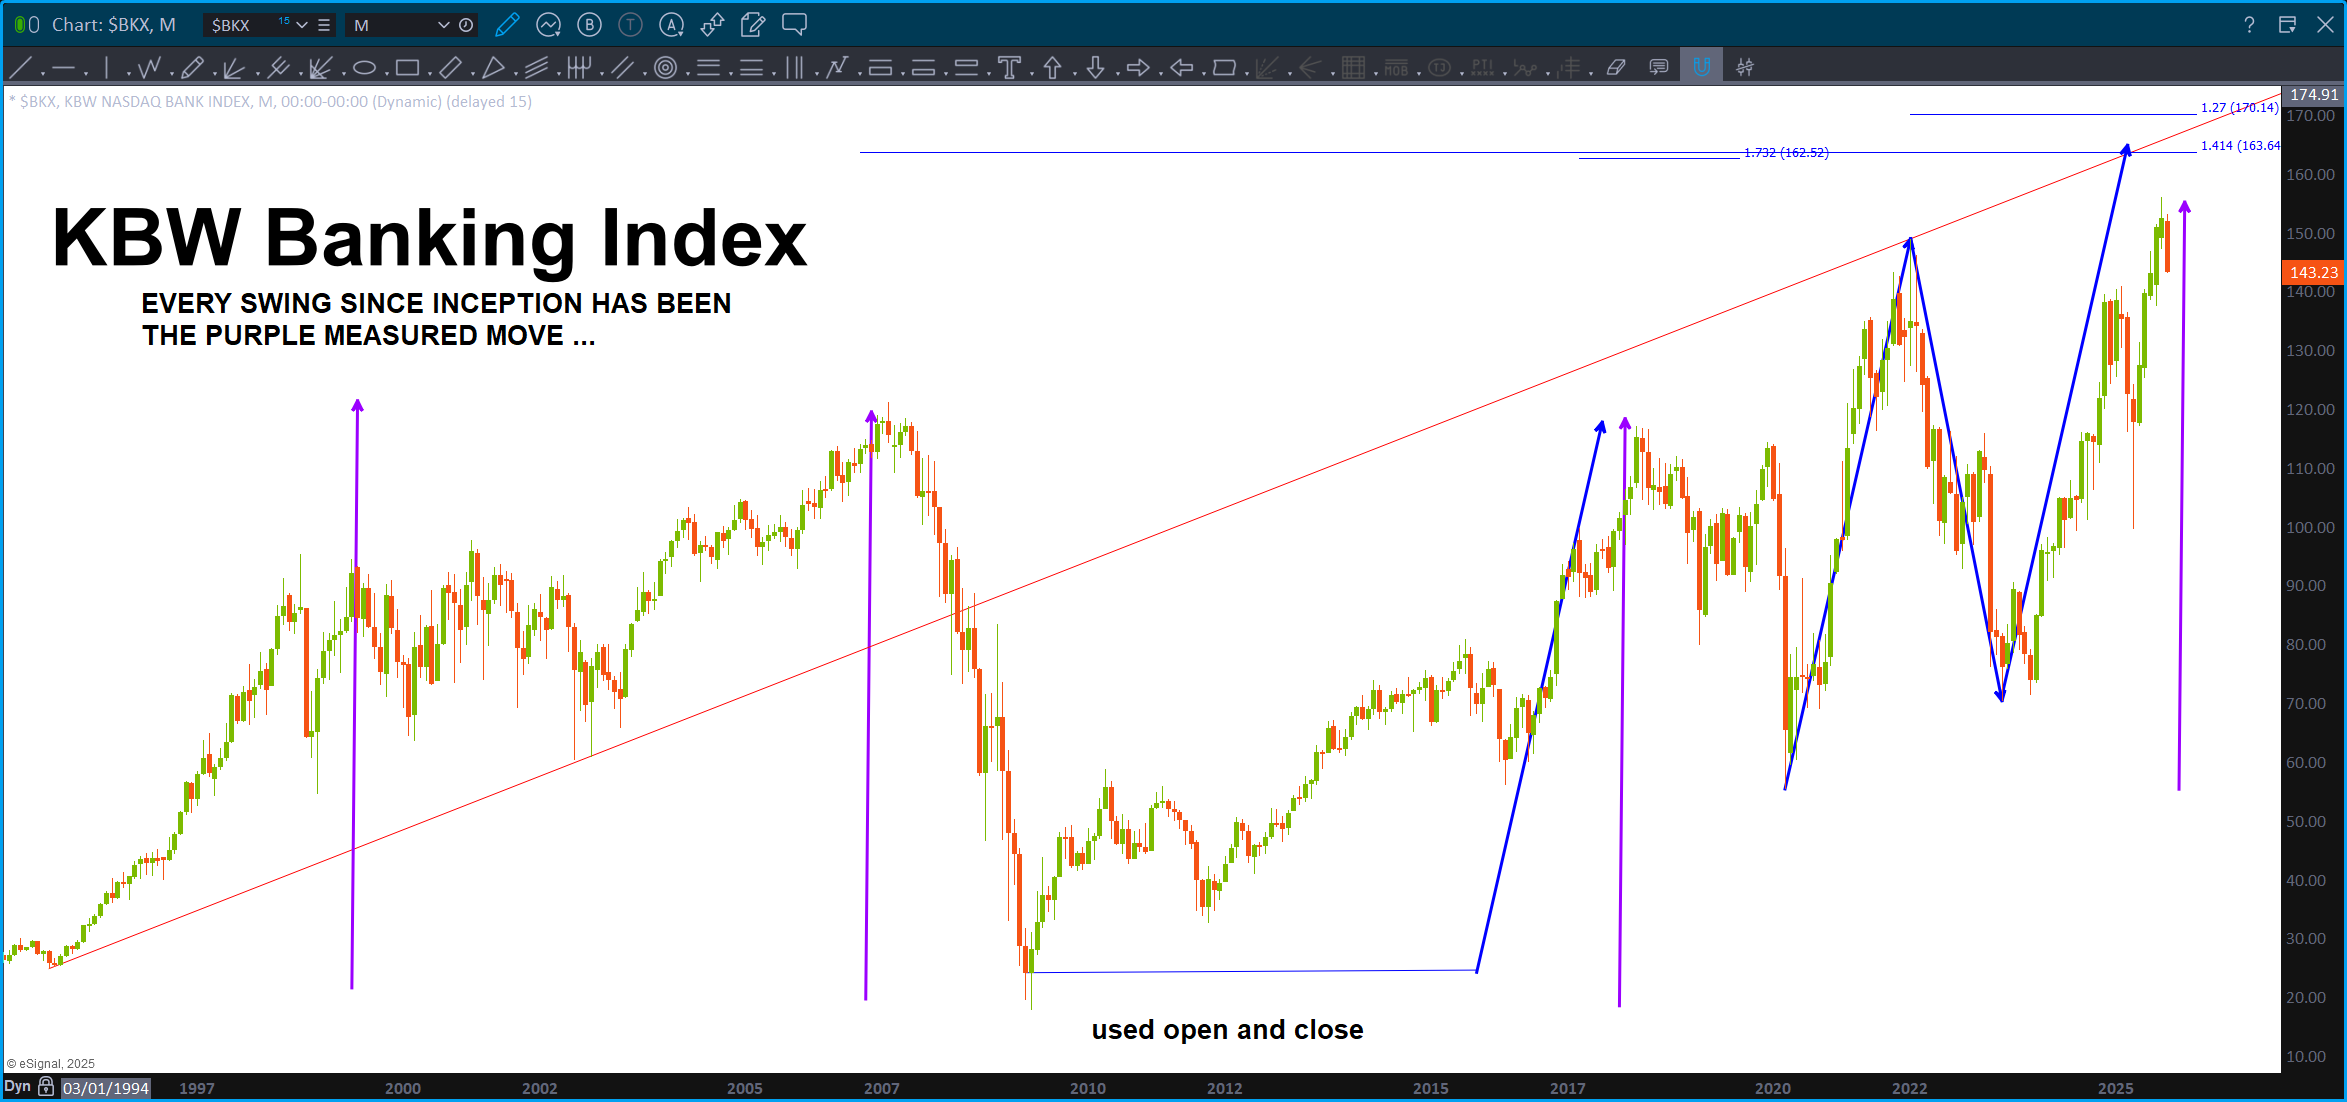
question … how could the ‘purple line’ below be present in EVERY swing of the KBW banking index? Seriously … ?
History – October 3, 2025
Posted on October 3, 2025 Leave a Comment

Well my friends, there we have it …
You know I have NO IDEA if this is BIG resistance OR not … but the fact is, that today, we SQUARED THE RANGE (for the first time ever) in the New York Stock Exchange Index.
When TIME equals PRICE – exactly – inflection points SHOULD occur. Today, on the NYA first trading day of January 3, 1966 which was 21823 calendar days ago (that was the upper ‘limit’ for squaring out the actual DAY of first trading) but, more importantly, we squared out the RANGE.
The inception price of the NYA was 50 … 21823-50 = 21773
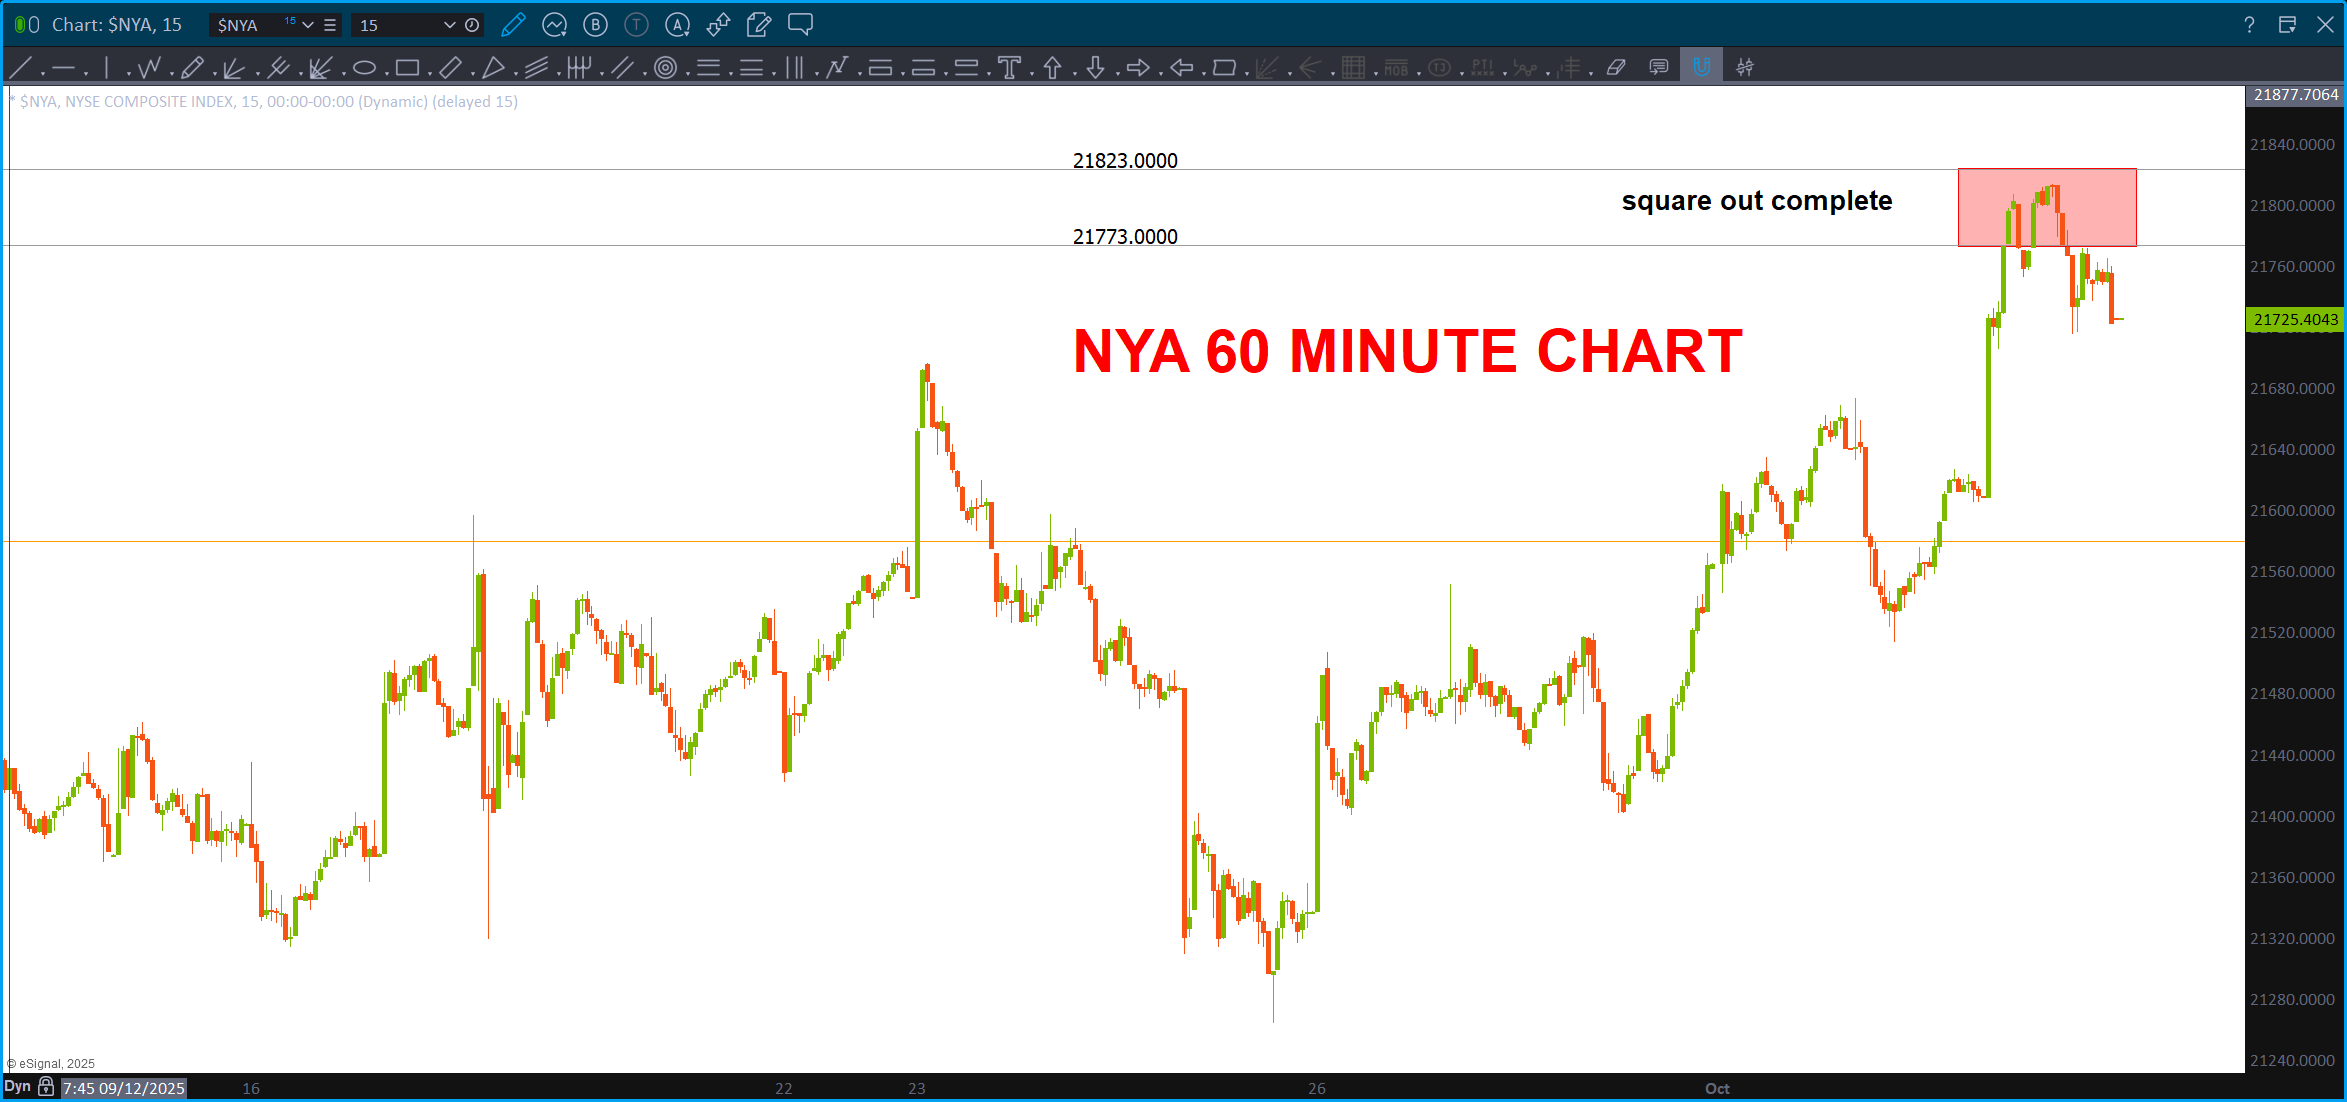
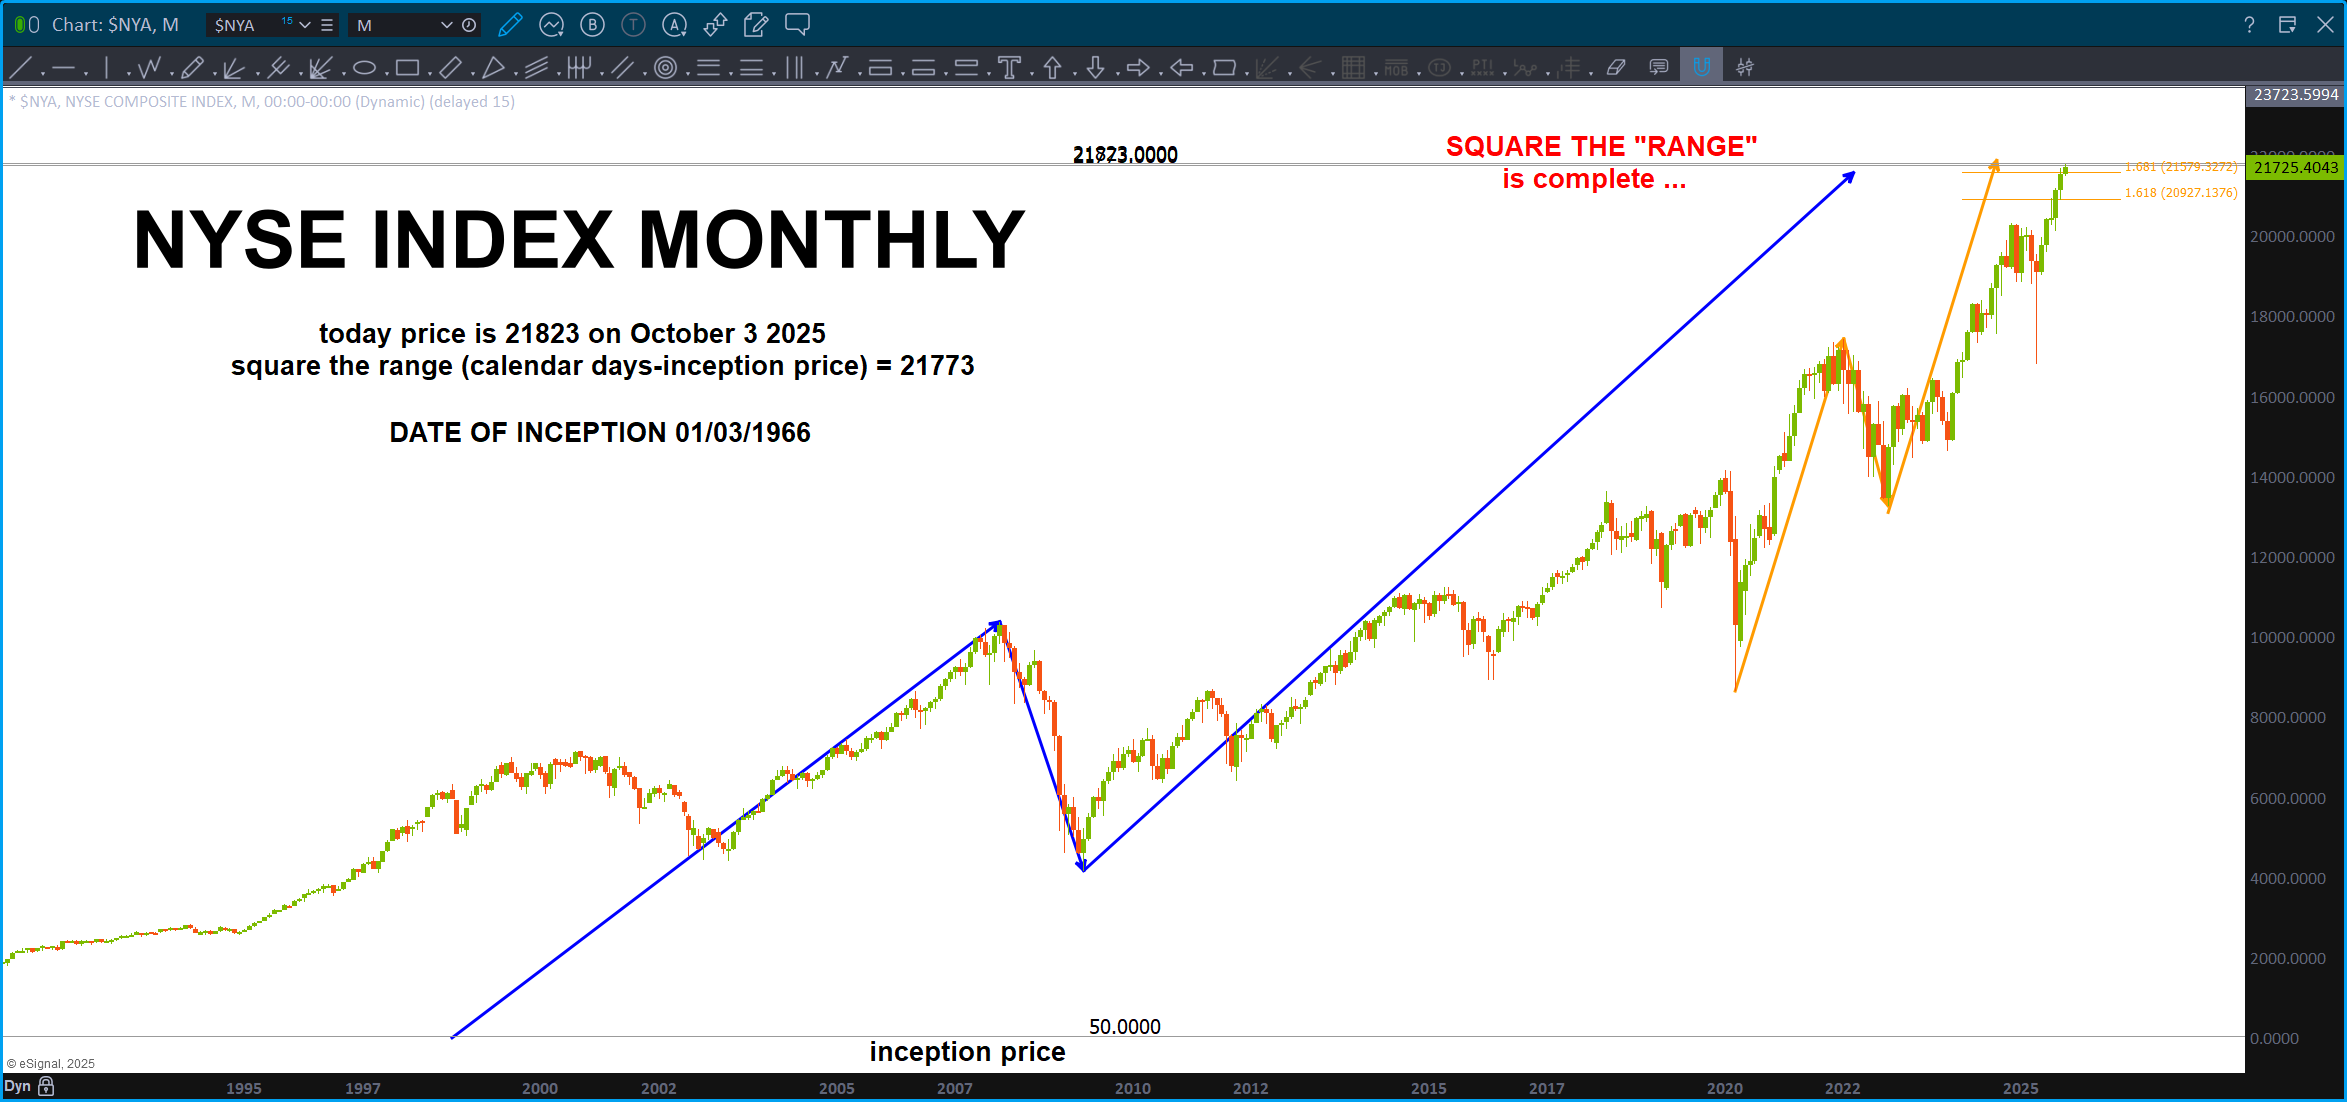
So, if you think about it … we just hit the COMPLETE PERFECT SQUARE OUT …
Hang on folks …
Bart
What to watch – September 21, 2025
Posted on September 21, 2025 Leave a Comment

I think everyone can feel an upcoming correction or point of resistance approaching for the US equities market. There is a LOT going on … I can tell you, without reservation, that I have no idea which way we will go …
Intuitively I sense resistance approaching – why?
It all goes back to the circle, square and the triangle … 3 in 1 … square the circle … vesica piscis .. blah blah blah.
I really appreciated all the people texting me on 9/16/25 or 3/4/5 the ‘natural square’ date …yes, we all learned Pythagorean Theorem and something about the hypotenuse and blah blah blah. Remember? What we WERE NOT taught was the Pythagorean Theorem is actually one of the foundational building blocks for everything. Yeah, you read that right. So, I wanted to text them back “thanks for the reminder of the mathematical foundations of this mathematical 3D matrix of consciousness” so, instead, I texted back something like “ha, thanks!” What a great day! 🙂
So, back to the square … say the sides are all equal to Unit 1 (note, this has a TON to do with what is on the back of the US Dollar Bill. :)). To bisect this square we use a 45 degree angle (who’s side is now 1.4142 – the square root of 2 ;)).
That 45 degree angle, anytime, it’s touched will show a corresponding PRICE and TIME equivalency. Price on the vertical and Time on the horizontal. THAT should act as support or resistance, depending on the direction of price movement. In this case we are going UP, quite a lot frankly.
So, on the DJIA and the NYSE Index we have pretty big TIME/PRICE square outs. The DJIA from the all time low of 08/08/1896 at 28.48. Today, that was 47160 calendar days ago … so, if tomorrow PRICE goes up and smacks into 47161 EXPECT resistance. Again, doesn’t have to work, it could gap and go over it … it’s all probability.
The NYSE Index, from its inception and first day of trading on 01/03/1966 was 21811 days ago. So, tomorrow the price target will be 21812.
These two numbers represent TIME AND PRICE equality and, therefore, SHOULD act as resistance.
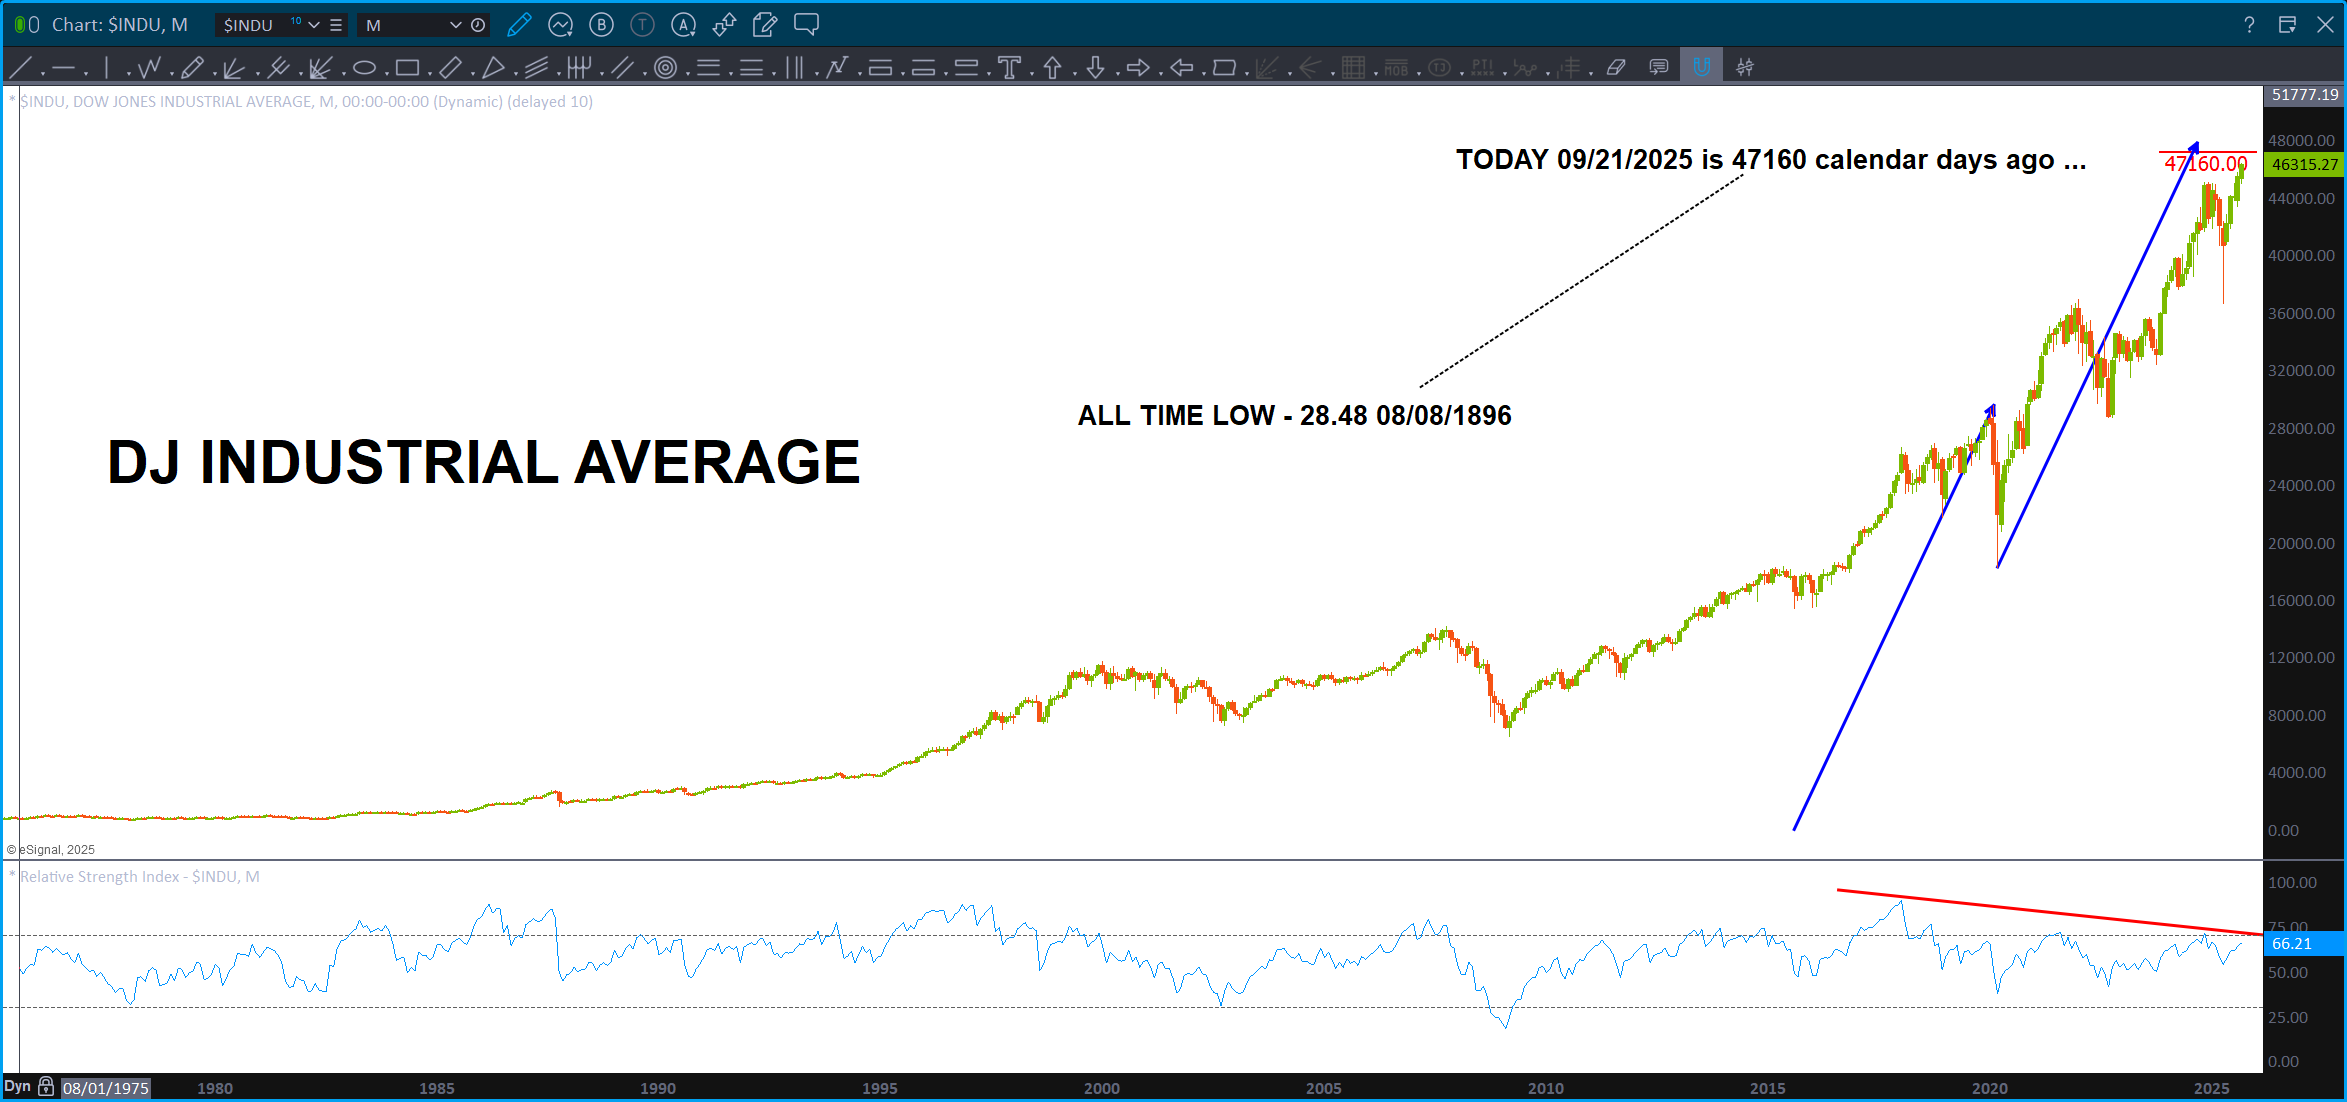
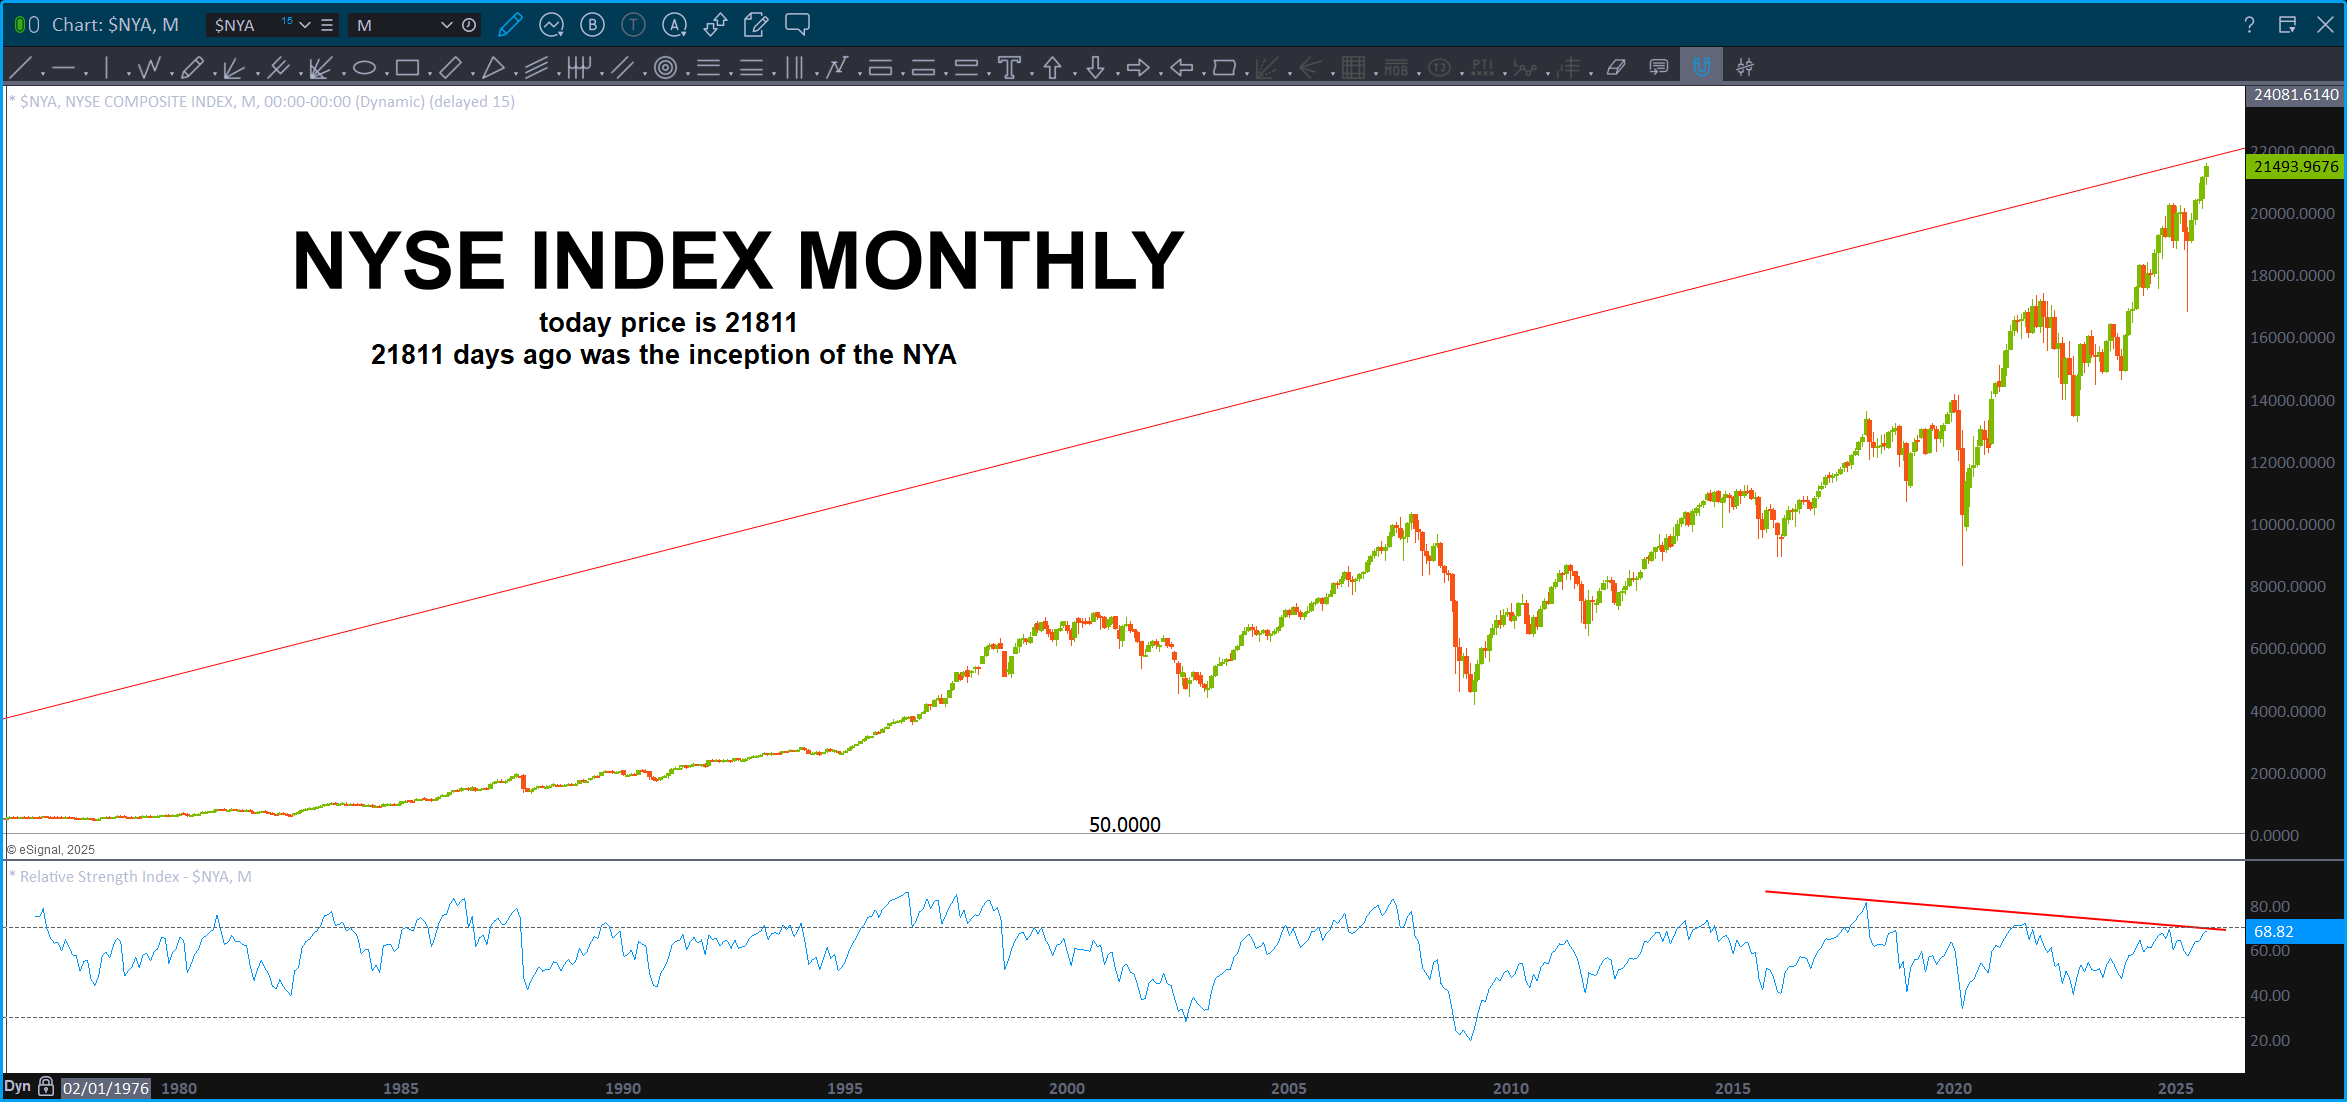
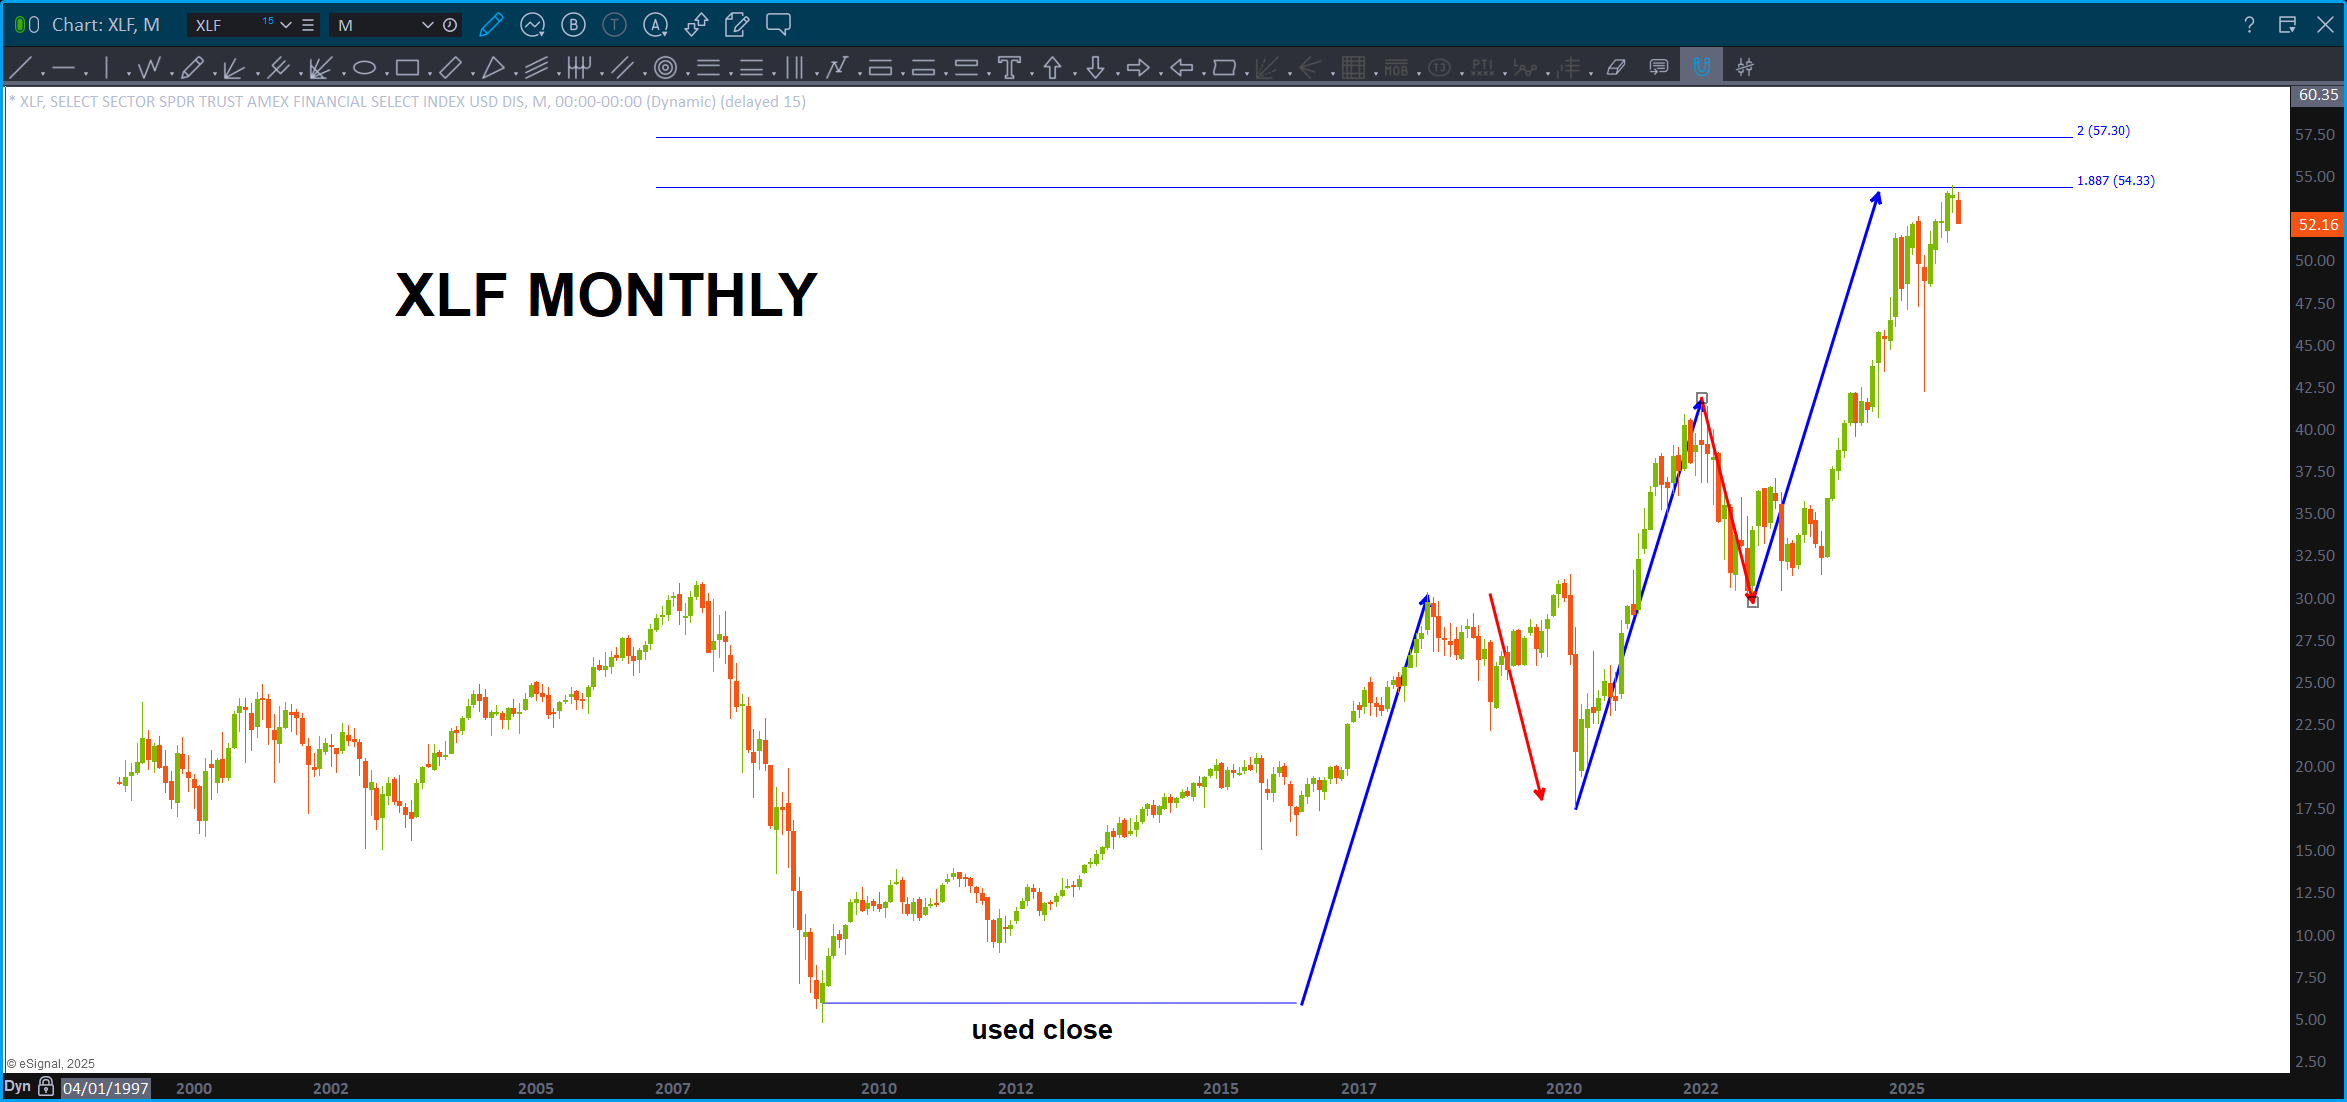
The other thing that I’ve been watching is the banks/financials. We have had these two LONG TERM targets for a while and, it does appear, they are being hit/close to being hit. IF the market is going to hit resistance THEN the financials and banks will be stopping in/around here and a pullback SHOULD ensue.
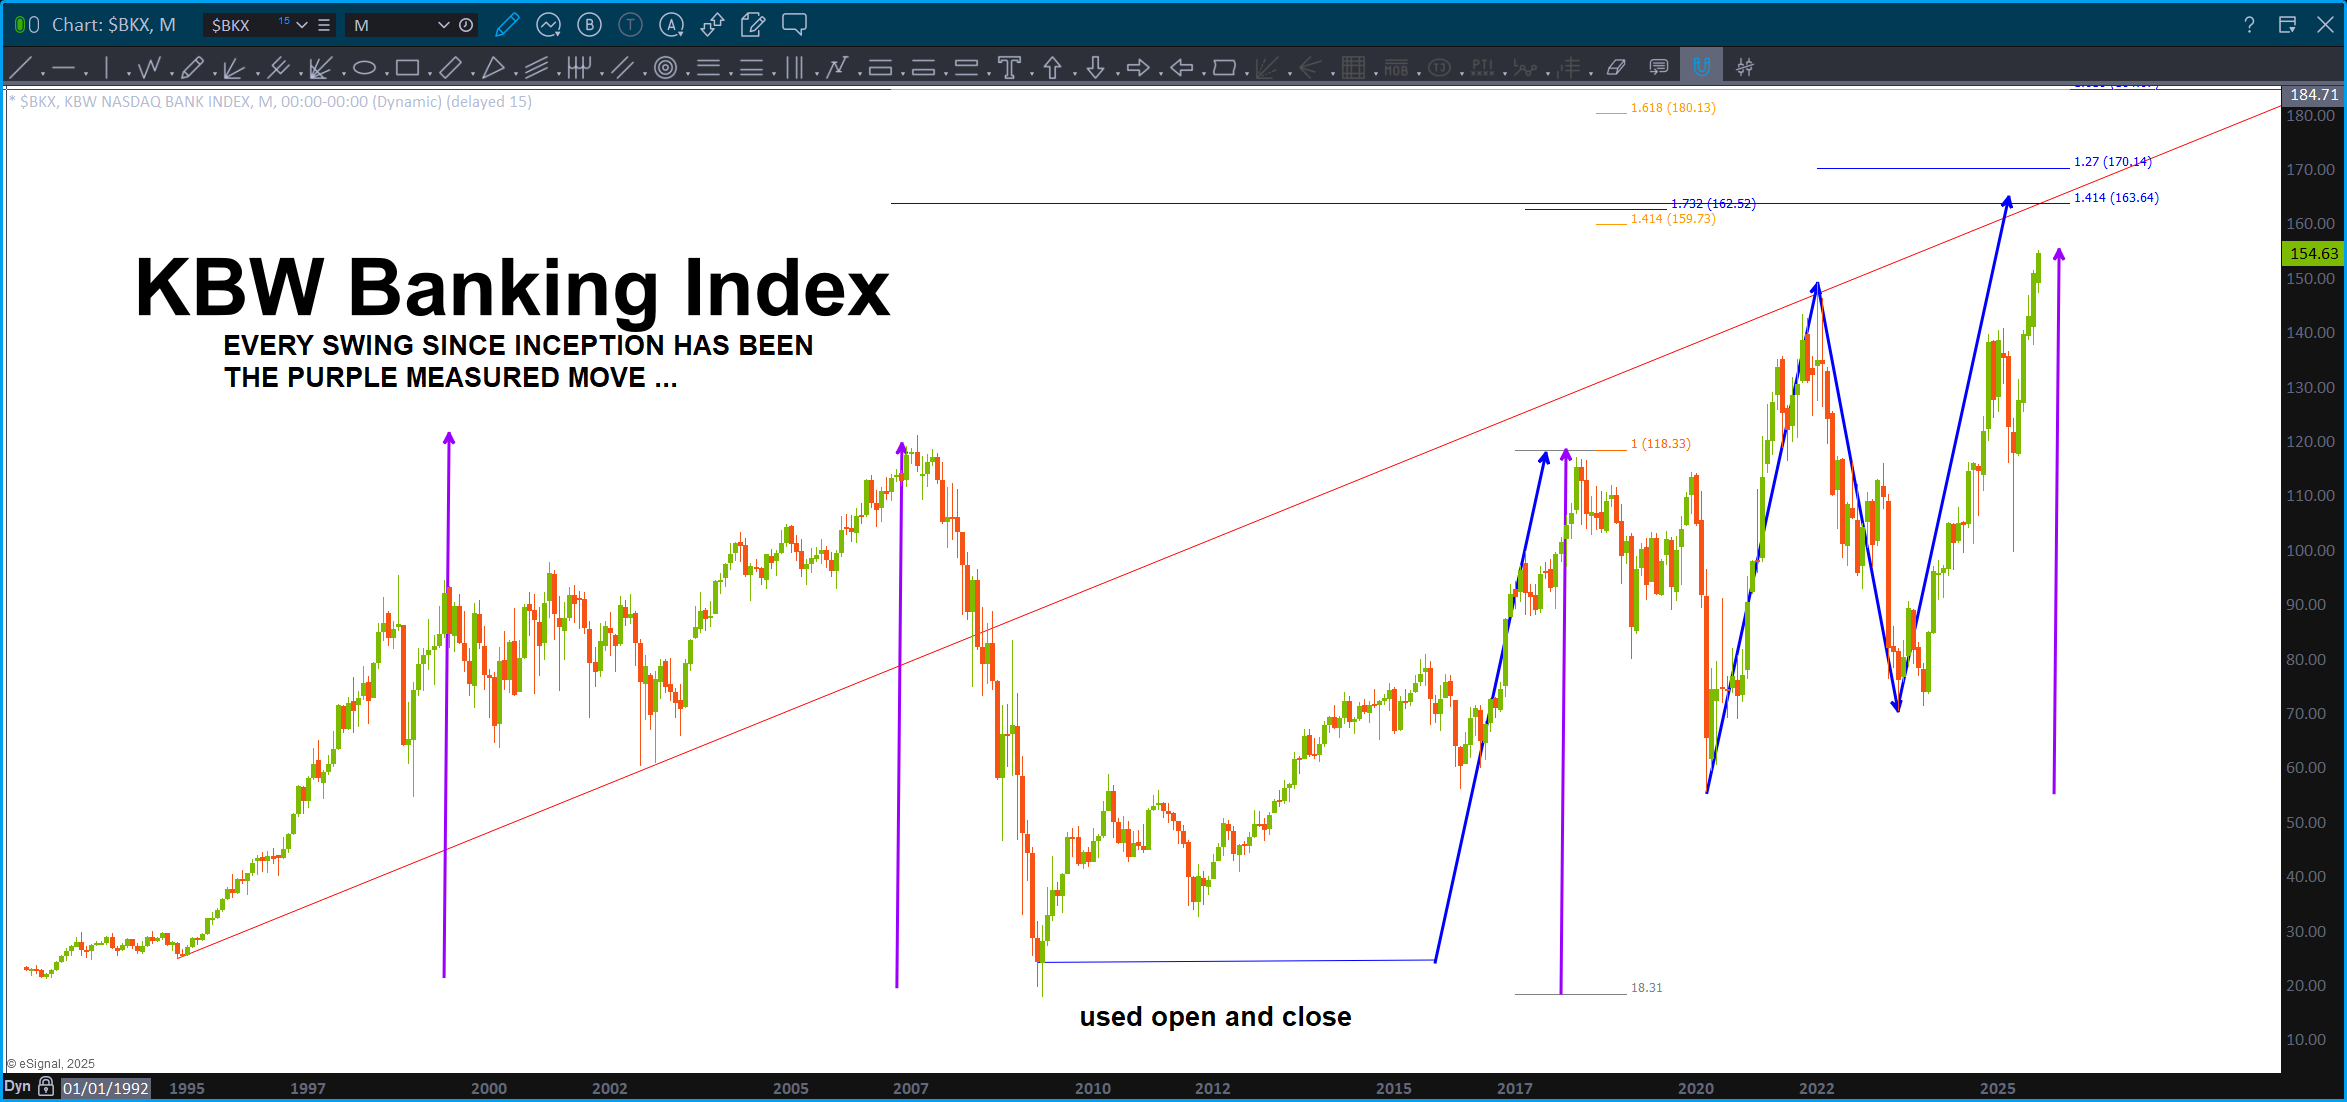
Folks, take a moment to peak at the KBW above … EVERY SINGLE SWING (purple measured moves) has been the same and, last Friday we closed right at the measured move price. There are targets higher, as shown, but boy are we close, right?
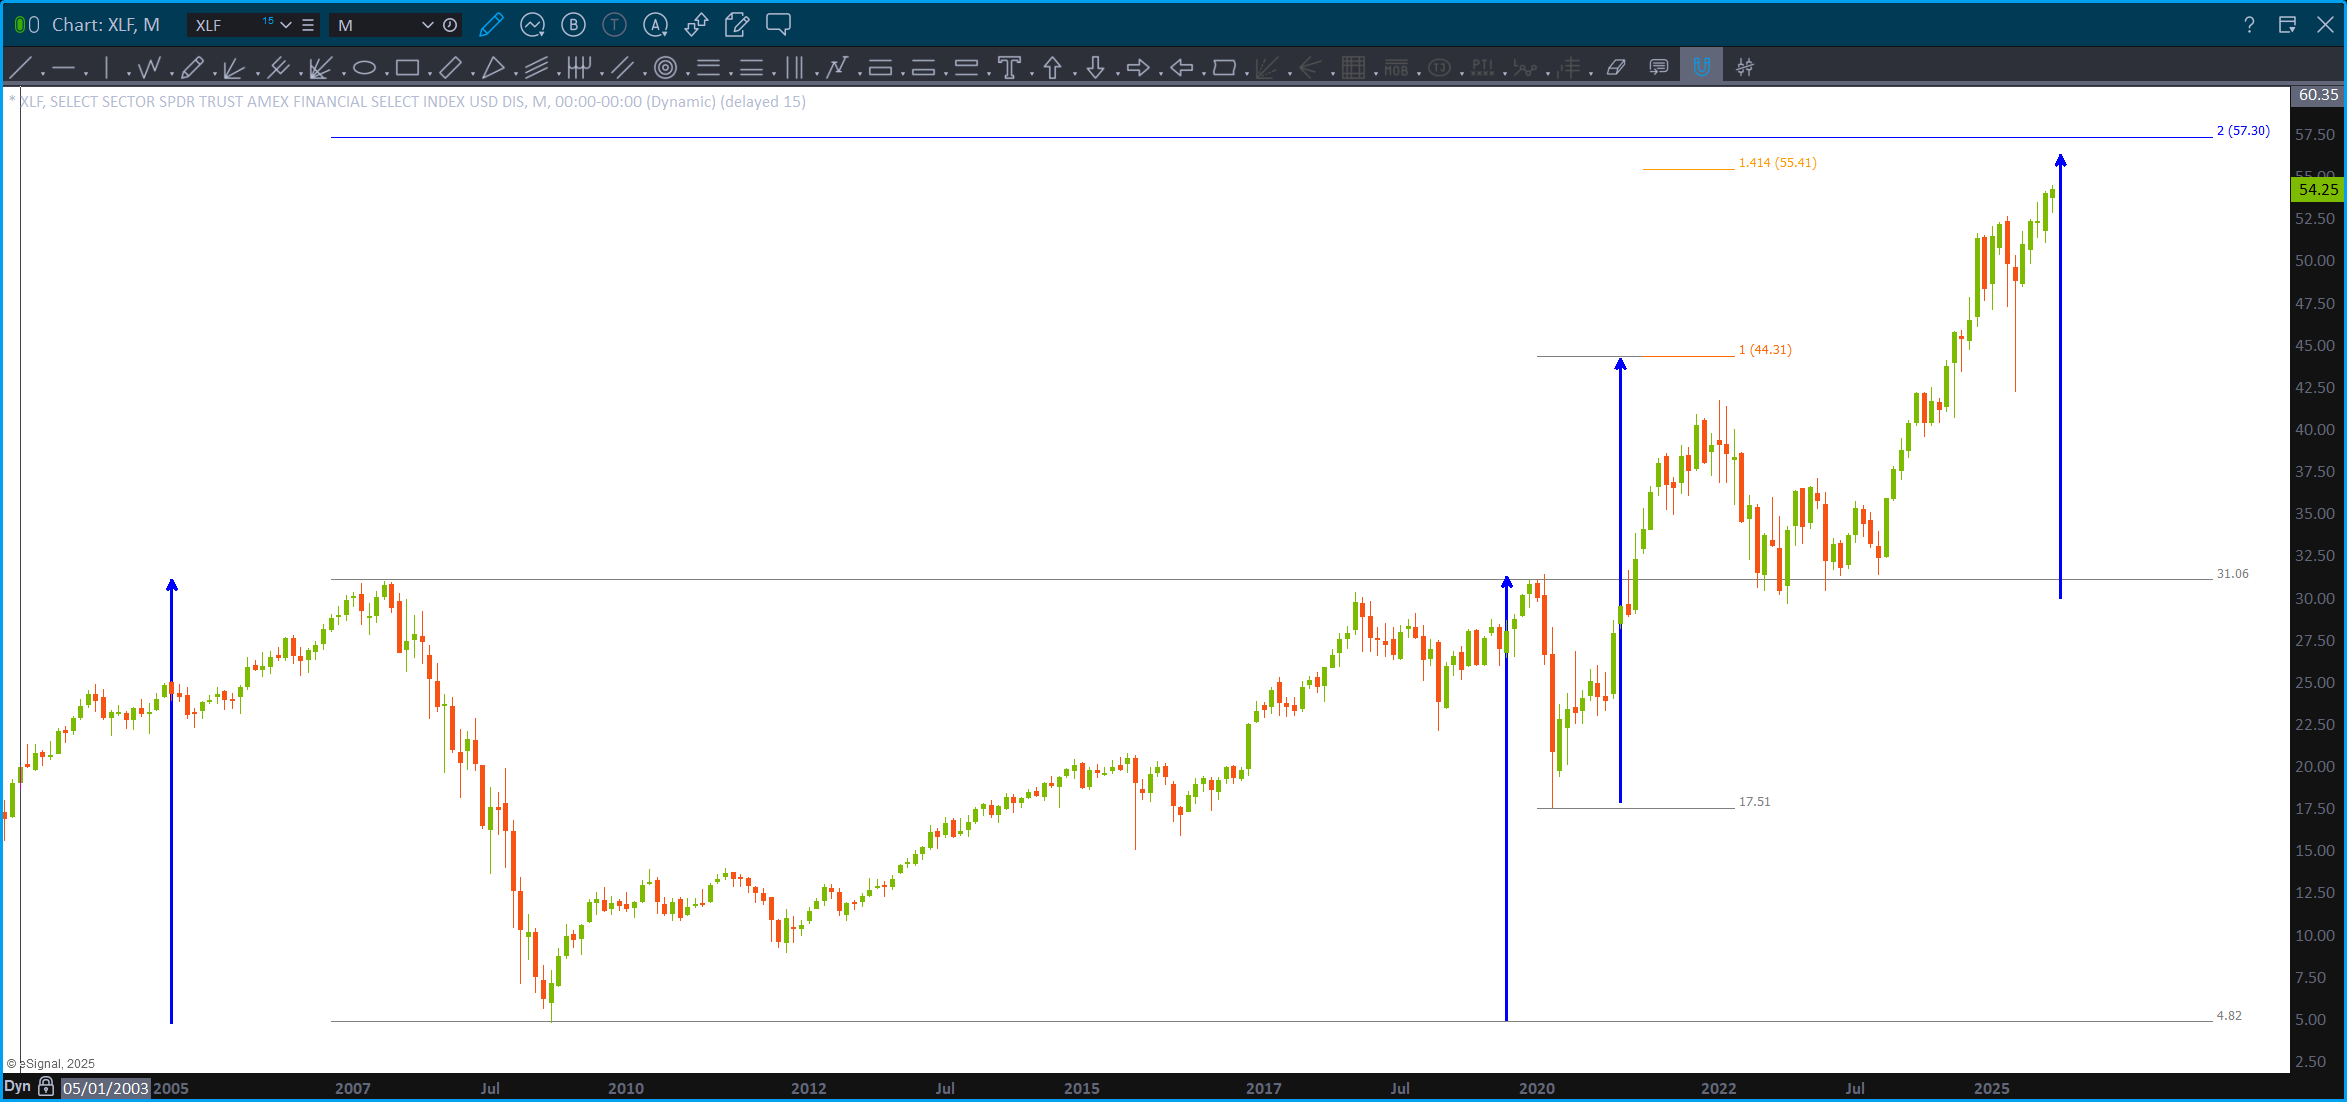
The XLF is getting into lofty territory …
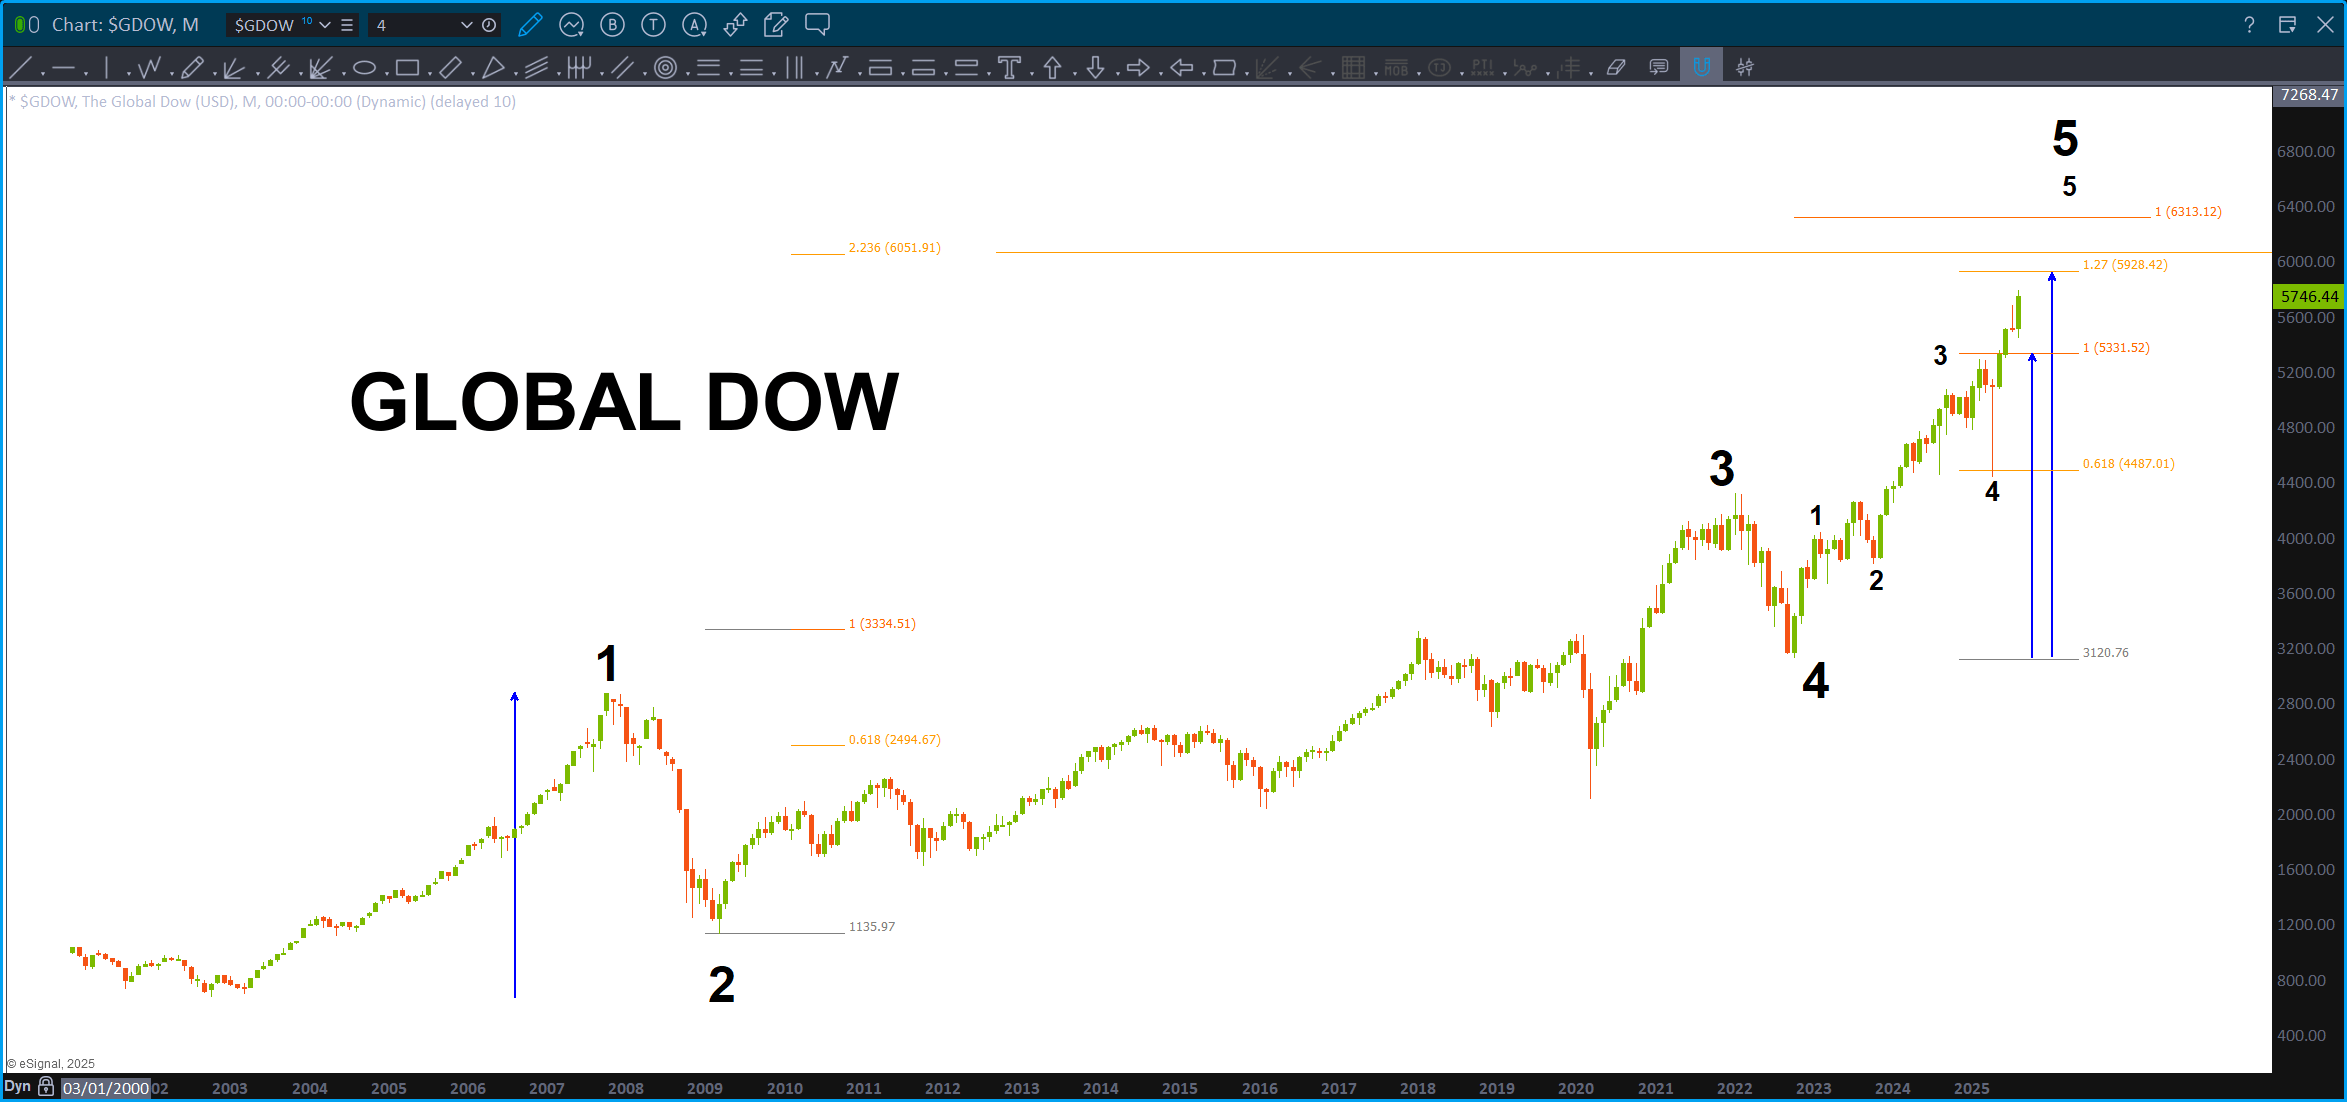
Here’s the Global Dow:
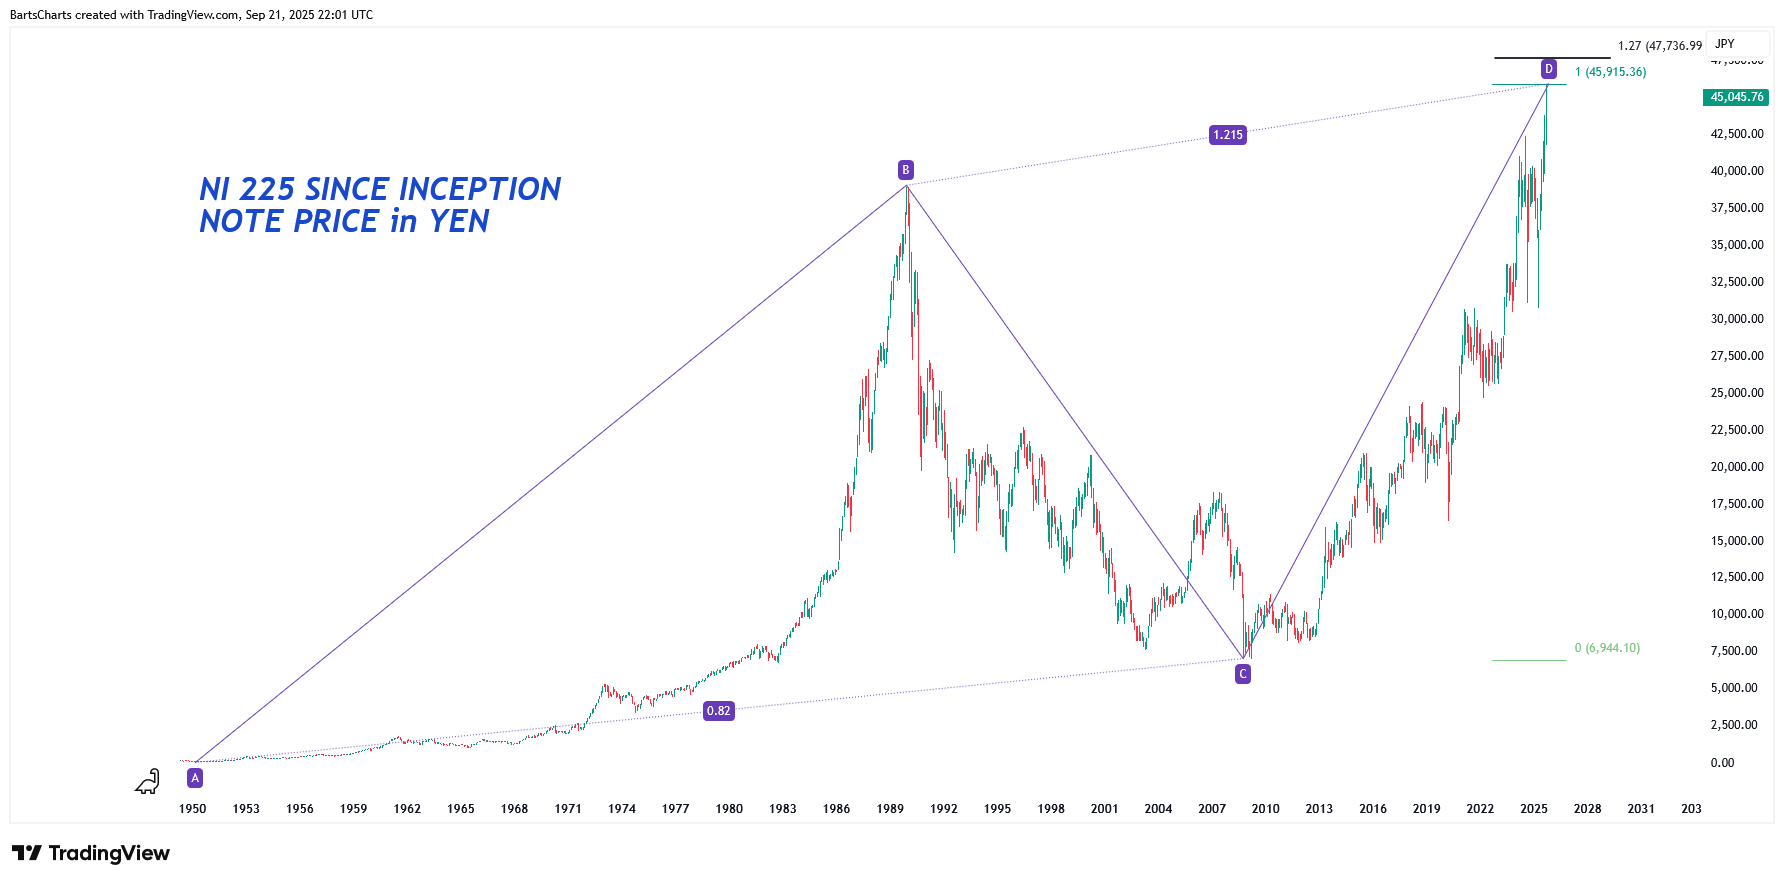
I was looking at the YEN and decided to peak at the Nikkei 225 and holy smokes was this one a barn burner! A 75 year ABCD projection that hit on Friday …
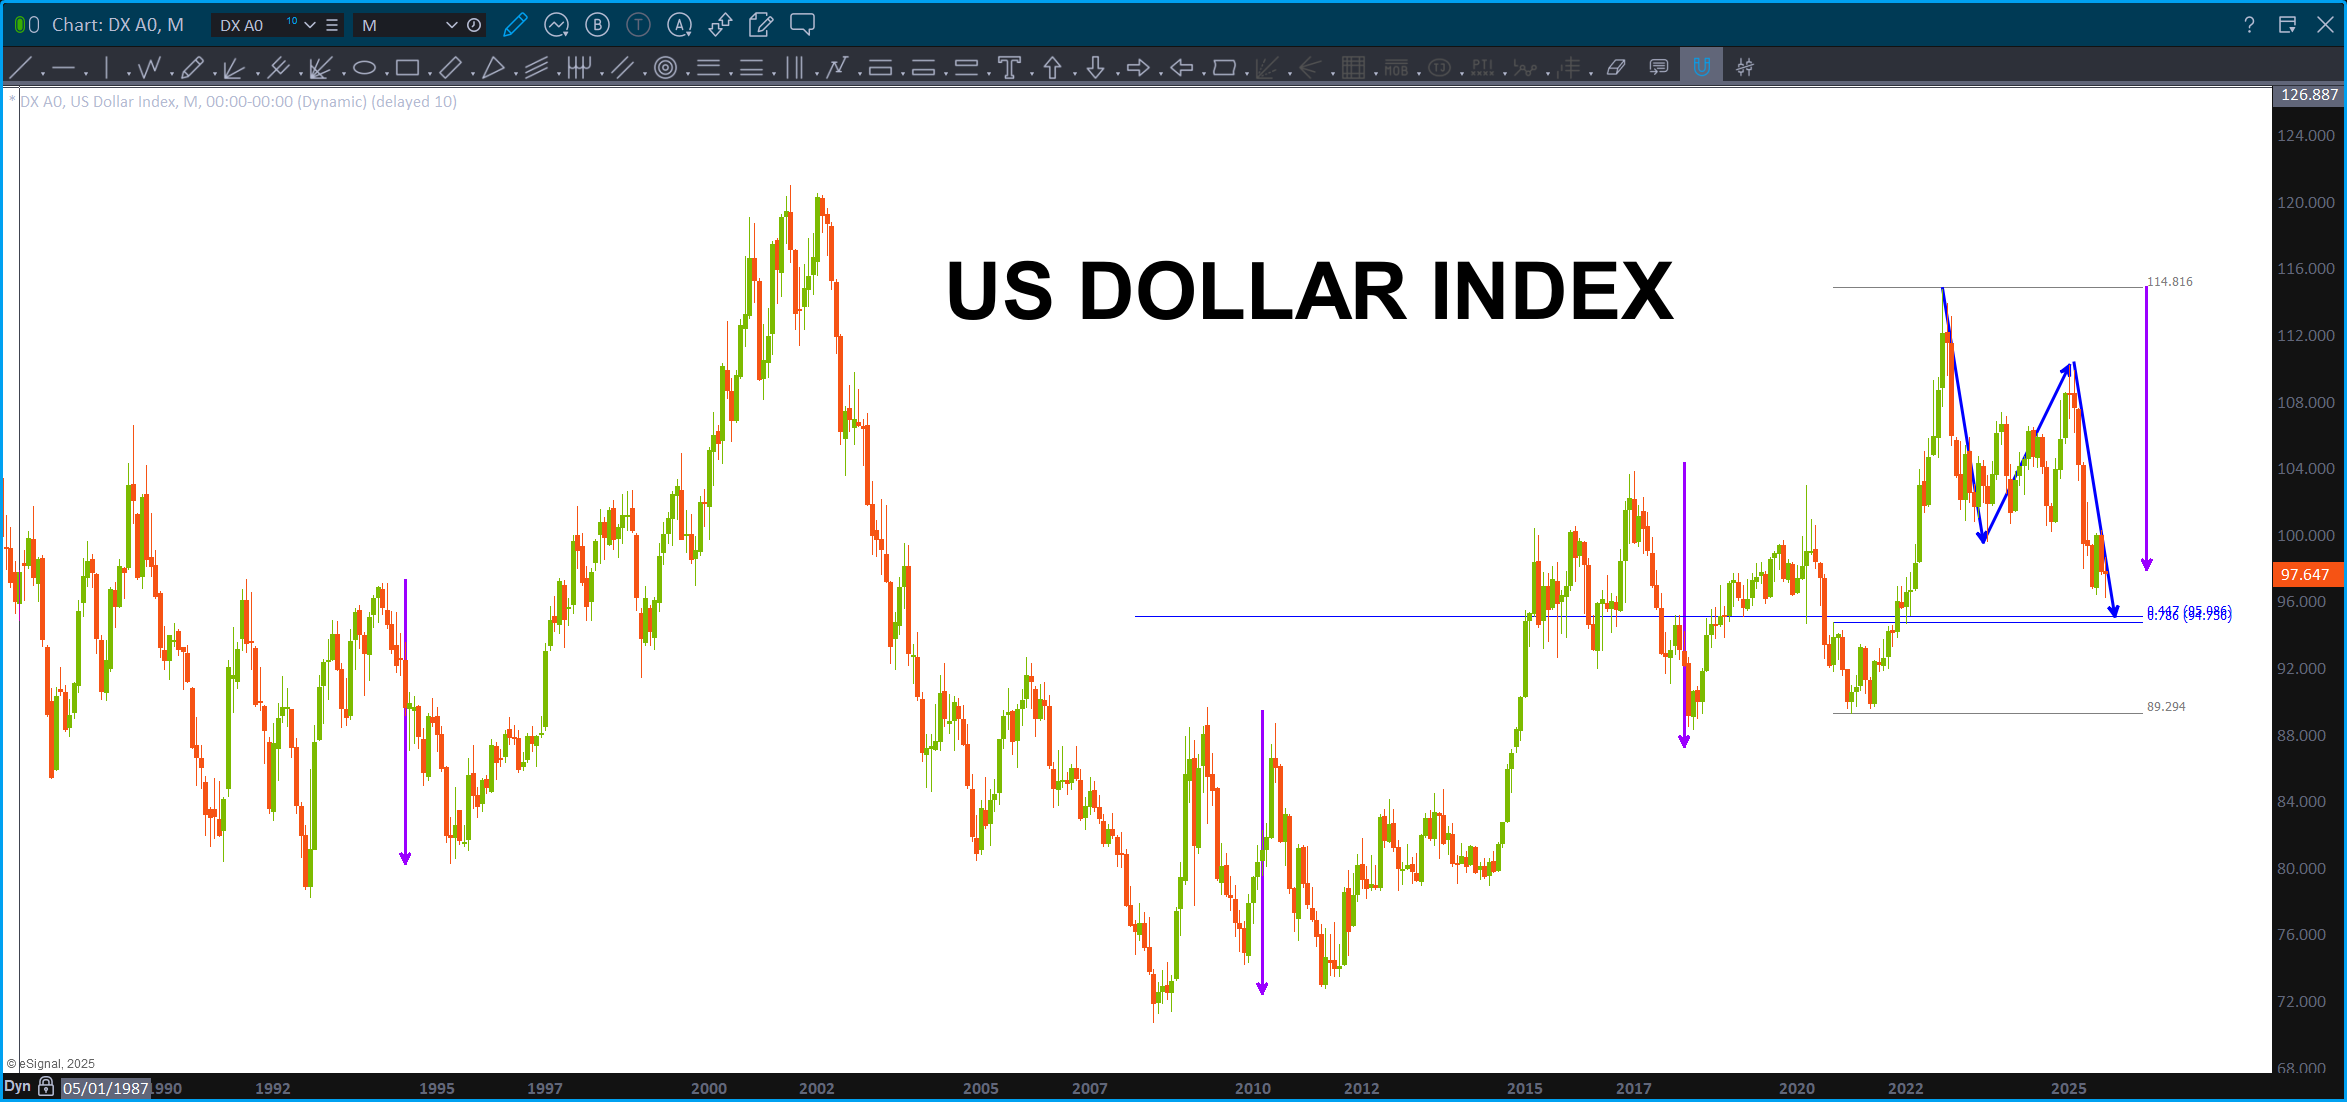
Take the USD … sure looks like it is getting close to a MAJOR buy pattern:
And, last chart, Mr. Trusty Dusty XLP/NYA. We finally broke the 12+ year support zone (kind expected) and the market has taken off. Folks, here’s the BIGGEST PATTERN out there in my very humbled opinion. It’s a PERFECT BUY pattern on the XLP/NYA a little lower.
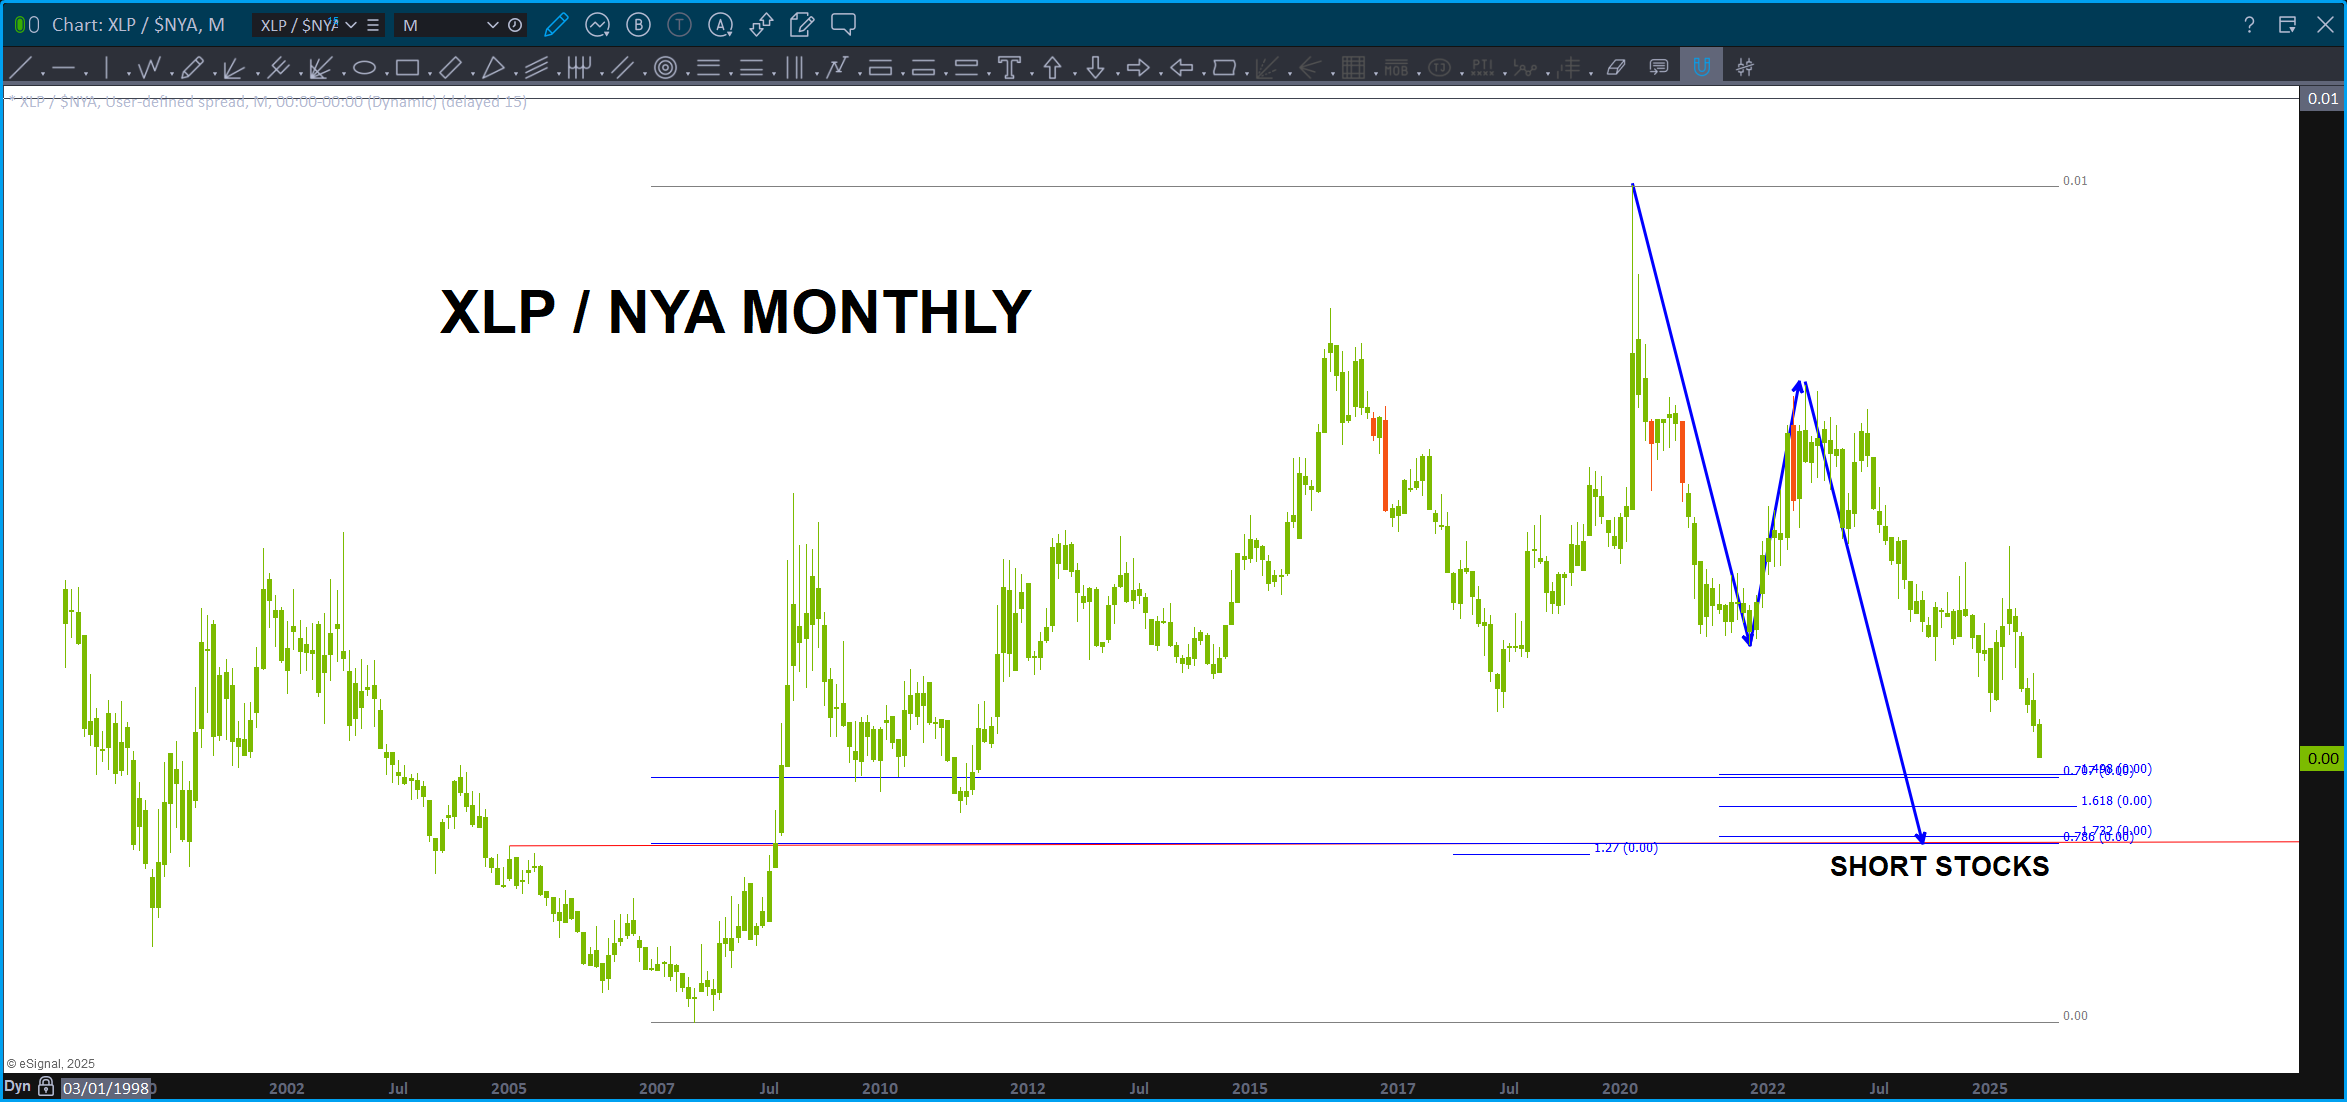
I can say w/ conviction, I DO NOT want to be long stocks when that level is hit as I expect it to be MAJOR support which corresponds to BIG RESISTANCE FOR EQUITIES.
So, we are so close to some BIG PATTERNS completing …
Good to be back – Bart
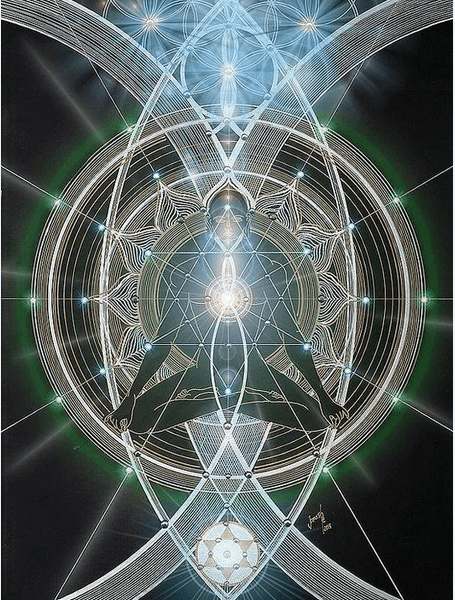
PS – might want to check this out. Pretty trippy … why would I put this here you might ask yourself? See above … the SAME GEOMETRY that we are talking about above is present in this sphere that is dated 12,000+ years ago. Wakey wakey eggs and bakey … 😉
Weed / Apple – August 29, 2025
Posted on August 29, 2025 1 Comment

Guess it’s now a ‘toke a day, keeps the Dr. away?’
MJ (Cannabis ETF) / APPL – never thought I would see this one …
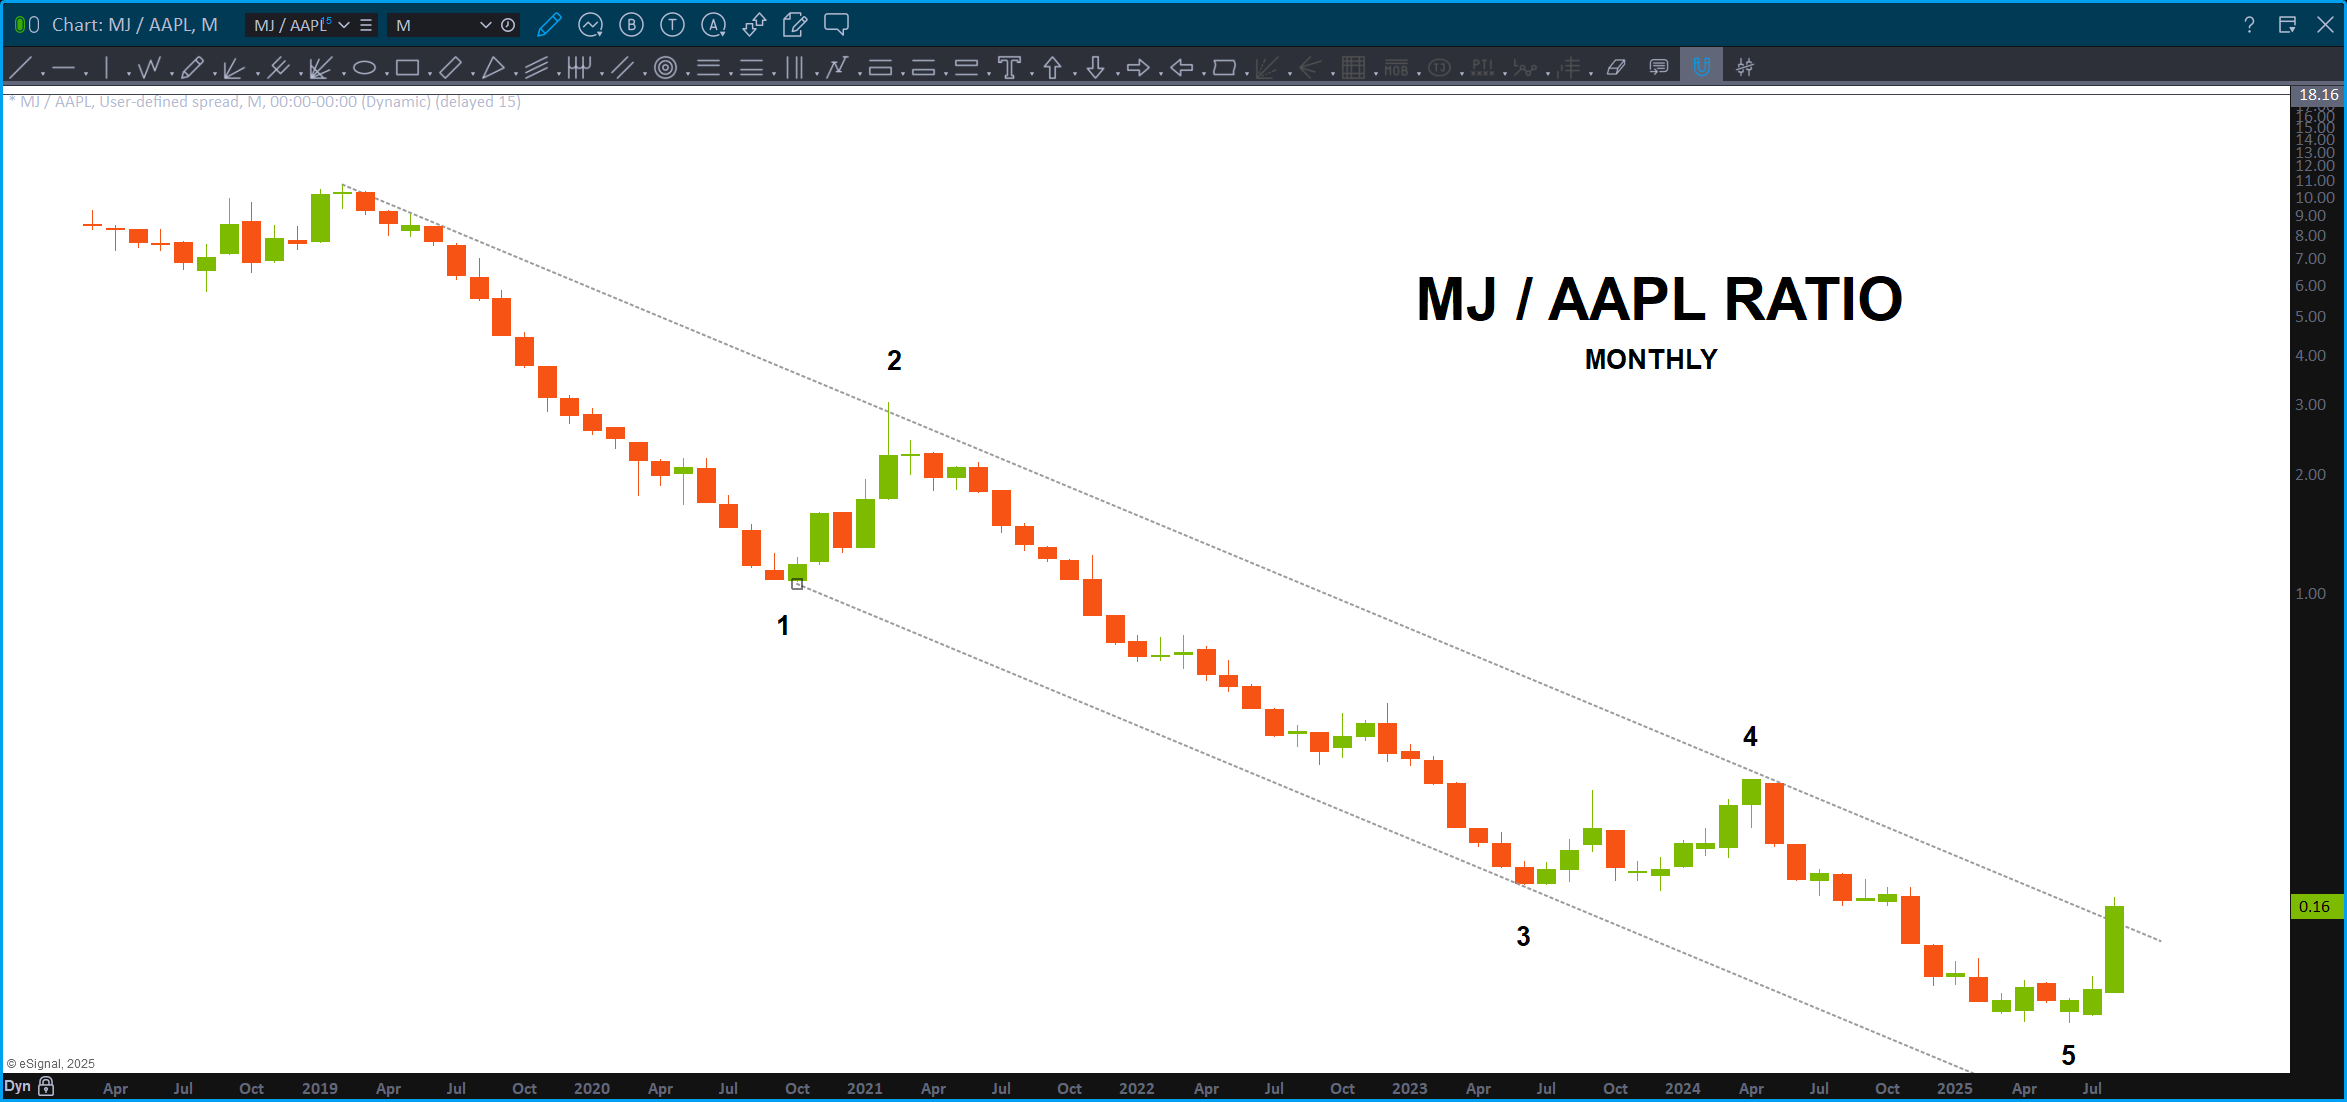
you do know, EVERY cell in your body has a CBD receptor … 😉
Global Dow – 08/27/2025
Posted on August 27, 2025 Leave a Comment

Well, look at that:
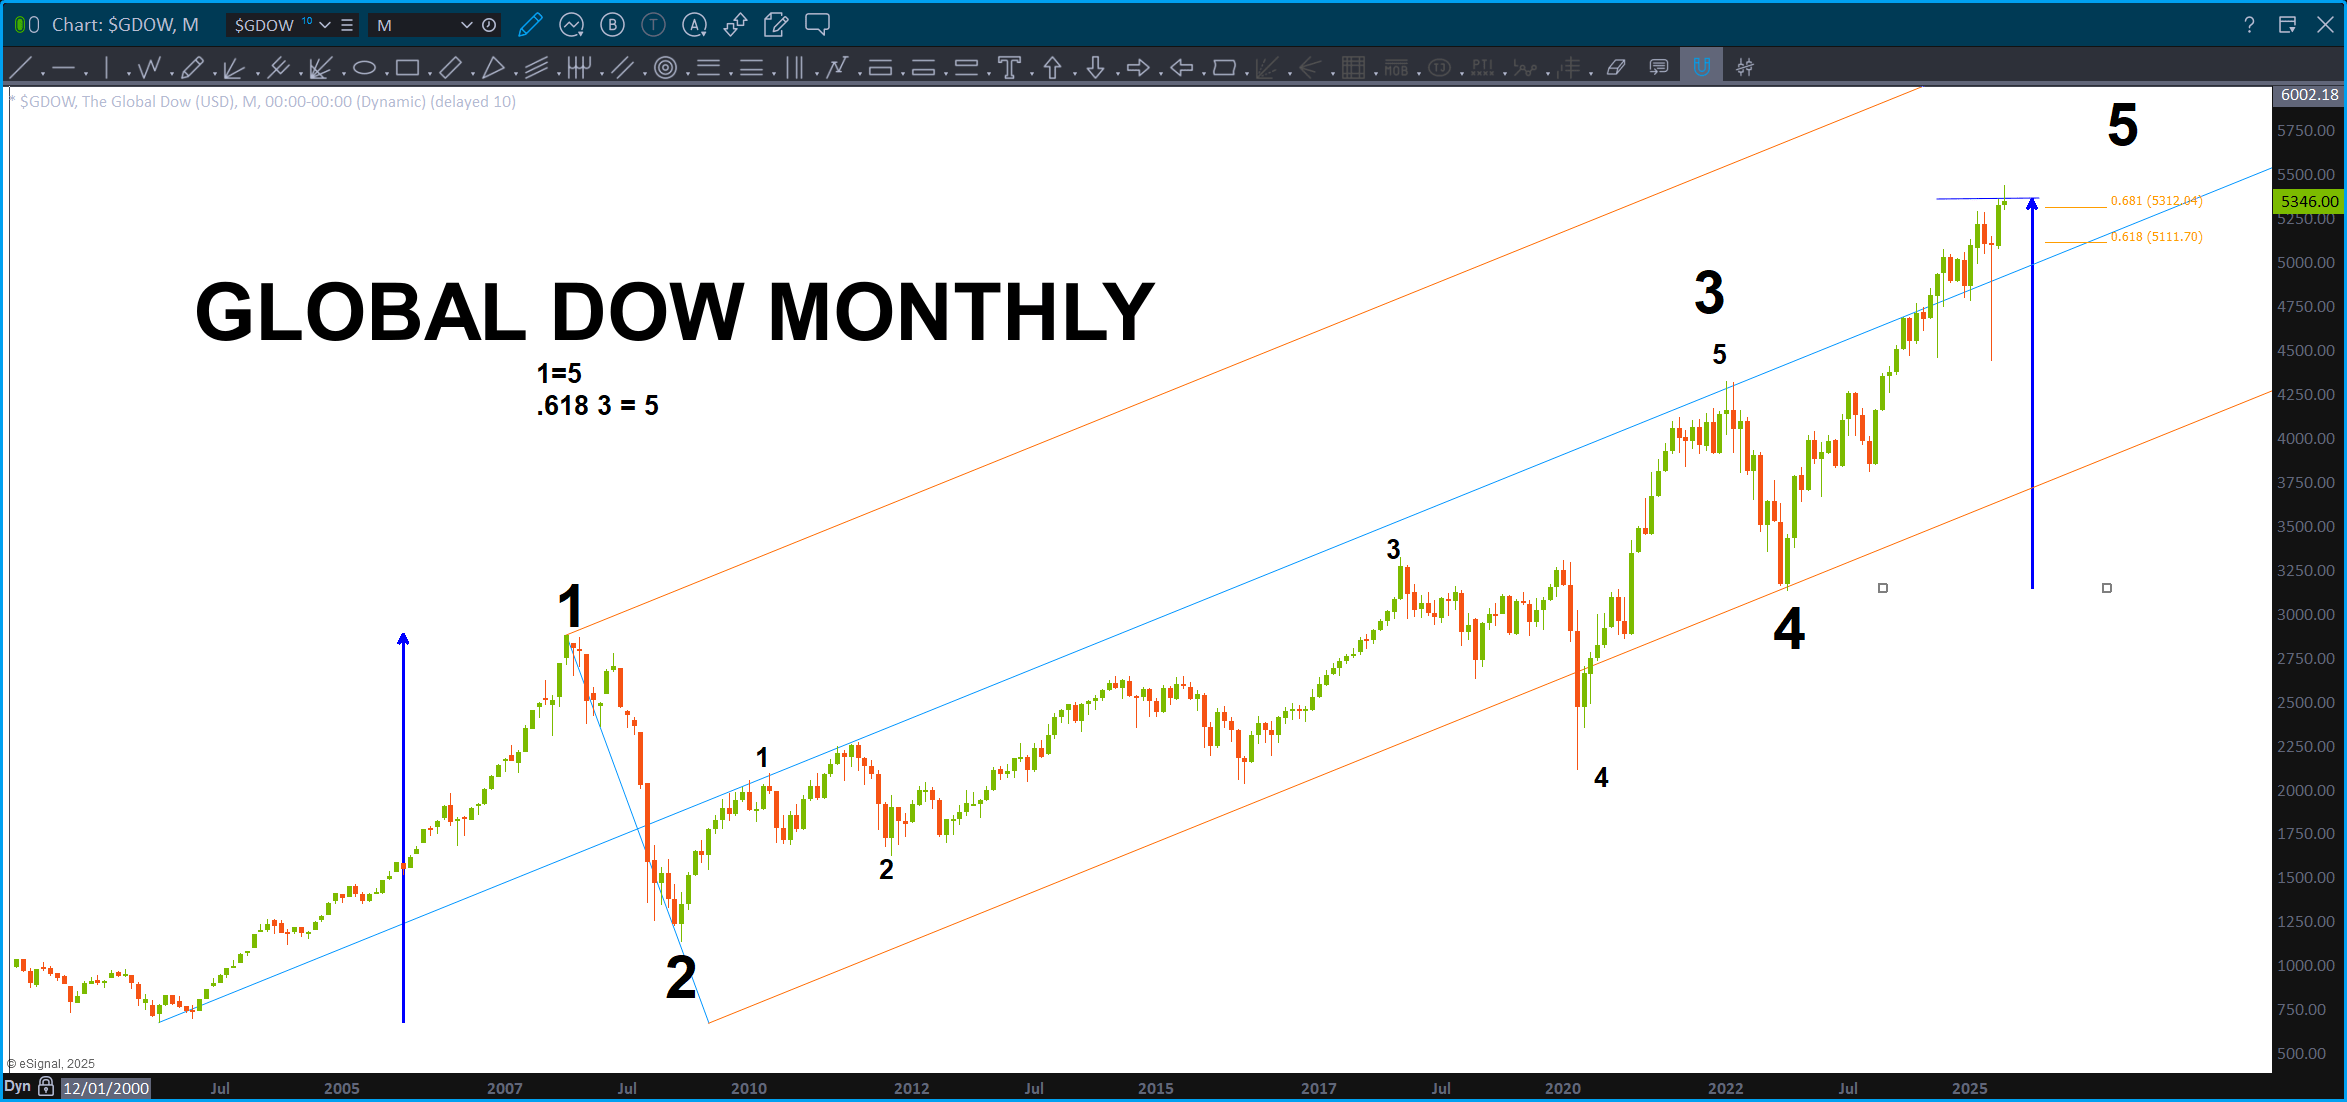
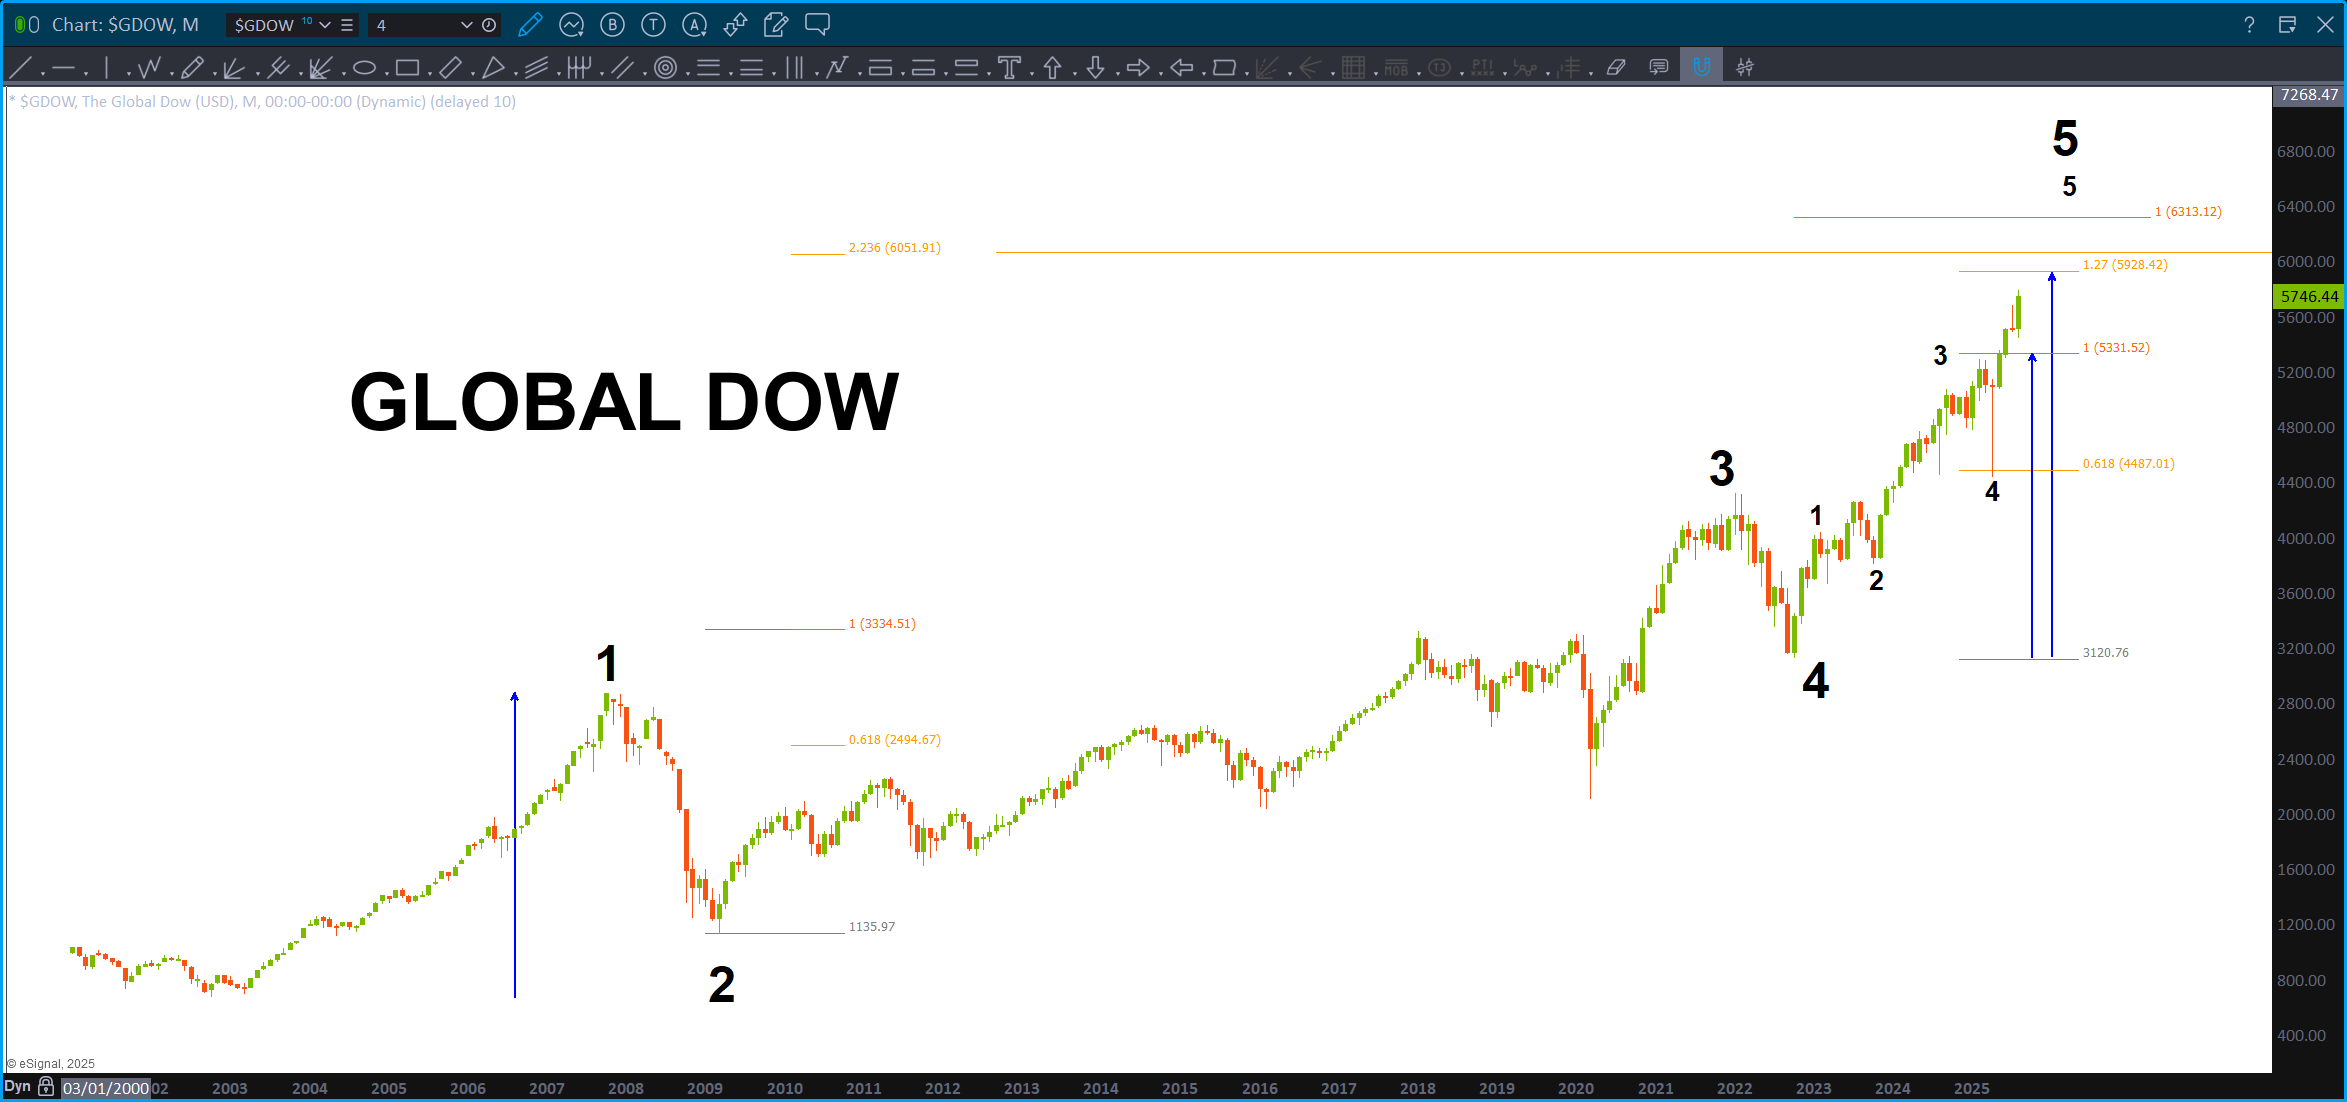
Reasonable?
We blew thru the first target so let’s grab another one higher and we have some coming in … hmmmm. I usually don’t do that but when you have a bunch of measured moves lining up you start asking yourself, which mathematical ratio will it be this time…. so, simply, here’s another one.
Isn’t this getting interesting?
And … what an interesting time to be seeing these counts, if they are even accurate (they don’t break any rules but I did go one subwave lower and that is when I become my golf game … 😉
Are we watching history in the making folks …? Or, my counts suck. Either way, some resistance ahead.
THE SQUARE OUT – August 27, 2025
Posted on August 27, 2025 Leave a Comment
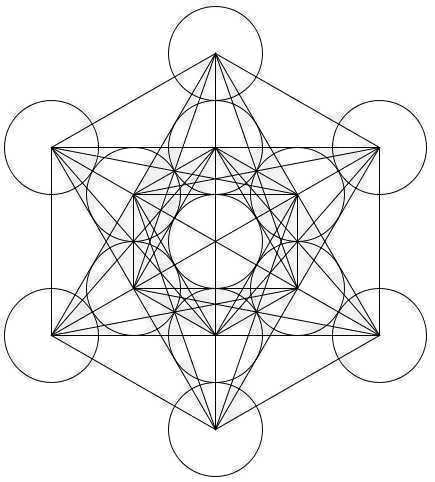
In studying the markets, which for me have been 25 years studying nothing but sacred geometry, musical theory, Pythagorean theory, kaballah, astrology, astronomy – basically consciousness – one might understand the sheer synchronicity of approaching resistance on the NYSE Index (NYA).
When you look at geometry, the SQUARE (90-23.4 = 666 – the tilt of our planet …hmmm ) is of utmost important. So, when we take a square w/ unit 1 on all it’s sides and put a 45 degree line on it we now have the Square Root of 2 or 1.4142. A KEY number sprinkled throughout creation – remember, even the very hairs on your head are numbered – so this 45 degree angle from its origin point when hit represents the perfect balance. In this case of a chart, that is when price equals time. It’s perfect …
The charts below represent, precisely, an equal number of calendar days moved horizontally by the number of days moved vertically. The 45 degree angle.
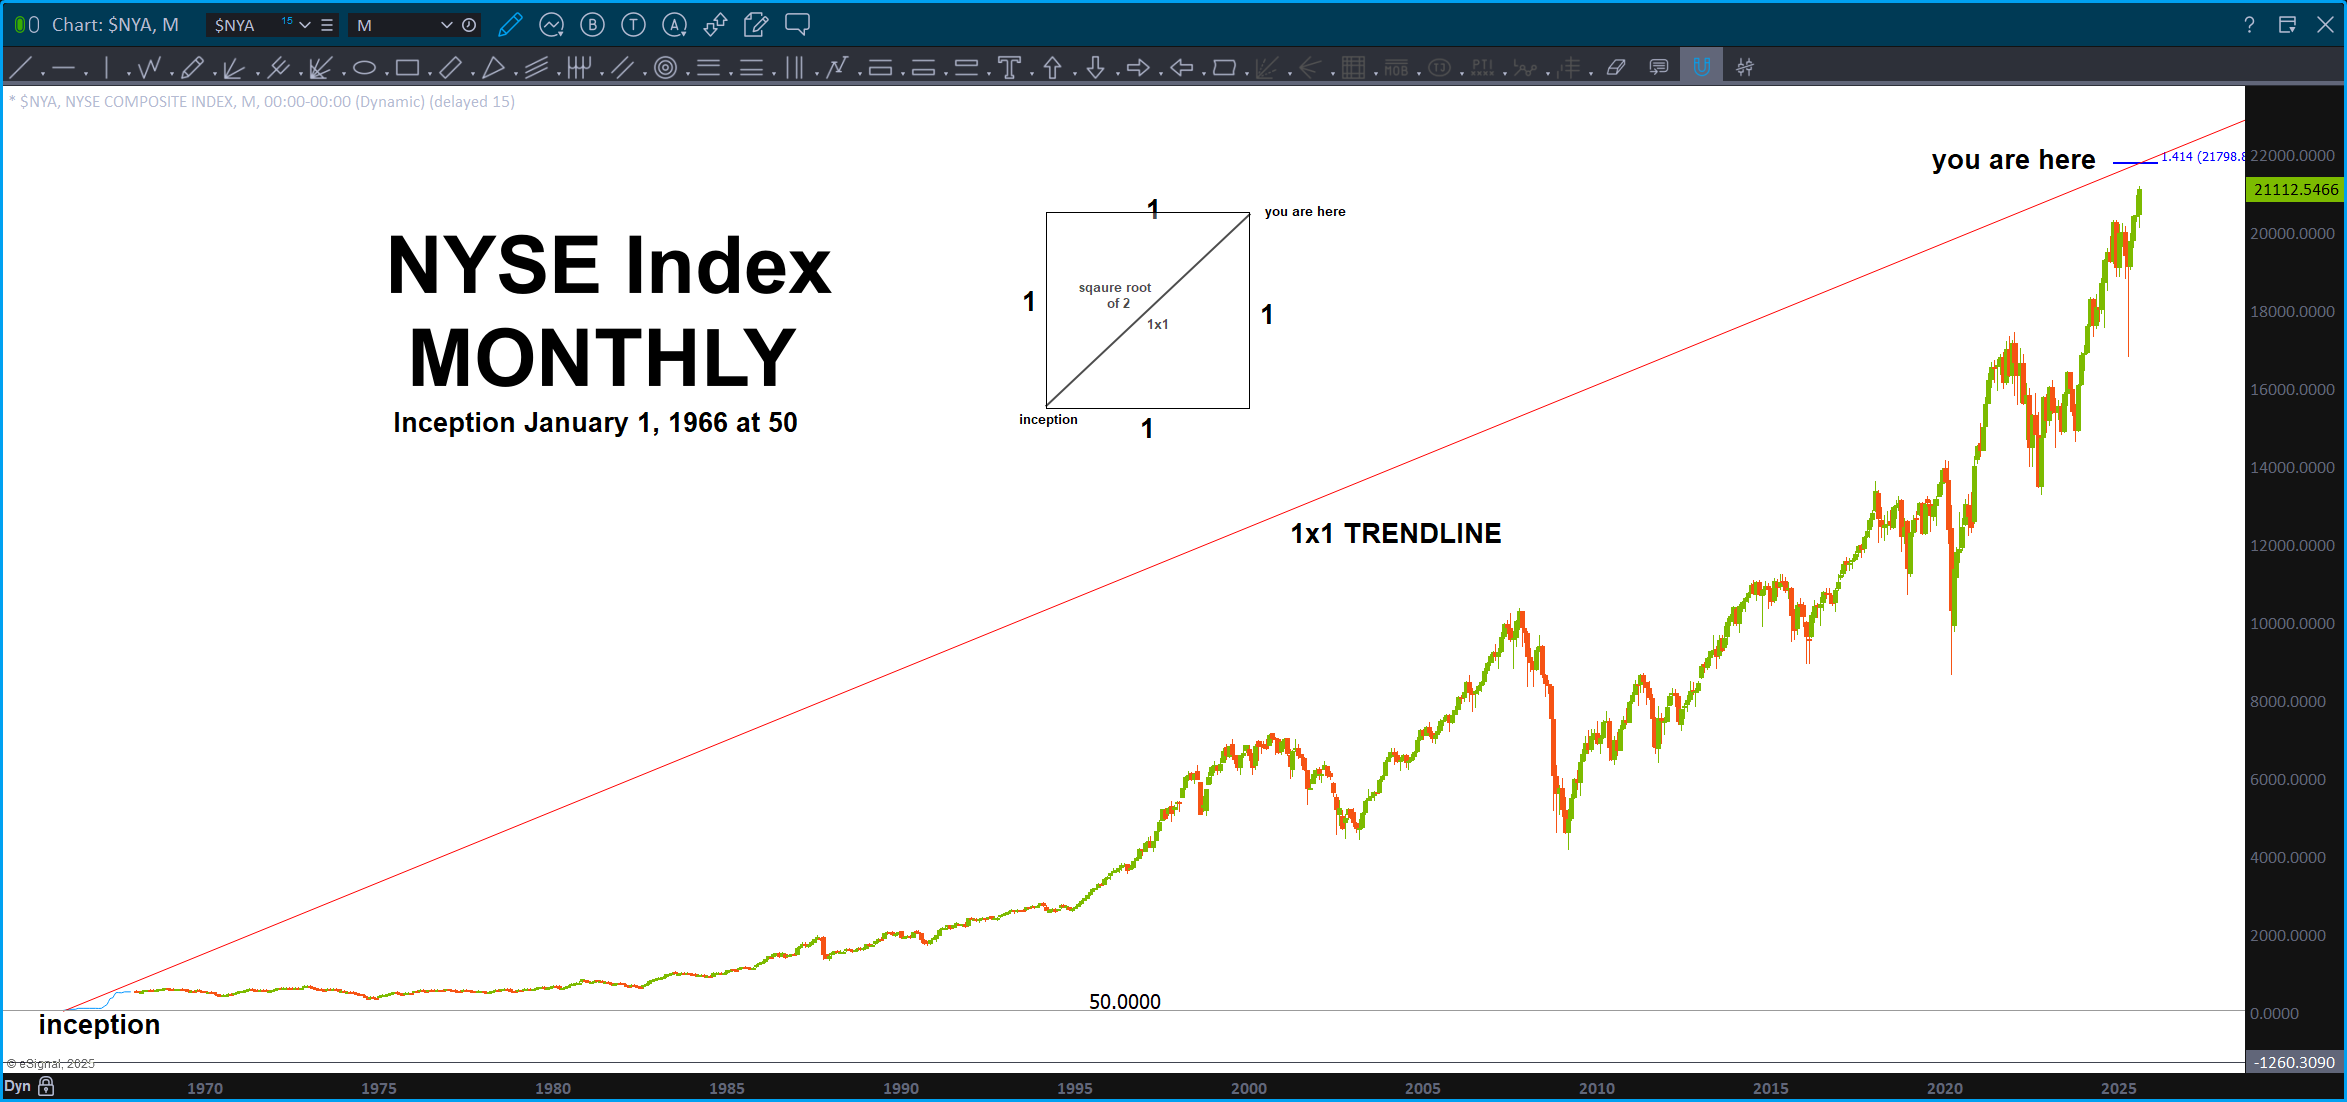
The NYA, since inception is close to having price equals time. It might never get there and, frankly, it could blow thru it and all this hoo bah is nonsense, so lets just check it out. As the immortal Big Lebowski said, “well, that’s your opinion man…”
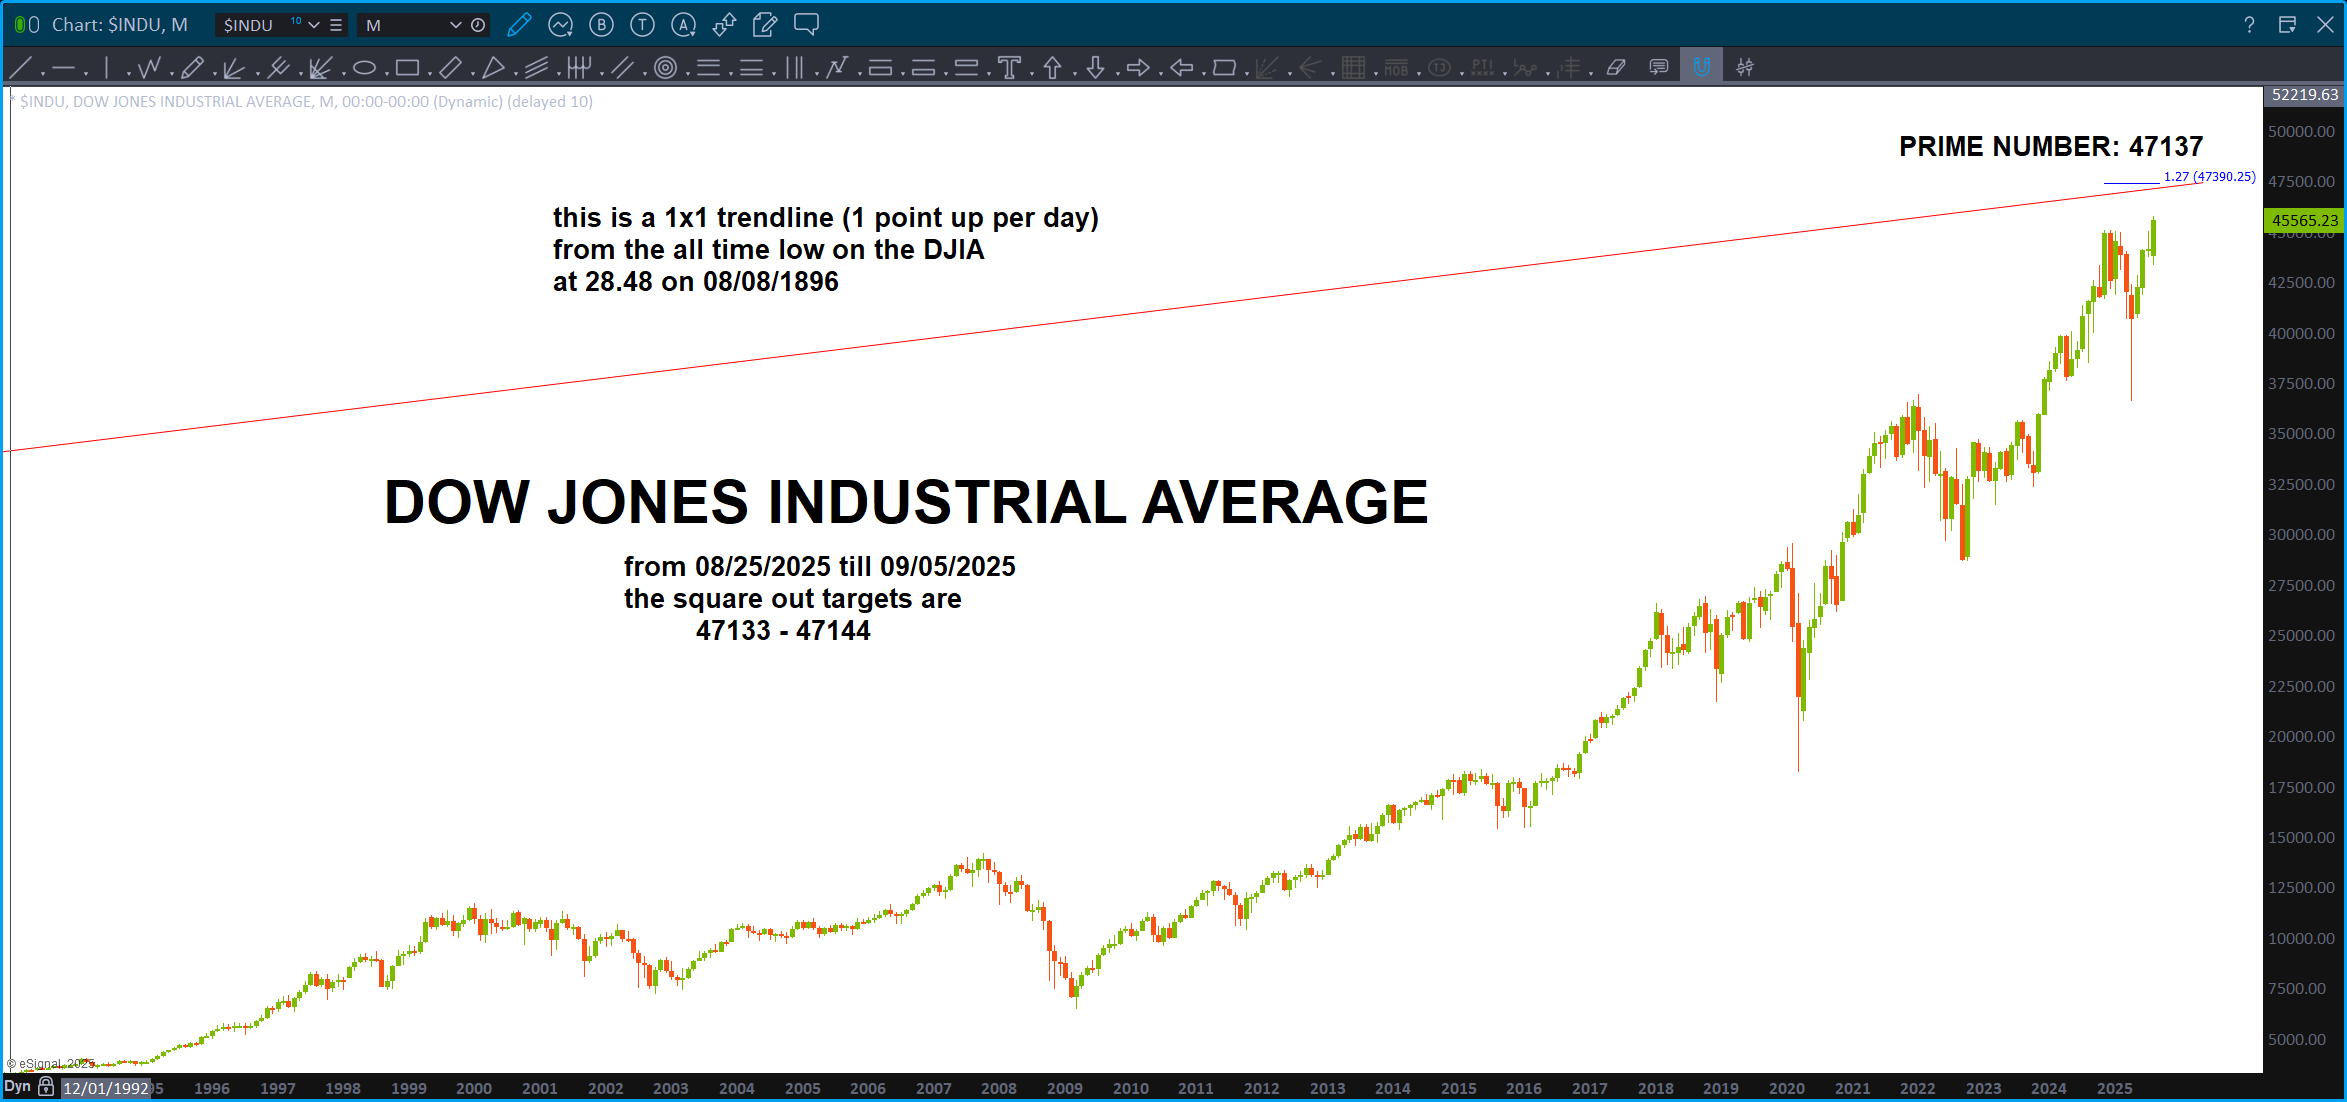
and then we have this, courtesy of Mr. Martin Armstrong of Armstrong Economics:
And then, this beauty w/in the KBW Banking Index …
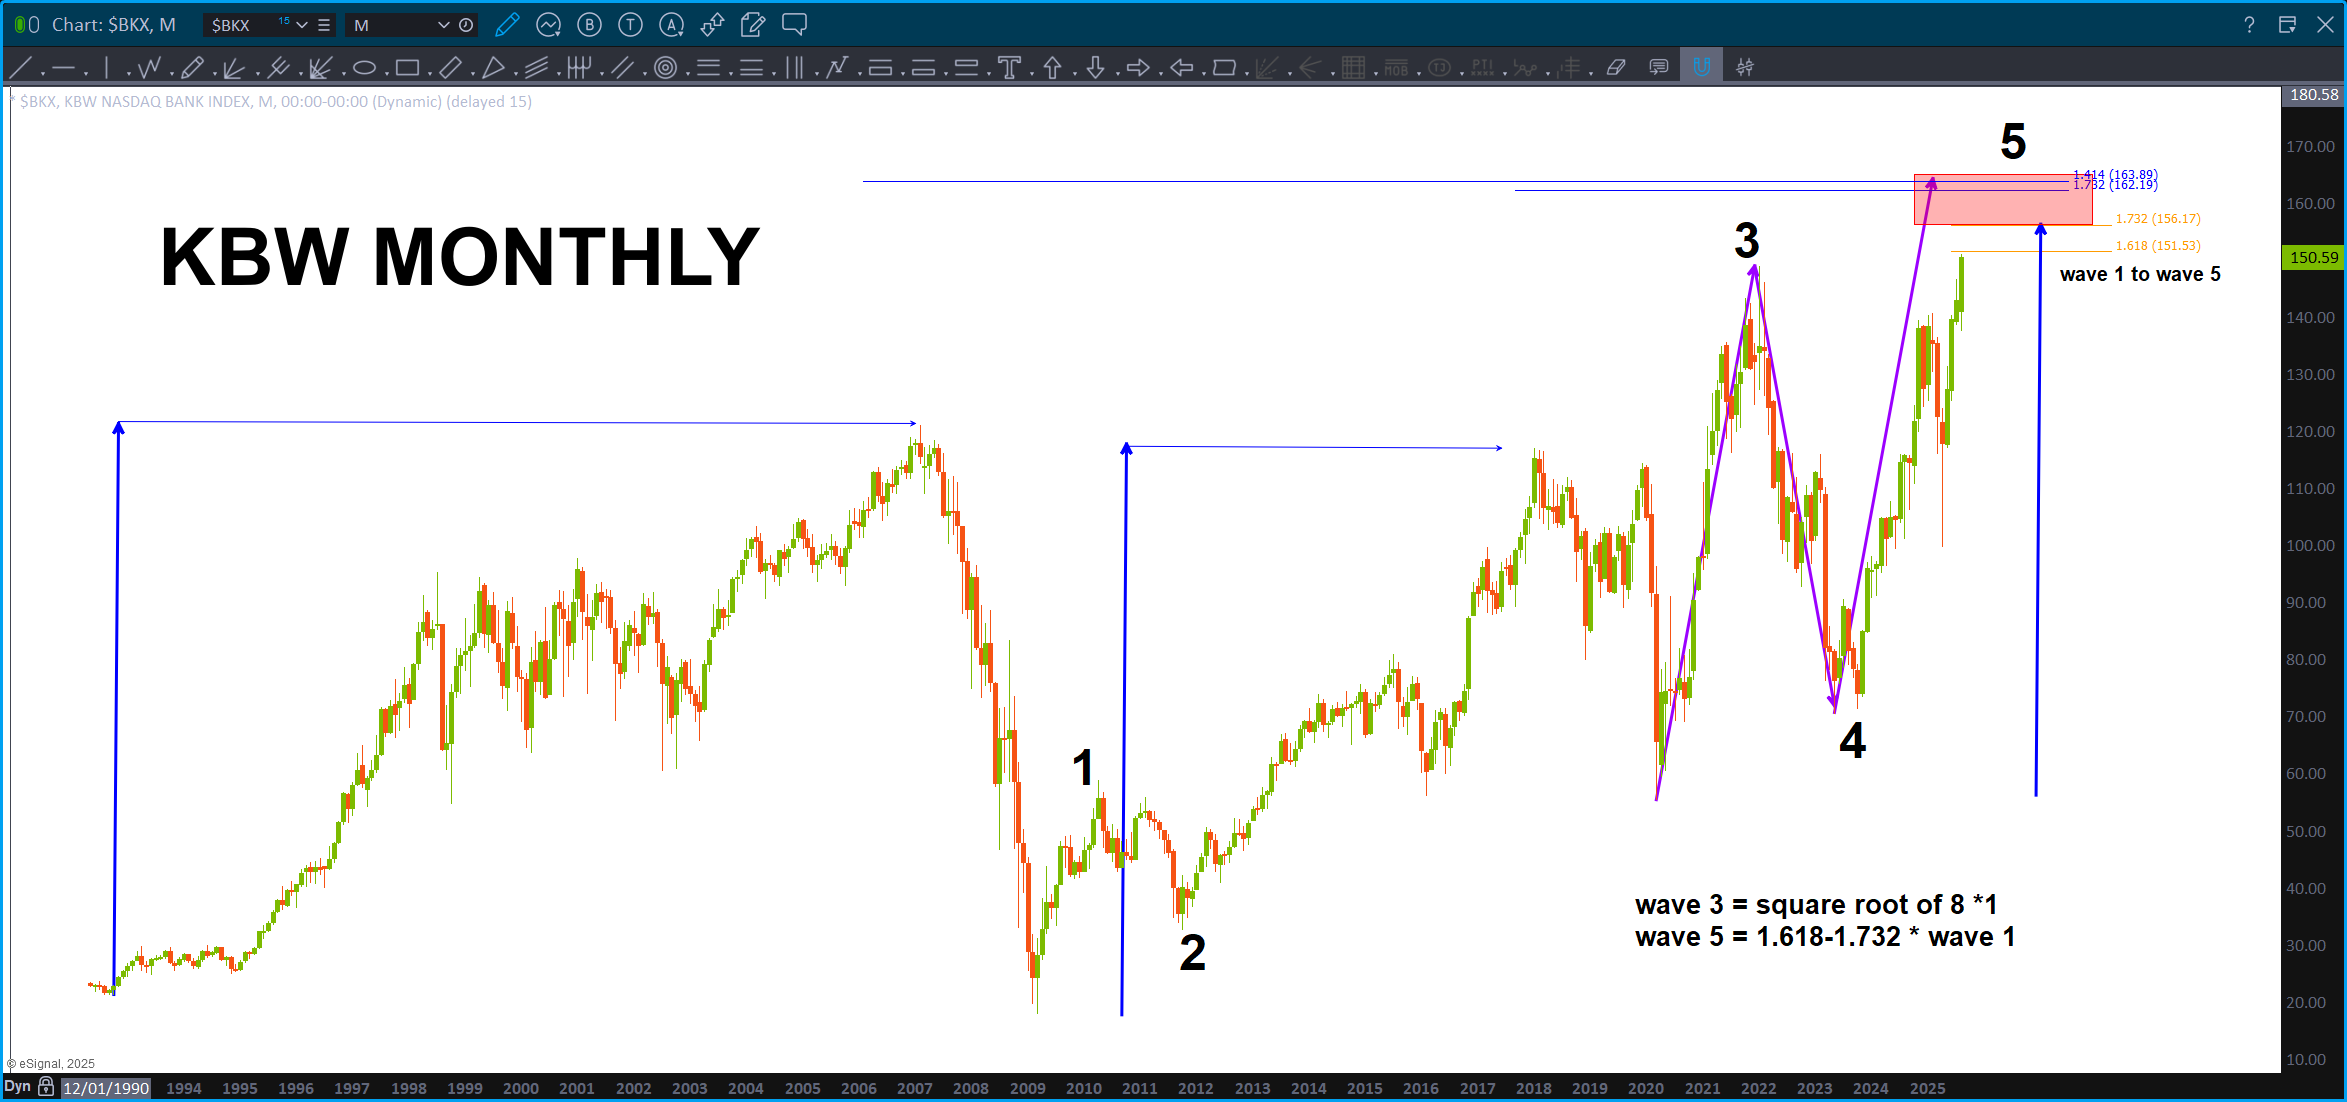
Looks like were close, doesn’t it?
But, what’s been trusty as heck … the old XLP / NYA … and w/ a few days left in the month certainly appears that this will be a monthly close below the monster 10+ year support and is bullish for stocks.
This one is going to be interesting … this is going to be a big one folks. We either pause for a nice little dump OR we explode to the upside. Just remember that EVERYTHING is connected (I mean it and I could blog all night about that) but I’m talking about the banking system so, says we haves a couple countries that can’t continue w/ the craziness of their debt problems (hmmmm) so they go to the IMF to do what … print more USD? Hmmm, not sure how to do that …maybe not too smart, nobody wants USD so how about Bitcoin – that makes sense but let’s do our own CBDC’s and the banks go ‘ night night.’
Who knows folks …
EUFN – August 19, 2025
Posted on August 19, 2025 Leave a Comment
On Friday we had a “planetary parade” –
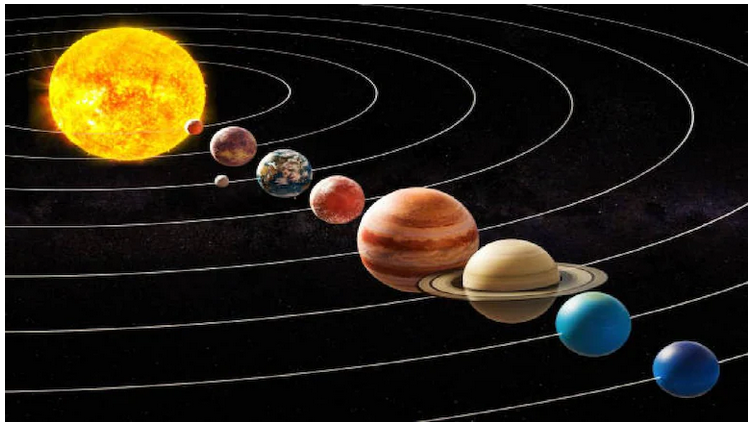
Pretty amazing – due to the darn marine layer here – I was unable to see it. But, could you feel it? I certainly could … more on that later, maybe. 😉
The last time we had a planetary parade ….see the chart below:
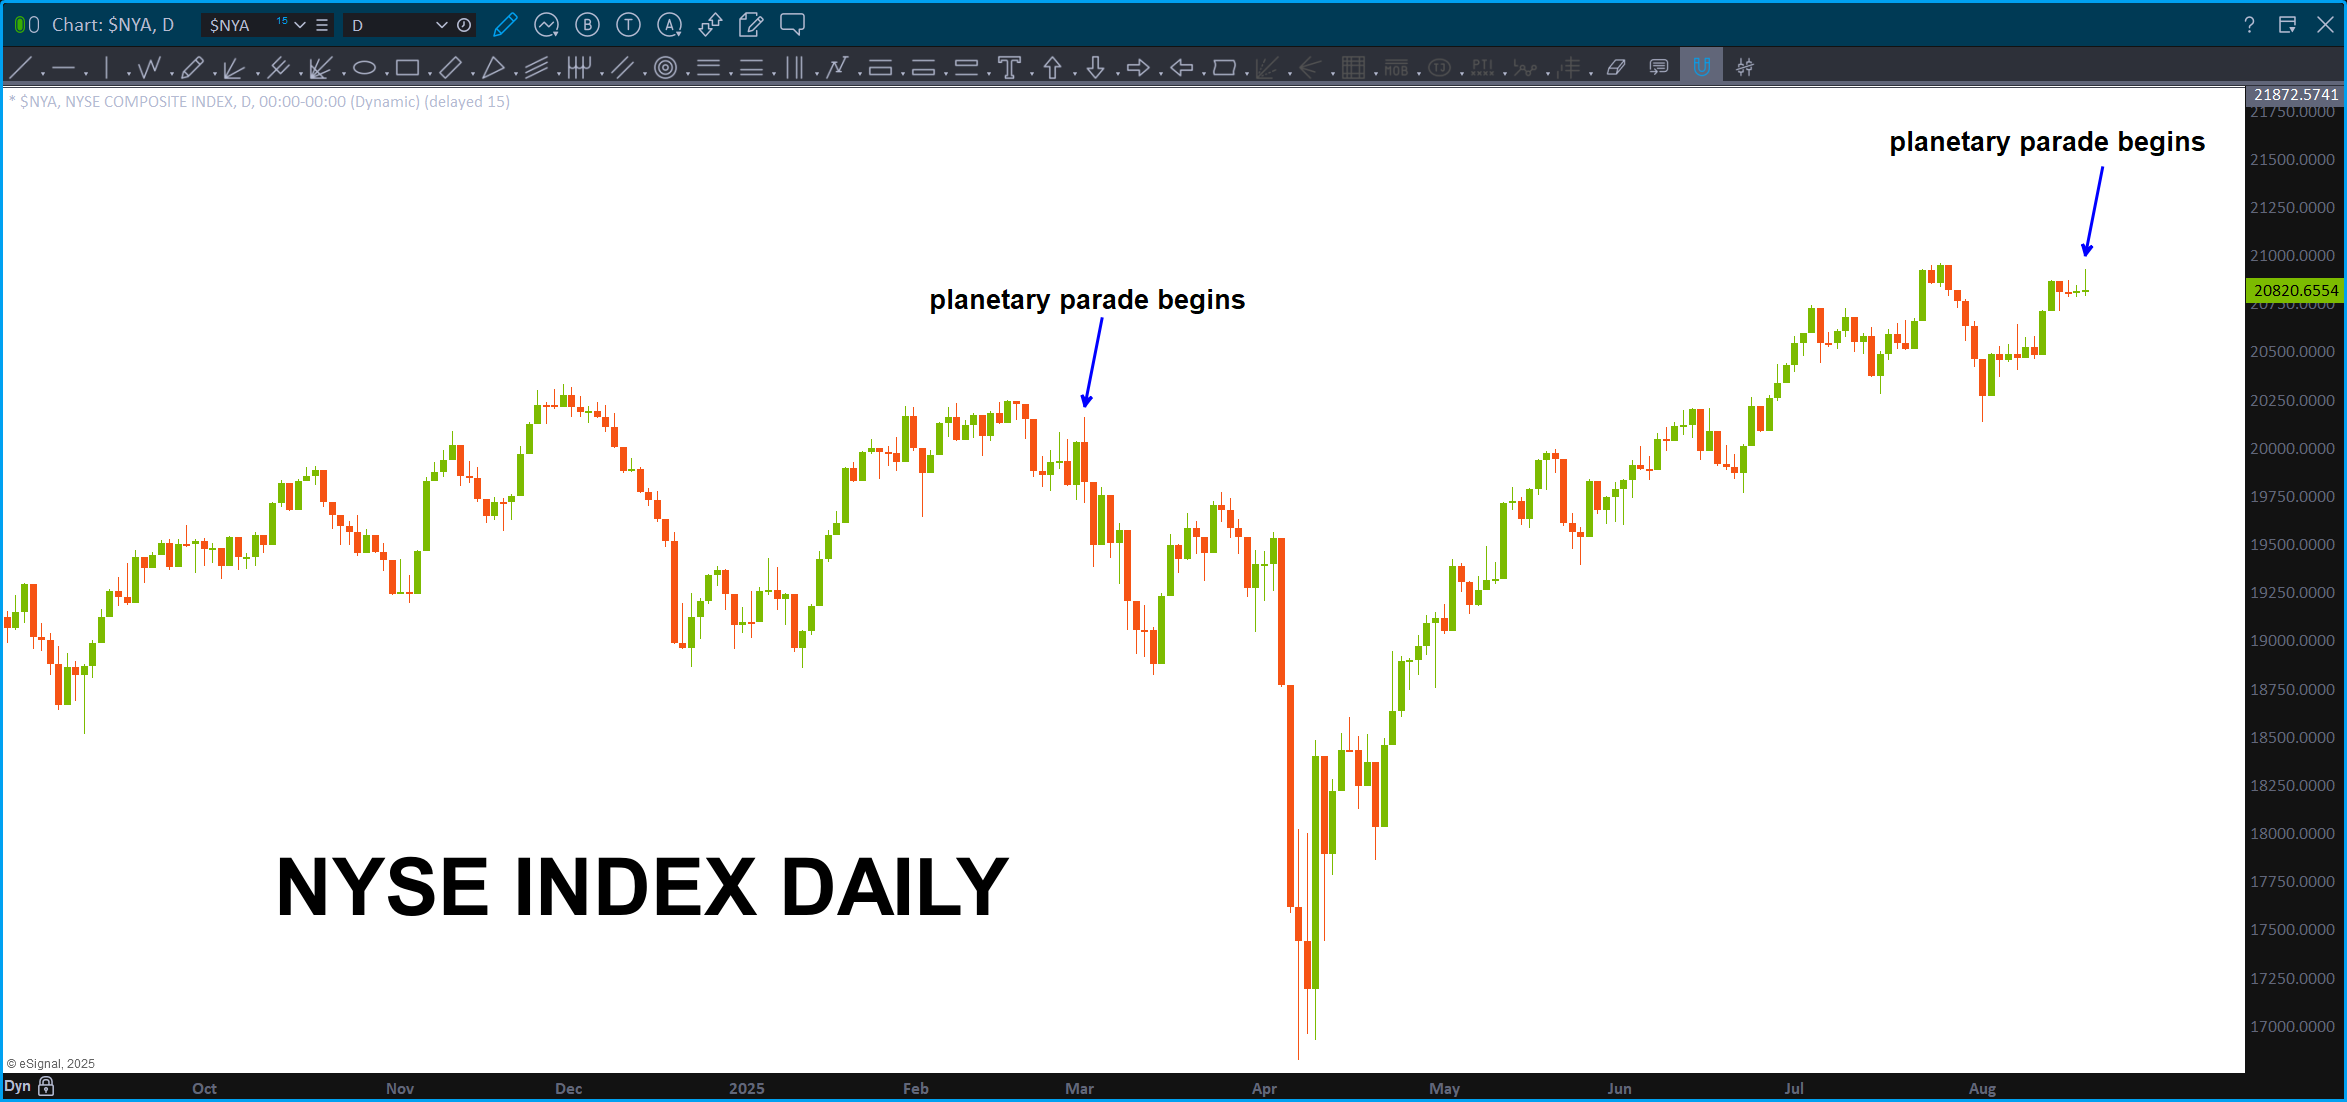
I asked Grok about the planetary parades since 2000 and I would say that ‘most’ of the time (80%?) it marked a pretty nice pivot. Majority were bearish but I would say it was a 65/35 split of bearish/bullish. Either way … w/ so many targets being hit, it was a ‘high’ probability that resistance was going to eventually show up. I think we are there …down into the end of the year and then BUY for a parabolic explosion or a big thump (my friend and mentor who has been trading for 50 years – Larry P) or a Grand Super Cycle III (EWT peeps)?
Here’s what I’m certain: I DO NOT KNOW. I do believe we have hit resistance.
Folks, IT IS ALL THE BANKS.
Here’s the next target on EUFN, showing how we can use the Vesica Piscis to project:
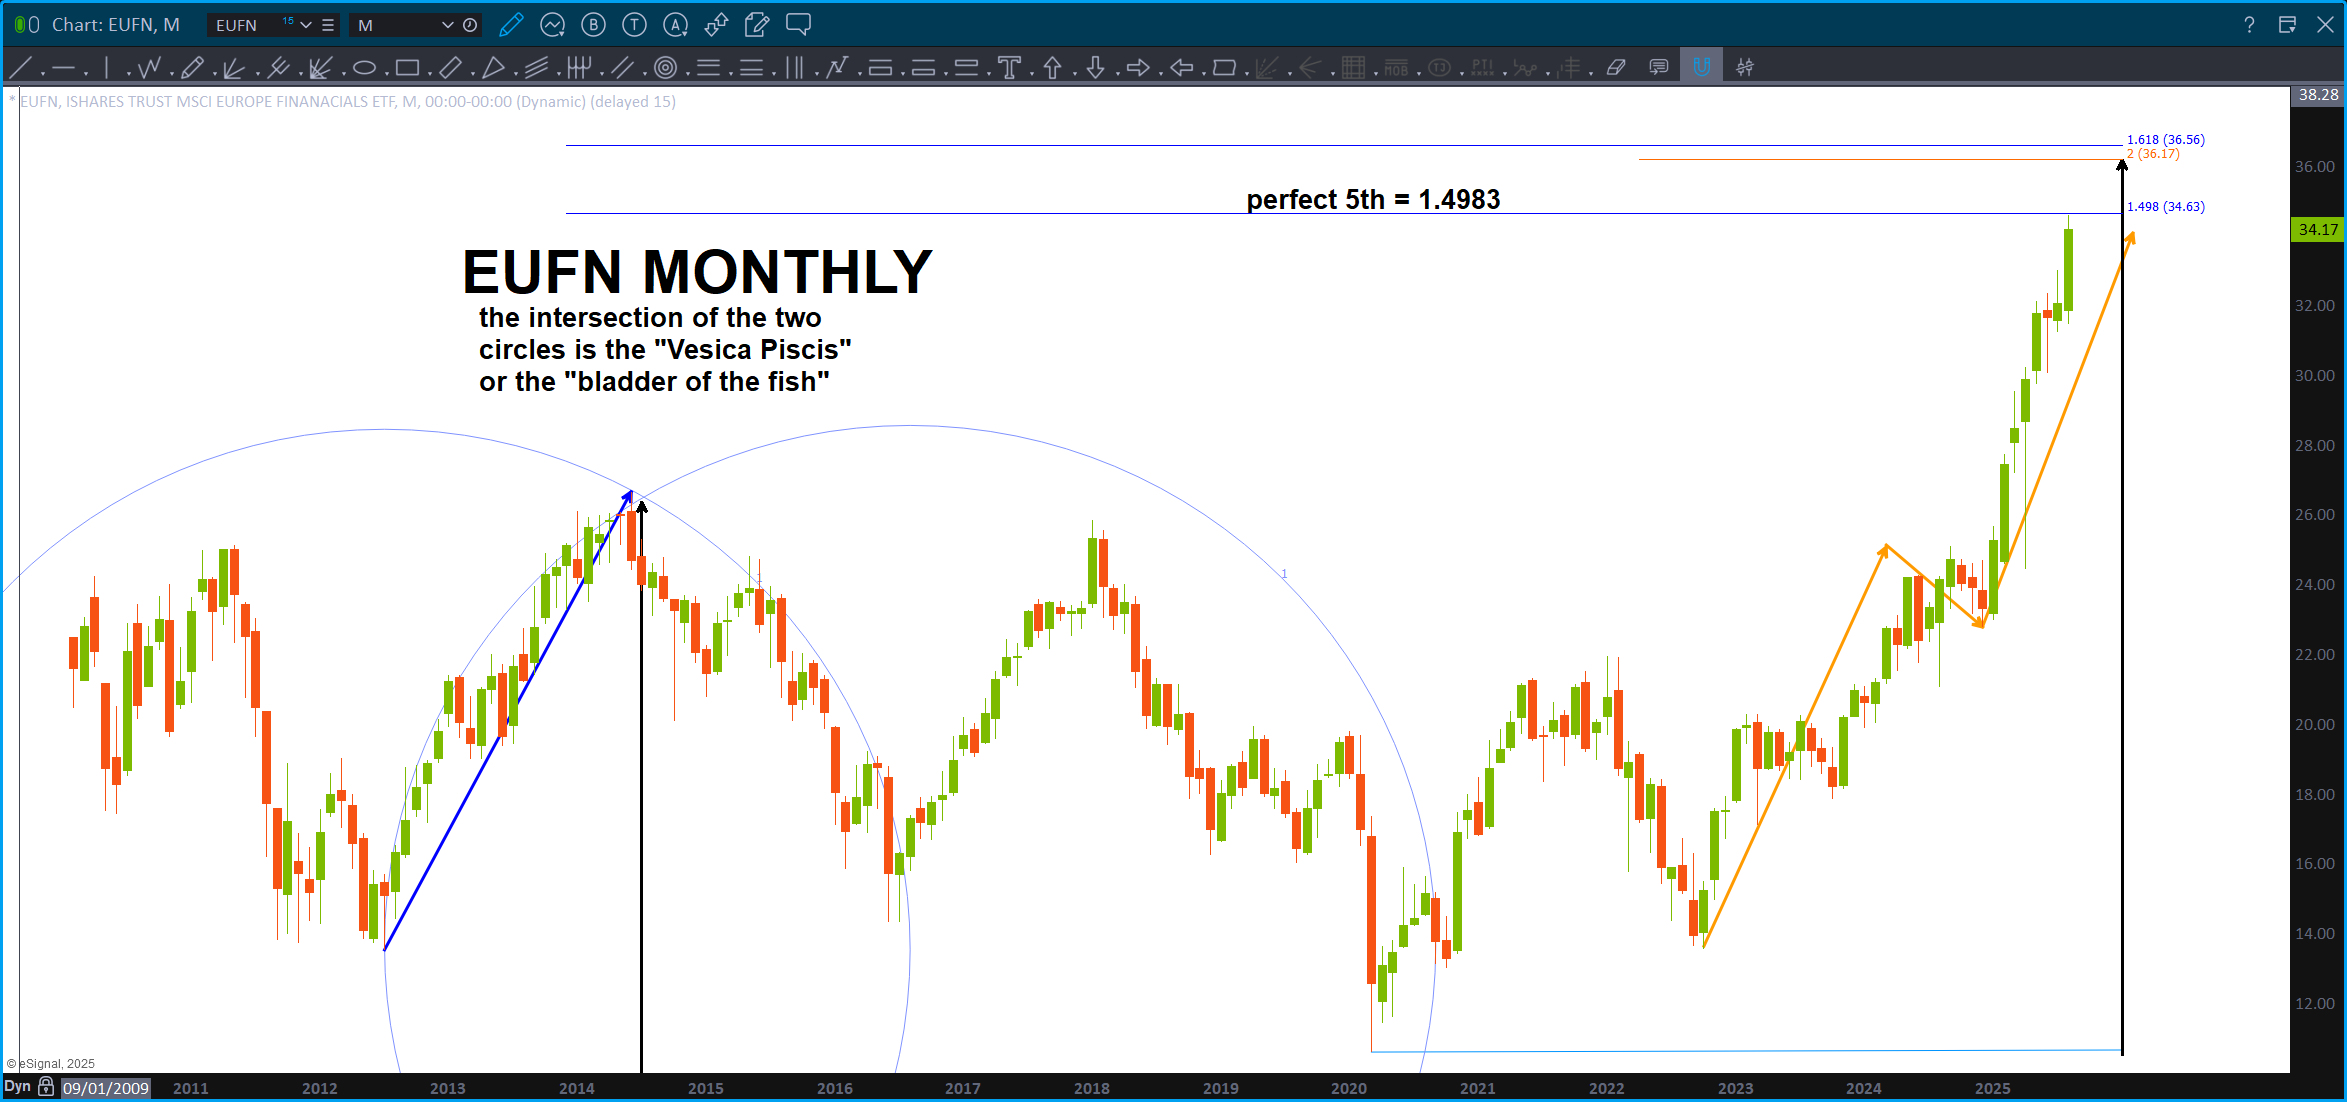
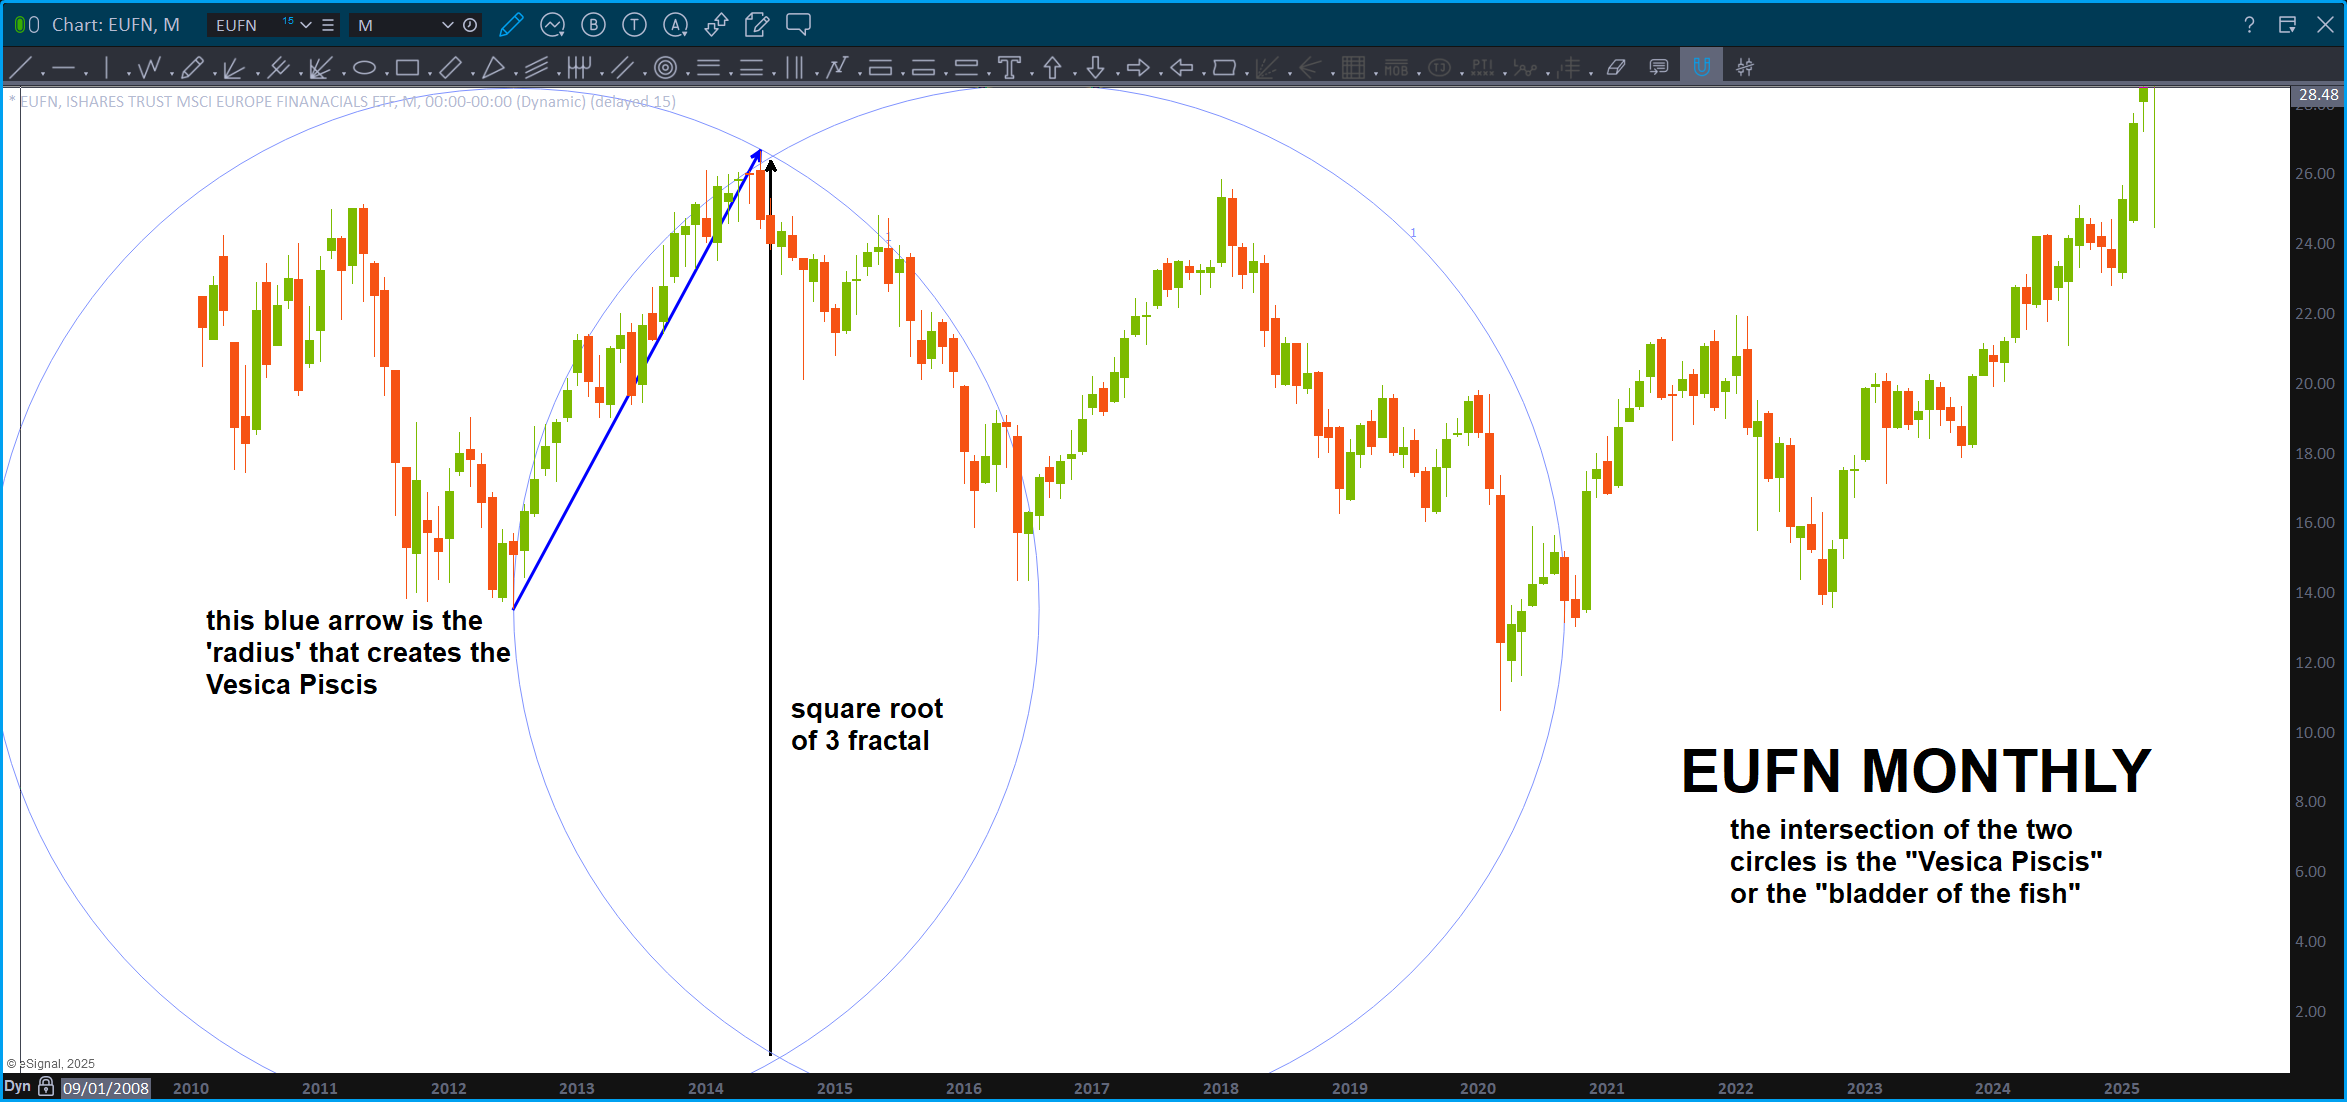
So, yes, we can use the intersection of two circles to project. Why not … it is THE portal?
The Vesica Piscis represents the bladder of the fish as we have ‘just’ left the Age of Pisces. That is why Jesus was a fisher of men who said “throw your nets to the right side of the boat (right brain).”
What’s happening now? We have being birthed the Age of Aquarius. That is the meaning behind Luke 22:10 (look it up) w/ the water bearer being the Age of Aquarius, the House he enters being astorlogical and the end of the age being the end of the age of Pisces. Why was the movie Avatar about …water?
So, now do you understand why Pi is so important?
What is it?
Mr. Grok:
Pi, approximately 3.14159, is an infinite, non-repeating number that unlocks the secrets of every circle in the universe. Esoterically, it’s a sacred thread weaving together math, nature, and the divine in an eternal, mystical dance.
Pi is extremely important. So important .. it’s where God states “I AM.”
Exodus 3:14.
Pretty nutty huh? 😉
And then, just THINK about the number Pi because, heard somewhere, even the very hairs on your head are numbered. Right?
And, come to think of it …that’s from Luke 12:7. Or 127 or 1.27 or the square root of `1.618 the golden mean. Why the square root ? (sorry folks, see above Vesica Piscis) Musical Theory folks … square root of strings tension or 1/ the strings length equals the frequency. And, there we go again … ALL IS VIBRATION. Period. Dot.
I’ve been working w/ my friend Ponch on understanding the OODA loop from the perspective of active inference and the free energy principle. Tilt? Doing this exercise w/ him down the rabbit hole has objectively or scientifically ‘proven’ to me that thoughts and your spoken word ARE CREATING REALITY. It’s real folks … what does this have to do w/ anything? Work with me …
So, vibration is everything … what was the original vibration? And God Said “let there be light.” Up until that point … it was the singularity. But when that first primordial word, or vibration was spoken, the vibration became form:
There it is folks … EVERYTHING is vibration. What causes the vibration? Our thoughts and our words …
It’s get better … really?
Let’s jump to gematria Mr. Grok:
“…Gematria is a mystical practice where each letter in a word is given a number, and you add them up to find hidden meanings or connections between words with the same total. It’s like a secret code in languages like Hebrew, where numbers reveal spiritual truths tying words to the universe’s deeper patterns...”
So, let’s go back to Pi … the decimal points goes on into infinity. (Omnipresent) It never stops. So, if we transition to the gematria of the letter, no letter will ever repeat. EVER. Therefore, it’s only mathematical that EVERY WORD that HAS BEEN SPOKEN, IS BEING SPOKEN, OR WILL BE SPOKEN is contained in Pi. Every aspect of it and the “3” that goes before it … it’s the third octave or dimension – we are in the 3rd dimension. You see?
So, therefore, God is … ALL OF IT. Omnipotent, Omnipresent, Omniscient, omnibenevolent. So, after that first radius making “everything” become light (it’s encoded in our DNA folks, look it up) the circle was set in motion by tying it all together. Perfect … perfection can’t be divided,it can only be squared therefore a second circle was created – creating the vesica piscis. Hence, Adam and Eve – the separation and why the act of human creation is, truly, divine. That is why the divine opposites create the union of the one …
The Portal (Vesica Piscis) sure looks like the area that makes a female a female .. how appropriate. All of creation, the square roots from sacred geometry that are responsible for every fractal that creates this matrix is represented by the divine feminine for life, but not just life but for the ONE to experience this life co-creating every single aspect of it …
It’s a portal folks and here’s to you my sweet and wonderful sunshine … you got this my Maddy and I love you.