KBW – January 6, 2025
Posted on January 6, 2025 1 Comment

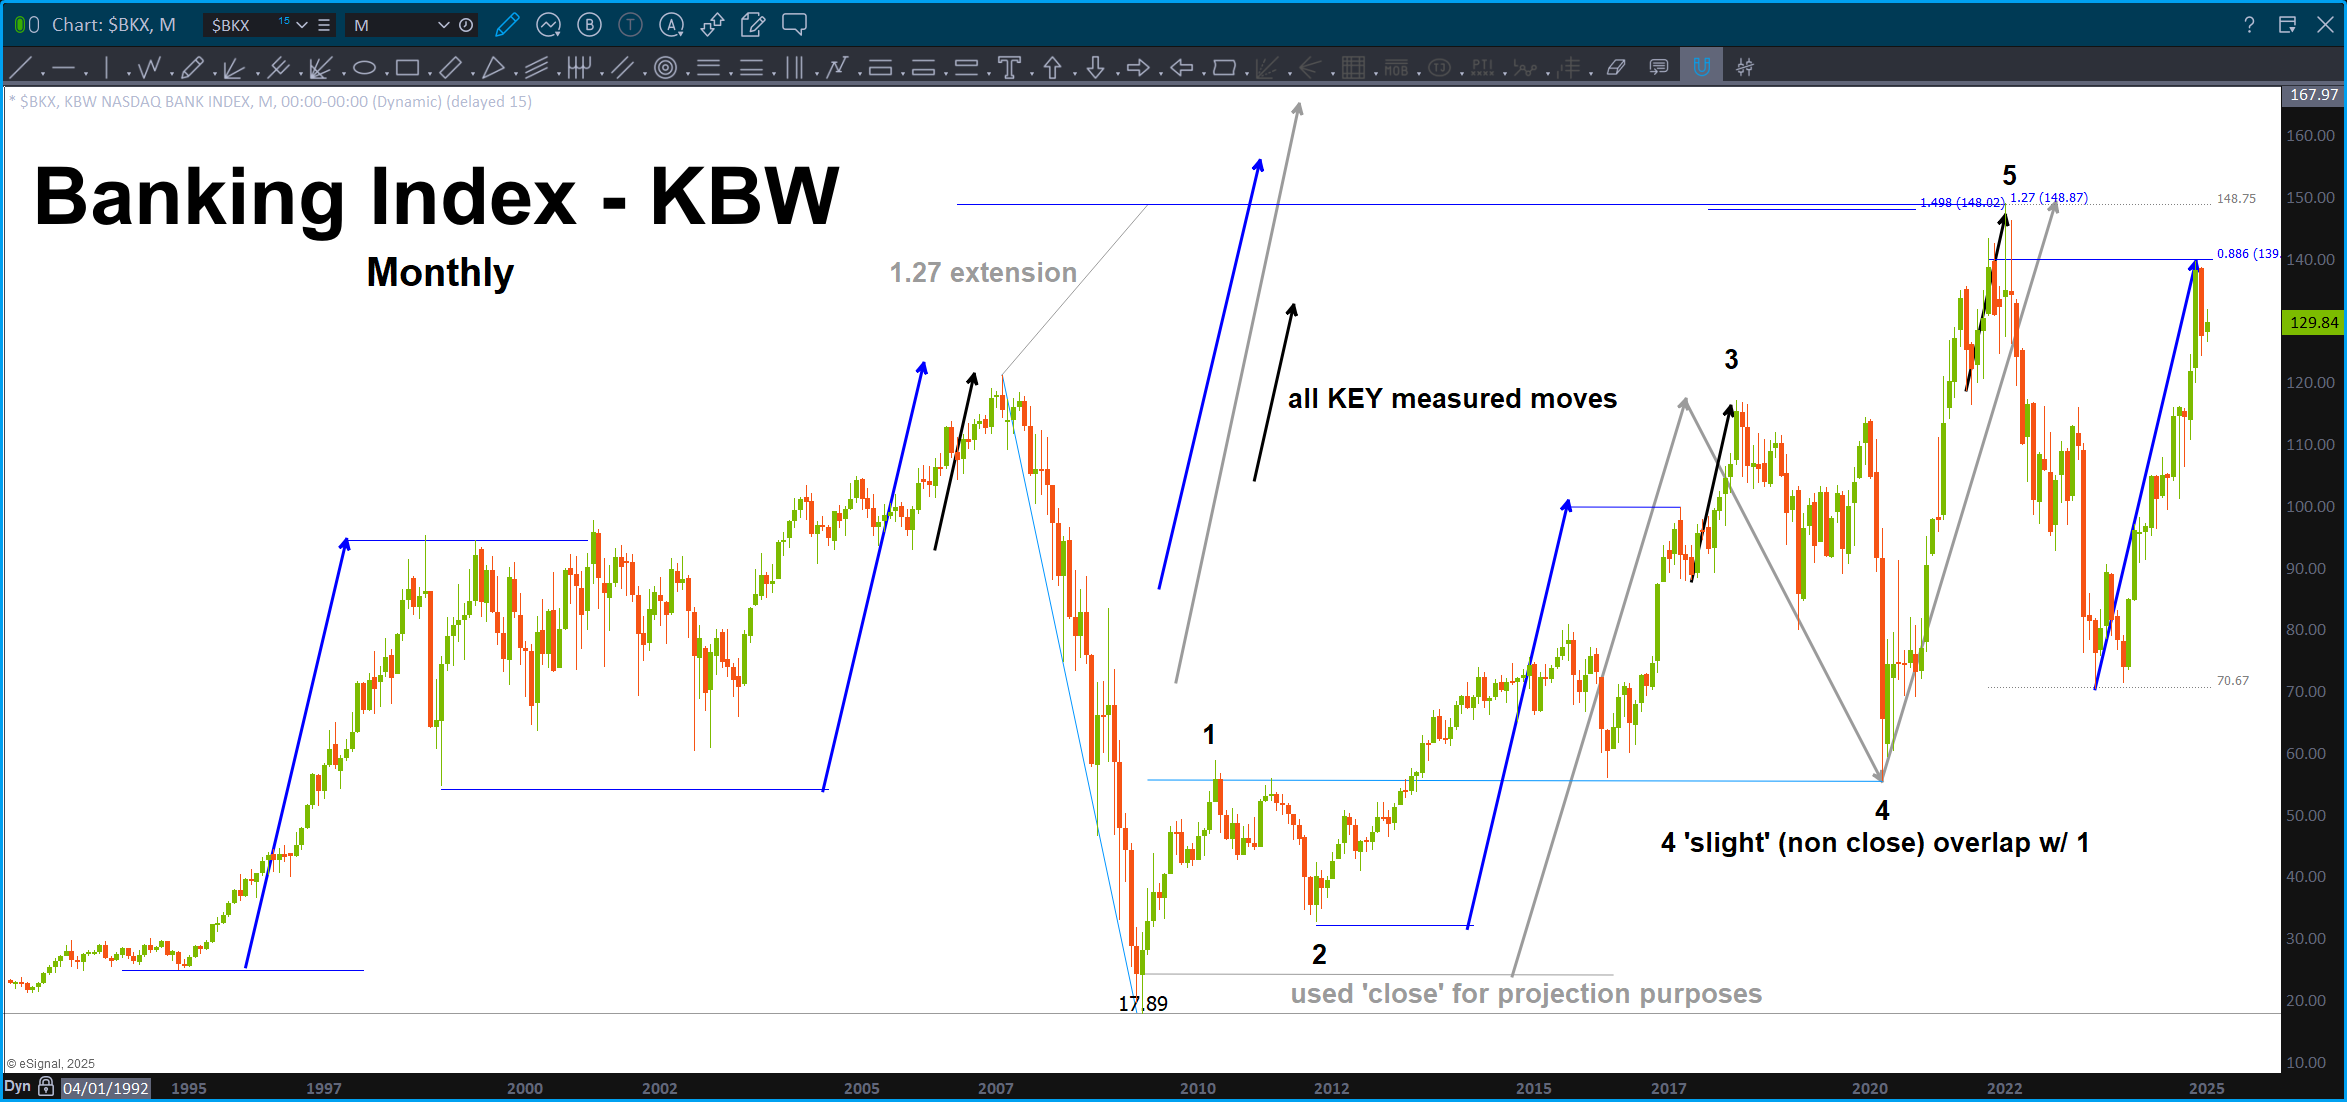
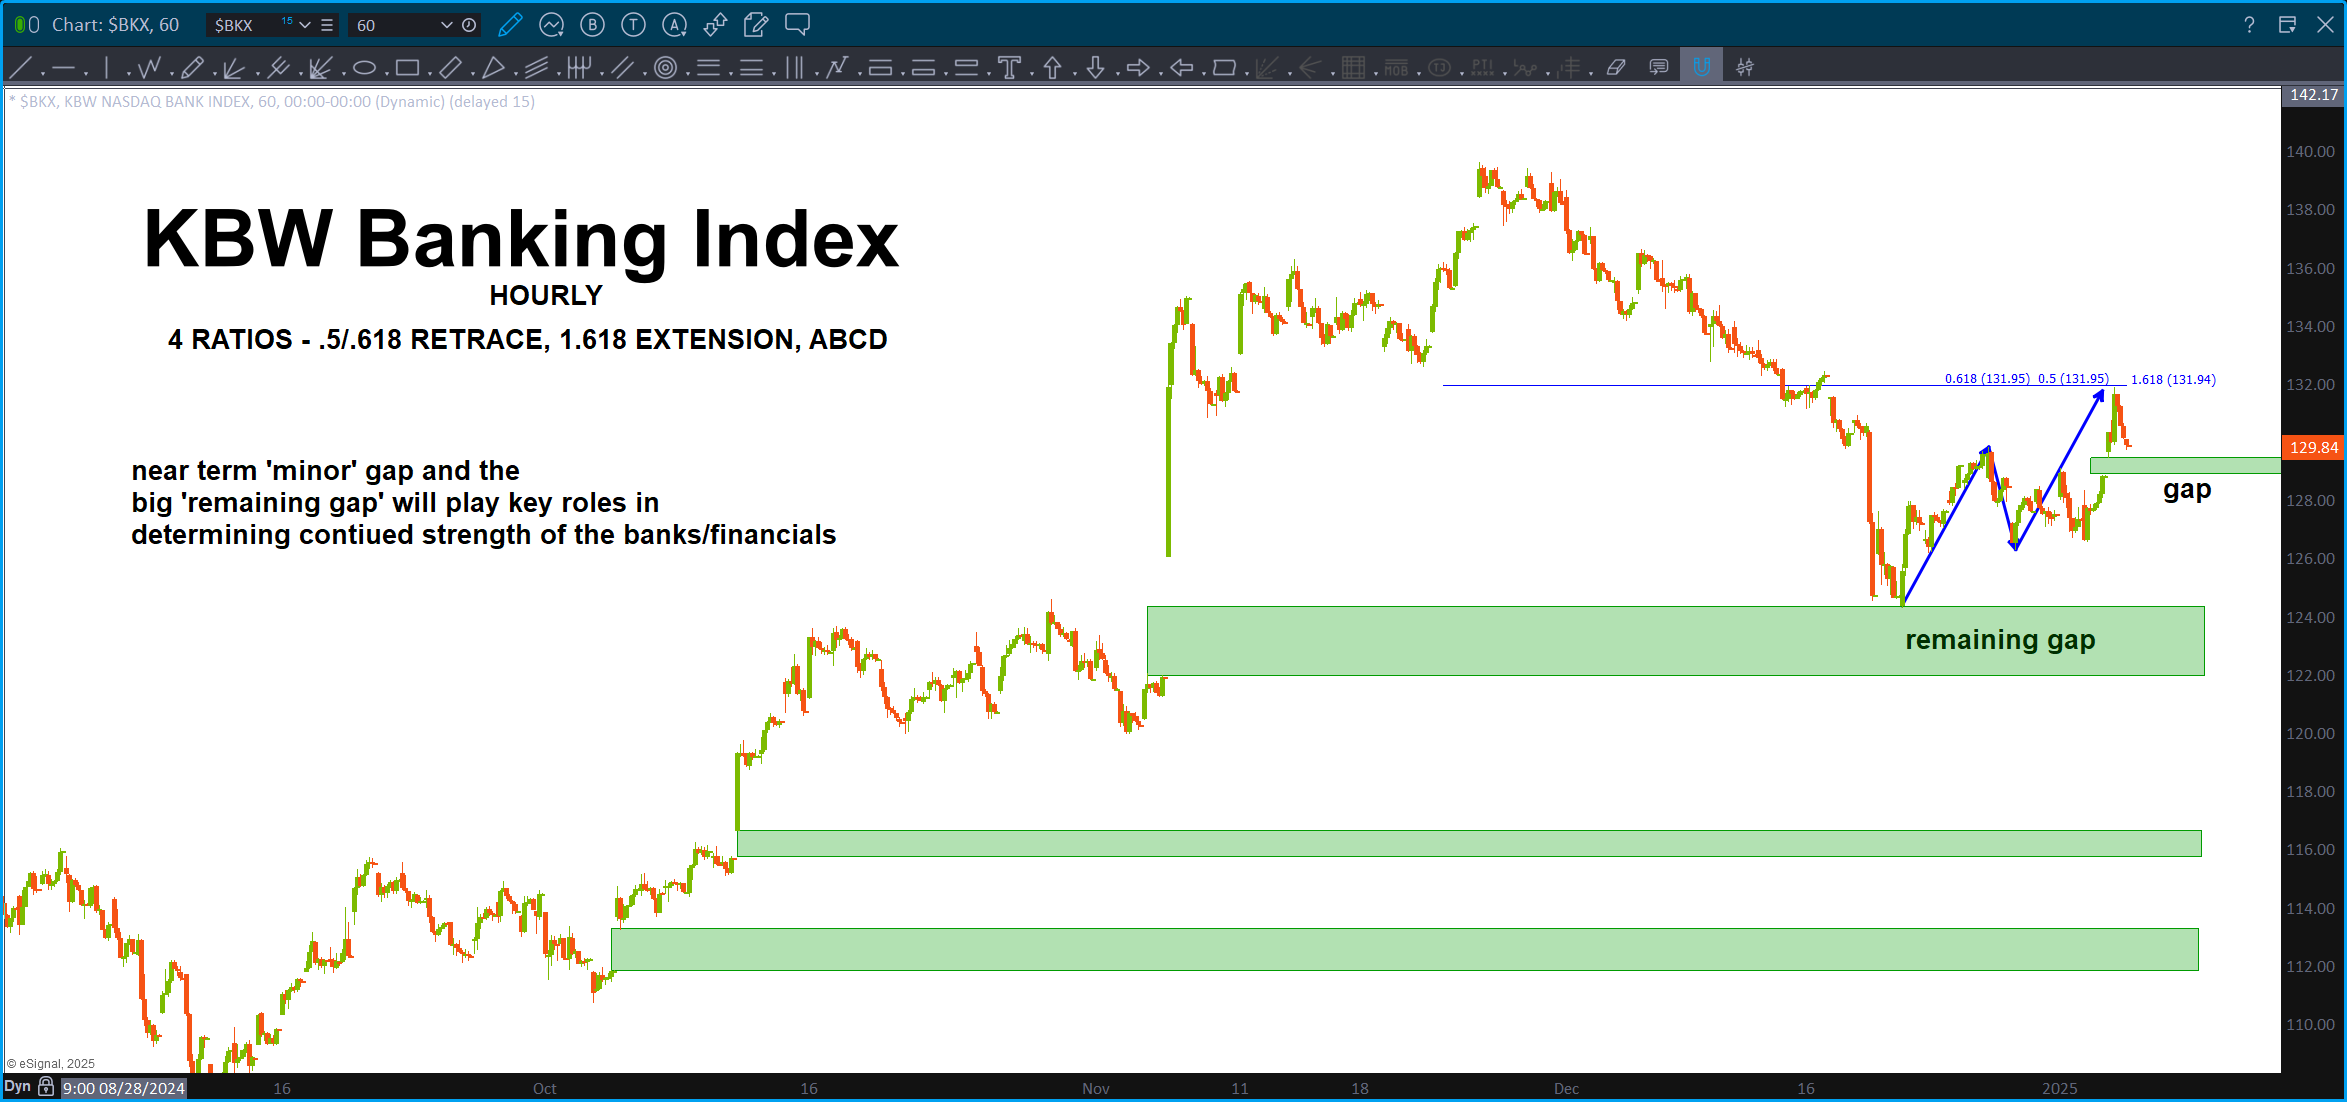
Need to watch the KBW here … take note of the two levels below which represent “gap support.” As long as KBW stays above these two support zones (expect the first to give away) then we are good to go …the BIG gap support is the key for me. That “should” hold if we are still very bullish …just because we lose it doesn’t mean the insanity of the “top of all ages” and “blah blah blah” is here. No, if you’ve been following this blog we’ve expected this level to be resistance for the equities …
As you have heard me say before – banks / financials lead us UP and they lead us DOWN.
Don’t get confused w/ the ‘arrows’ on the chart – they are “measured moves” and they are the harmony that causes the market to bounce around …
KEEP AN EYE ON KBW and the Banks/Financials … this SELL PATTERN on KBW has hit and has held.
Last, apologize for missing this SELL PATTERN – I simply had not looked at the KBW in a while and not until today.
Visa – January 5, 2025
Posted on January 5, 2025 Leave a Comment

Well, back to the grinder tomorrow … man it’s been awesome having some time off. Waves – HUGE. Actually too big as the beat down getting out is – frankly – like ice fists to the face. But, the waves are tasty … yew!
Last post on V: https://atomic-temporary-44460632.wpcomstaging.com/2024/09/25/visa-september-25-2024/
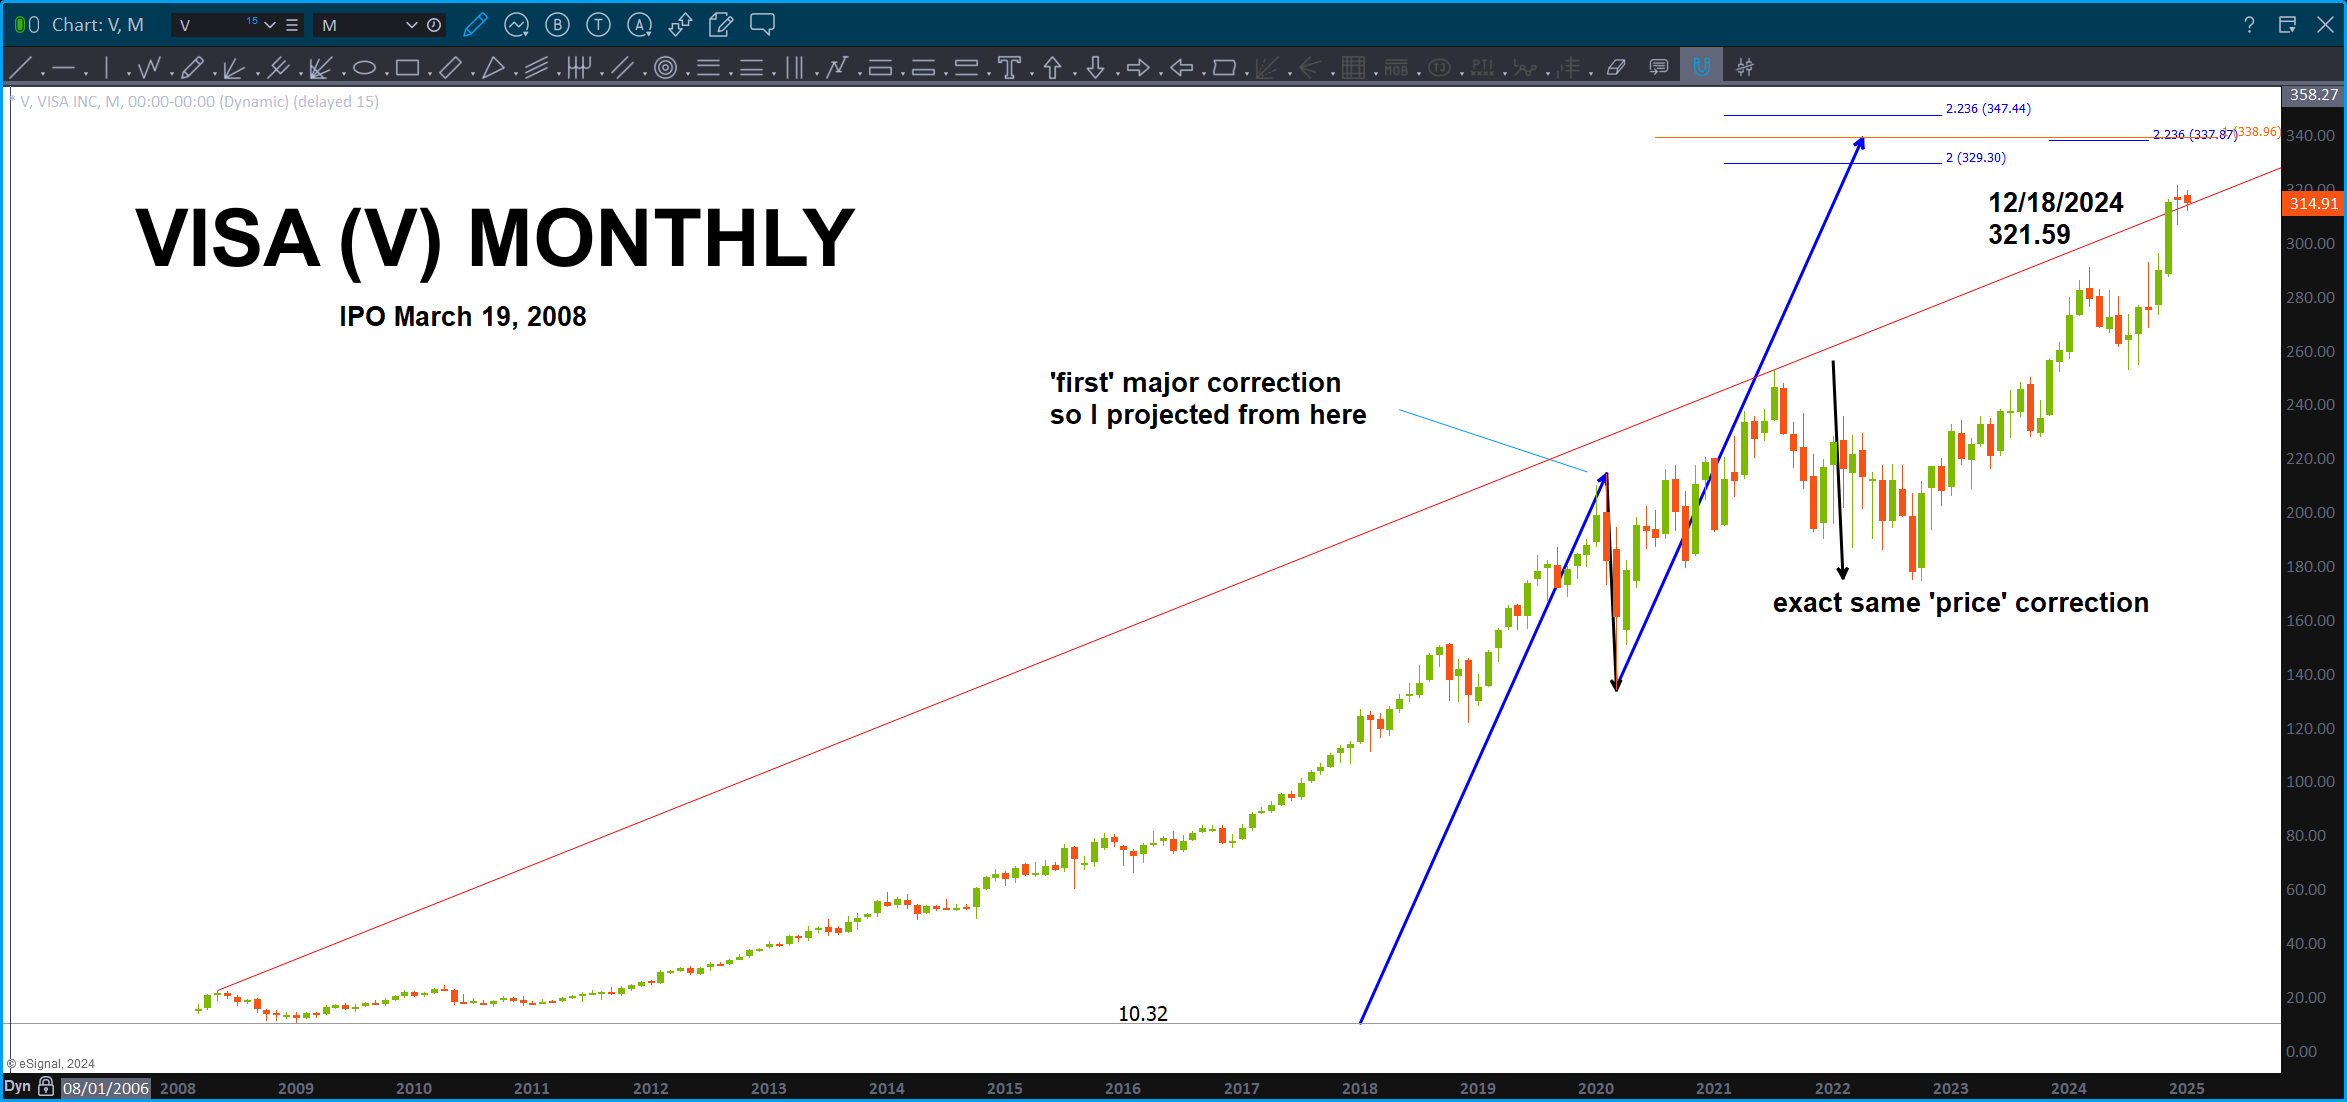
Support held … now, take a look at this projection. It took me a little while to ‘see it’ but when I did the projection I actually ‘saw’ that the resistance might have been a .618 price projection. Nope.
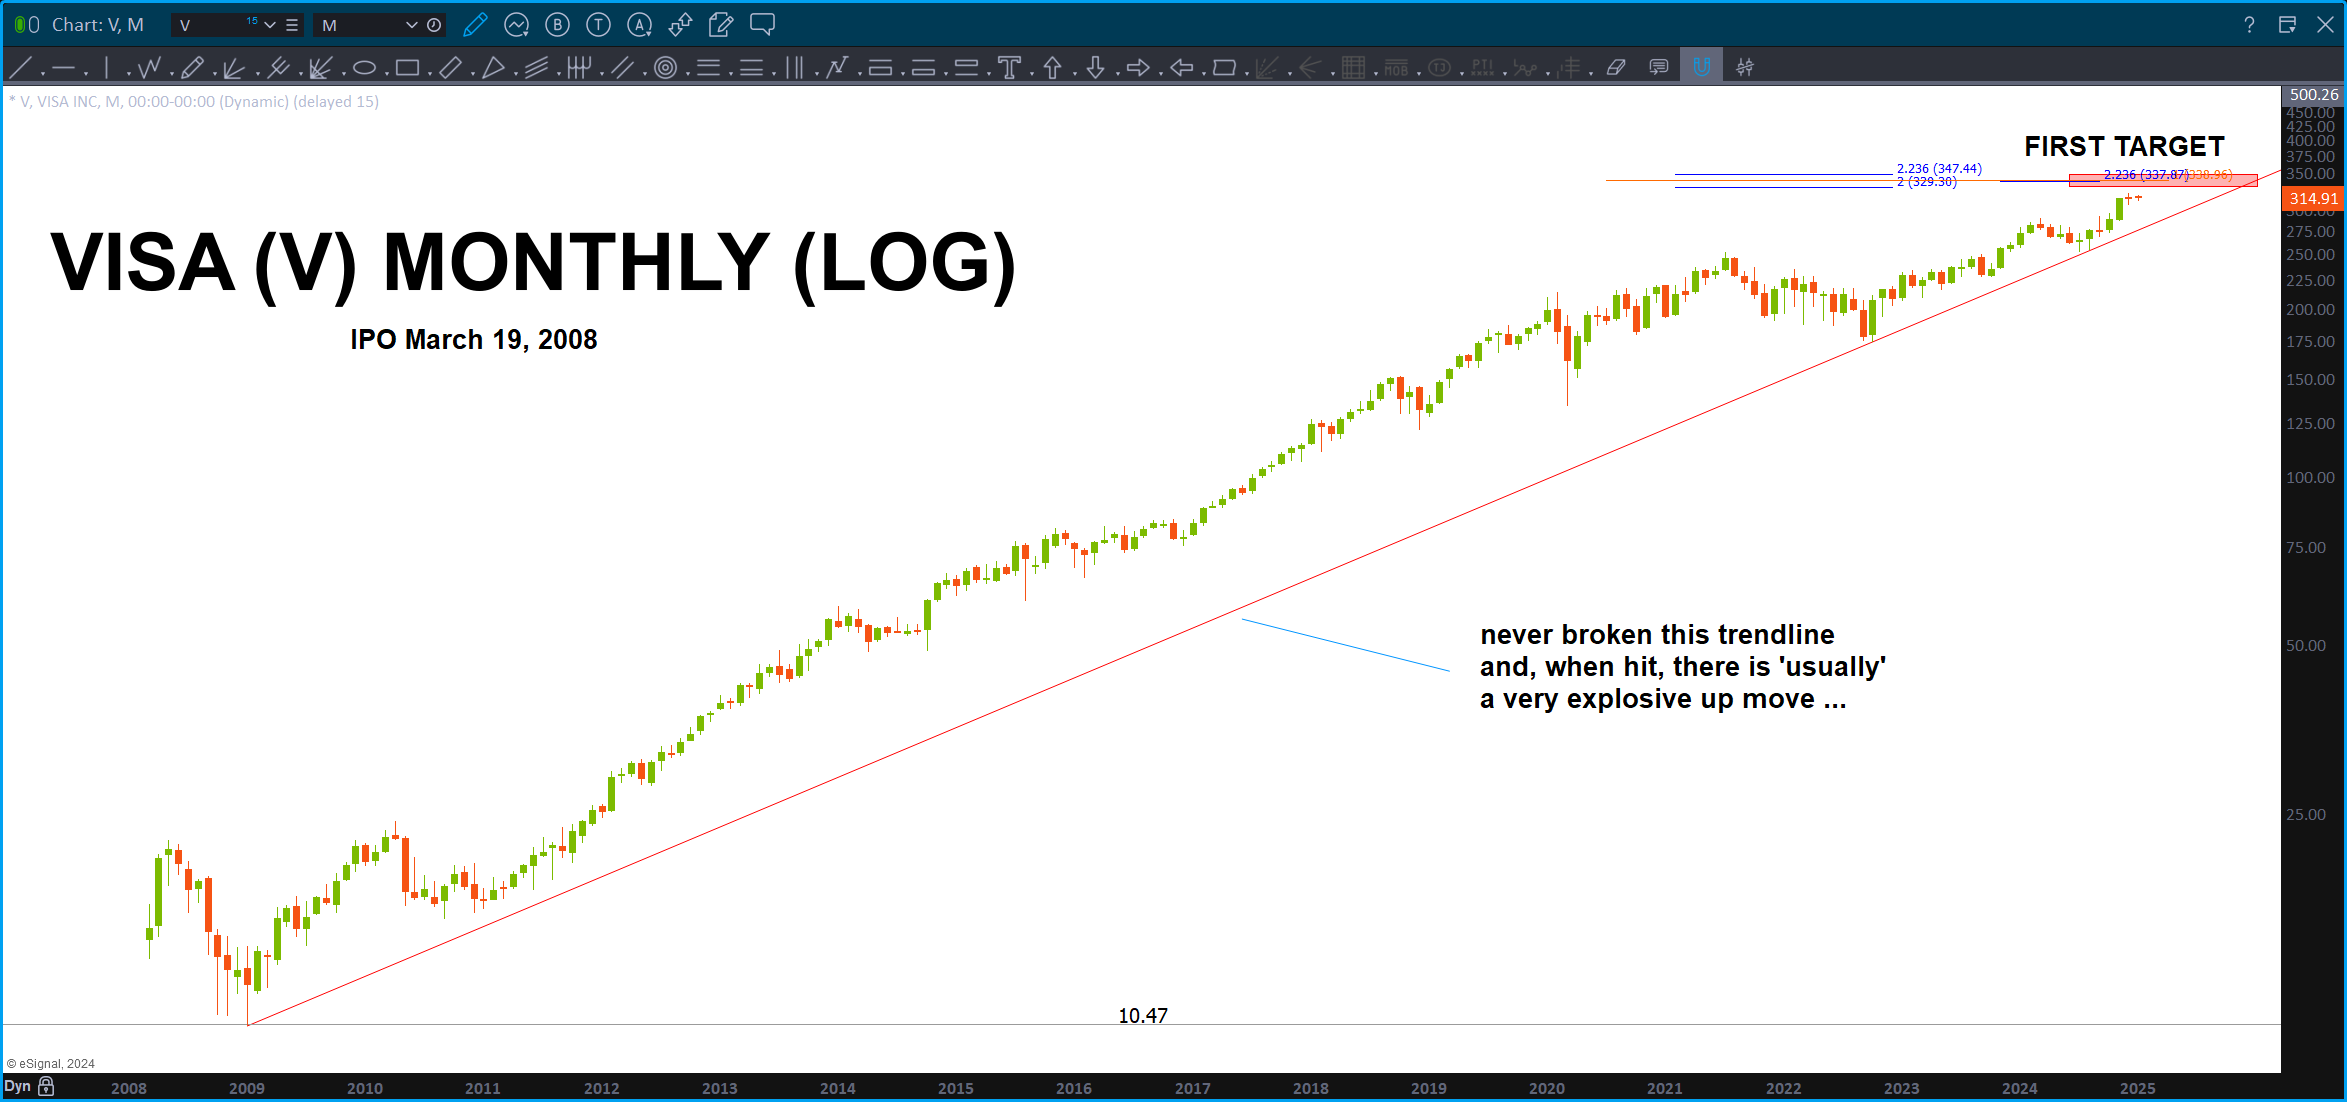
Folks, the ‘first’ ABCD on Visa is just a little higher … additionally, STAY LONG until the LONG TERM LOG TREND LINE is taken out to the downside on a weekly/monthly close. This is a beast.
MicroStrategy – January 01, 2025
Posted on January 2, 2025 Leave a Comment

Last post w/ MSTR in it – did a joint post w/ Bitcoin: https://atomic-temporary-44460632.wpcomstaging.com/2024/11/25/bitcoin-3/
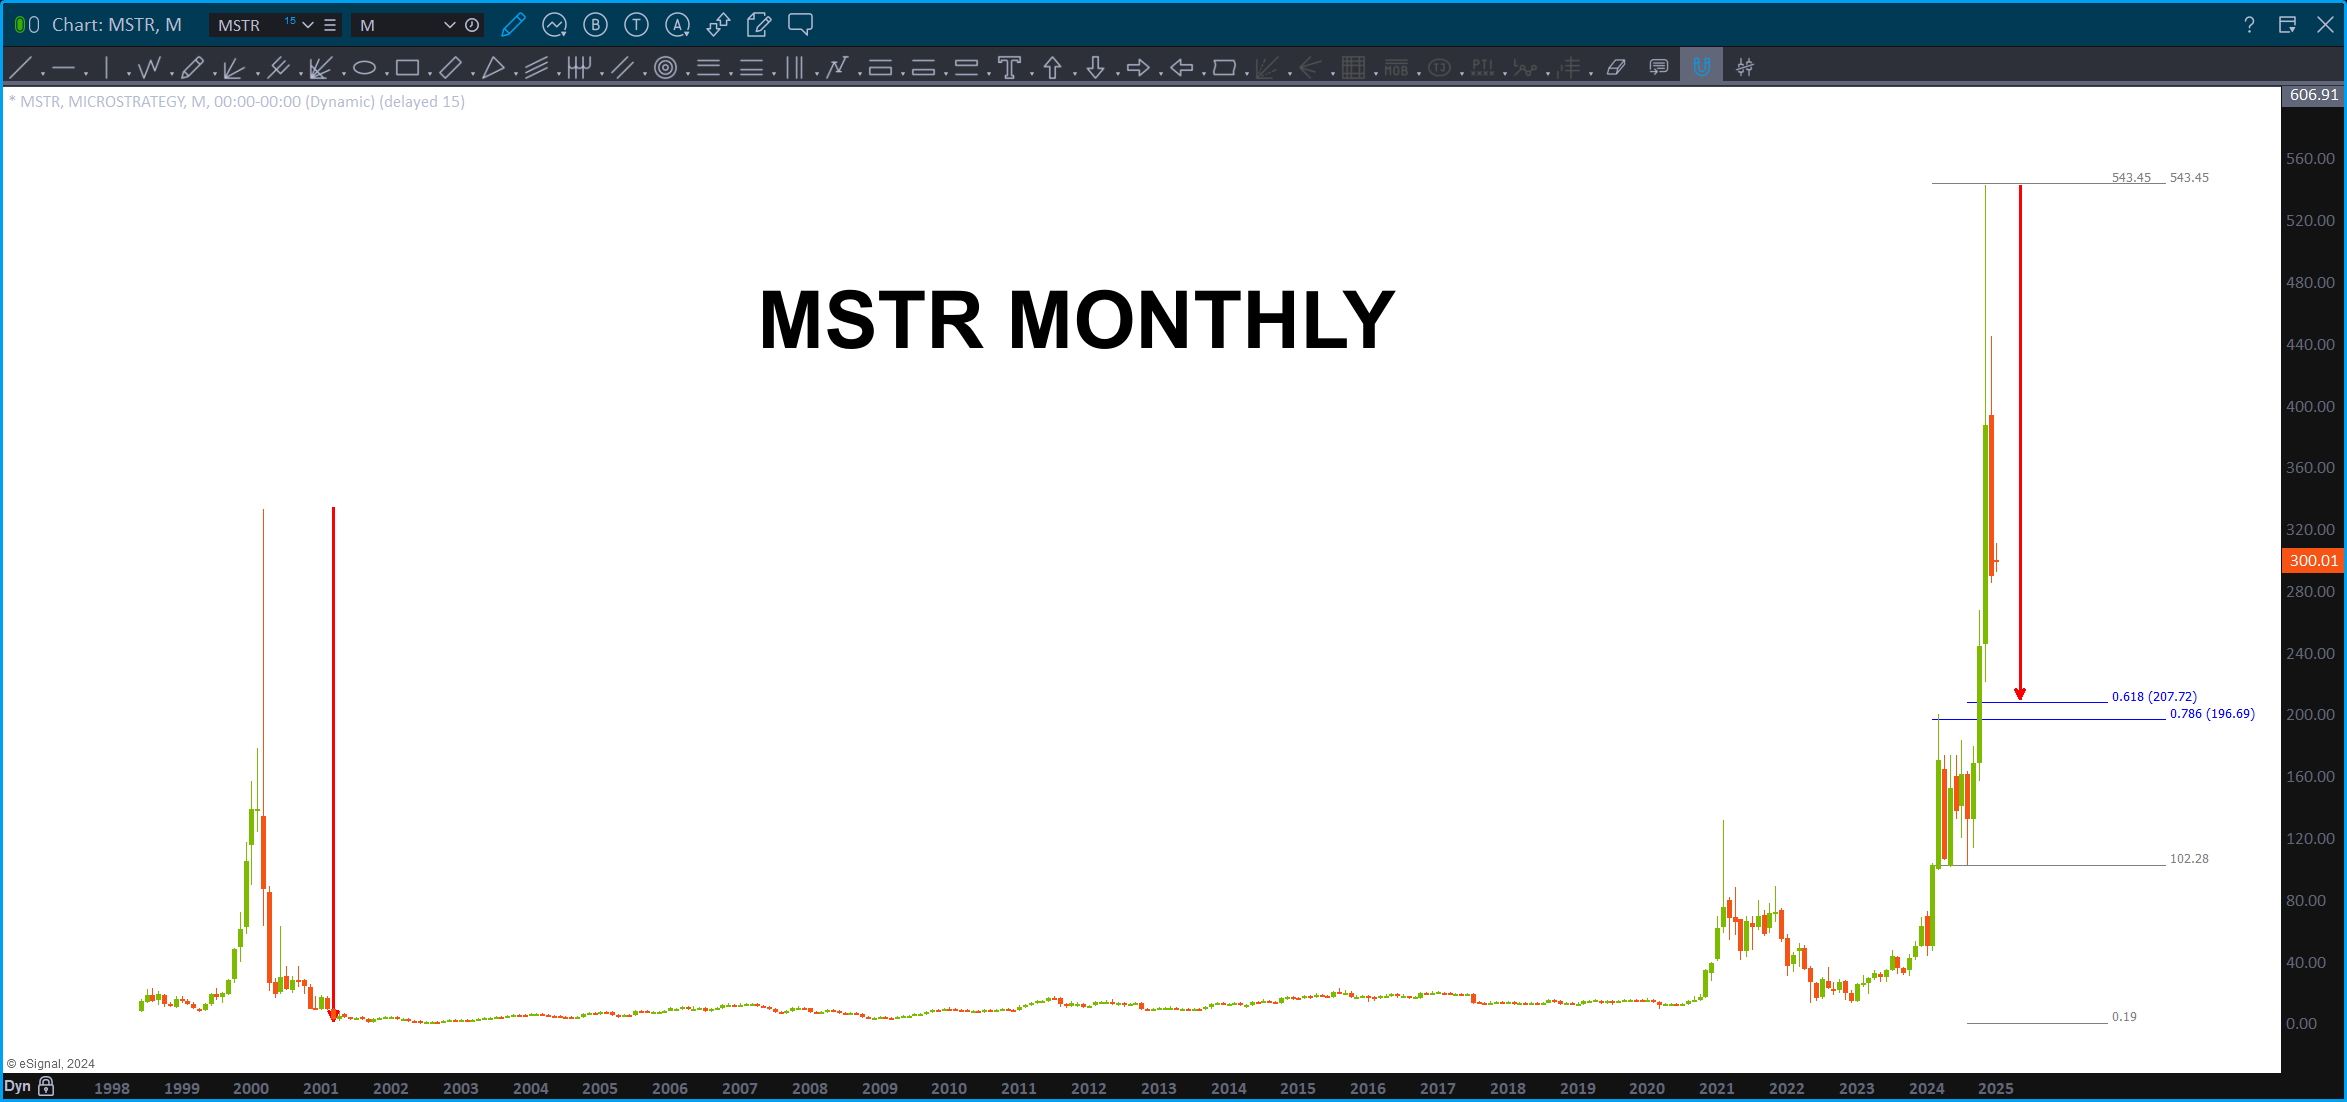
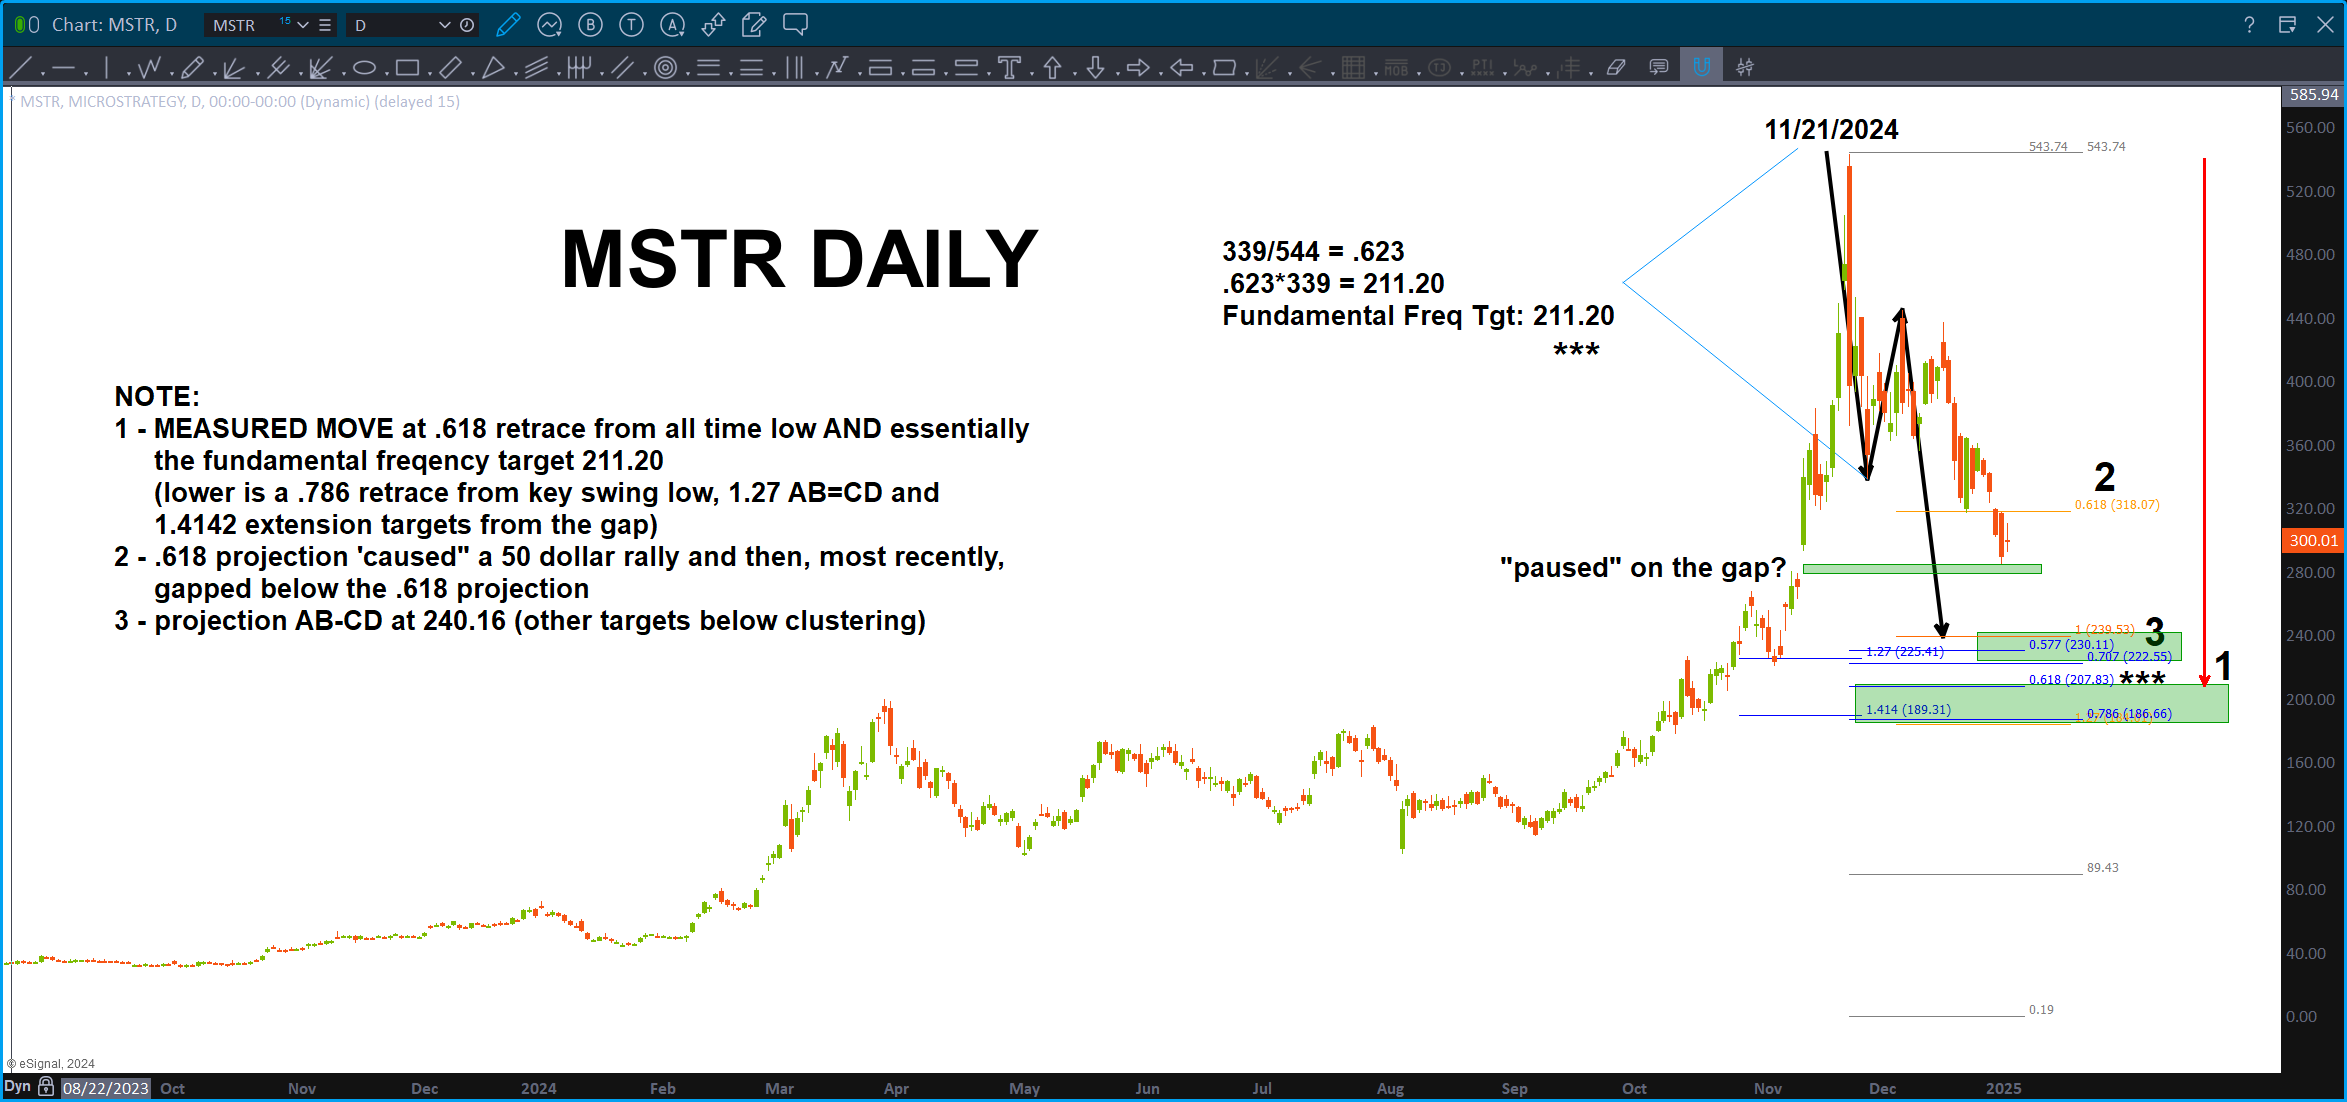
Looks like we have a VERY nice support zone coming for MSTR. I REALLY like the measured move into the .618 from the all time low but there are other alternatives and here’s where a nice STRONG “C” wave would help so you could COUNT the waves (or at least try).
As you can see above, I wanted to buy MSTR and did understand the importance of it’s support level but I missed that one … the hope (always a strategy) was it would complete a sequence.
Anyhoo, here’s MSTR:
NYSE Index – January 01, 2025
Posted on January 1, 2025 2 Comments

Happy New Year – here we go 2025.
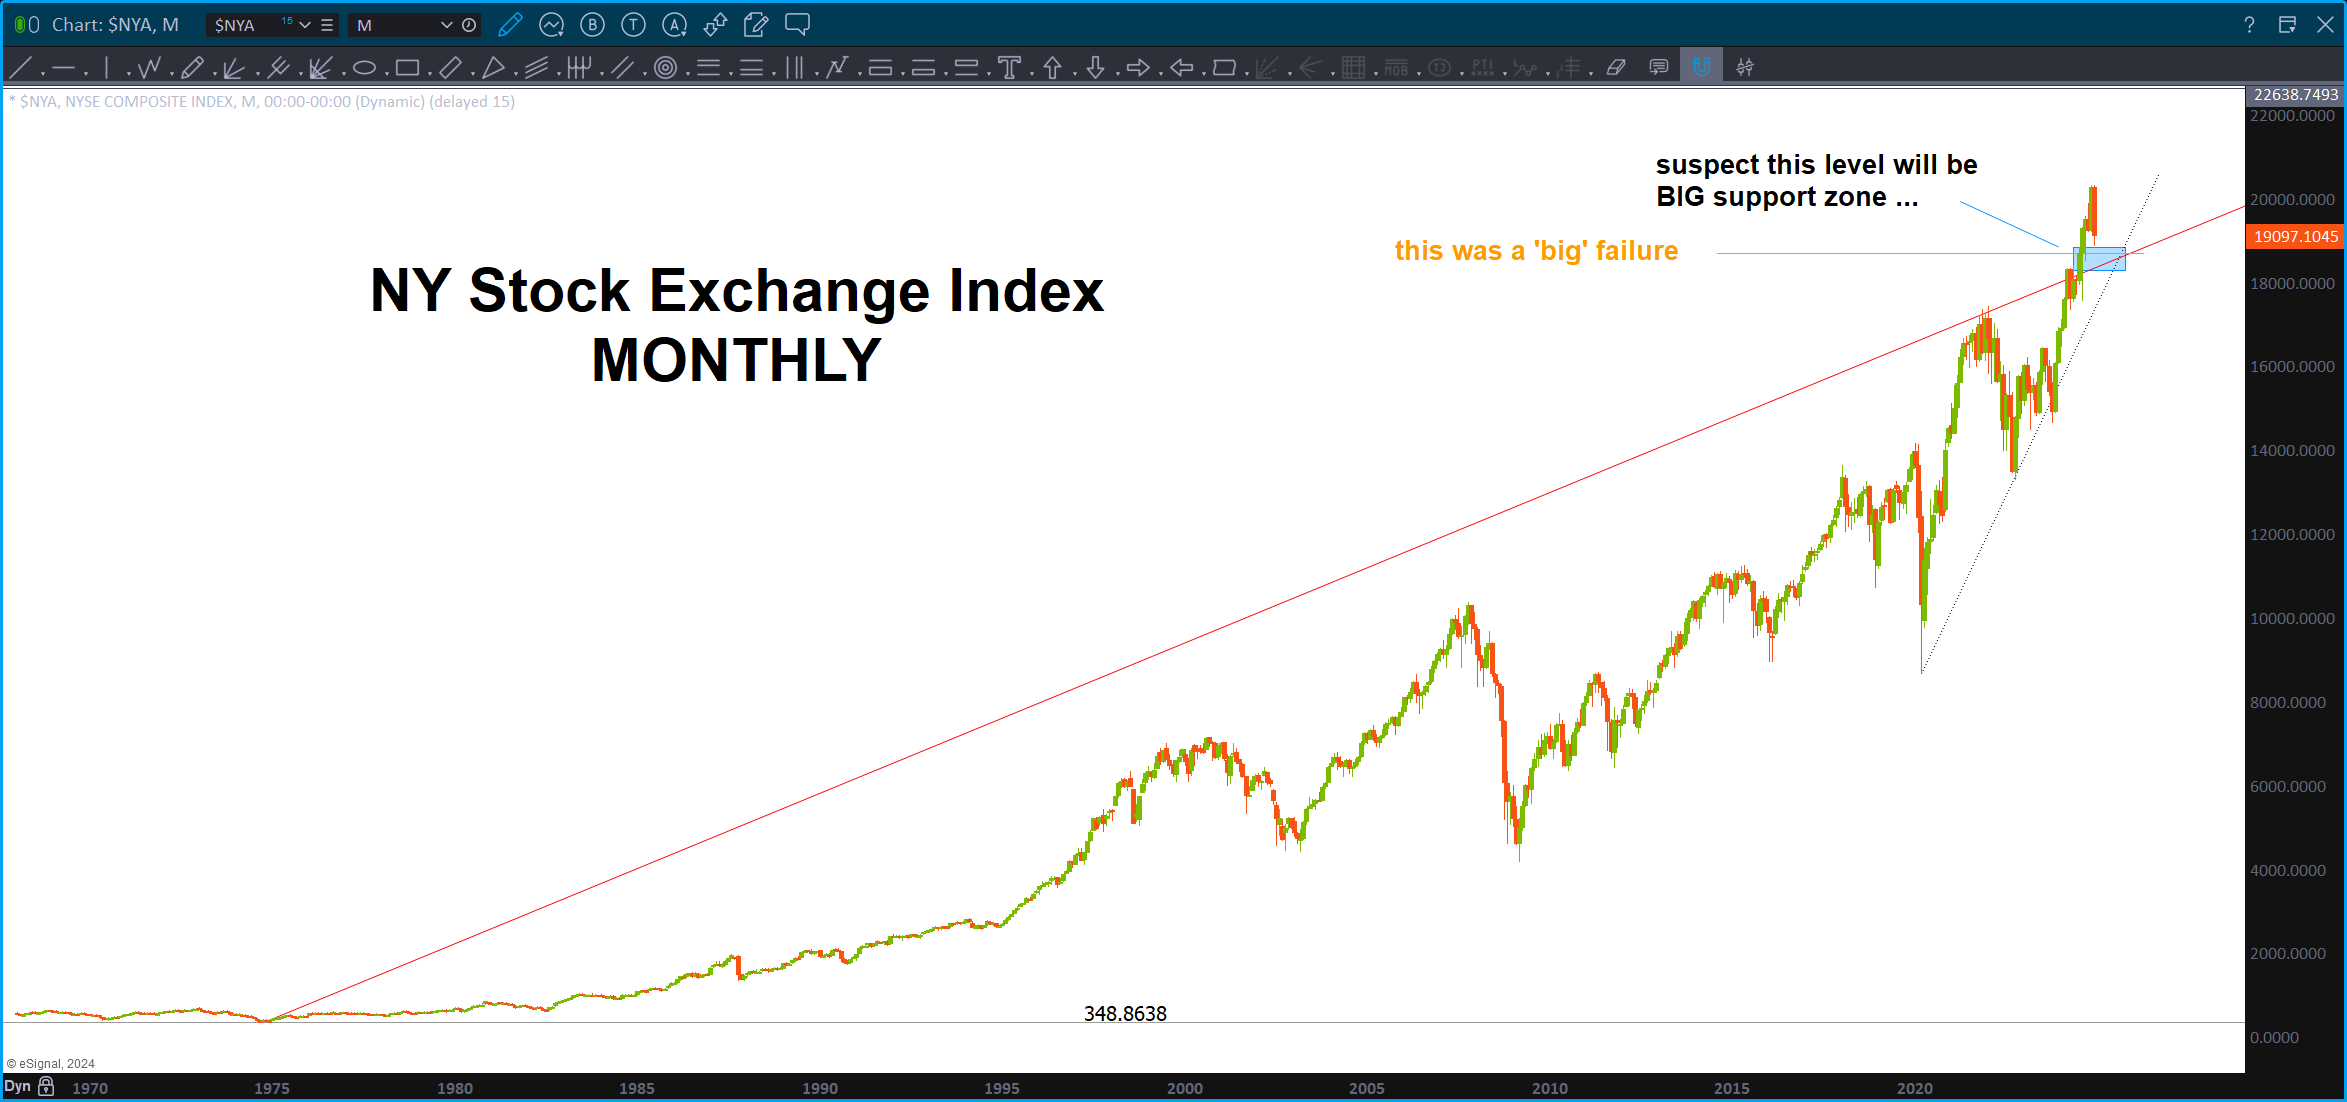
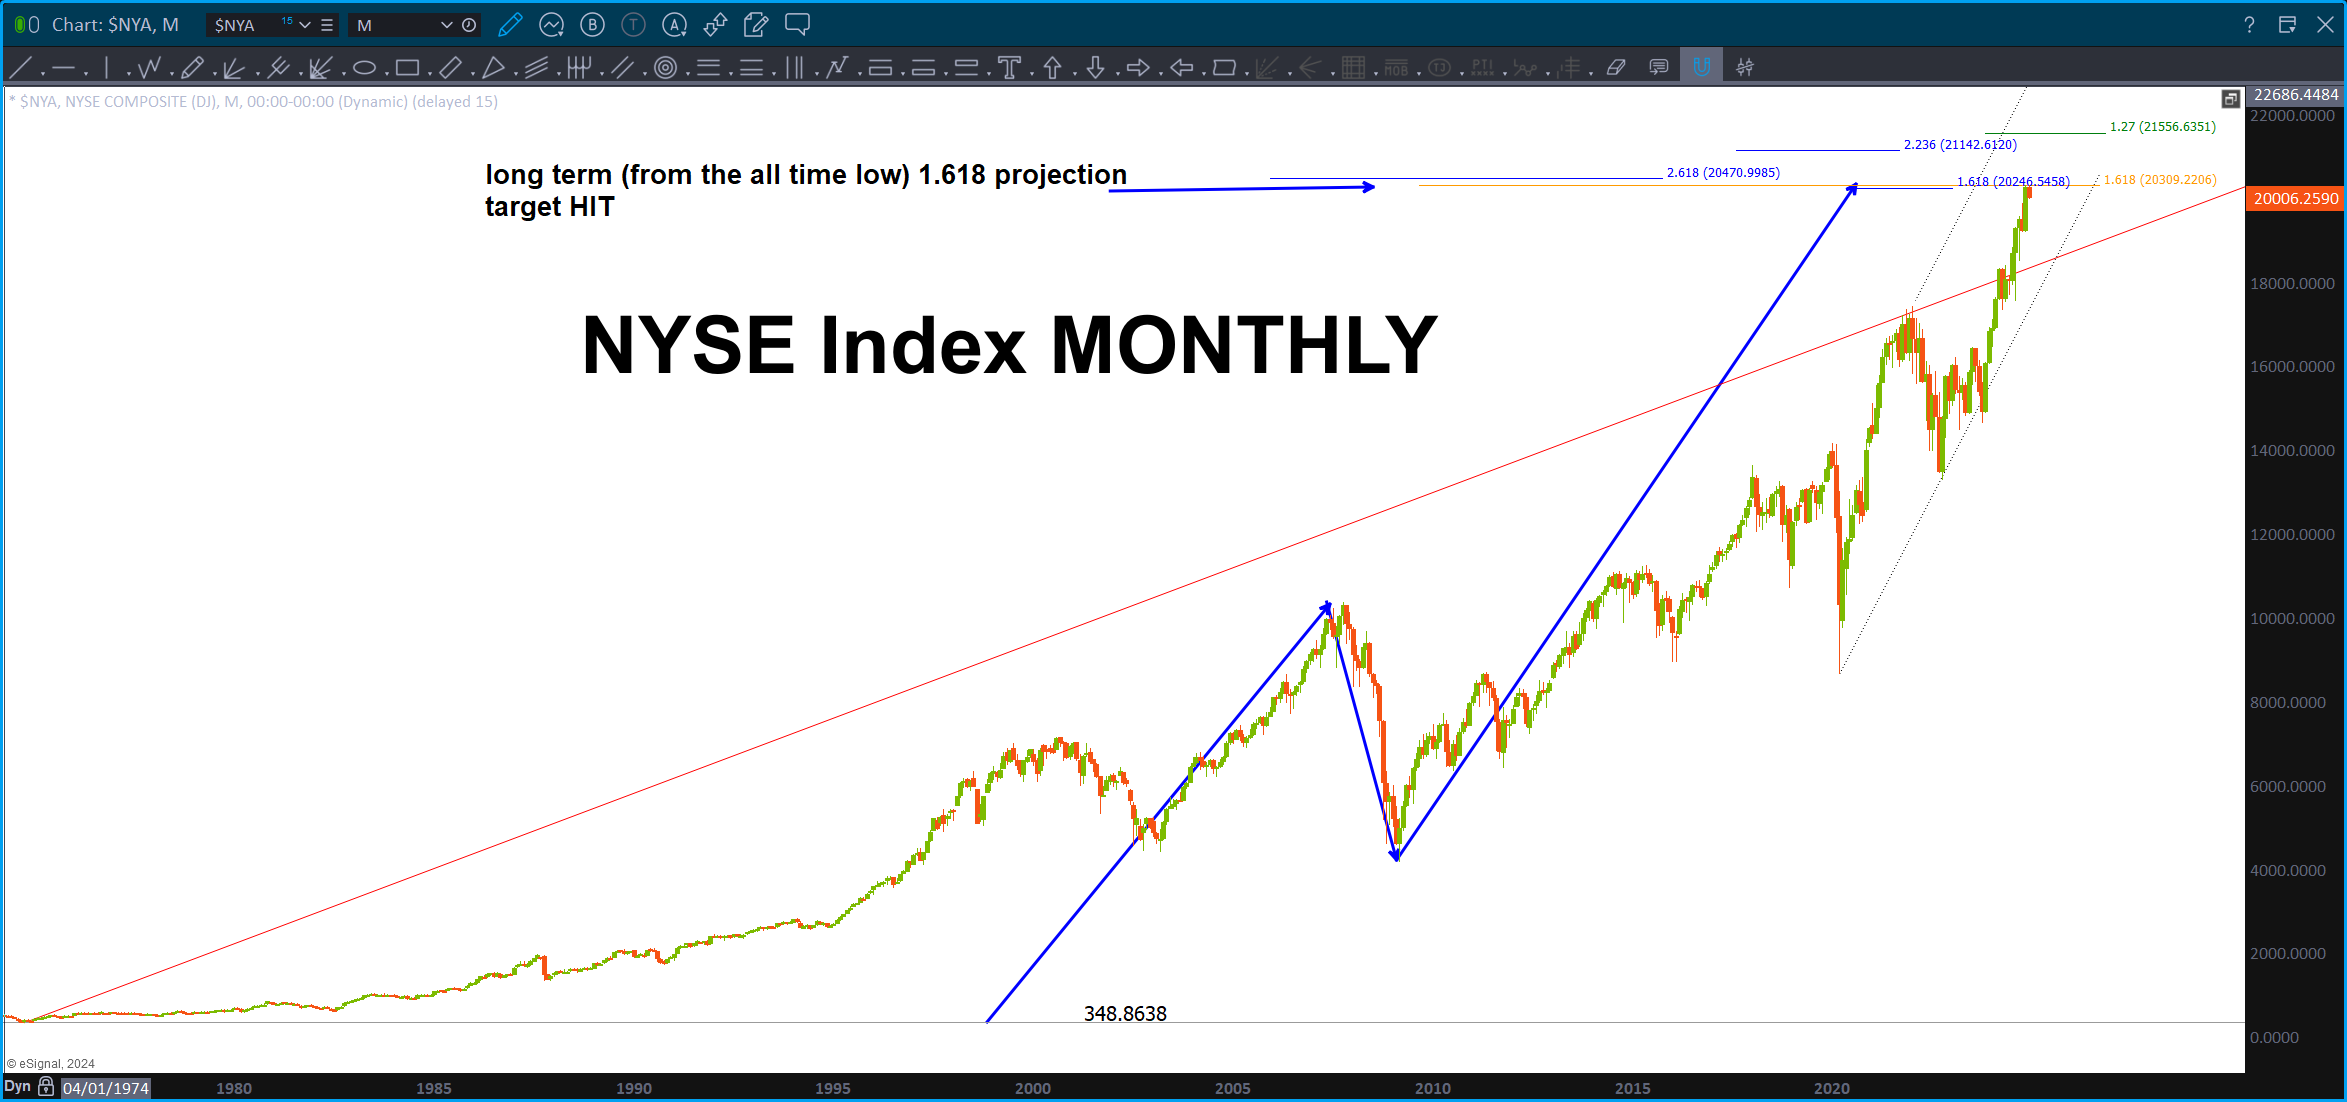
NYSE Index finally hit a long term target and, for now, appears to be reacting downward as expected resistance. Again, who knows if this is the making of a big top or a much needed pullback, either way, keep an eye on it as it could accelerate to the downside. One of the things I’ve noticed is the YEN is still not as strong as I thought it “should” be and, therefore, the equity has held up or even continued to advance higher …
NYSE Index has a VERY important support zone ID’d … let’s see what happens there. The red line is THE (CAPS FOR EMPHASIS) 1×1 trendline that it simply smoked (I was surprised at that one) so now, if POLARITY does work it ‘should’ offer a buy opportunity or a zone / area of support.
If it does not hold and it slices thru it … then I might go back and make sure I have the right trend line!
Have a GREAT New Year in 2025.
Bart
AMD – December 23, 2024
Posted on December 23, 2024 Leave a Comment

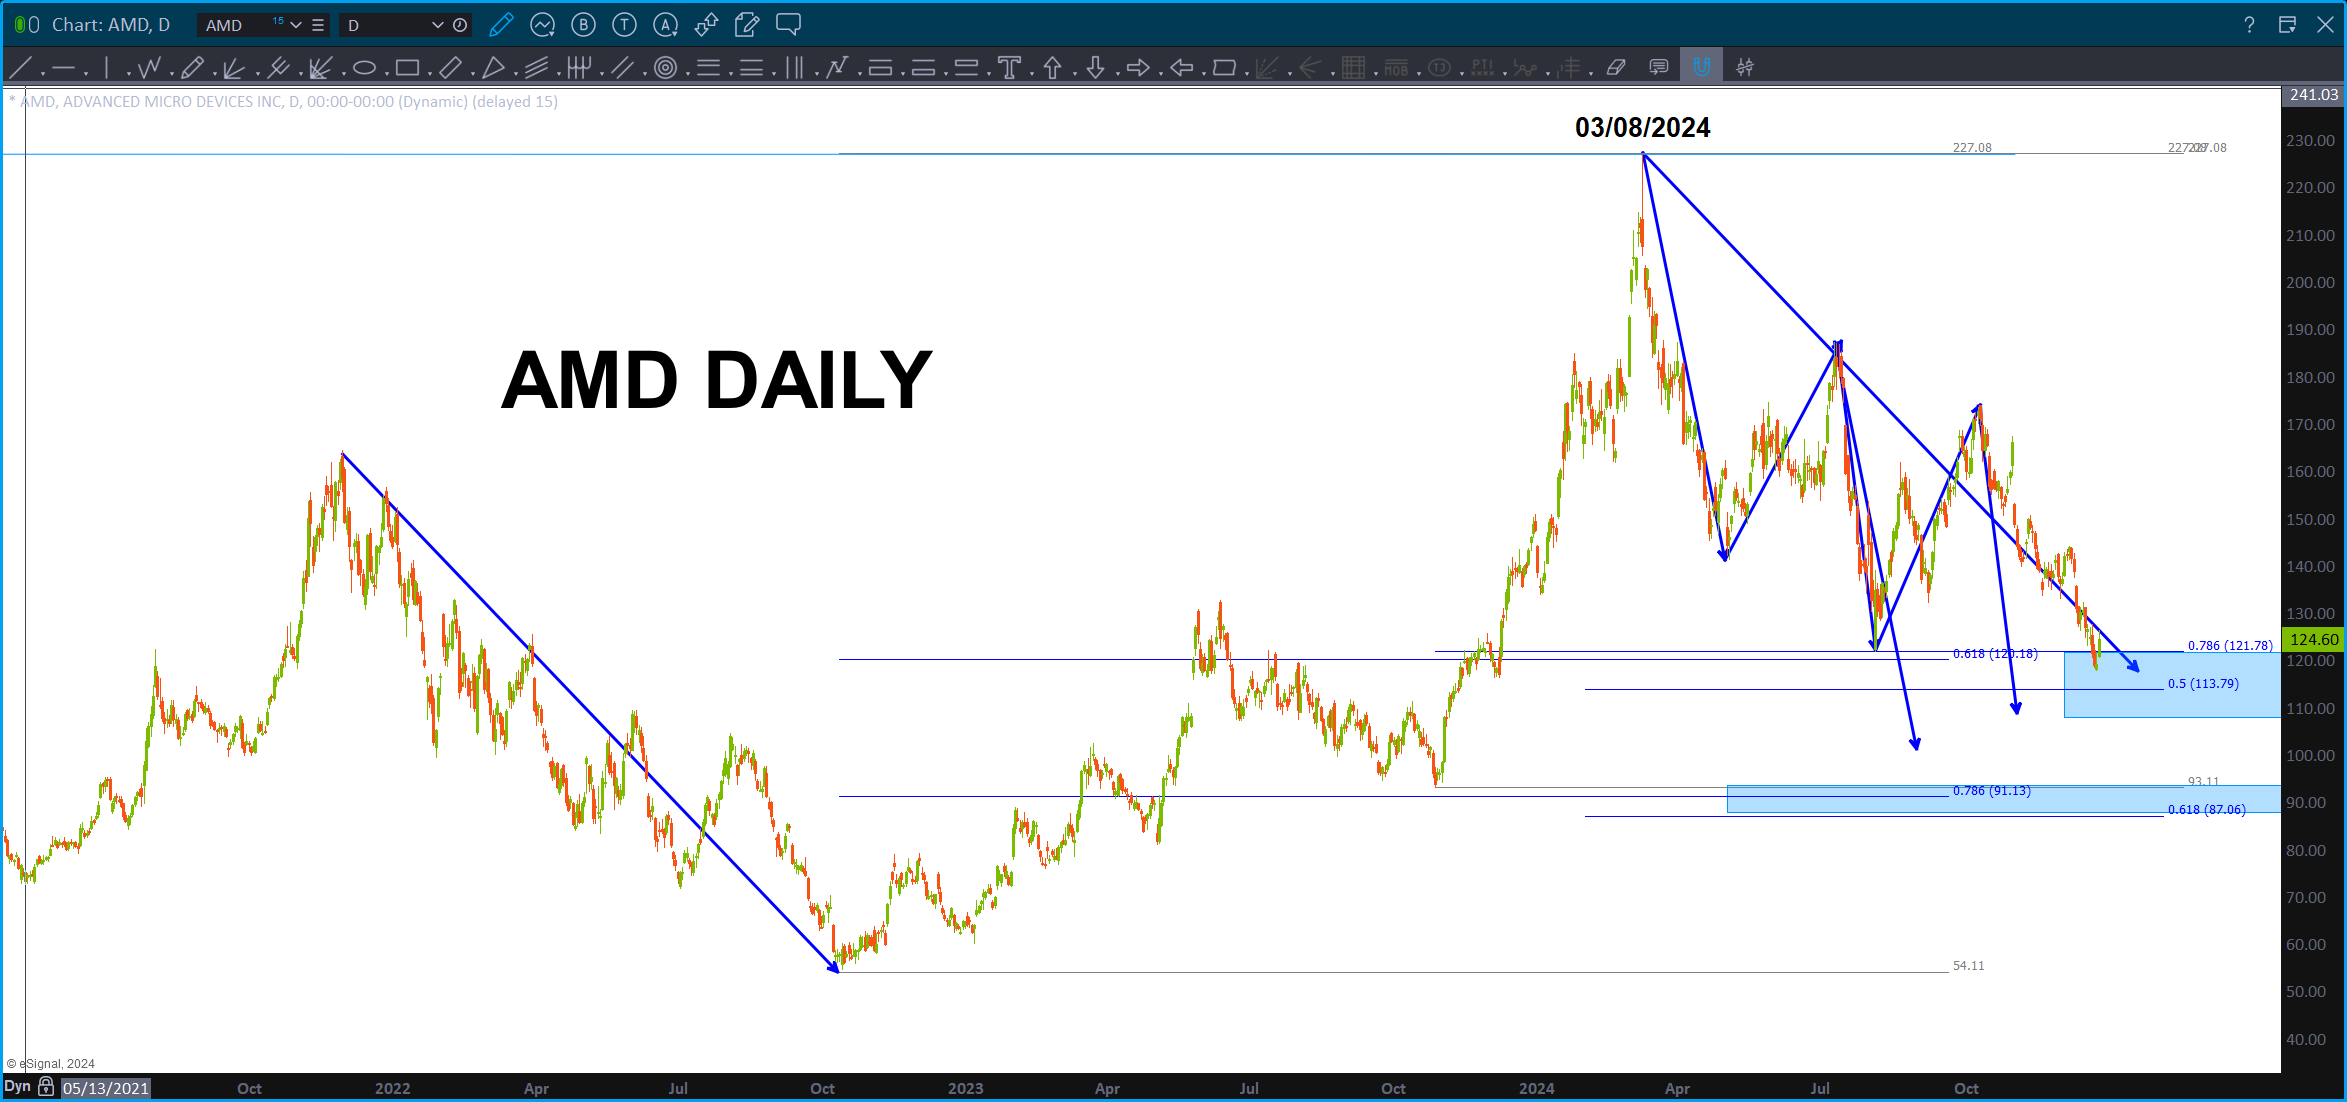
Was asked by a great friend and money manager about the 3 drives to a bottom on AMD.
While, at first glance, it does appear to be setting up for a 3 drives (key – setting up) I don’t think it officially qualifies as a ‘perfect’ 3 drive pattern – that’s just me.
What I do like is a NICE measured move correction into a confluence zone .. count is a little squirrly, if you ask me. I think (therefore I AM wrong .. :)) it looks like it wants another leg down …? In this environment I’m more cautious …
But, does look like a set up is coming … look forward to your thoughts.
UNH – December 19, 2024
Posted on December 19, 2024 Leave a Comment

Last post on UNH: https://atomic-temporary-44460632.wpcomstaging.com/2023/07/12/unh-united-health-care-july-12-2023/
Thanks for the ping Vick … a long time subscriber popped a note about UNH.
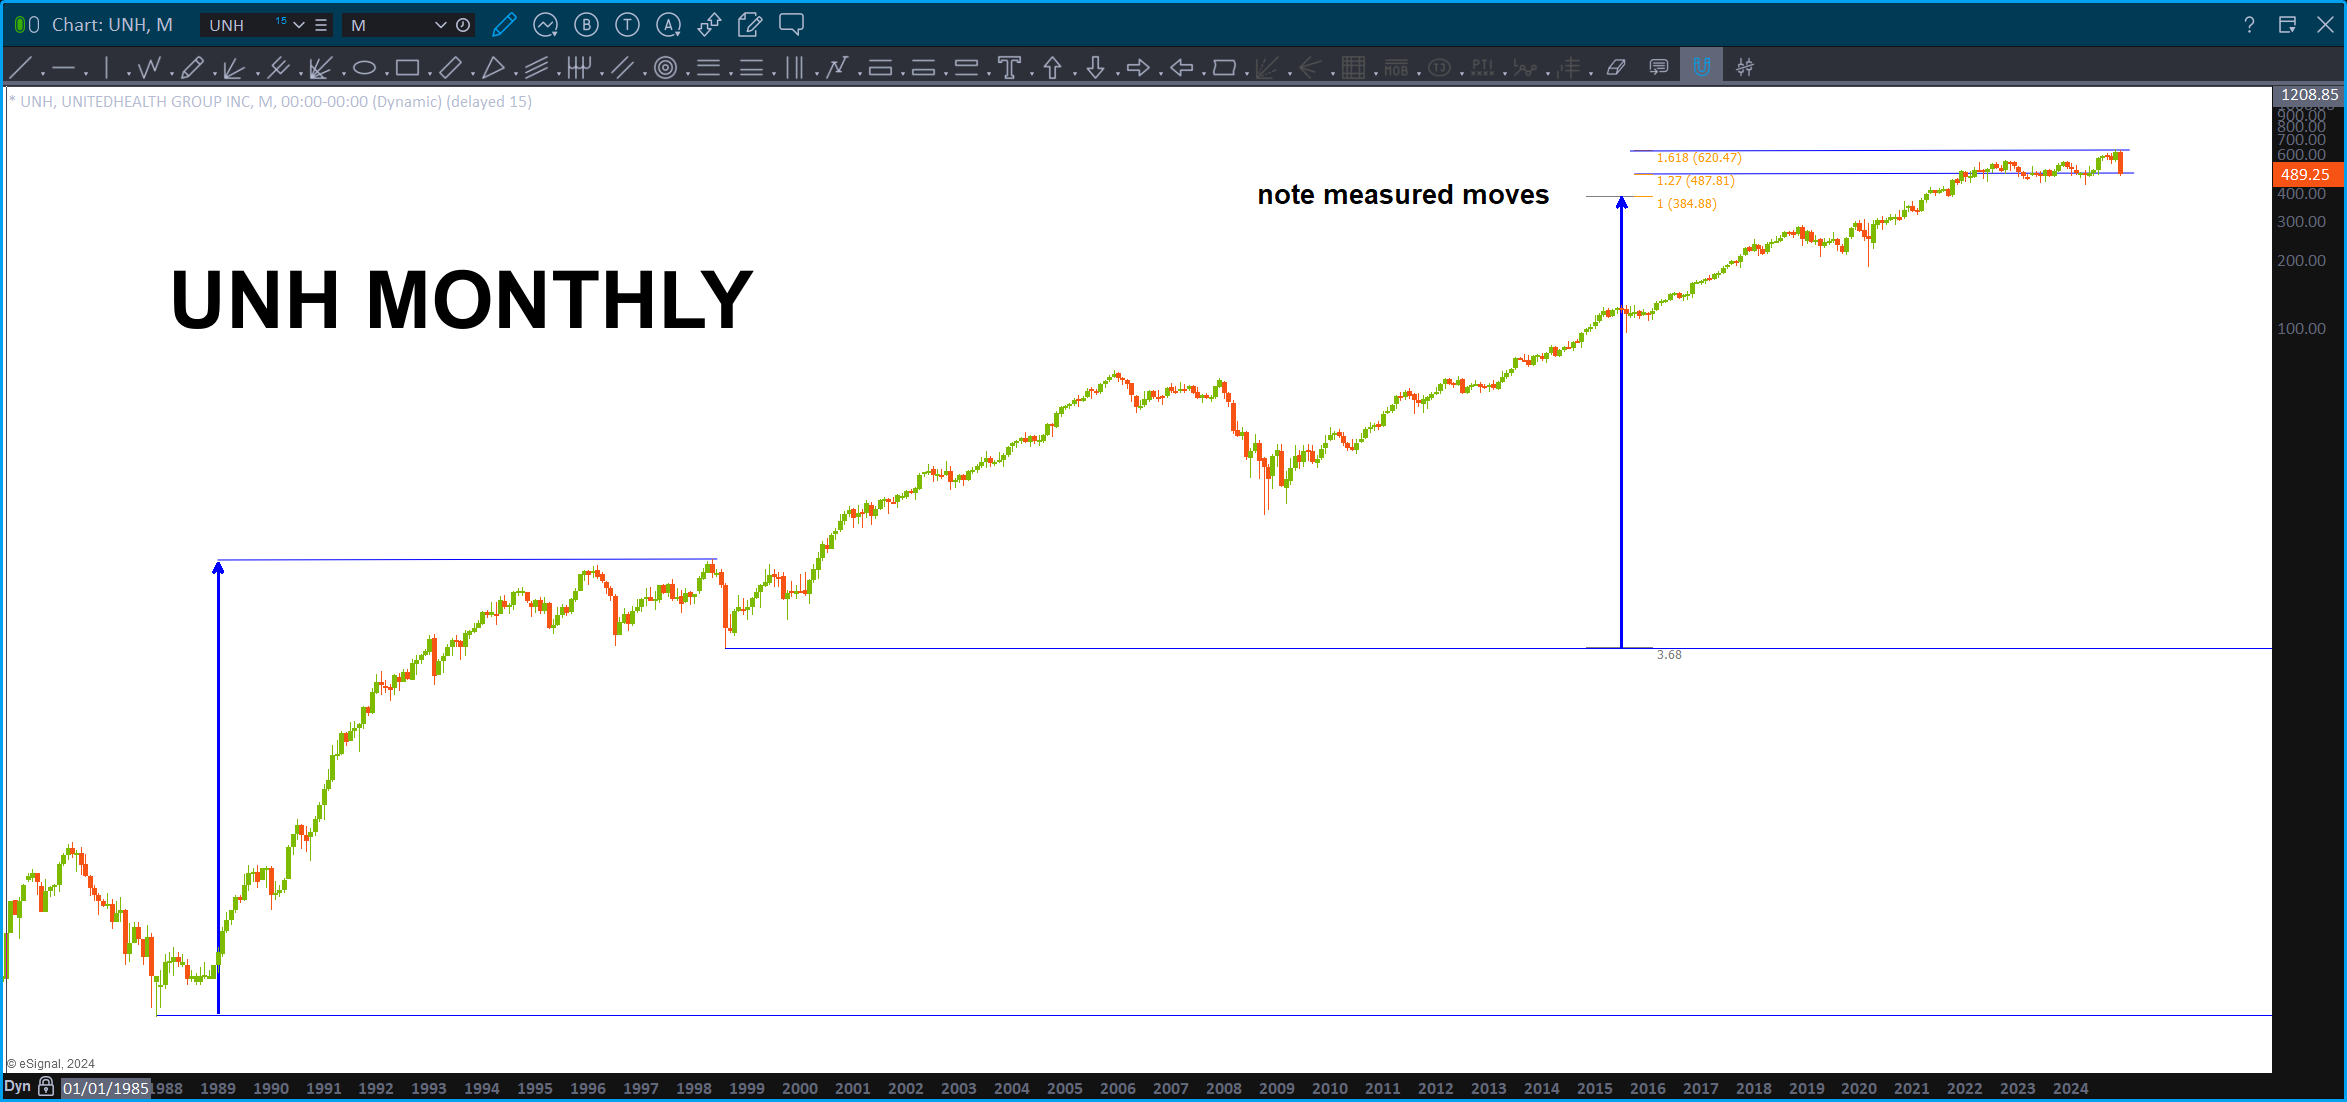
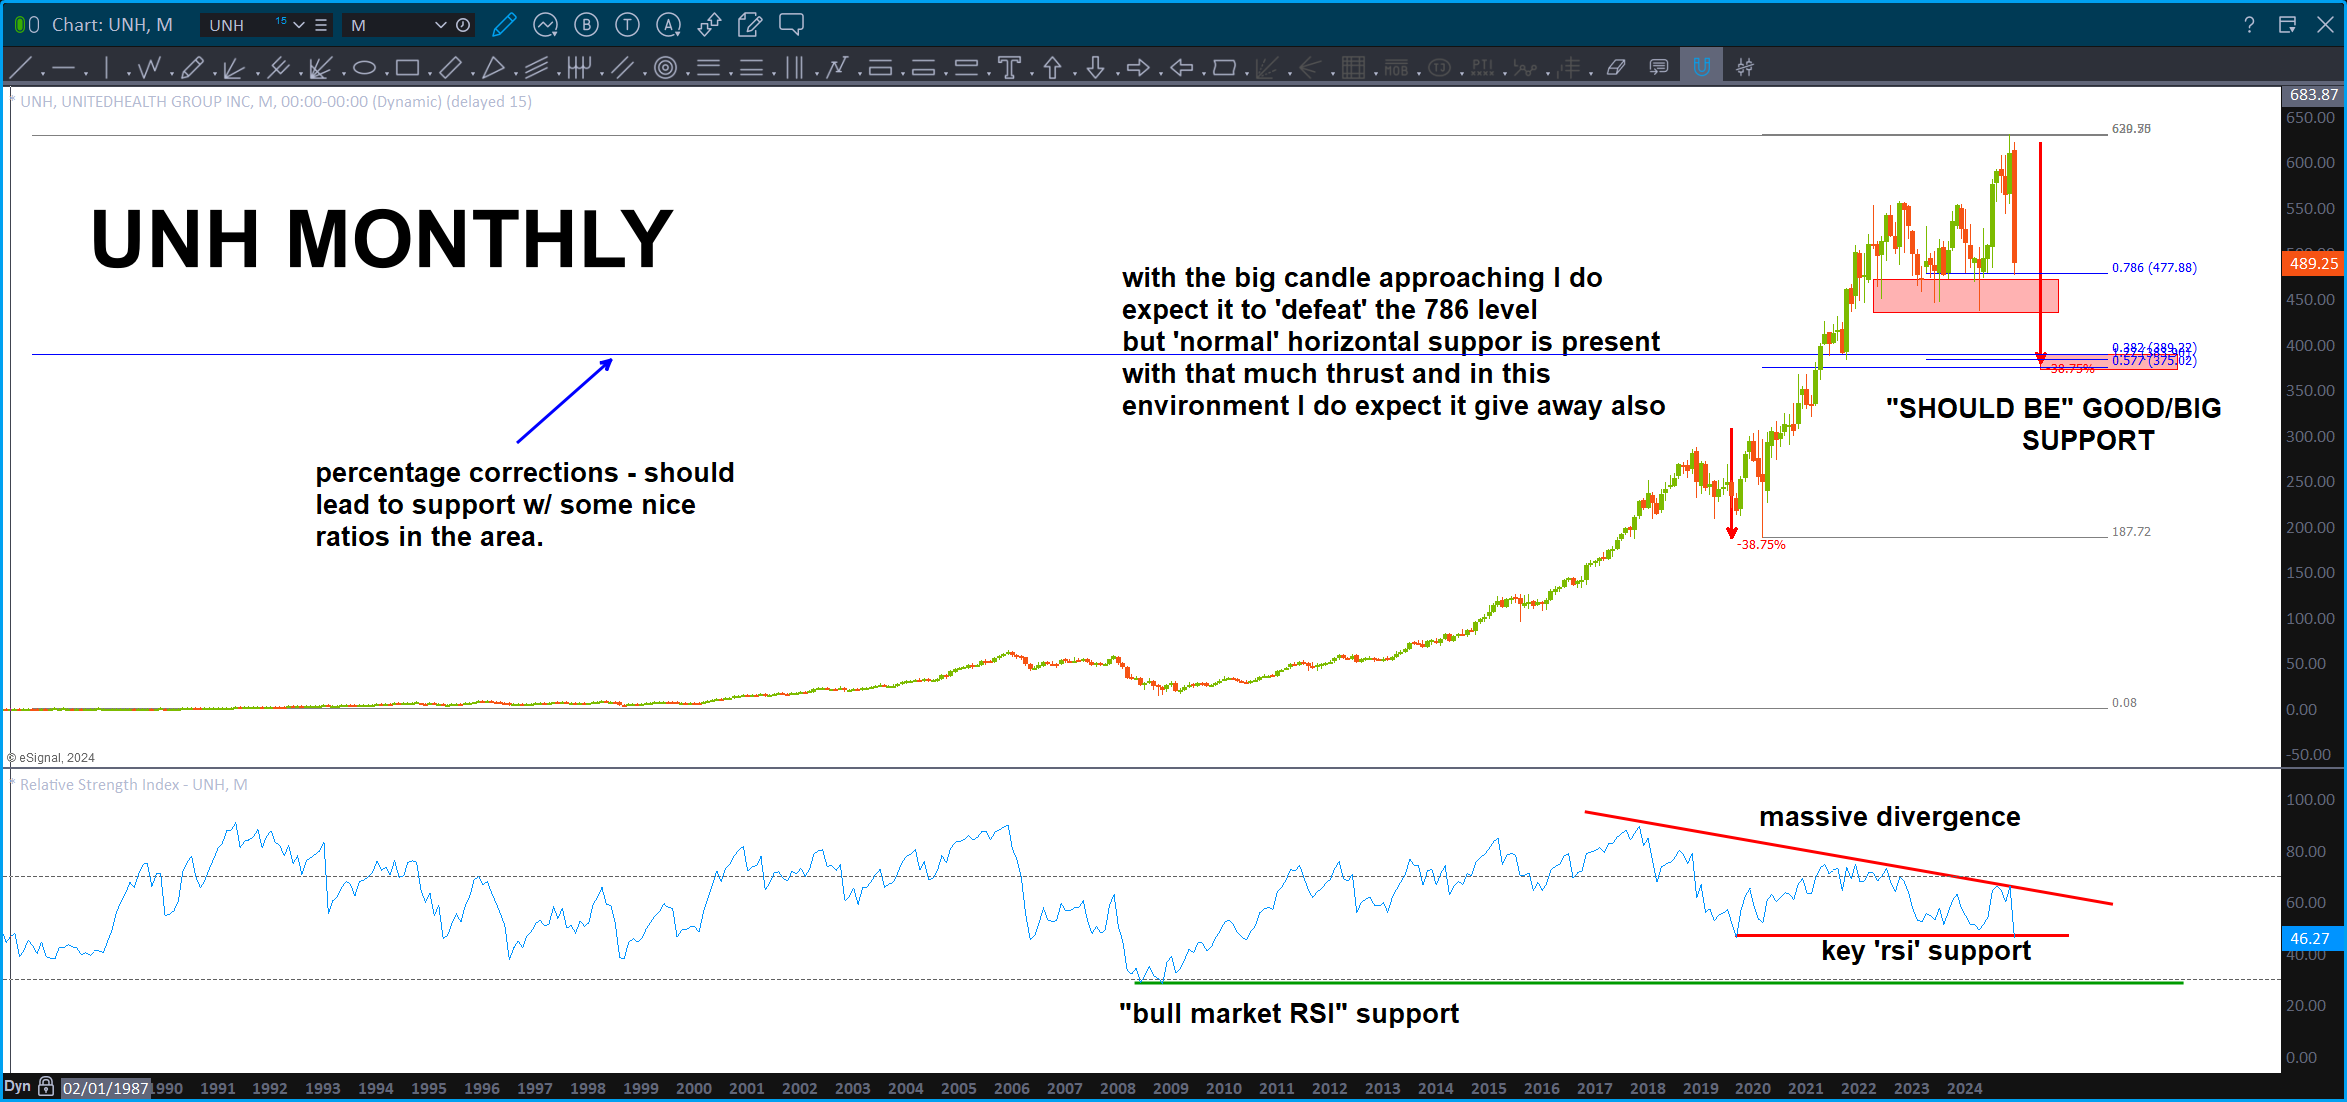
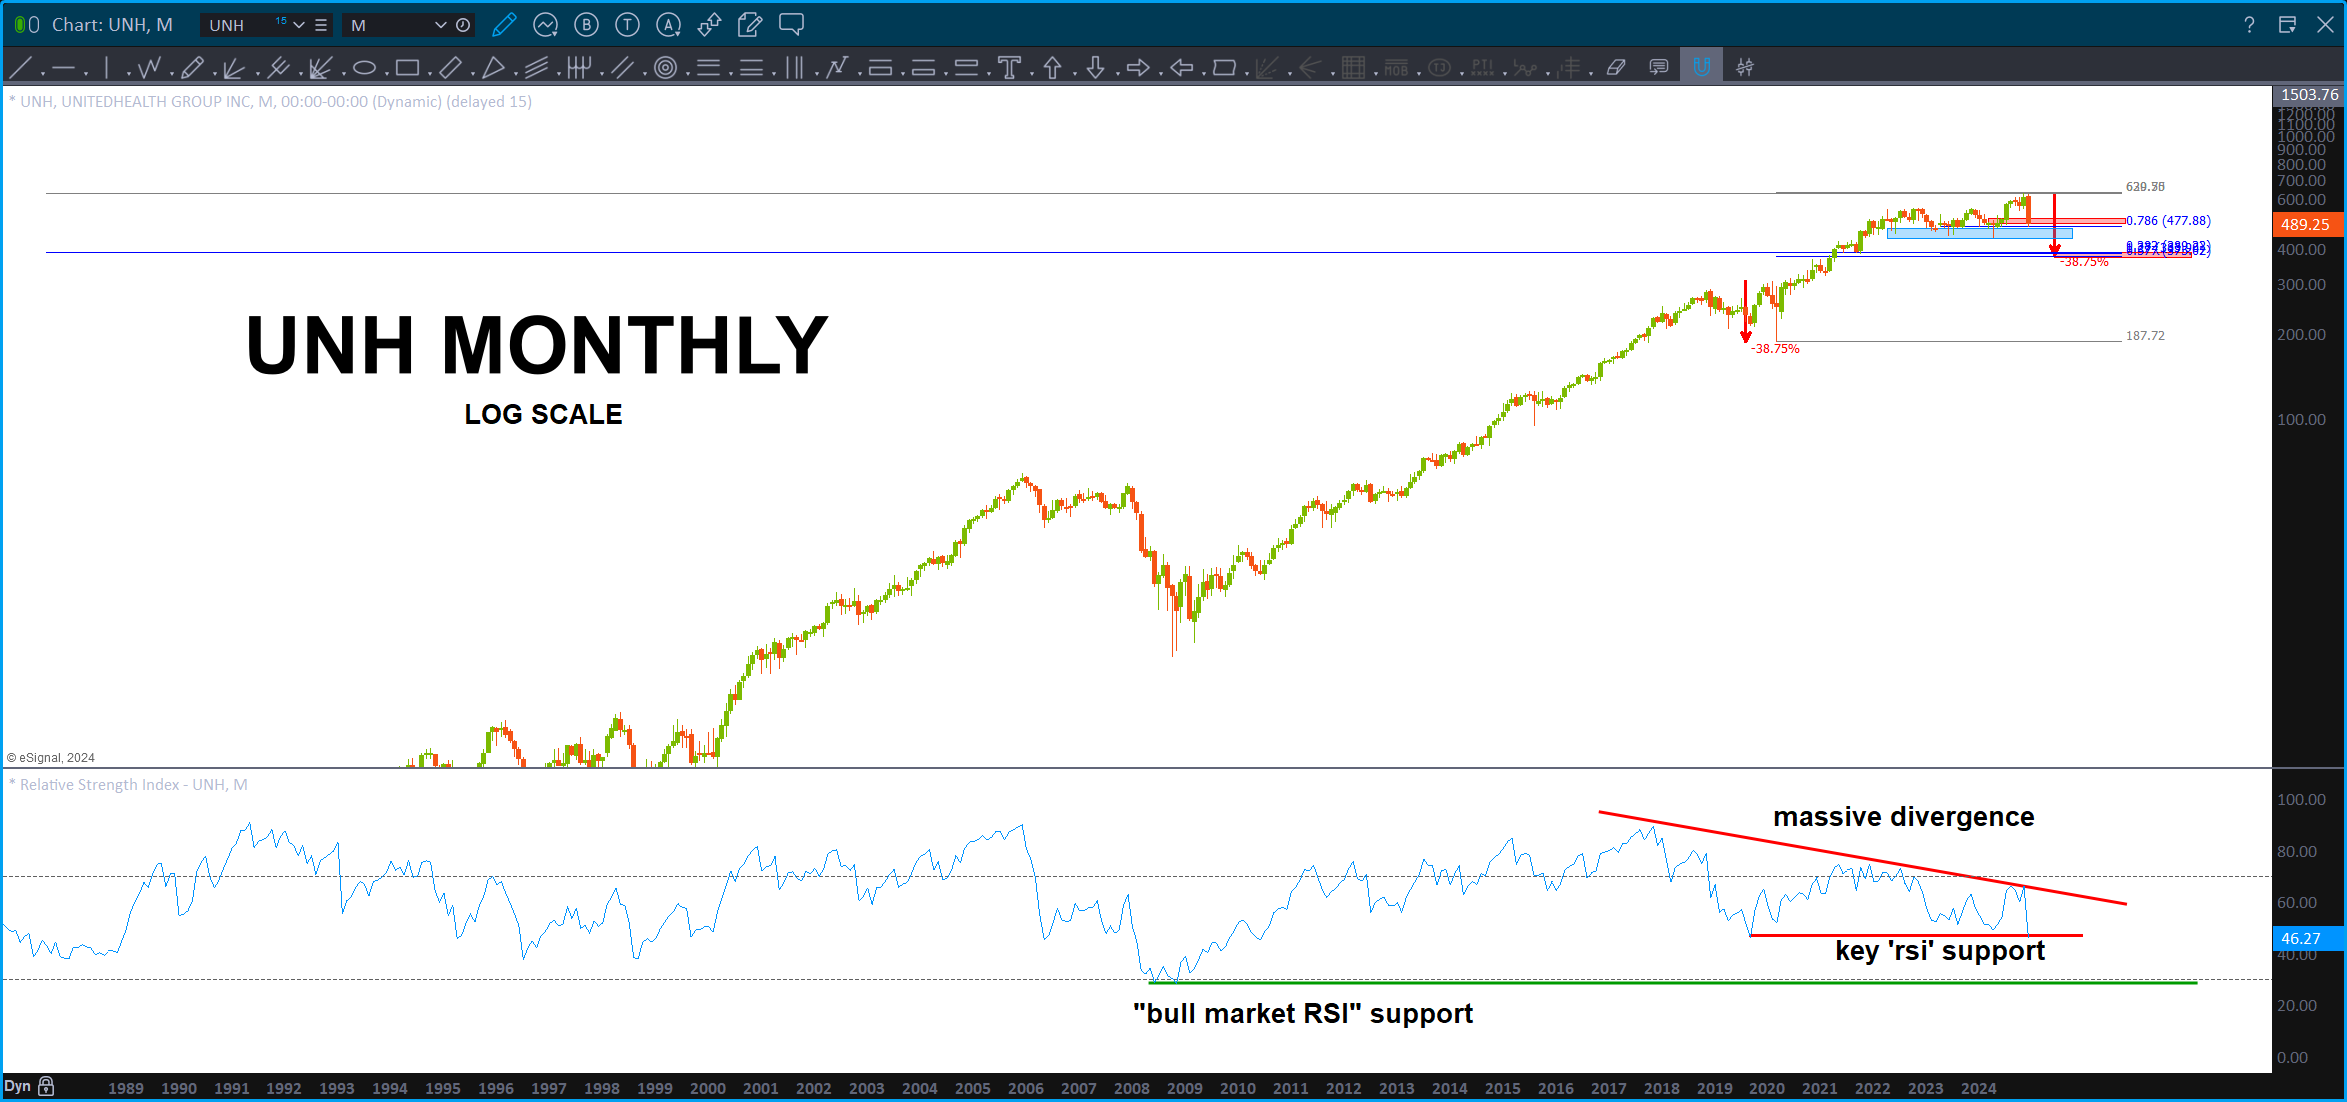
Charts below will show what appears to be a pretty broken stock. That being said, a pretty good level around the .382 percent level ‘should’ present support.
Last, take a peak at the first chart – I had not remembered using the percentage measured moves so I was messing around and 1.27 and 1.618 are the percentage extensions CAUSING THE HIGH and the SUPPORT ZONE. So, I’m just asking … what the heck is going on here … 😉
Bart
Markets – December 17, 2024
Posted on December 17, 2024 2 Comments

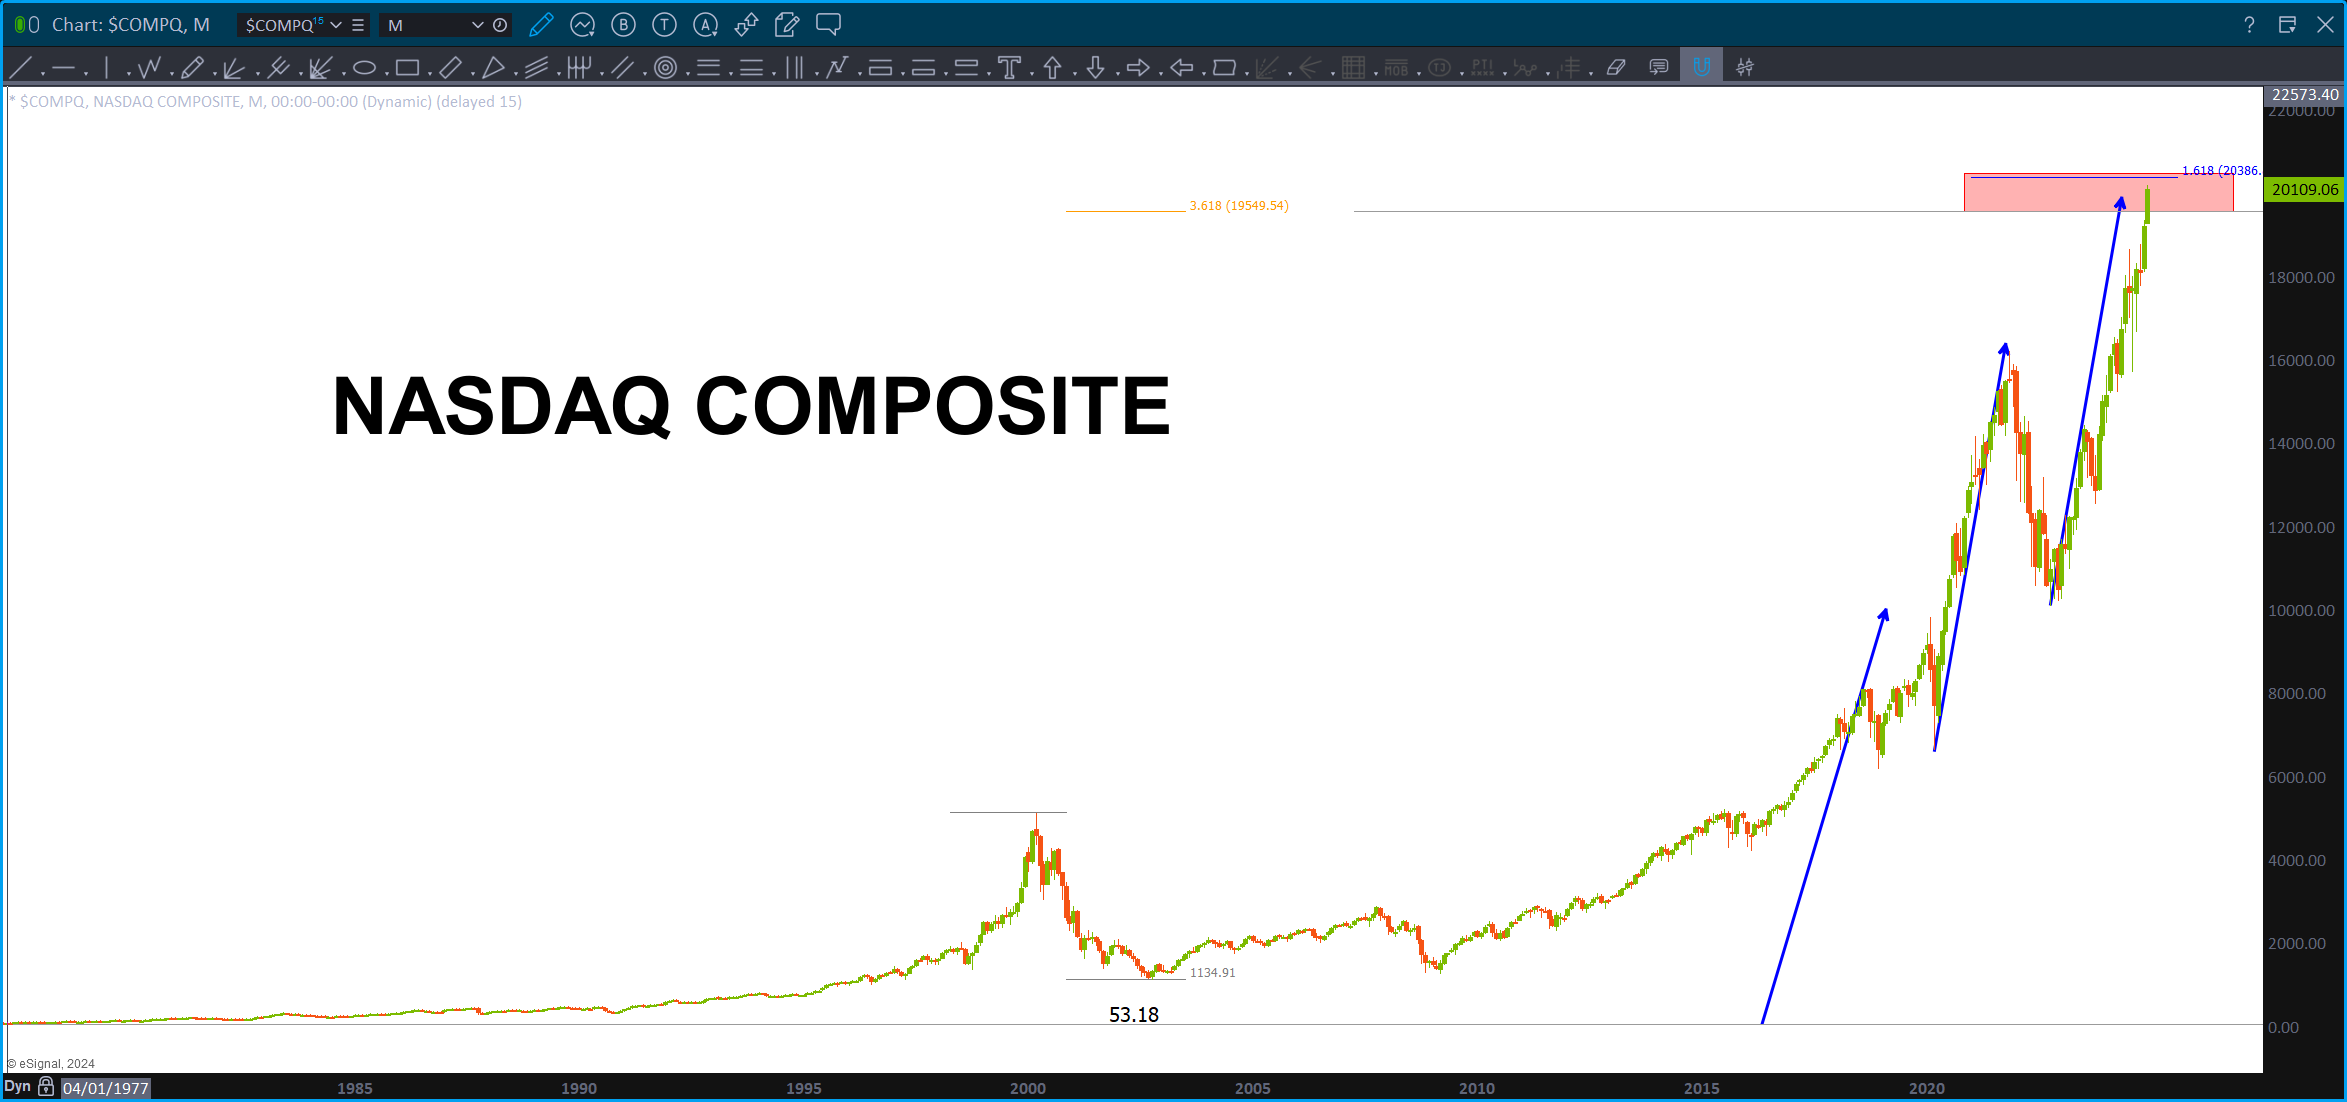
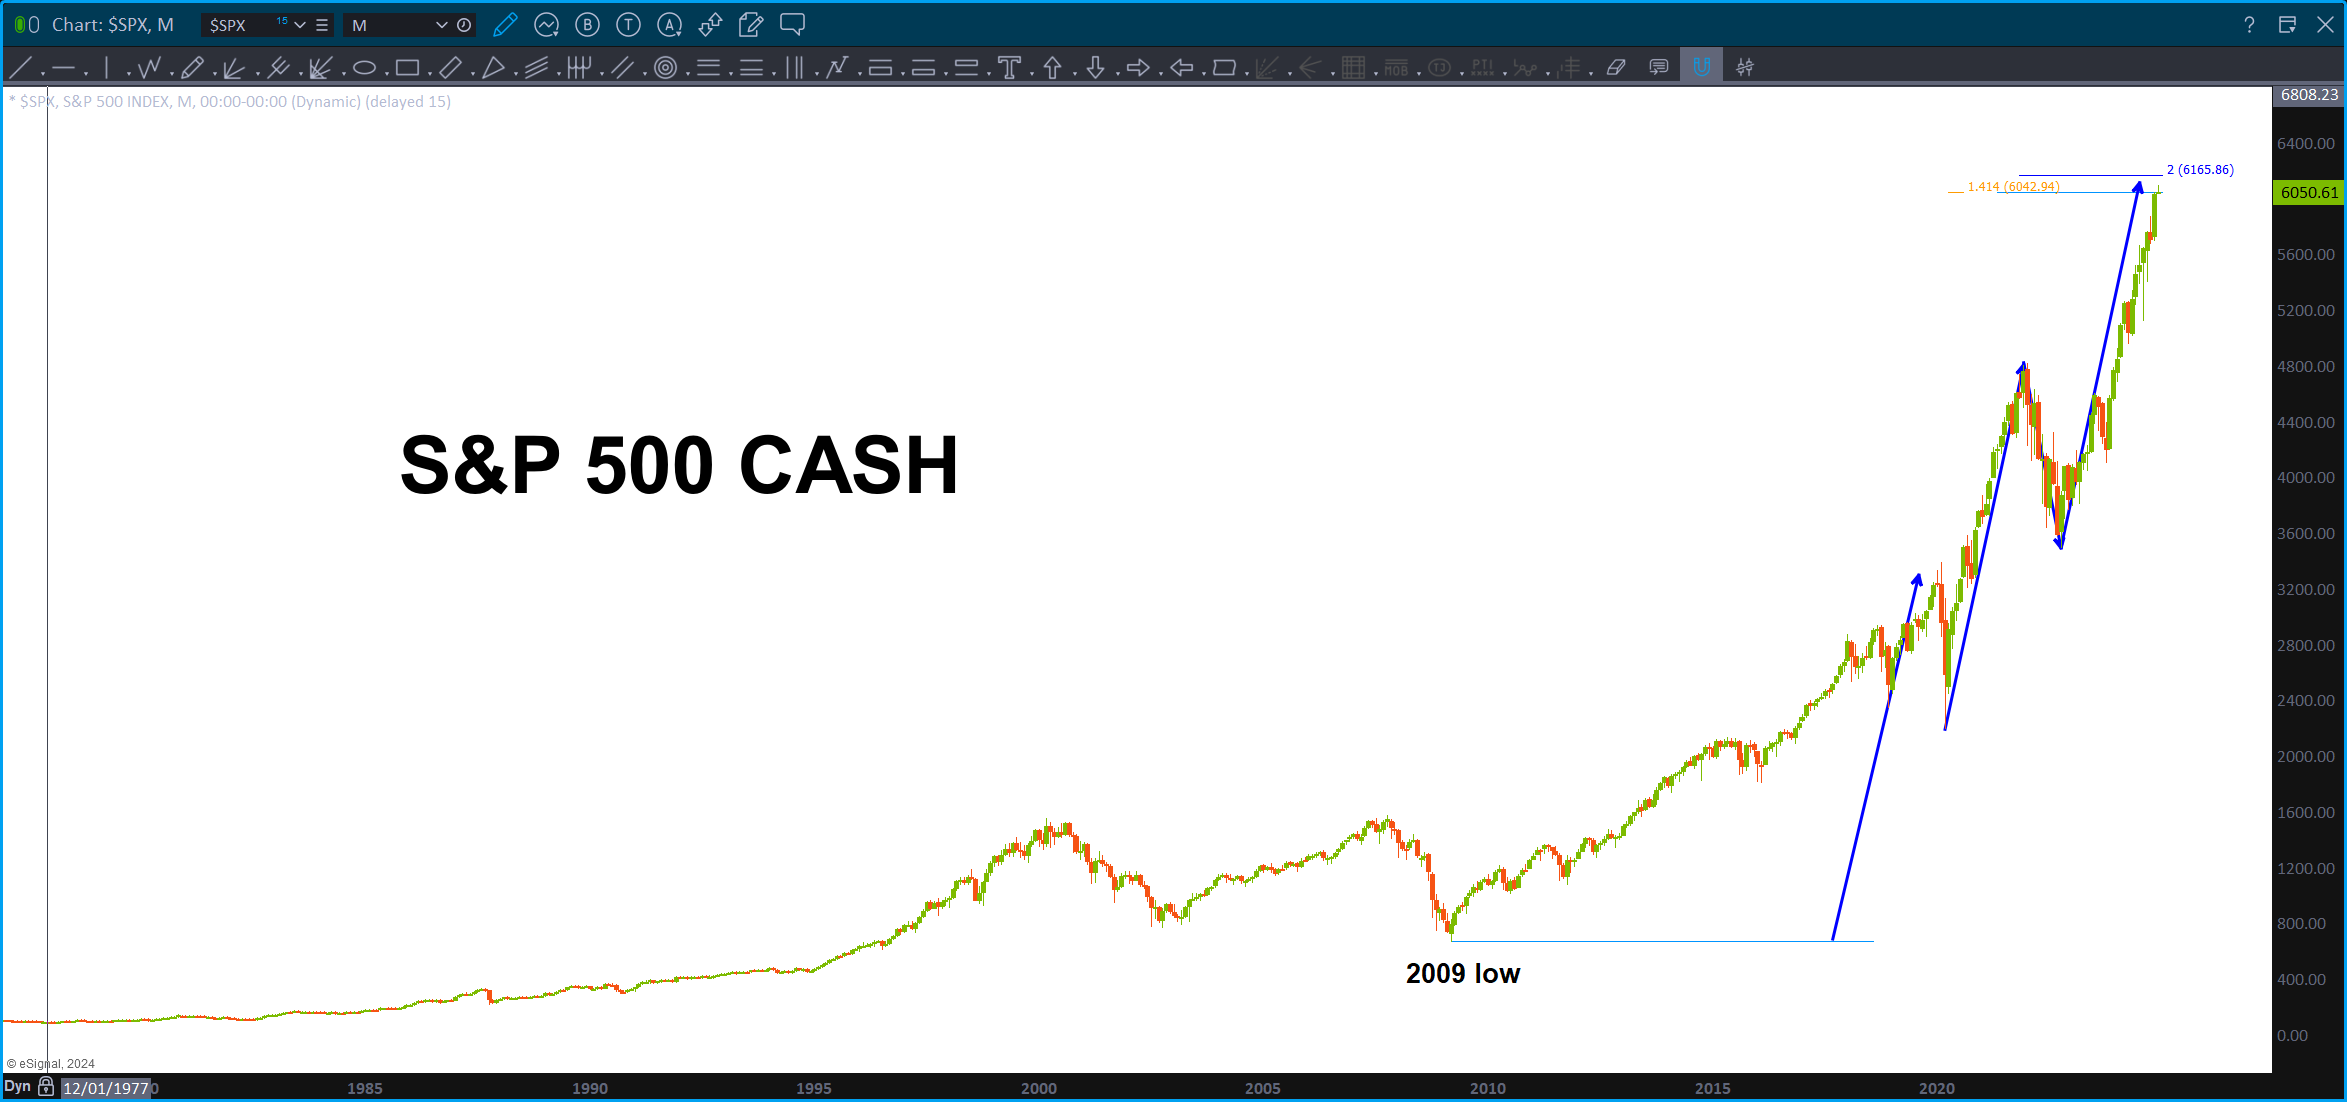
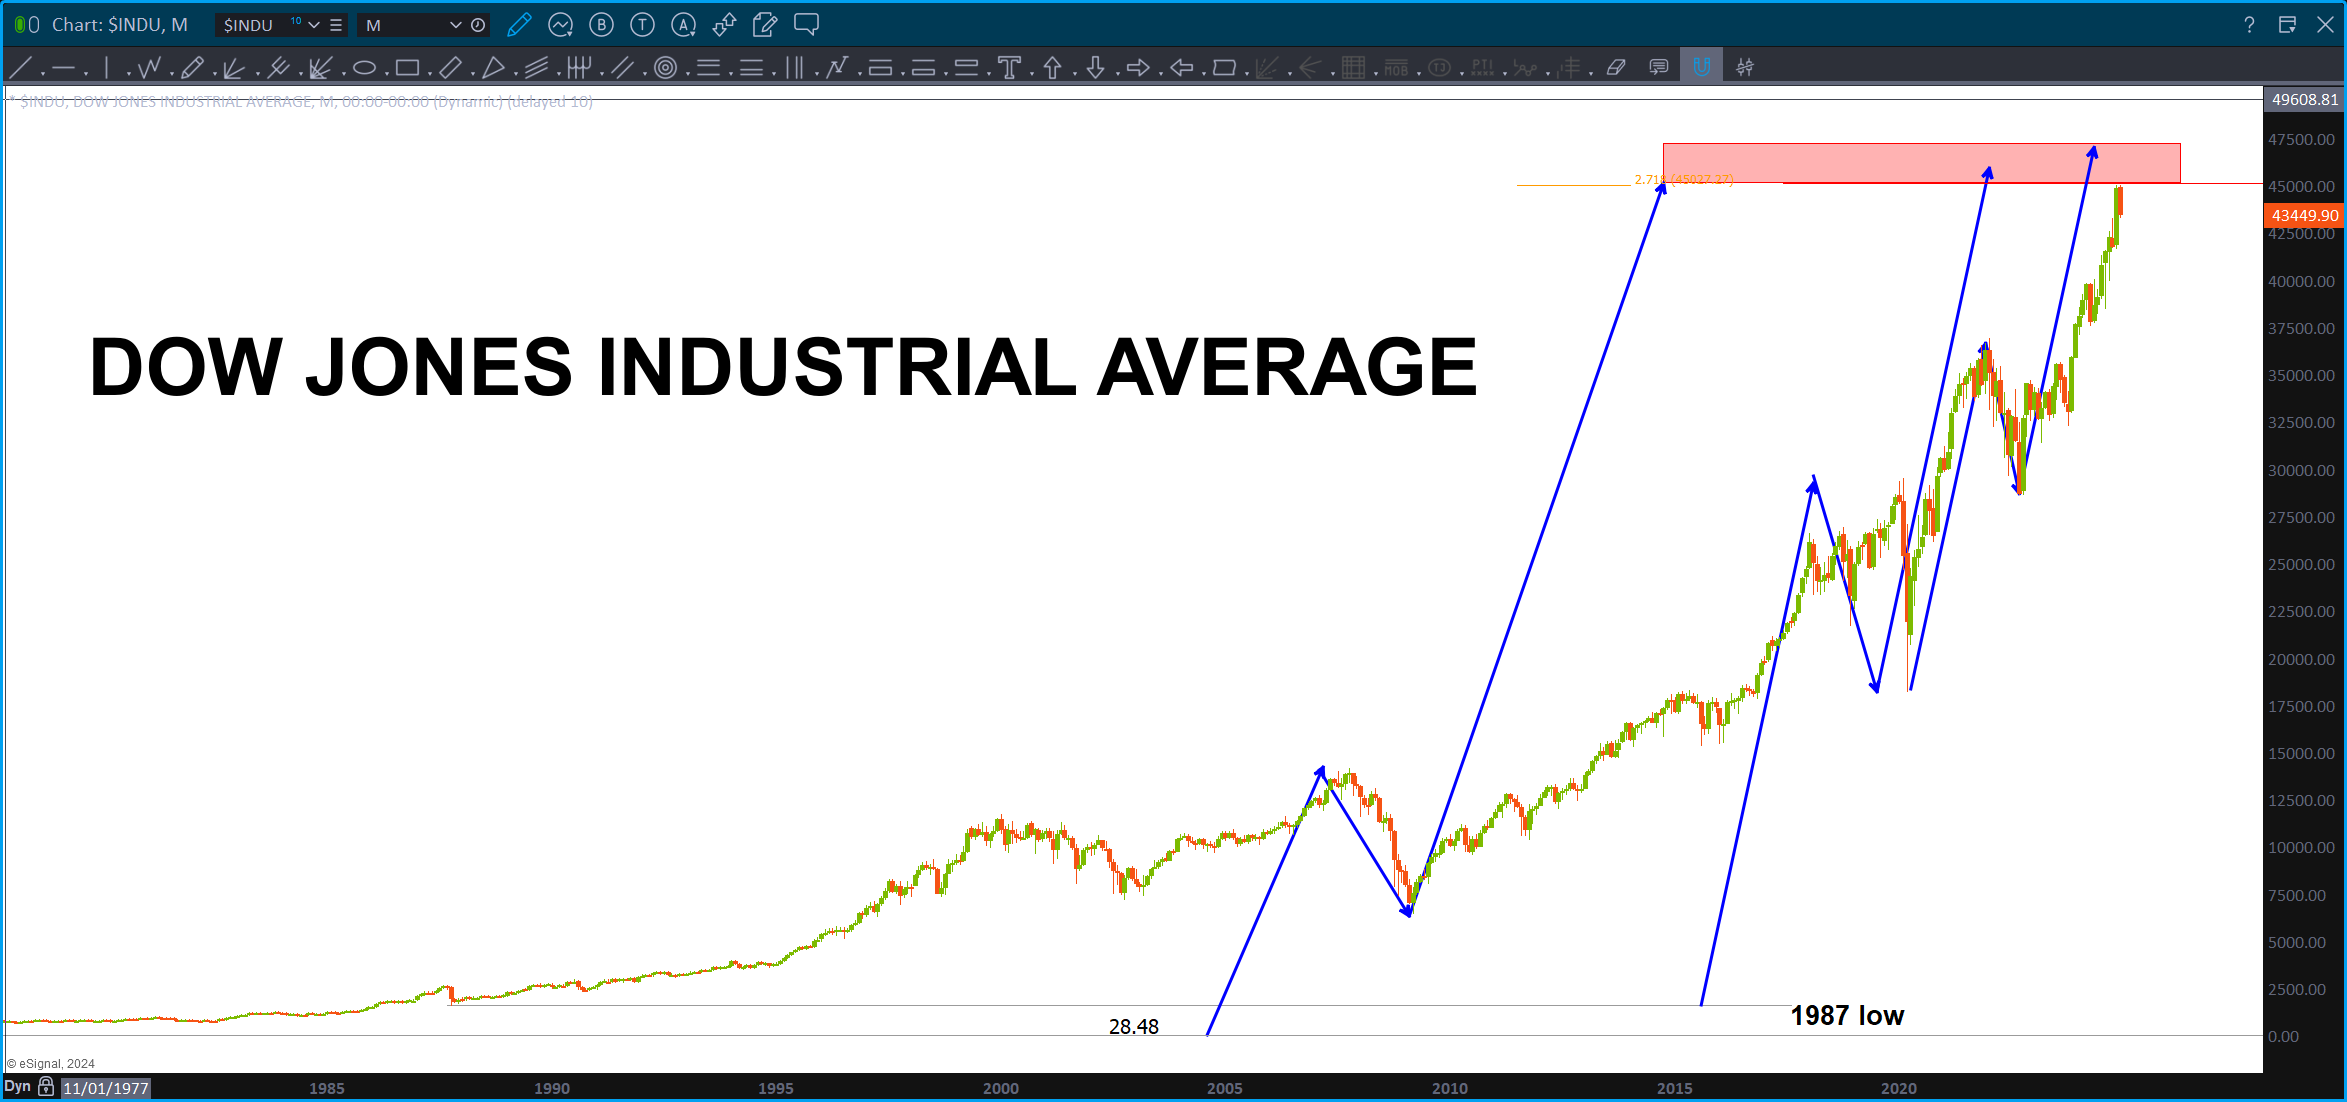
Folks, next set of targets, across the board, are here … the prior pattern targets all failed so who knows what is going to happen next. It’s just patterns folks.
CAUTION certainly warranted here …maybe take profits w/ a weekly/monthly signal reversal candle?
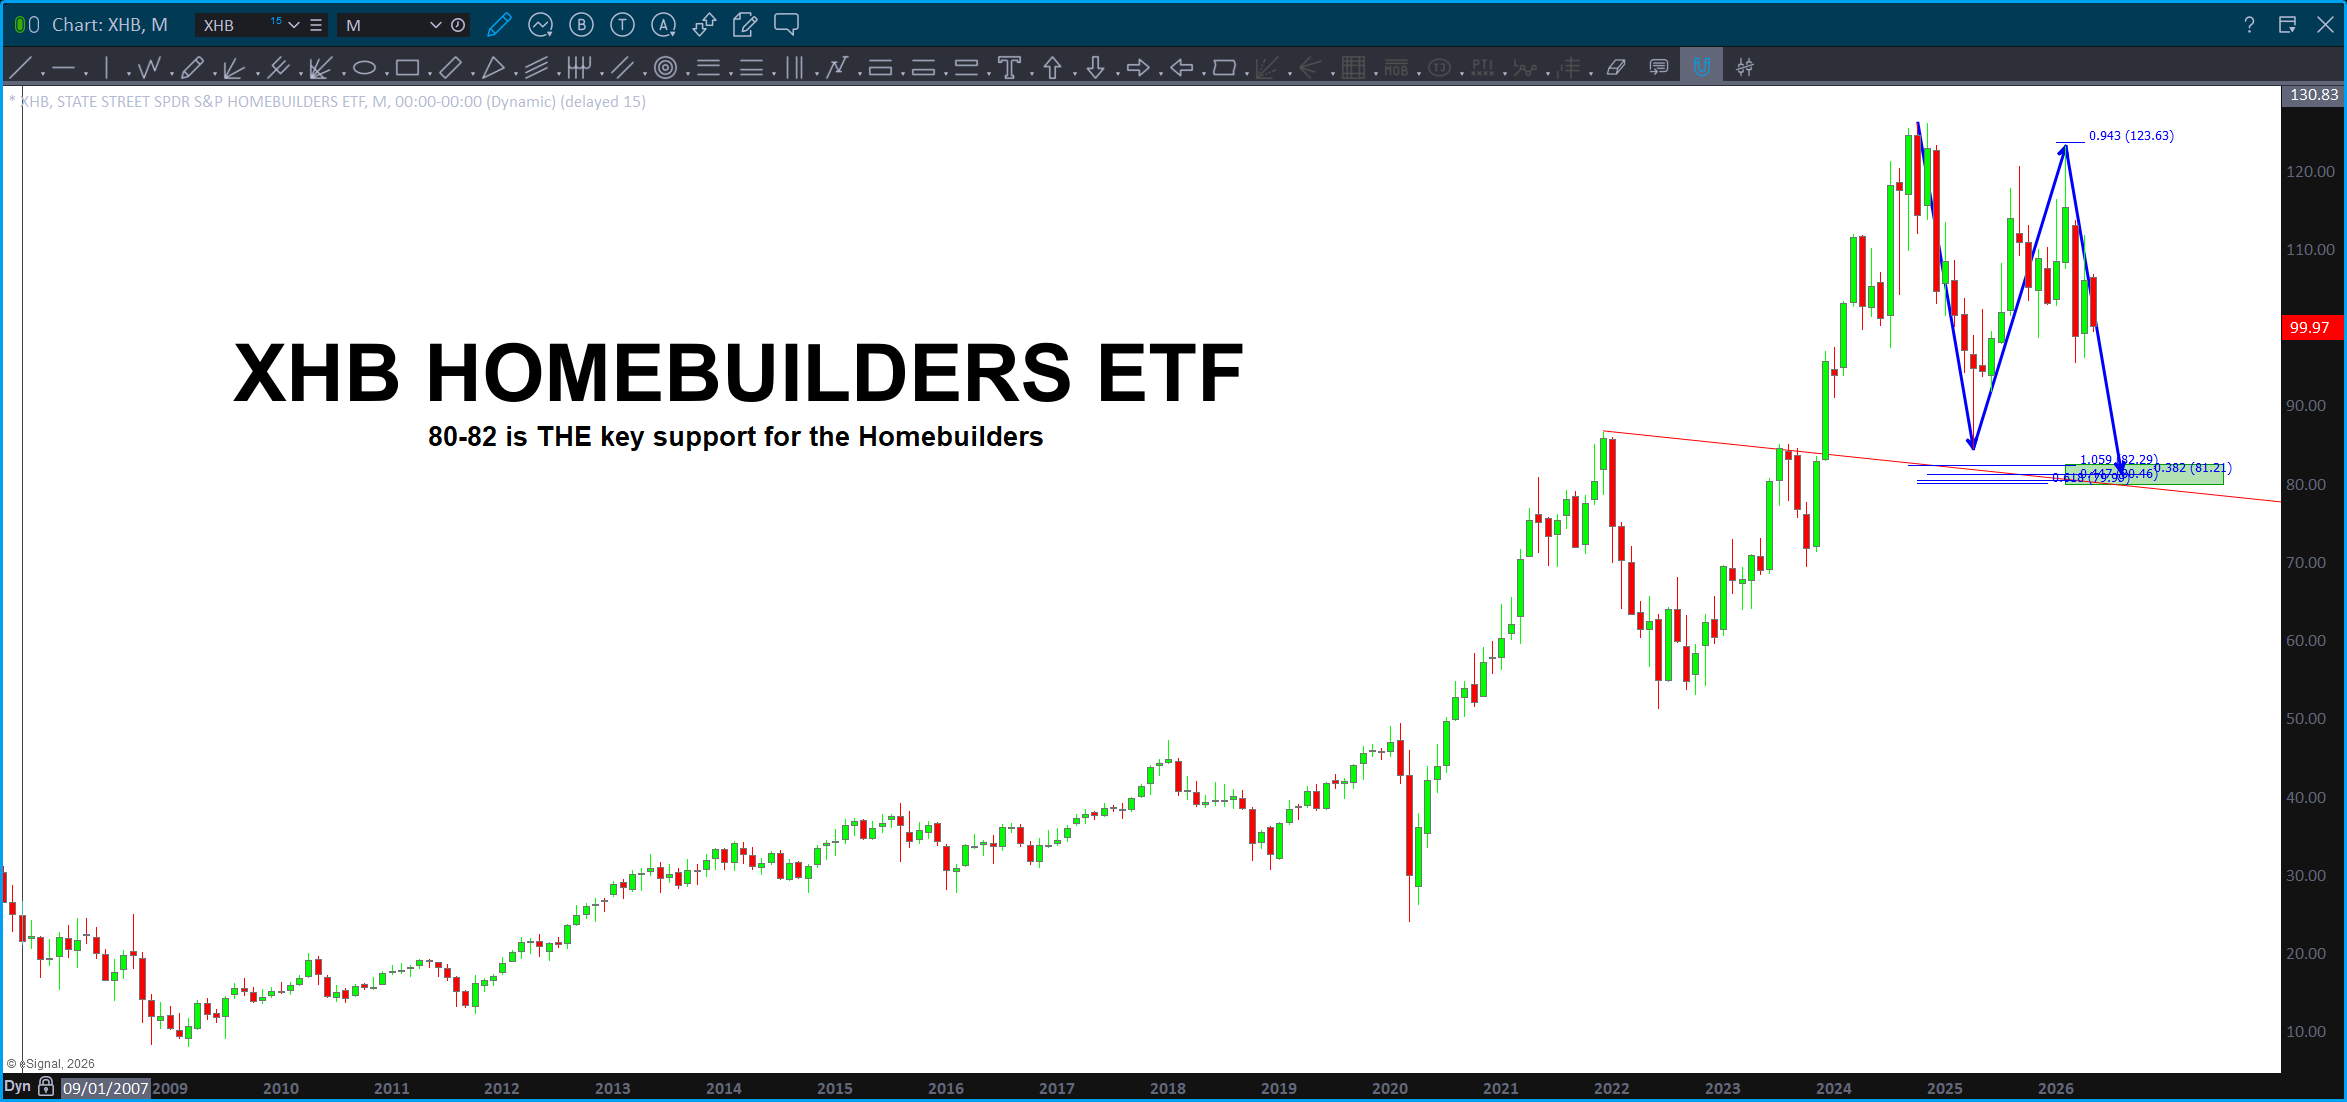
Homebuilders – May 12, 2026

This was an original post from almost 16 months ago – December 13, 2024. Wow, it has taken a while .. now, the news is all about the housing markets. What a lag … anyway, we have a near perfect BUY pattern on the Homebuilders ETF XHB so IF the homebuilders fail at this level then, its probable we have a housing correction coming.
See how patterns work … ?
Homebuilders – December 13, 2024
First, happy birthday to my wife …! She’s the bomb!
Second, certainly looks like the XHB has topped or is topping for now …
Got into a little trance doing this one …

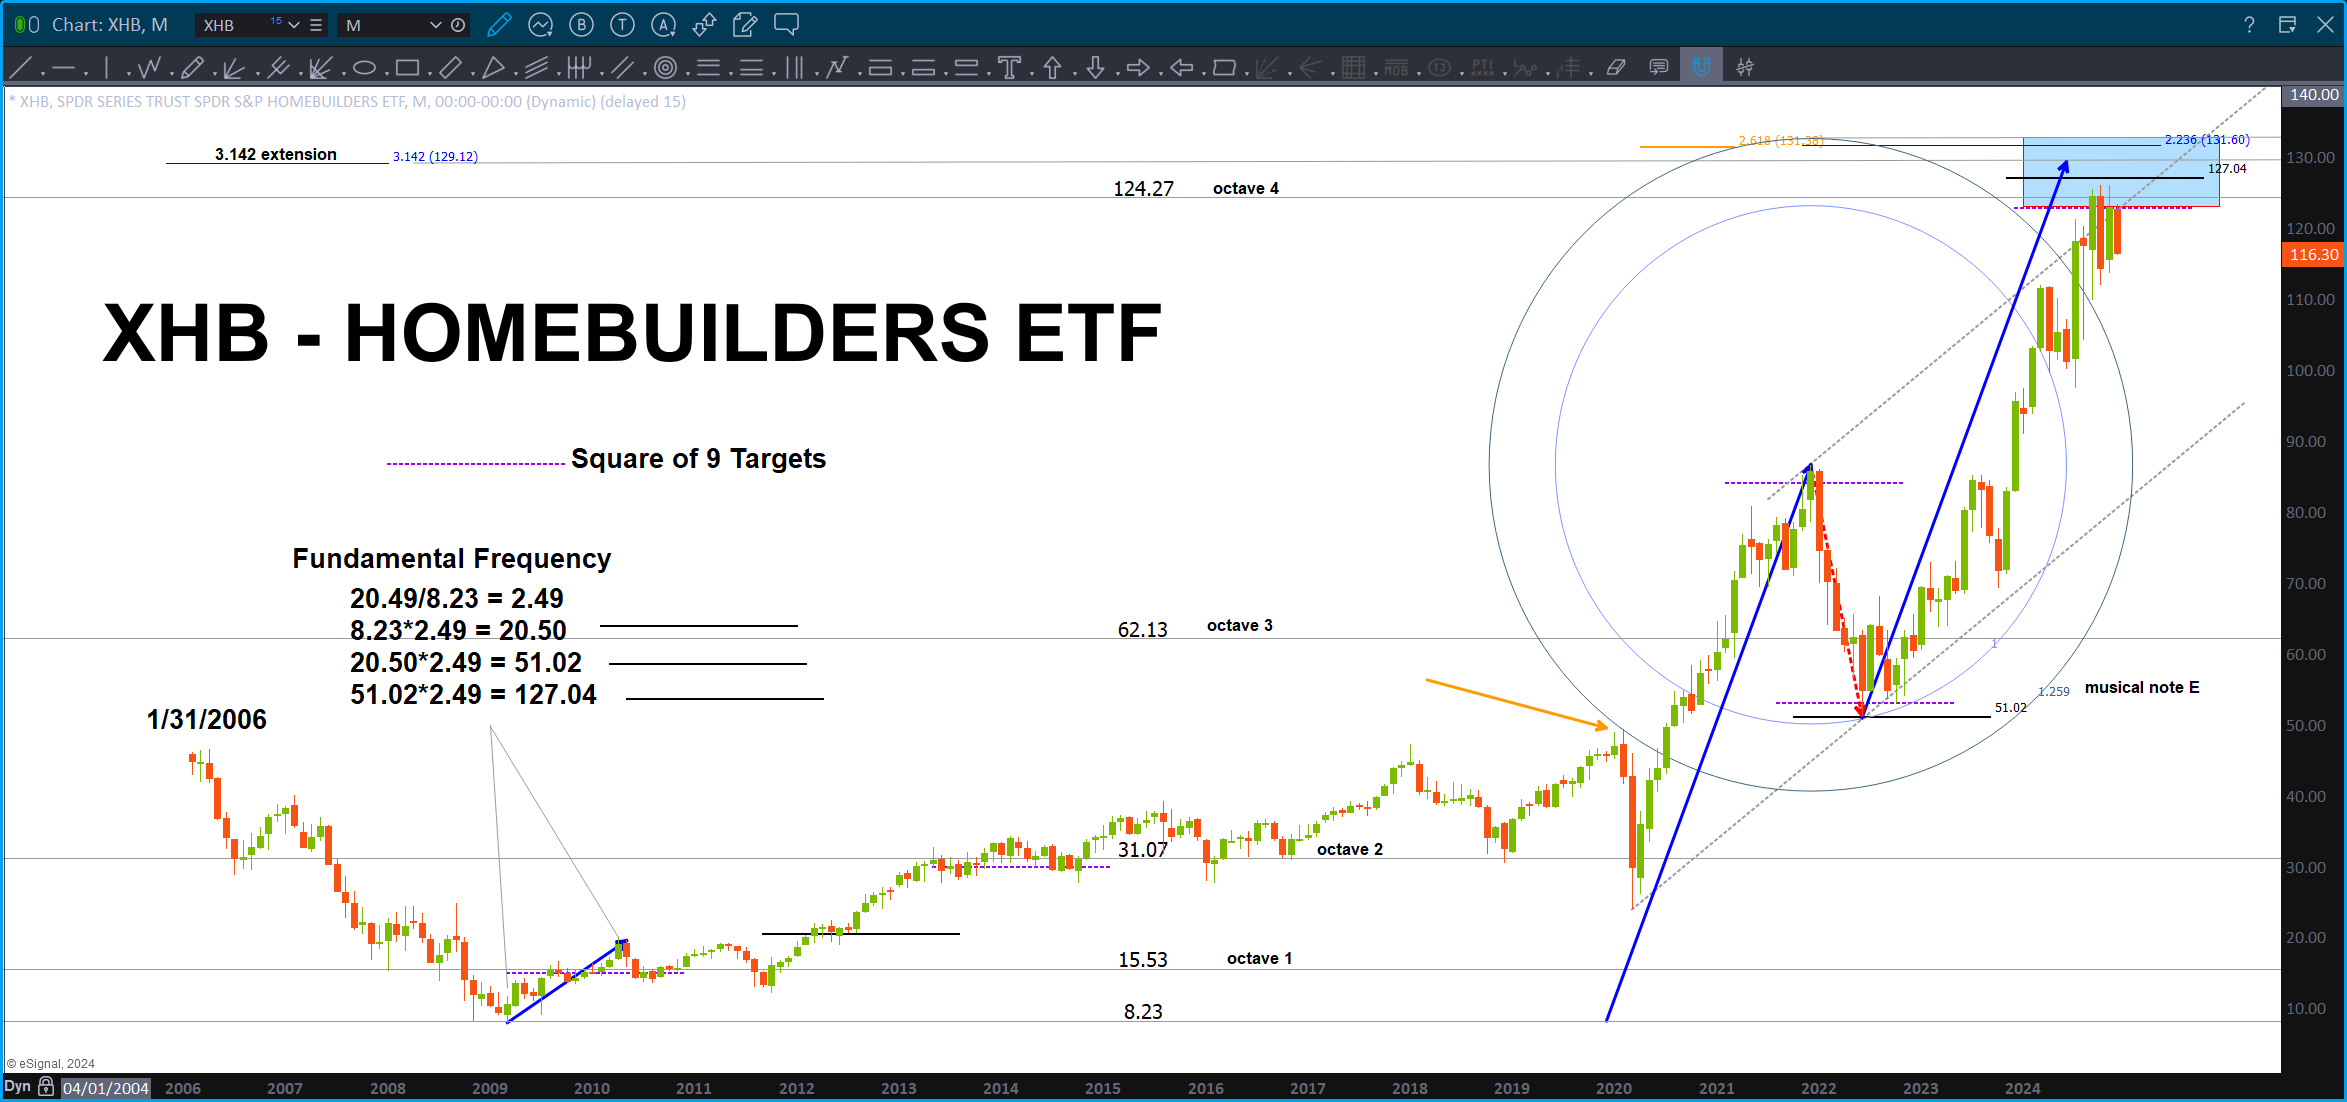
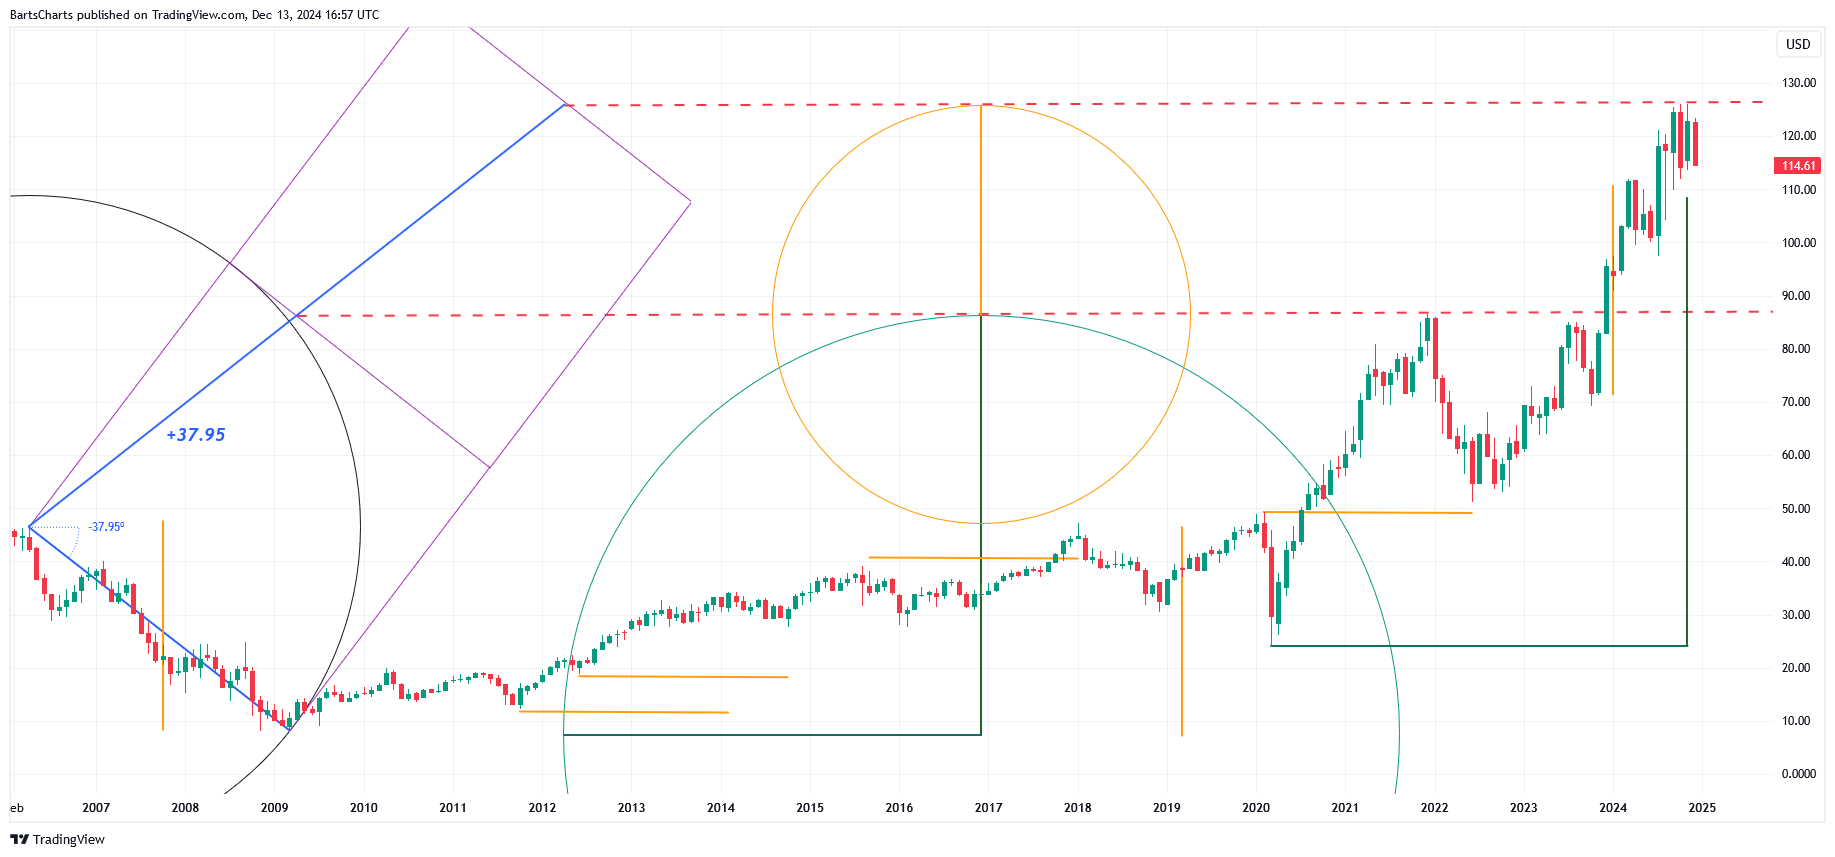
12/12/2024 – a portal?
Posted on December 12, 2024 Leave a Comment

I think, or not, that all of you who follow this blog sense/feel that “something” is amiss.
I just had a 3 hour dinner w/ an amazing friend and mentor, Chuck … we just flowed and talked and talked, it was awesome.
Ultimately, FLOW is what it’s all about ….last night and today I flowed w/ the Homebuilders Index.
We have TOPPED or need one more push higher …above the levels shown and, I will get out the eraser and try again … this one is looking like tasty cakes.

XLP / NYA – December 4, 2024
Posted on December 4, 2024 Leave a Comment

We’ve discussed the ratio many times …
It hit a VERY nice PRICE AND TIME target and rallied nicely. Recently, as the stock market continues its relentless advance, it has pulled back as expected.
Now, we are close to VERY important support for the ratio … IF we find support and the ratio starts back up THEN we are in the beginning phases of the “risk on” phase as staples start to outperform, on a relative strength basis….
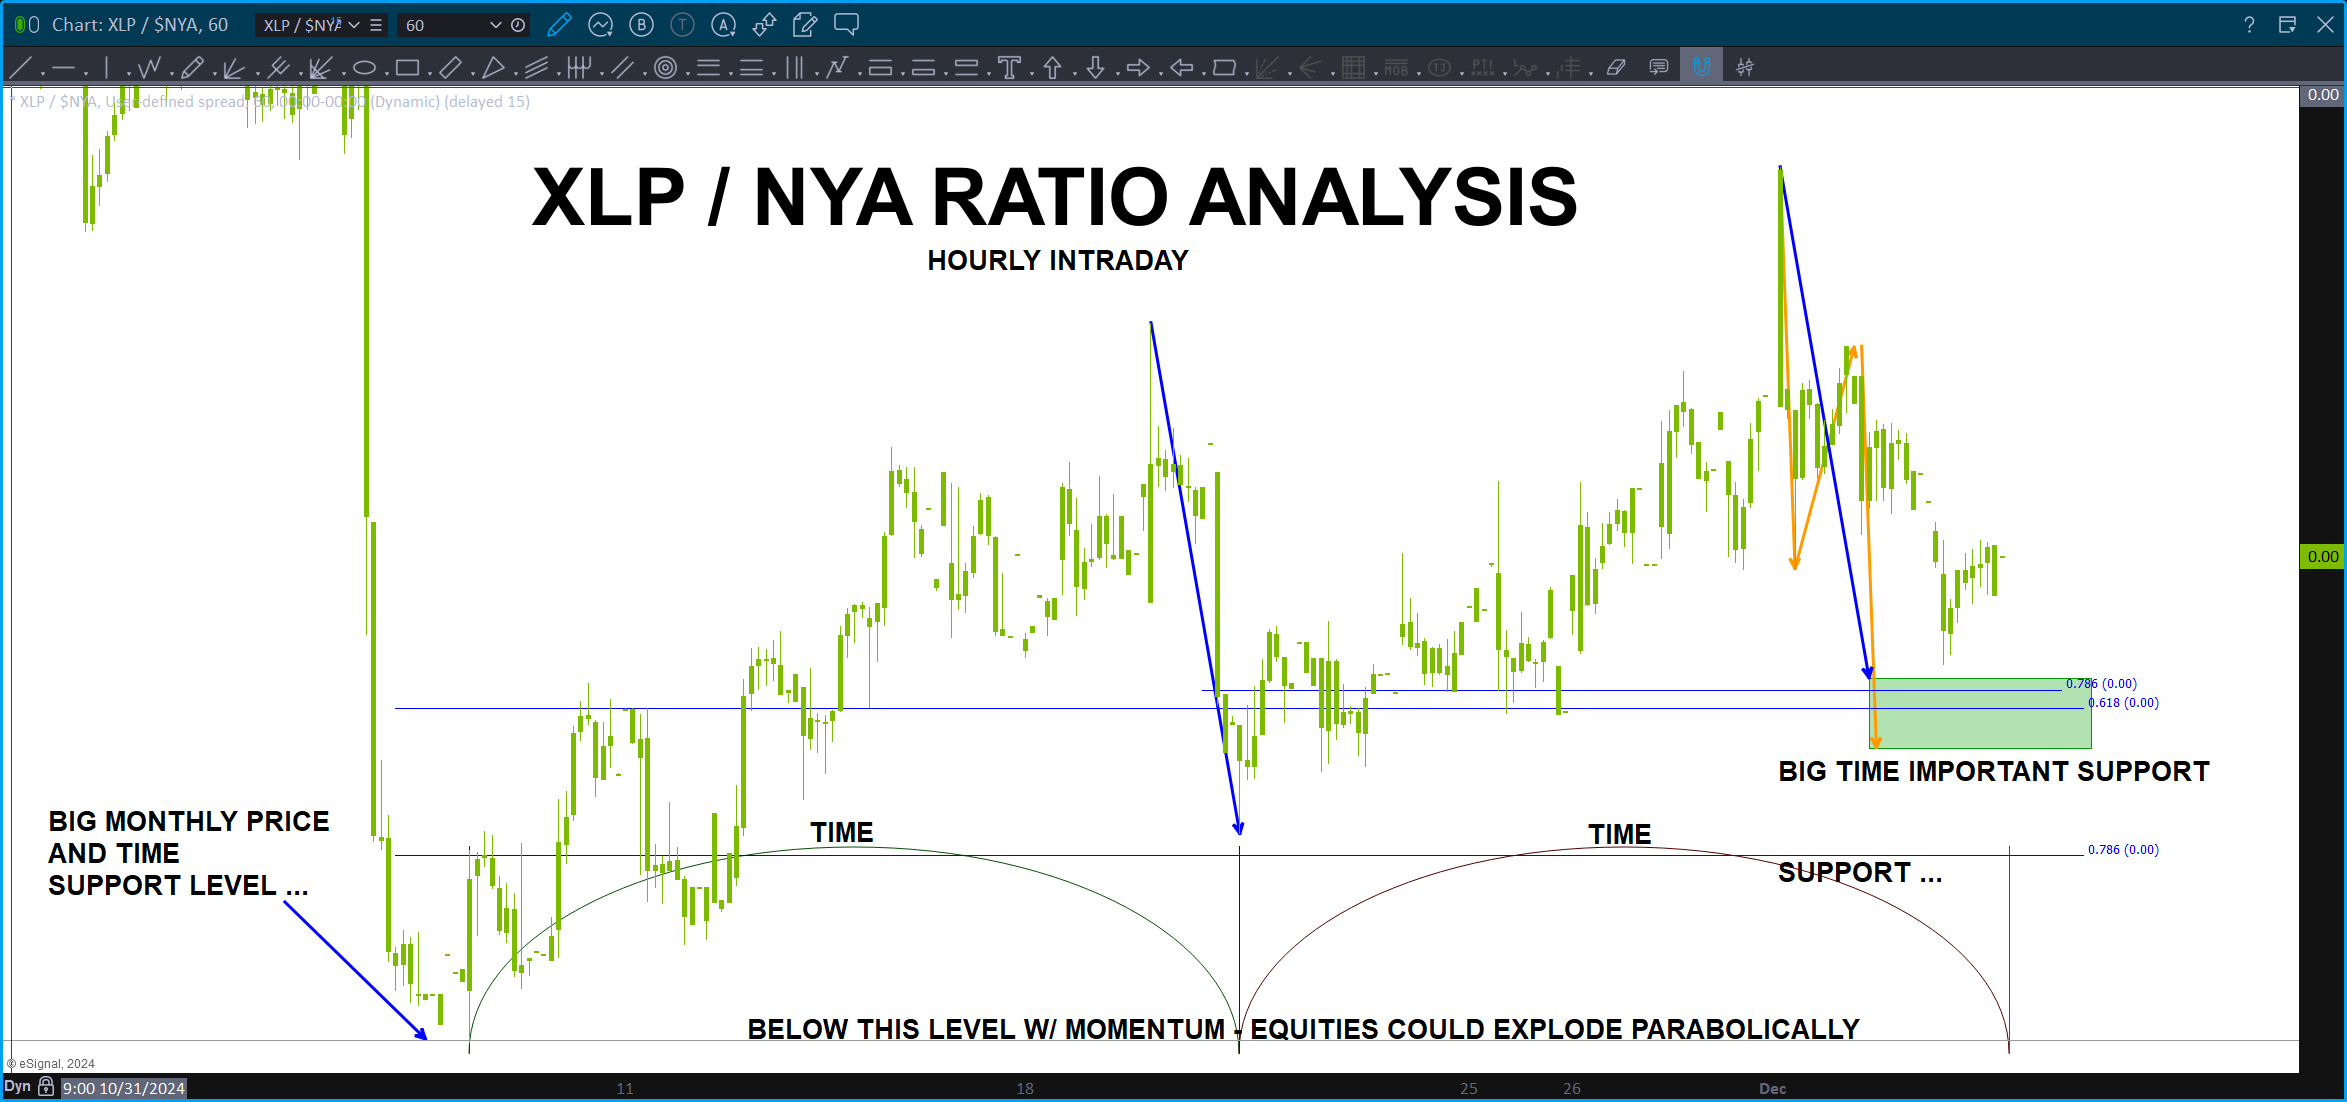
Pay attention … also, note the ‘basic’ static time cycle component …
