GOOGL – October 10, 2024
Posted on October 10, 2024 Leave a Comment

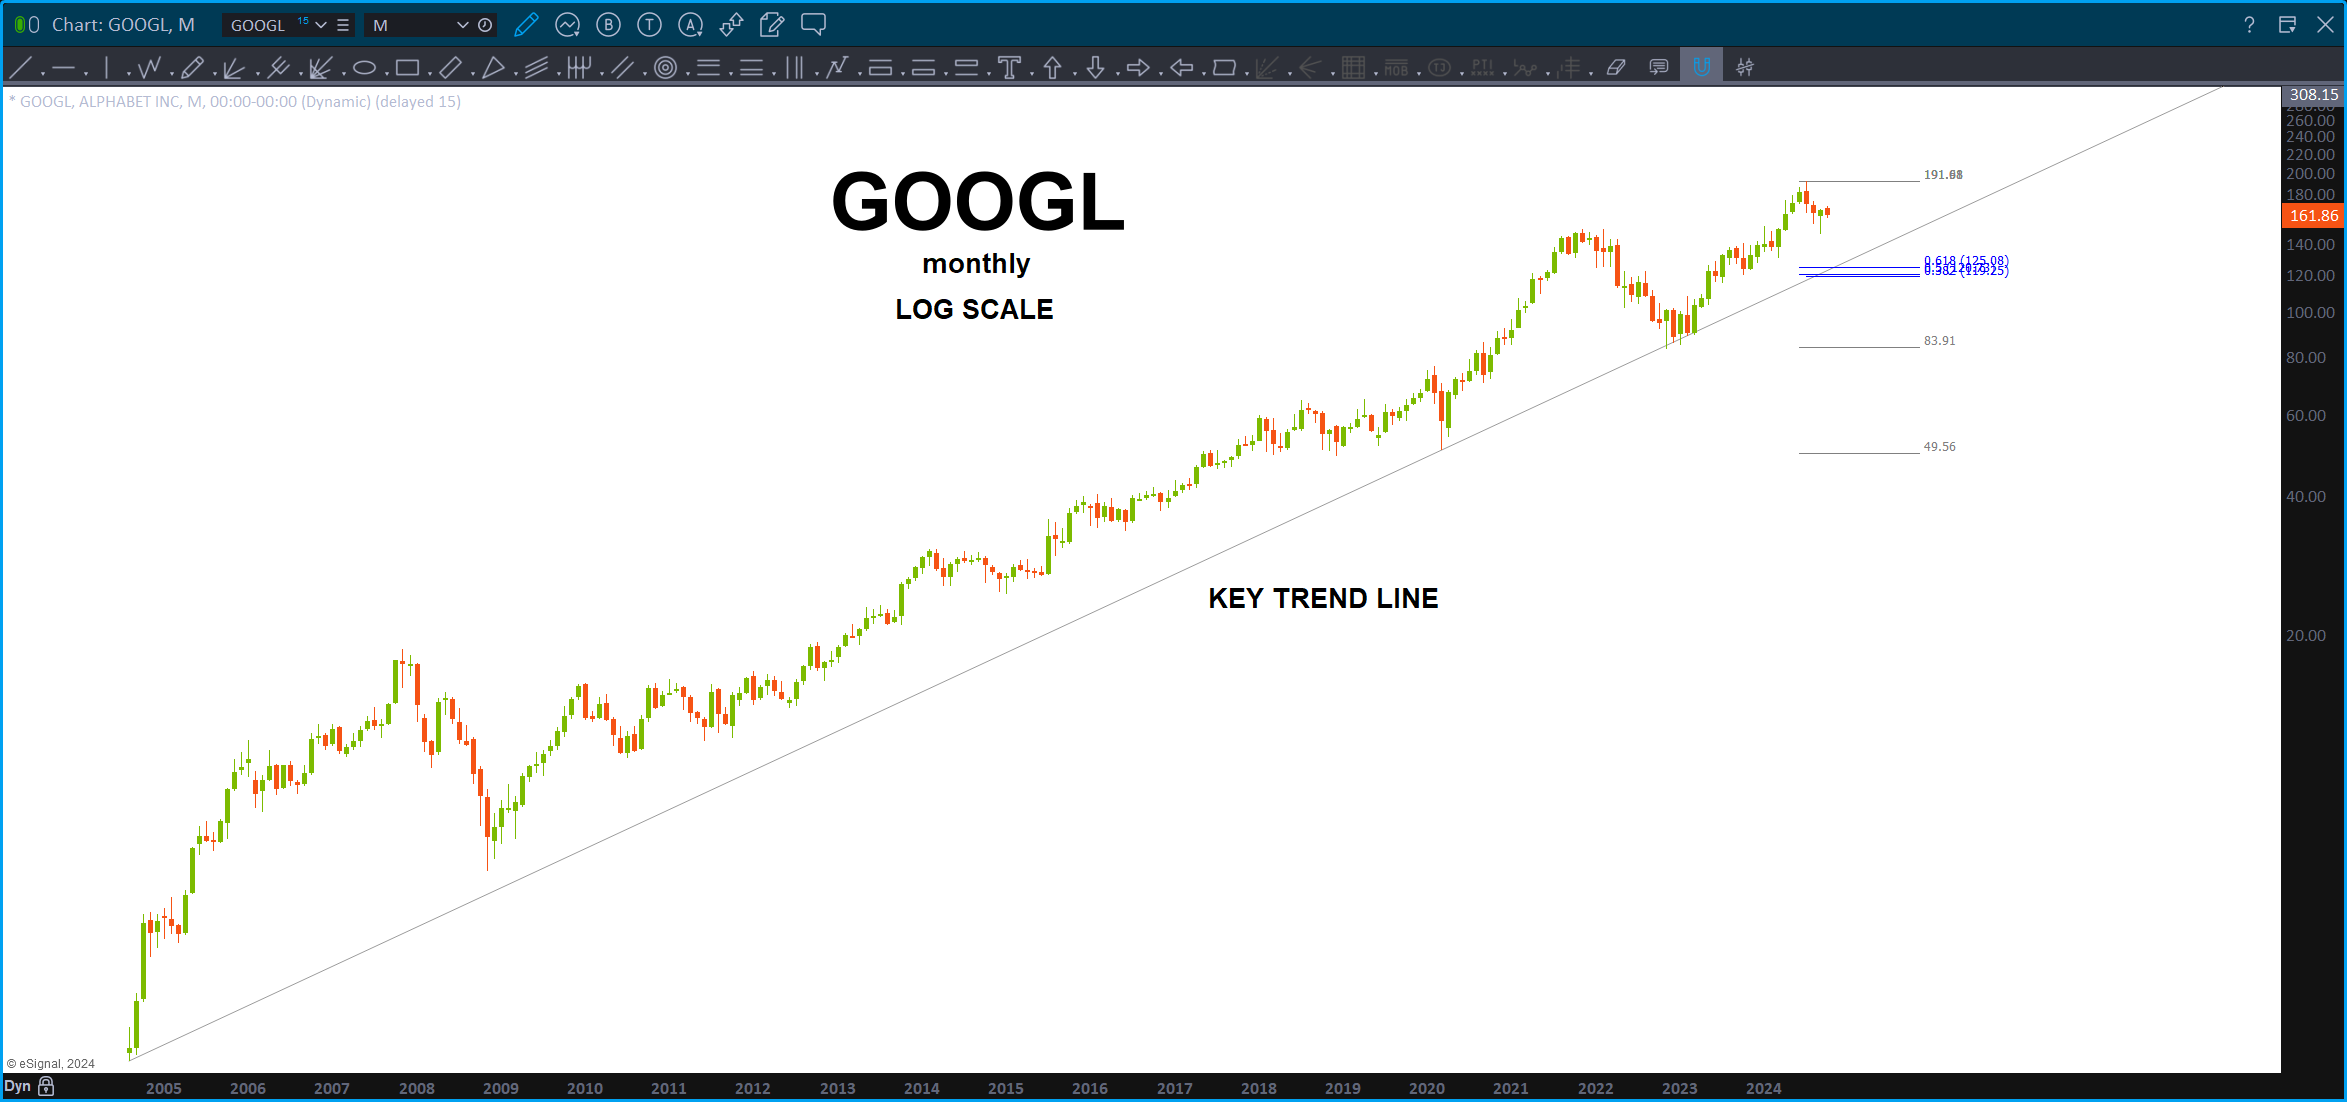
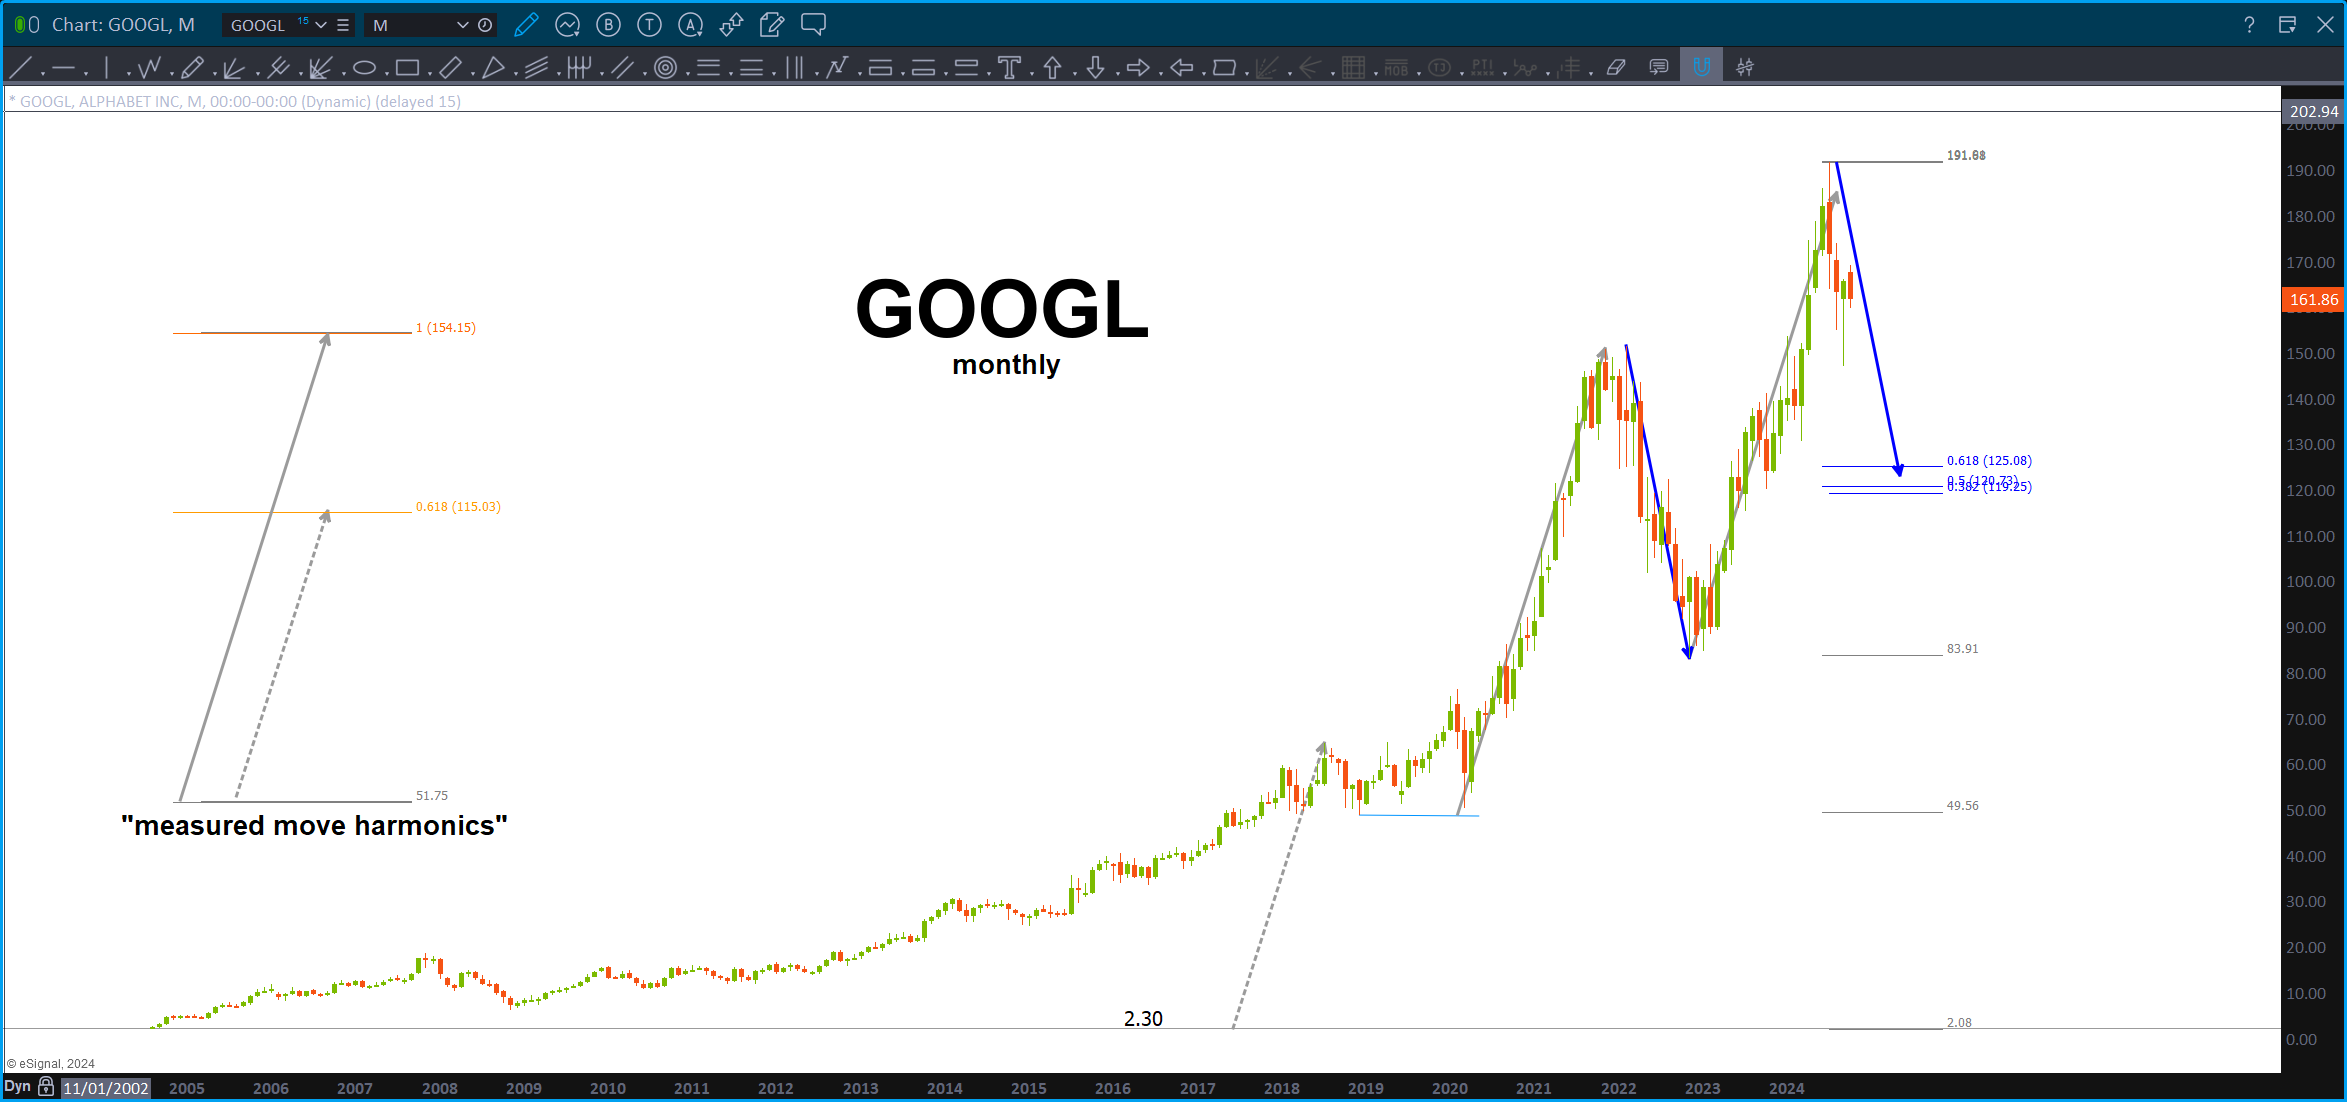
Been a while since I took a peak at GOOGL.
Trust this helps Scott – is it too long of a timeframe for you?
The Yen – October 4, 2024
Posted on October 4, 2024 1 Comment

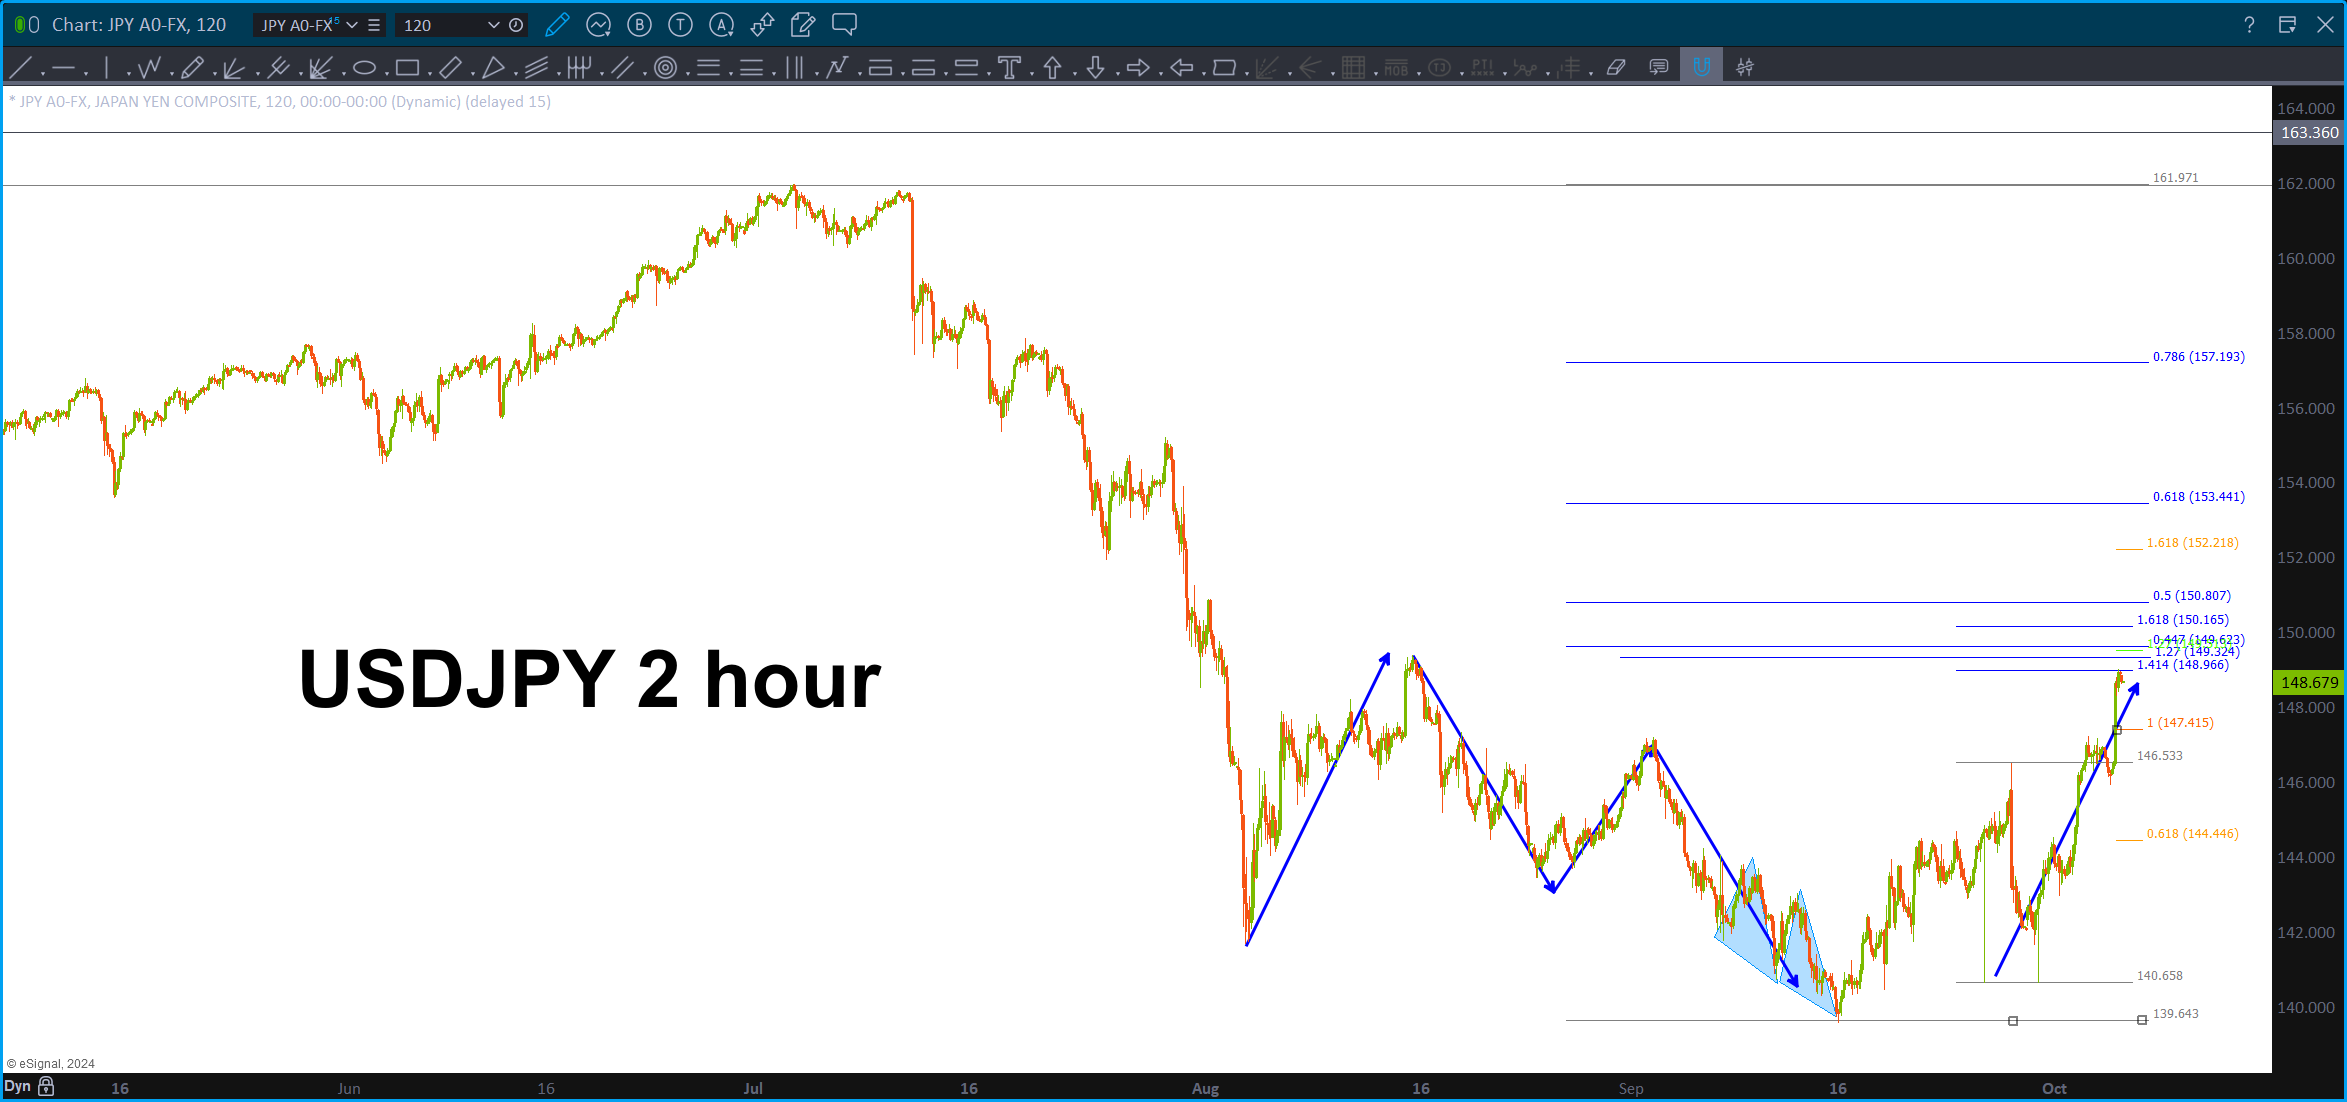
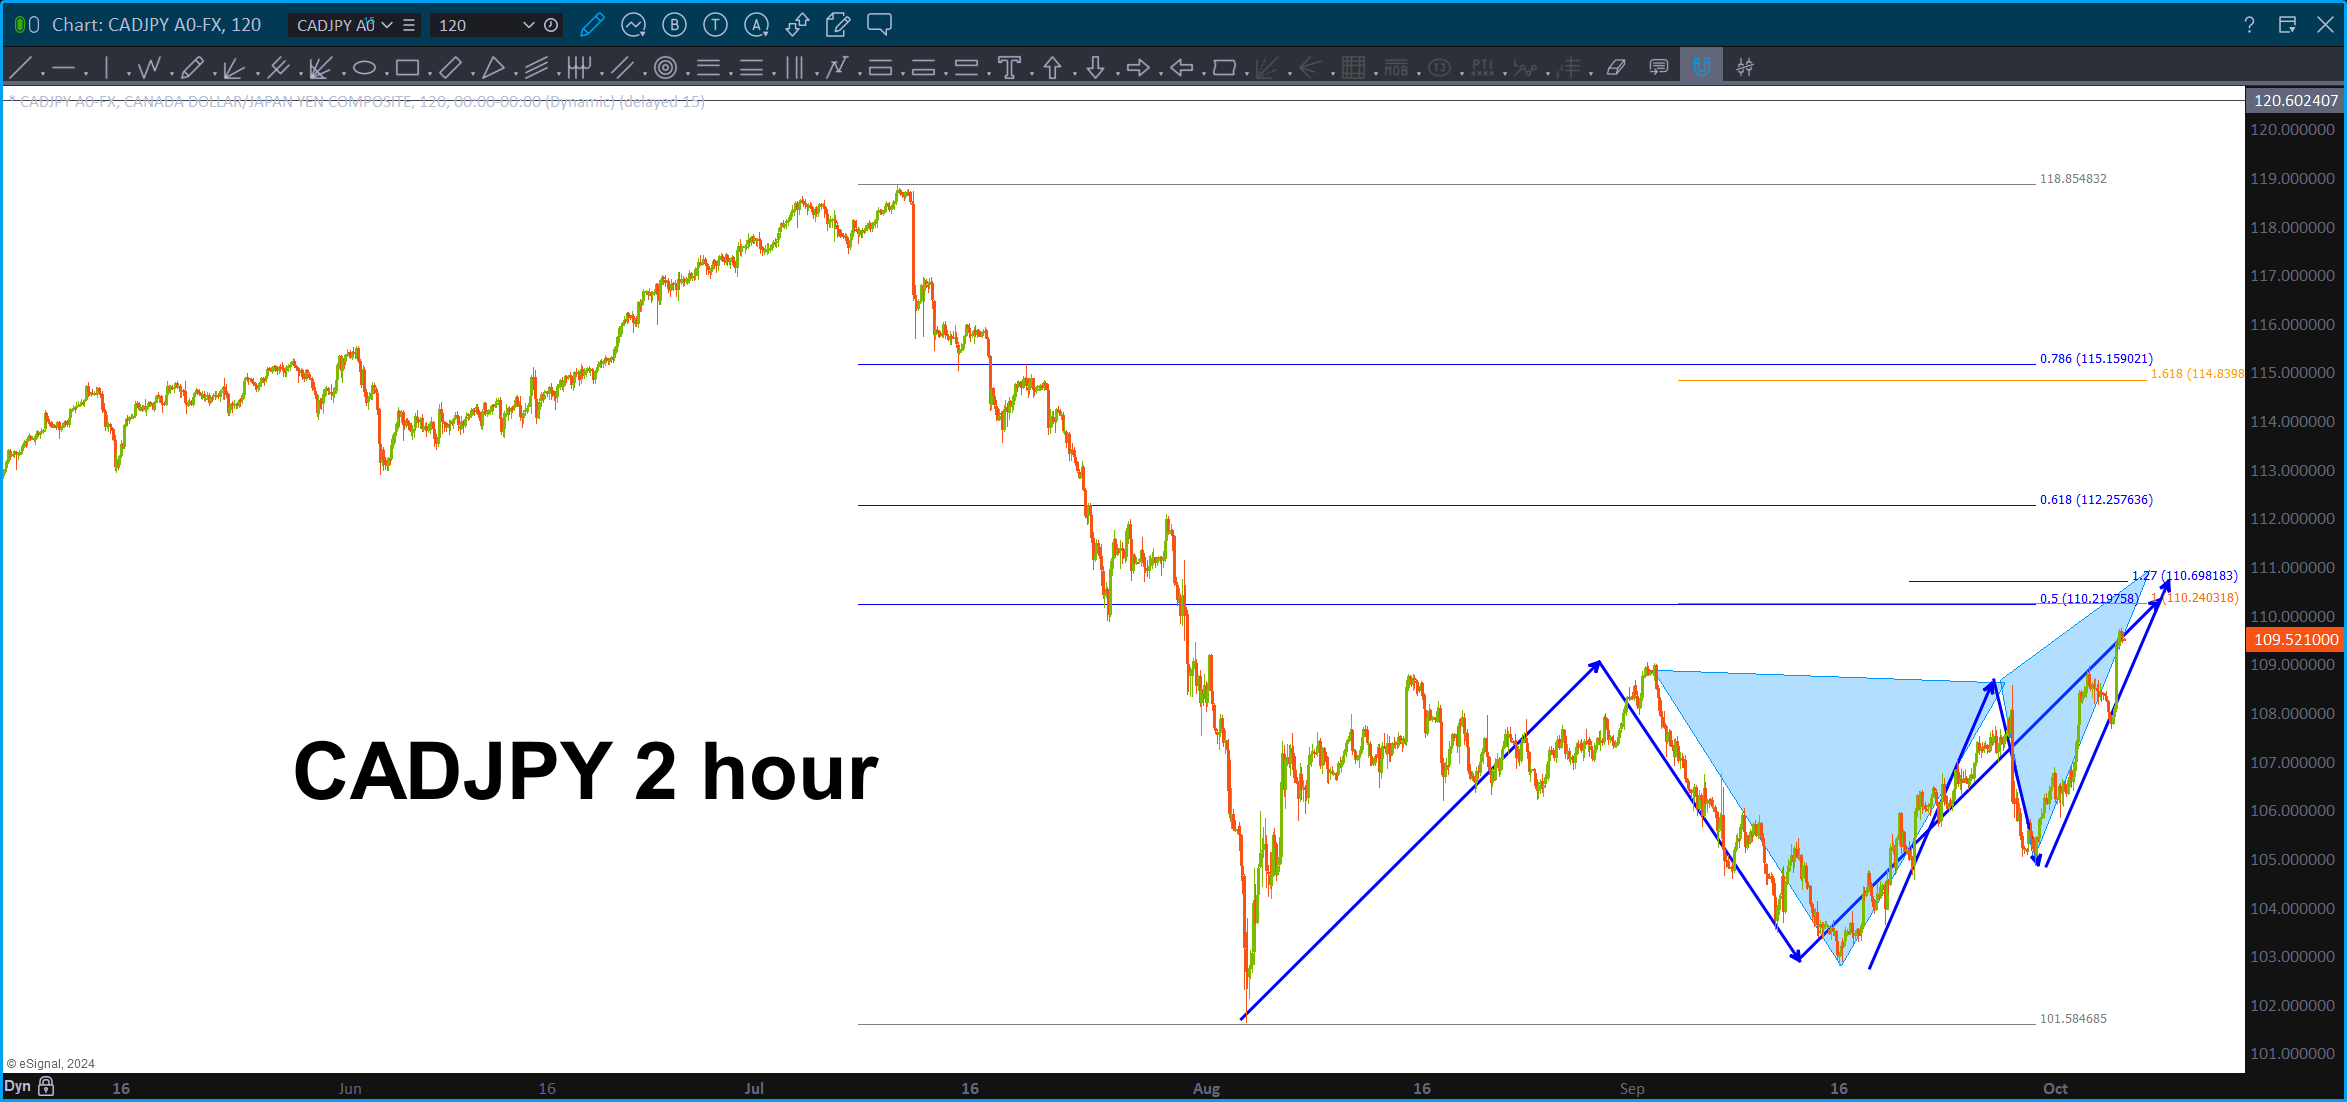
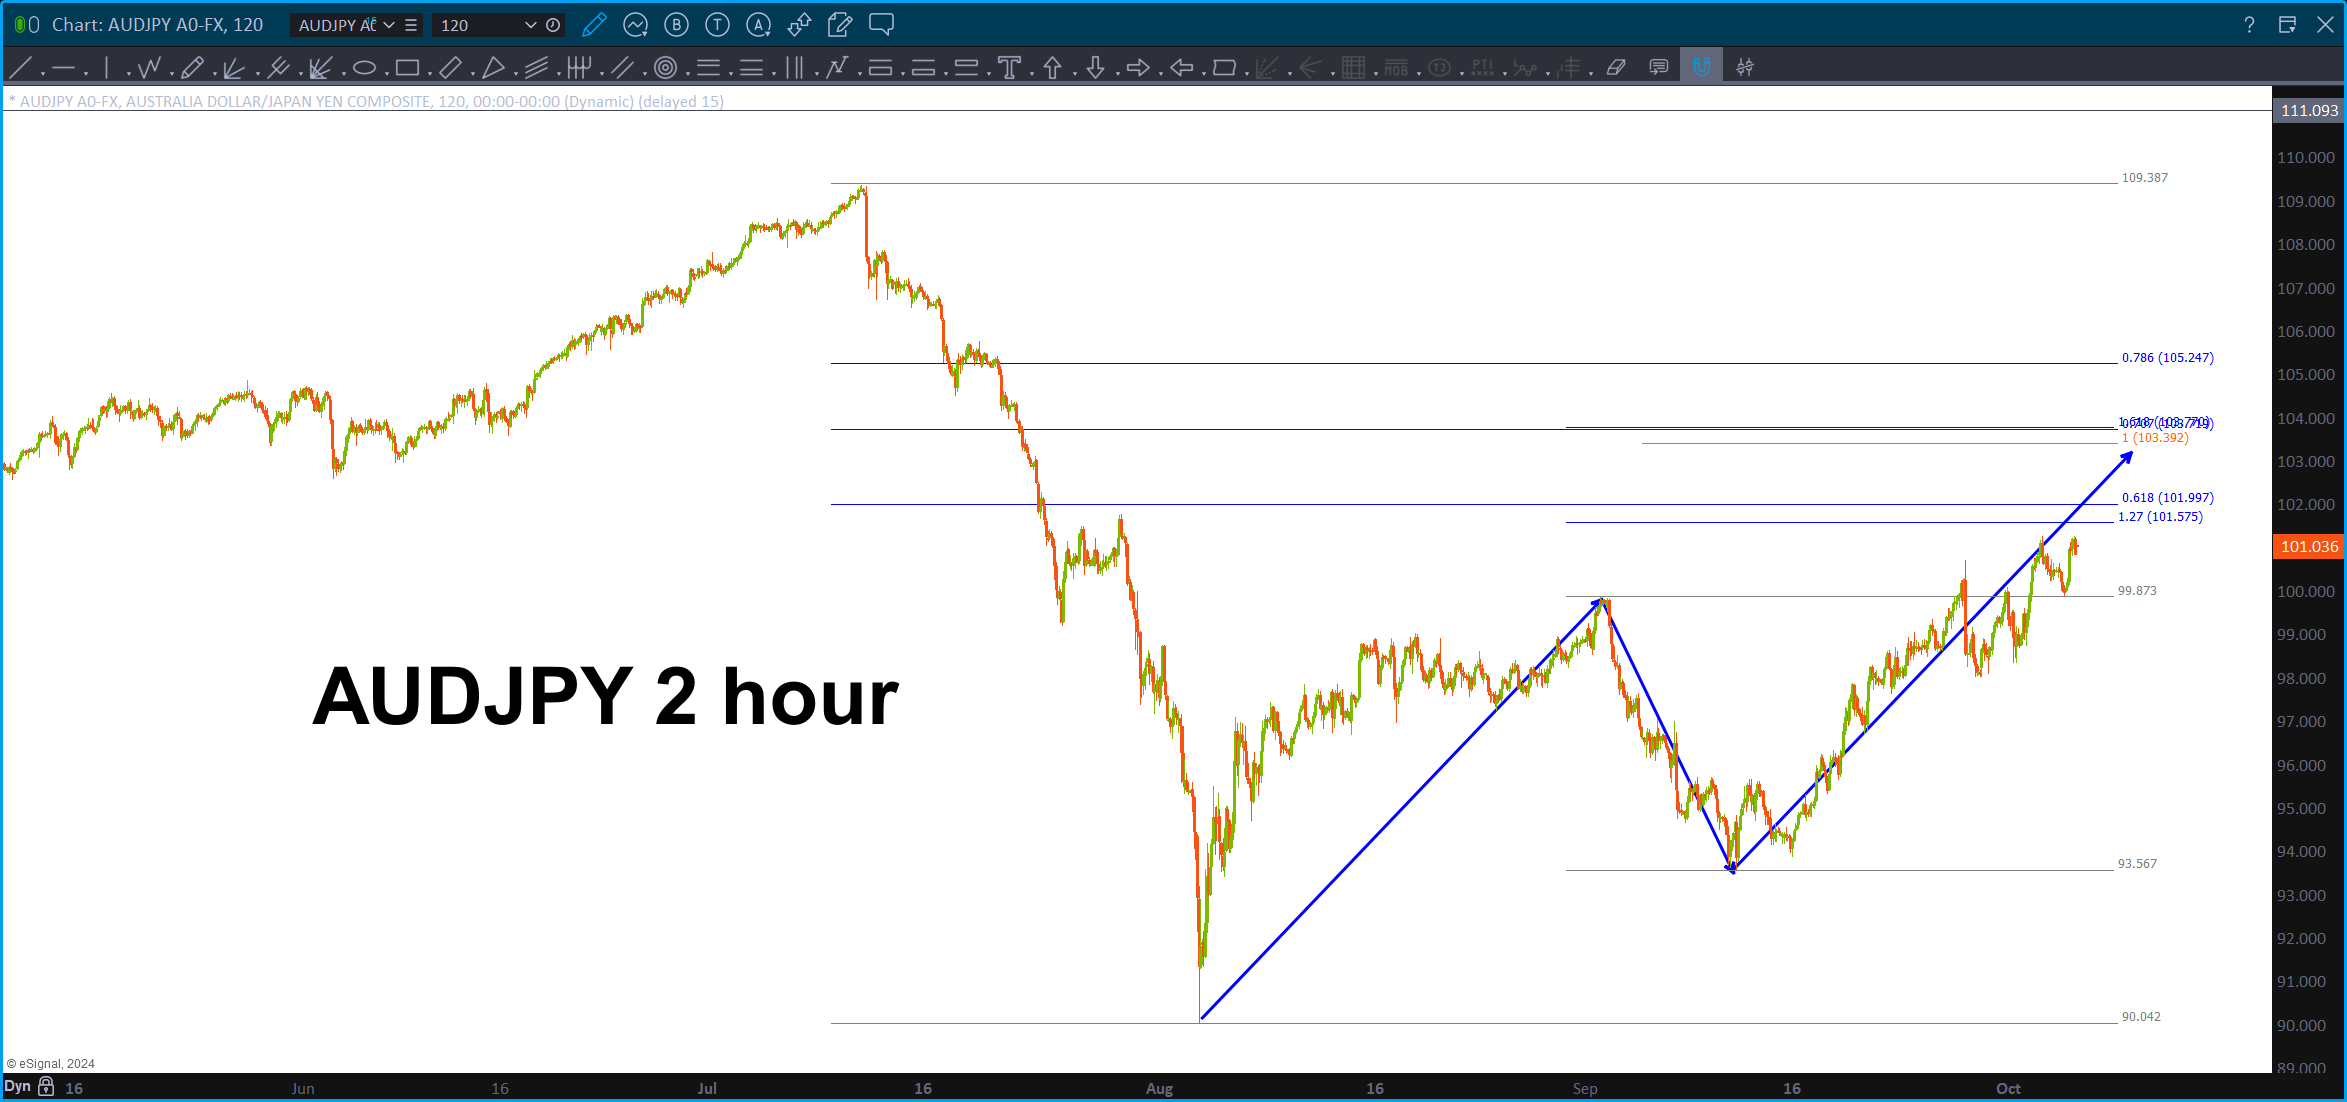
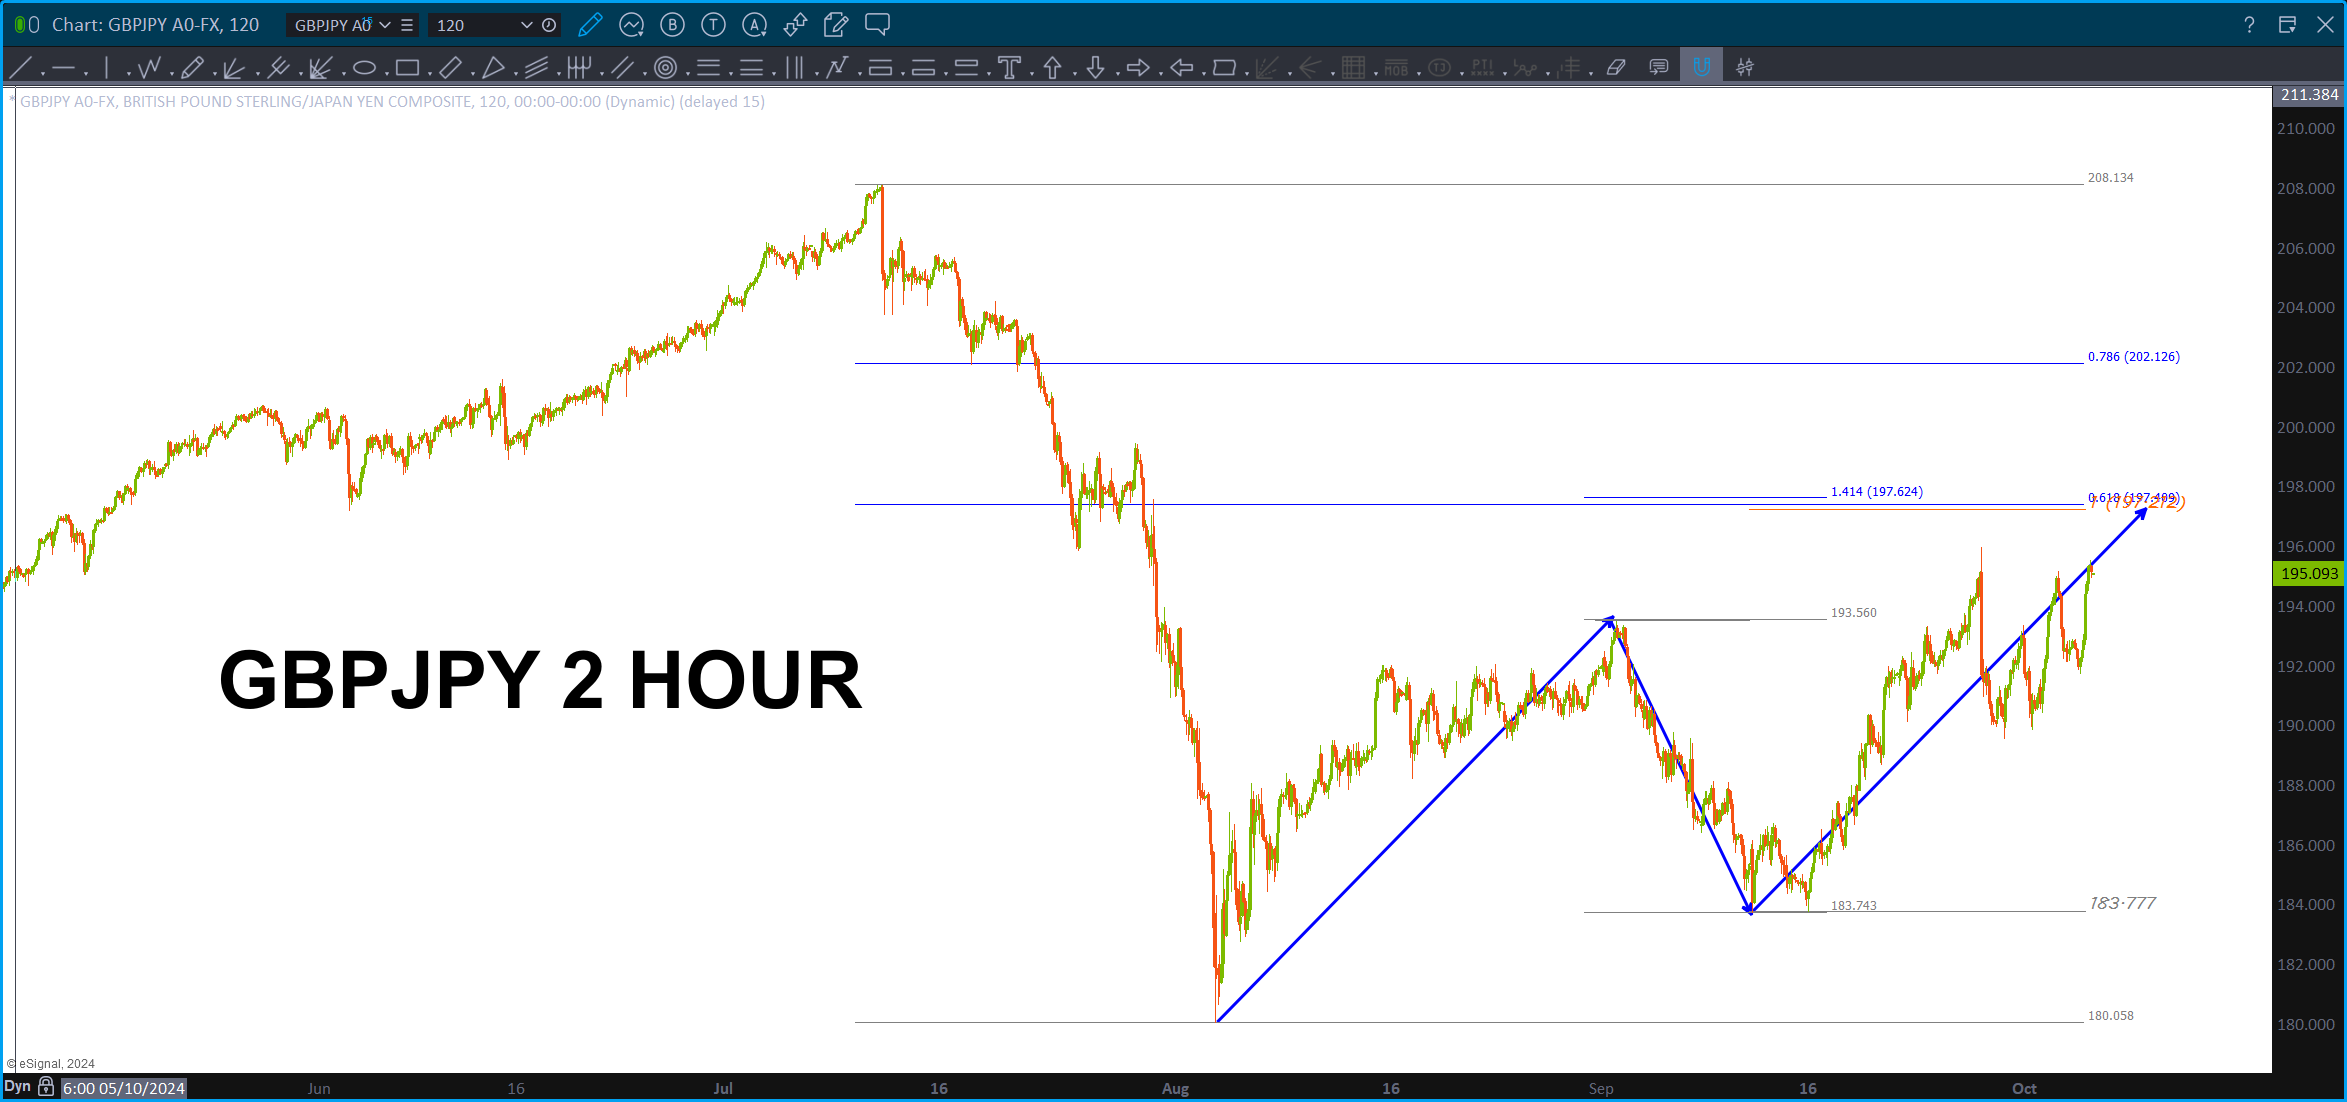
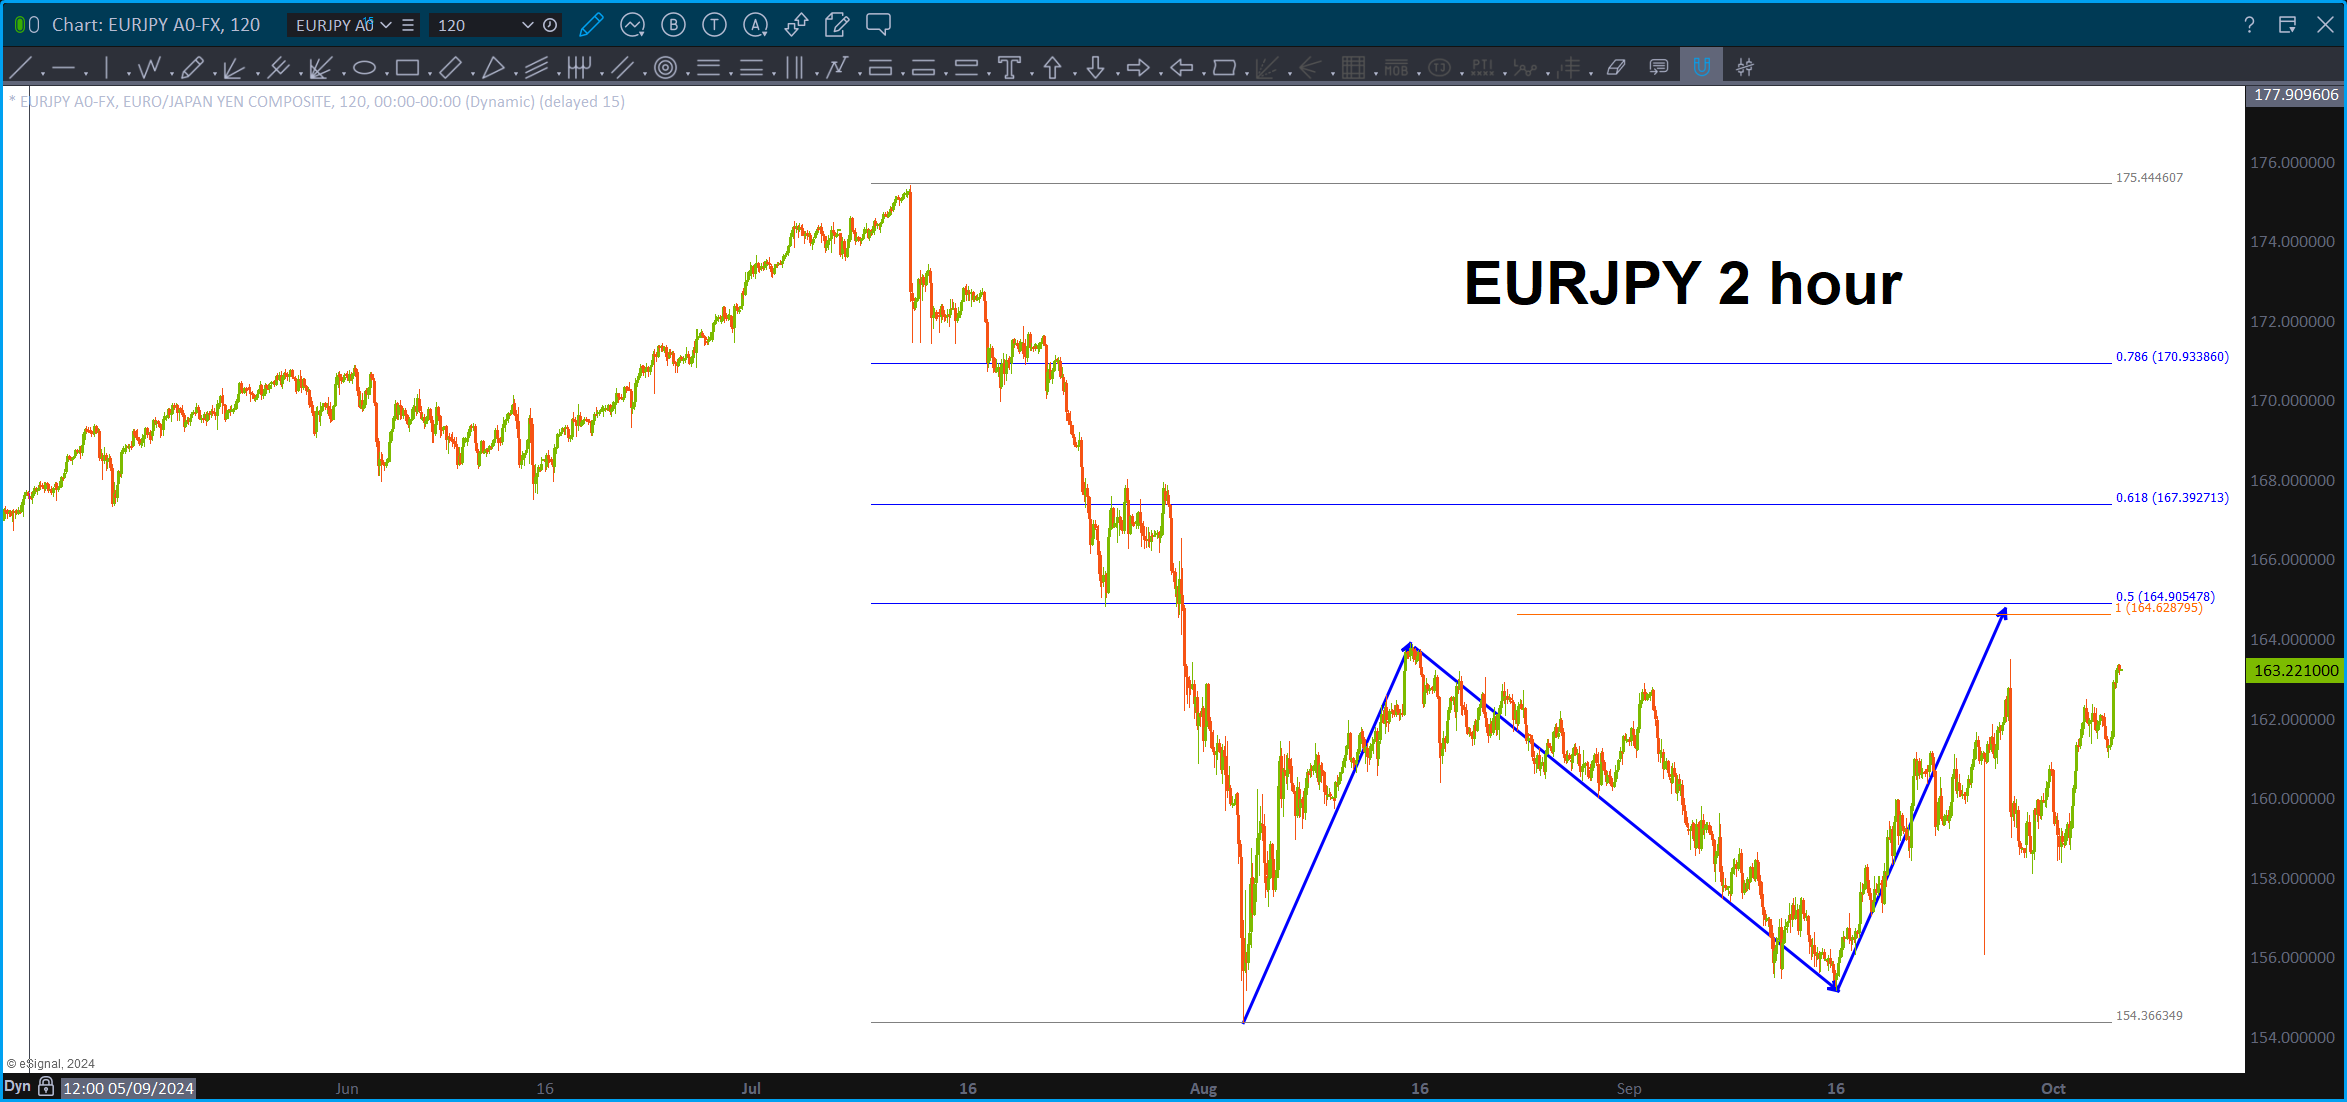
Well, some weeks ago, the Yen is what cooked the entire thing off and don’t you think its time we add a little gas to the fire or are things hot enough? Well … guess what, PATTERNS again appearing across the board w/ the probability bet being YEN STRENGTH and the last time that occurred, we all knew what happened….
A picture paints a thousand words.
IF they “work” THEN the YEN strengthens and there might be some funds trapped again?
IF they “fail” THEN the YEN weakens and the band plays on and, frankly, we could be going parabolically higher. Which if your long is a GREAT ride, I have done it once in my life w/ Bitcoin and it was so HARD to cut the position at the top …but I did and for maybe one day I was like ” I need to get back in” but then it thumped down hard and I took my money out of bitcoin … like to chart it, but not trading that these days. Anyway, we could be going higher and a lot longer than people might think. GREAT … BUT … when it does crack, and it will, it will be a reckoning. I’d much rather have a good ole pullback are couple ‘scary the sky is falling CNBC measured move to BUY’ so, guess we’ll just have to wait and see.
Here comes Mr Yen.
One last thing – the ONLY PATTERN which is not a PERFECT SELL is the USD vs JPY. Go figure … it’s still popping up into big resistance but all the other cross pairs – near perfect SELL PATTERNS. Probability says, they ‘should’ work …
Perhaps, hang on folks …
Bart
VISA – September 25, 2024
Posted on September 25, 2024 1 Comment

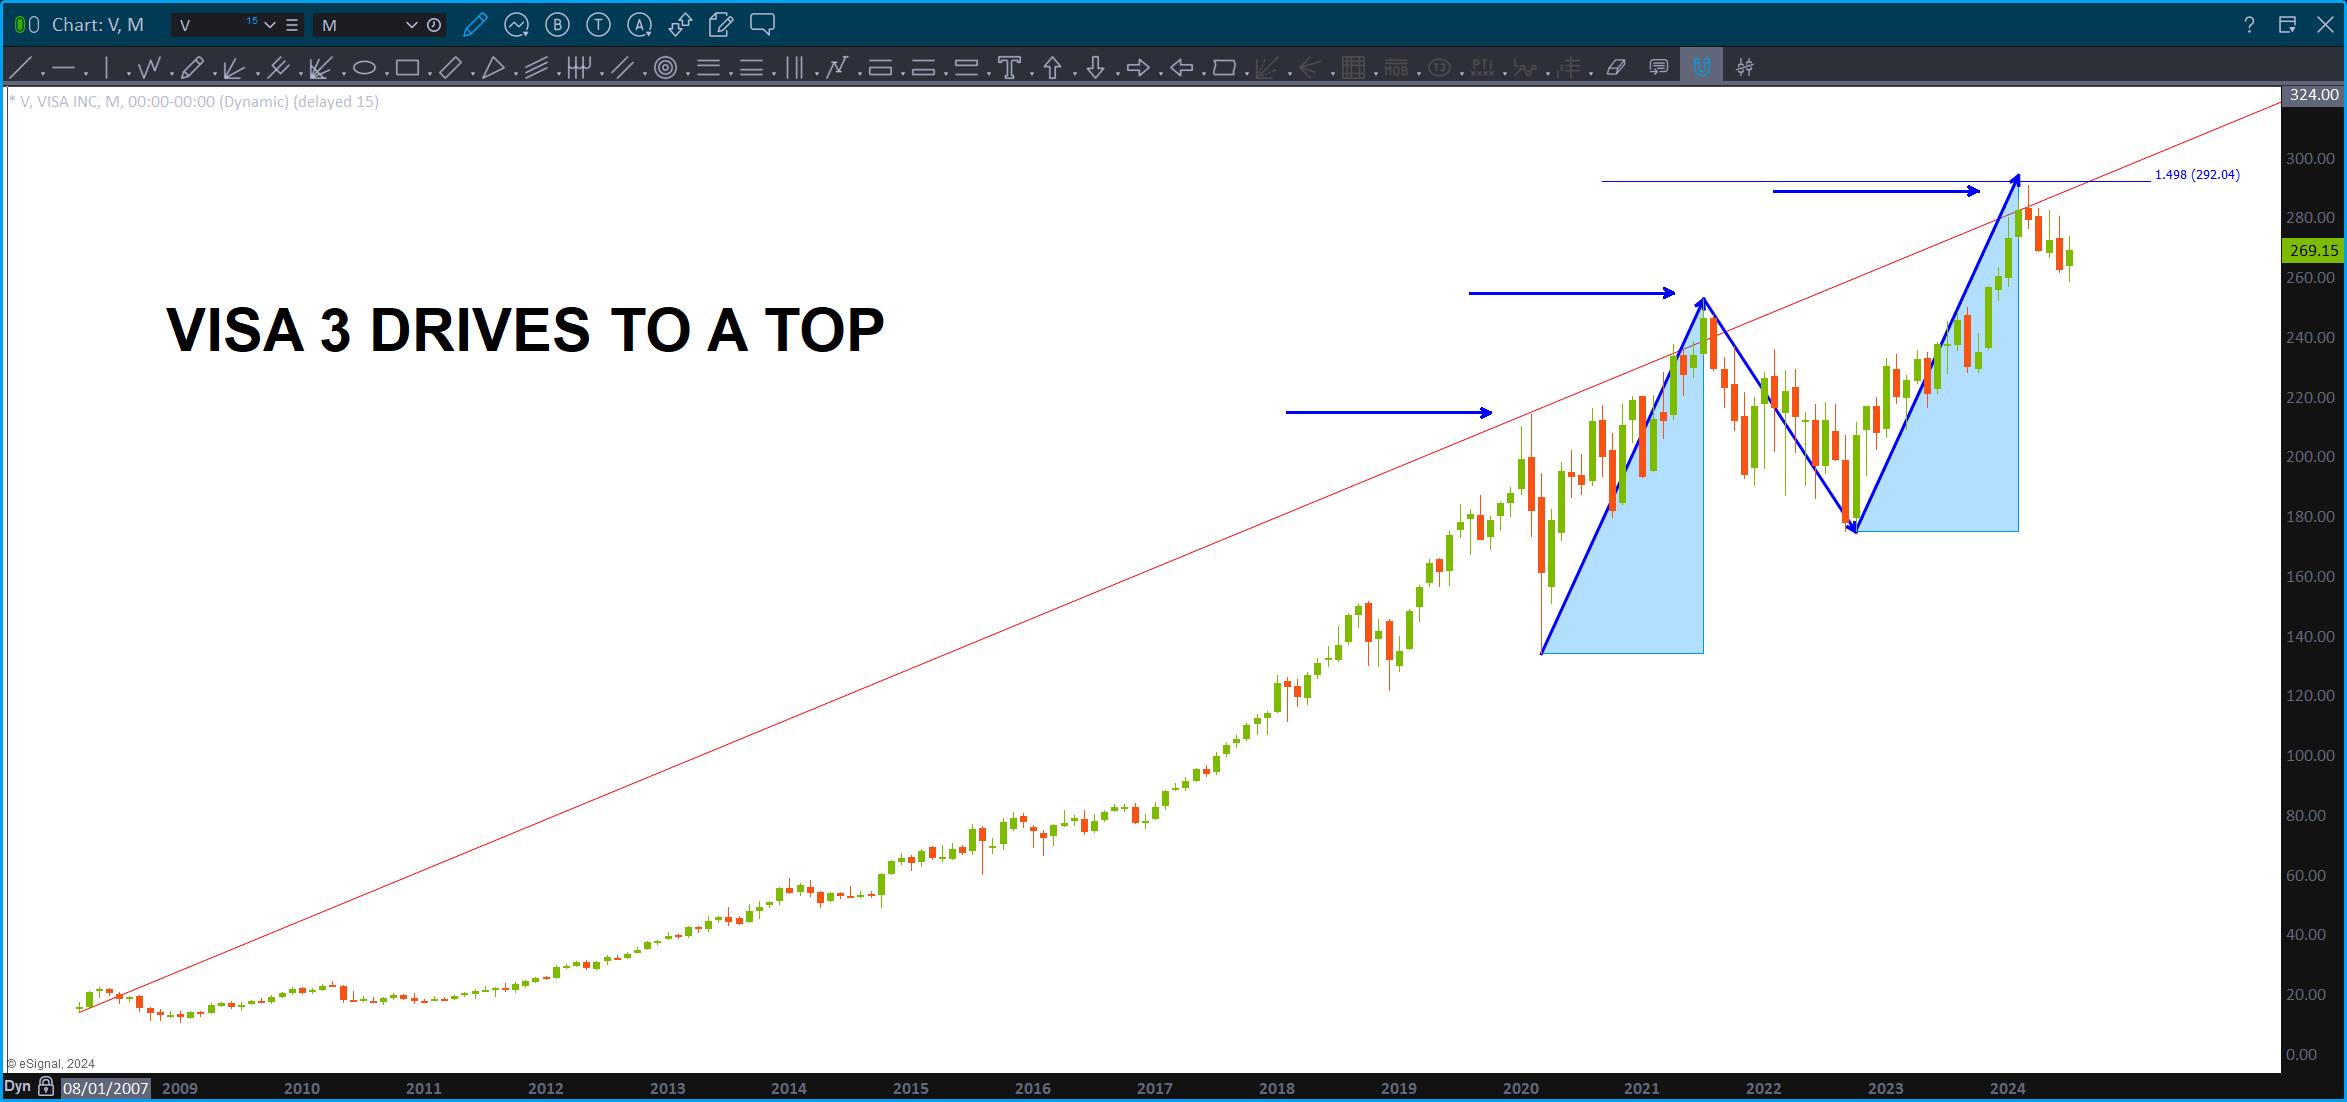
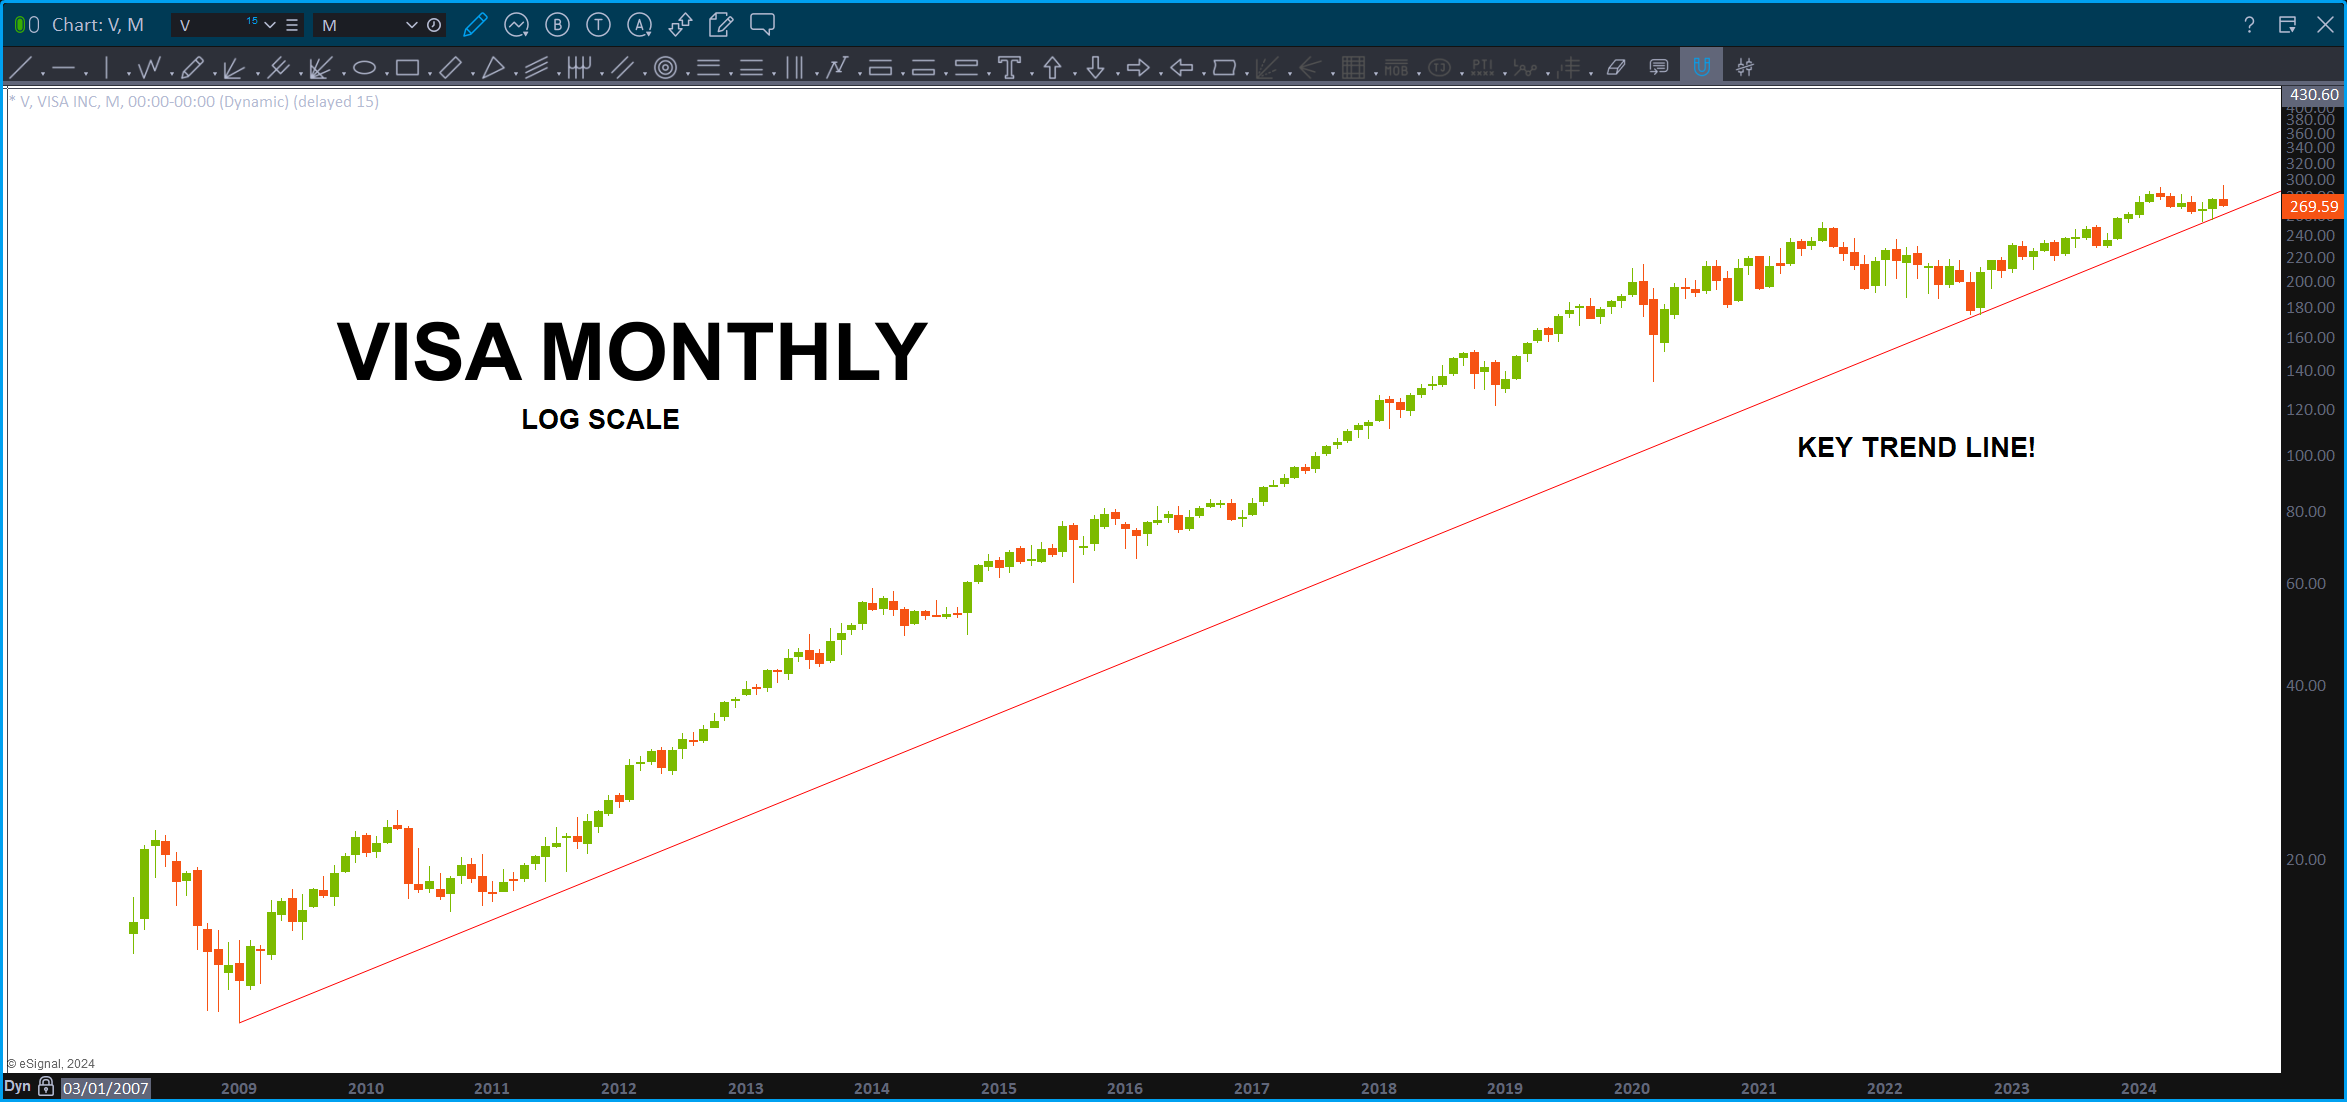
VERY long term LOG trend line has been the support for VISA. Watch this one closely.
When I did post the 3 drives to a top below – had no idea they were being sued – https://www.kiplinger.com/investing/stocks/whats-next-for-visa-stock-after-doj-lawsuit
Gasoline Geometry – September 25, 2024
Posted on September 25, 2024 Leave a Comment

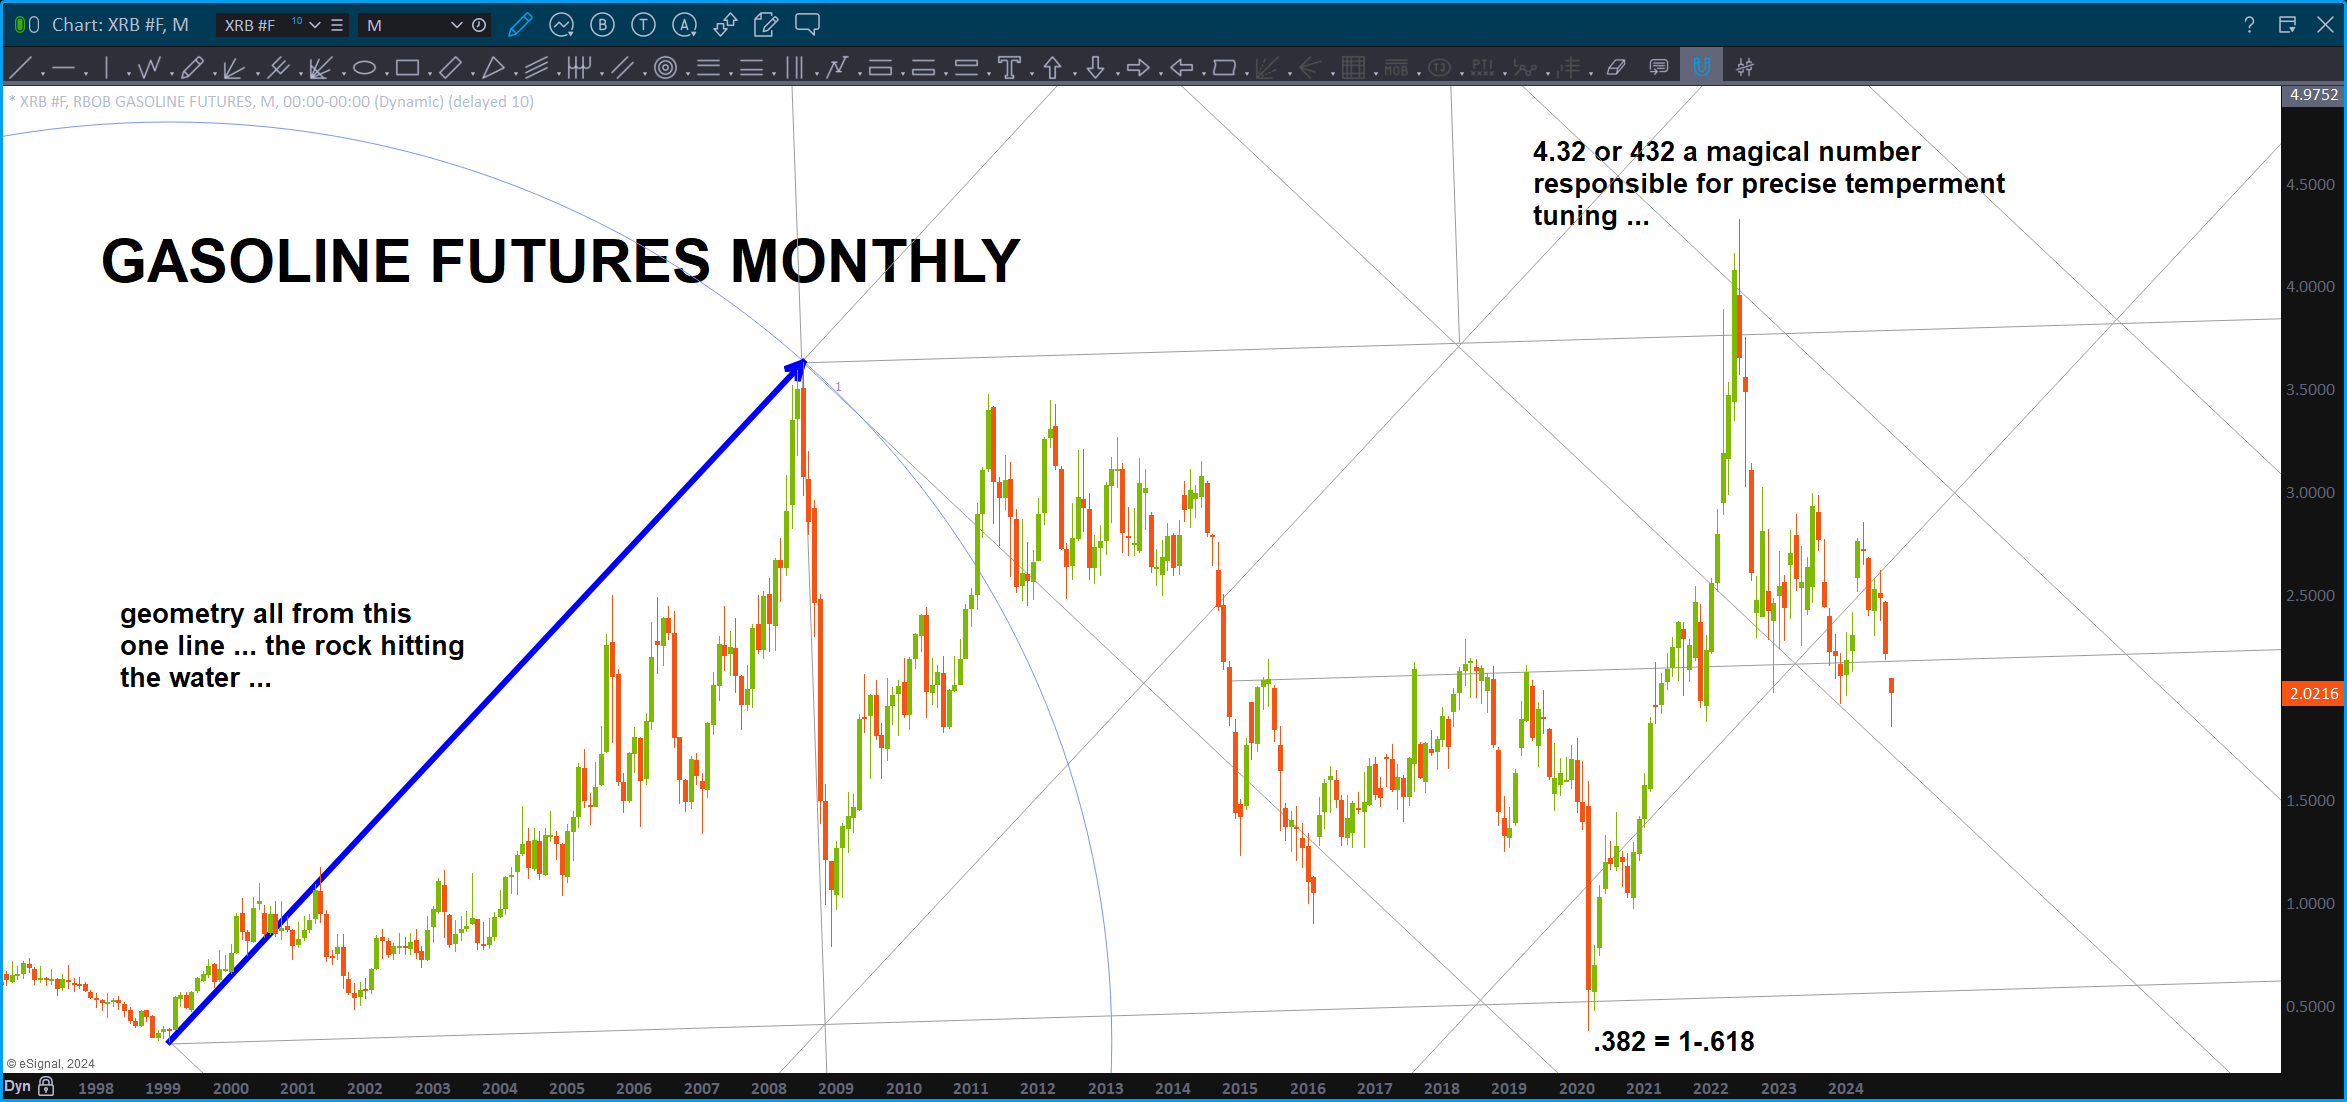
In an upcoming 3 part series w/ JC, I explain sacred geometry and it’s use in managing risk. As we all know, the ONLY thing we can control is how much money we can lose because once we enter the market, there is nothing we can do … we are the whim of the market.
Sacred geometry w/ it’s fractals and ratios and PATTERNS is simply one of MANY methods to manage risk in the markets. In the video I show that each pivot is ‘usually’ the result of ‘unknown’ or ‘hidden’ trend lines which are created from that initial impulse move.
That move, whether up or down, represents the primoridal ‘rock hitting the water’
Depending on how high, the mass and the depth of the water, once that rock is dropped into the water it creates WAVES based on the impact force from that drop. That’s it …
I enjoy drawing geometry … this AM I drew my geometry before Brain Tapping on the charts.
Enjoy – do it yourself.
Just create circles, squares and triangles … a ‘holy trinity’ of sorts. 😉
Take the time to draw it yourself OR just follow the PRICE from the all time low which created the first radius vector (big thick blue line) – watch how price reacts to these ‘unknown’ trend lines.
Jeff Conway – September 23, 2024
Posted on September 23, 2024 10 Comments

One of the most relentless and unforgiving diseases, ALS, is gaining ground on my dear friend, Jeff Conway.
Rugger. Naval Officer. Brilliant. I had the honor of visiting him in Hawaii last year, and I’m so grateful I did. Despite everything, his spirit was always high, and his humor—unforgettable.
This morning, I took time to meditate and reach out to him in my own way. I wanted to remind him of the incredible strength, joy, and dignity he continues to embody.
In Rugby, a game we both loved, there’s a phrase we use: “with you.” It’s simple but powerful. When someone calls out “with you” on the pitch, the player carrying the ball knows, without question, that their teammate is there—ready to support them, no matter what.
Jeff, right now, I want you to know that every Rugger who stood beside you on the field, shared a drink, and laughed with you, is with you now.
As we’ve said before, brother, you’re never out of the fight.
With you.

IBM – September 23, 2024
Posted on September 23, 2024 1 Comment

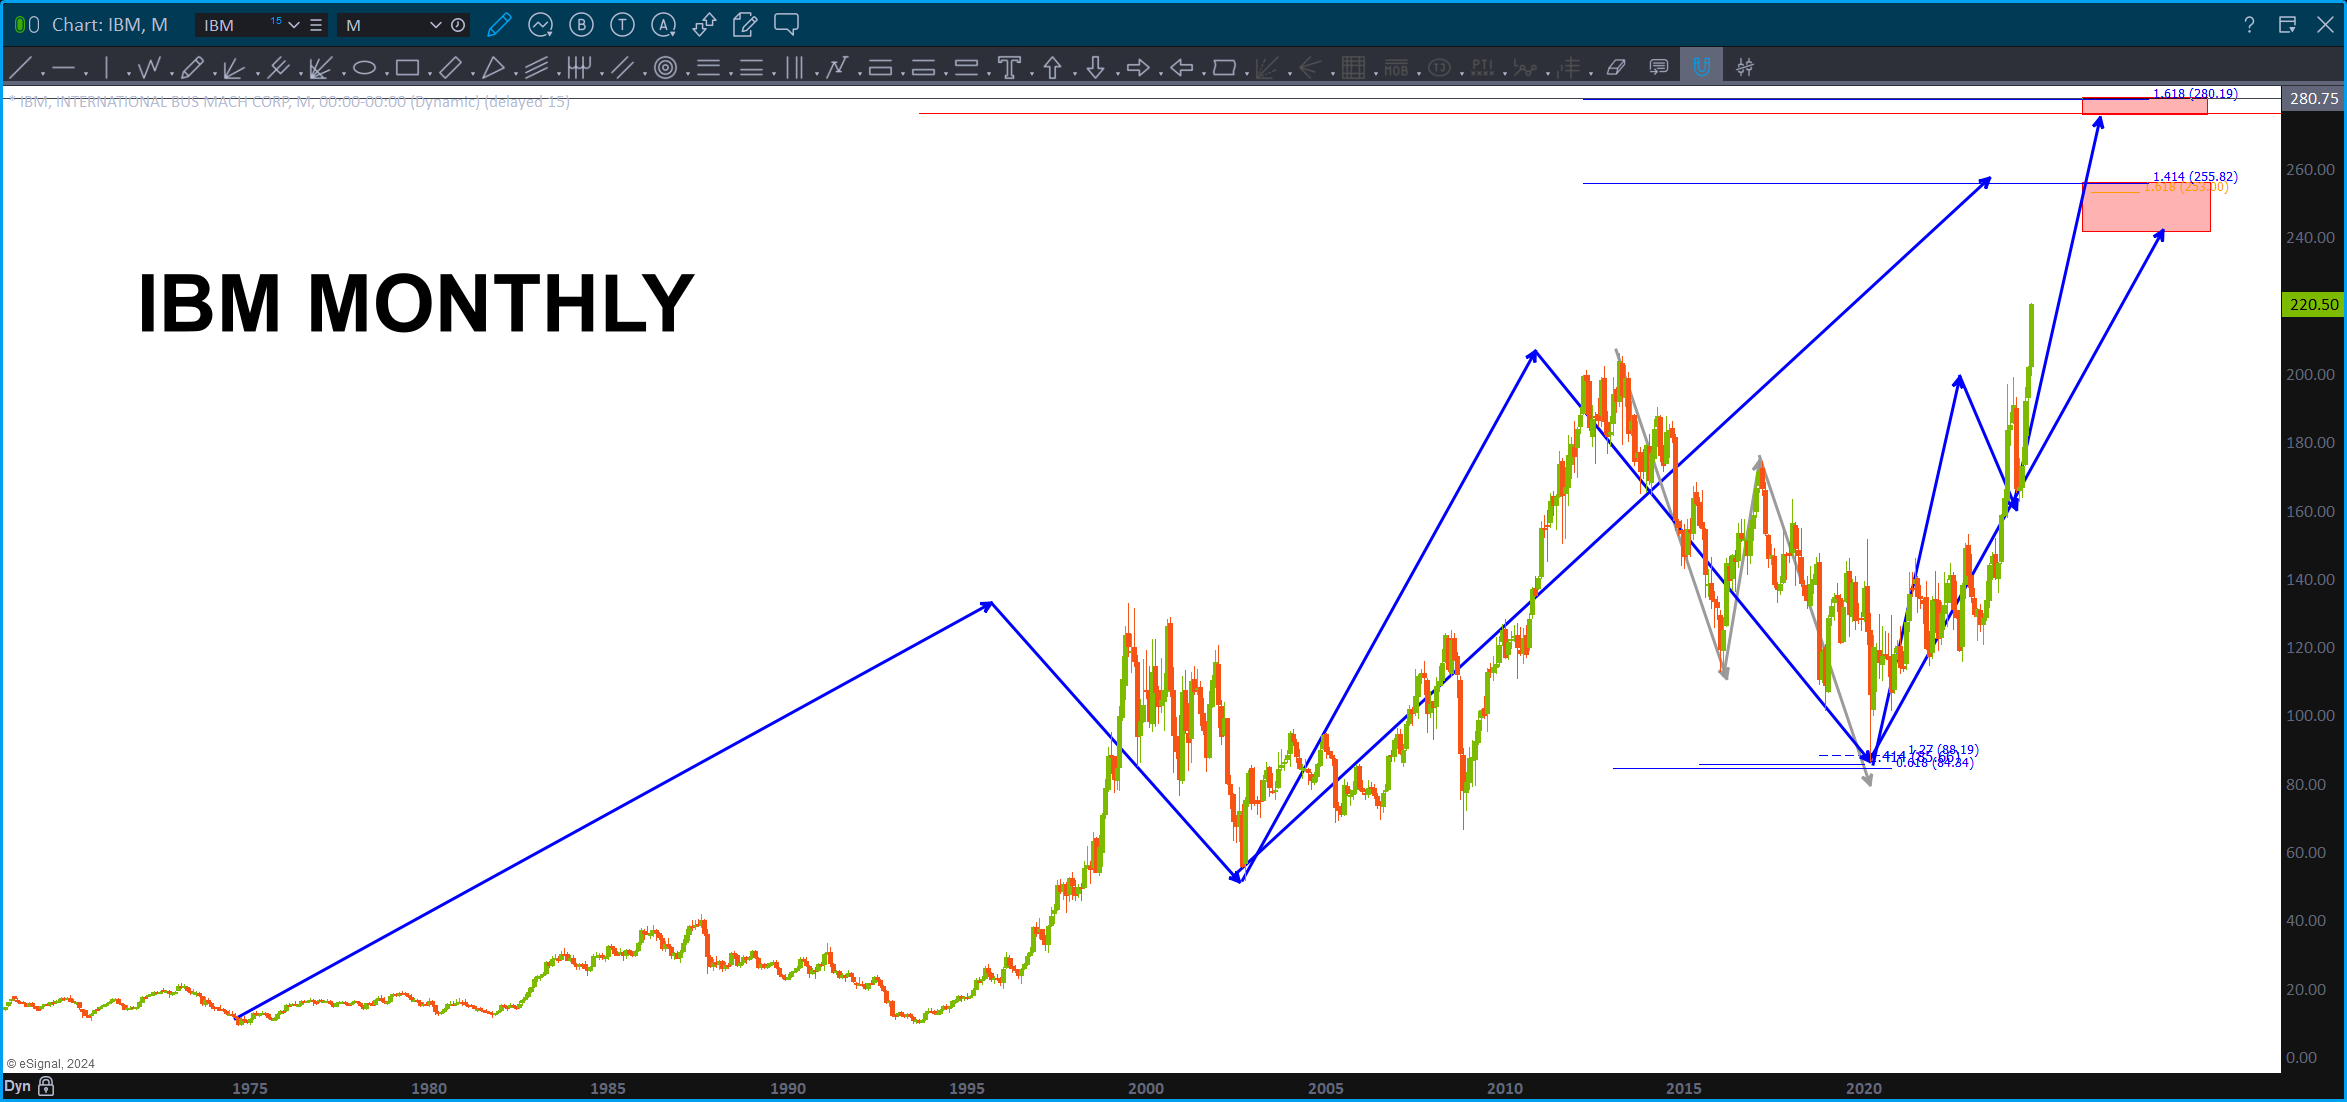
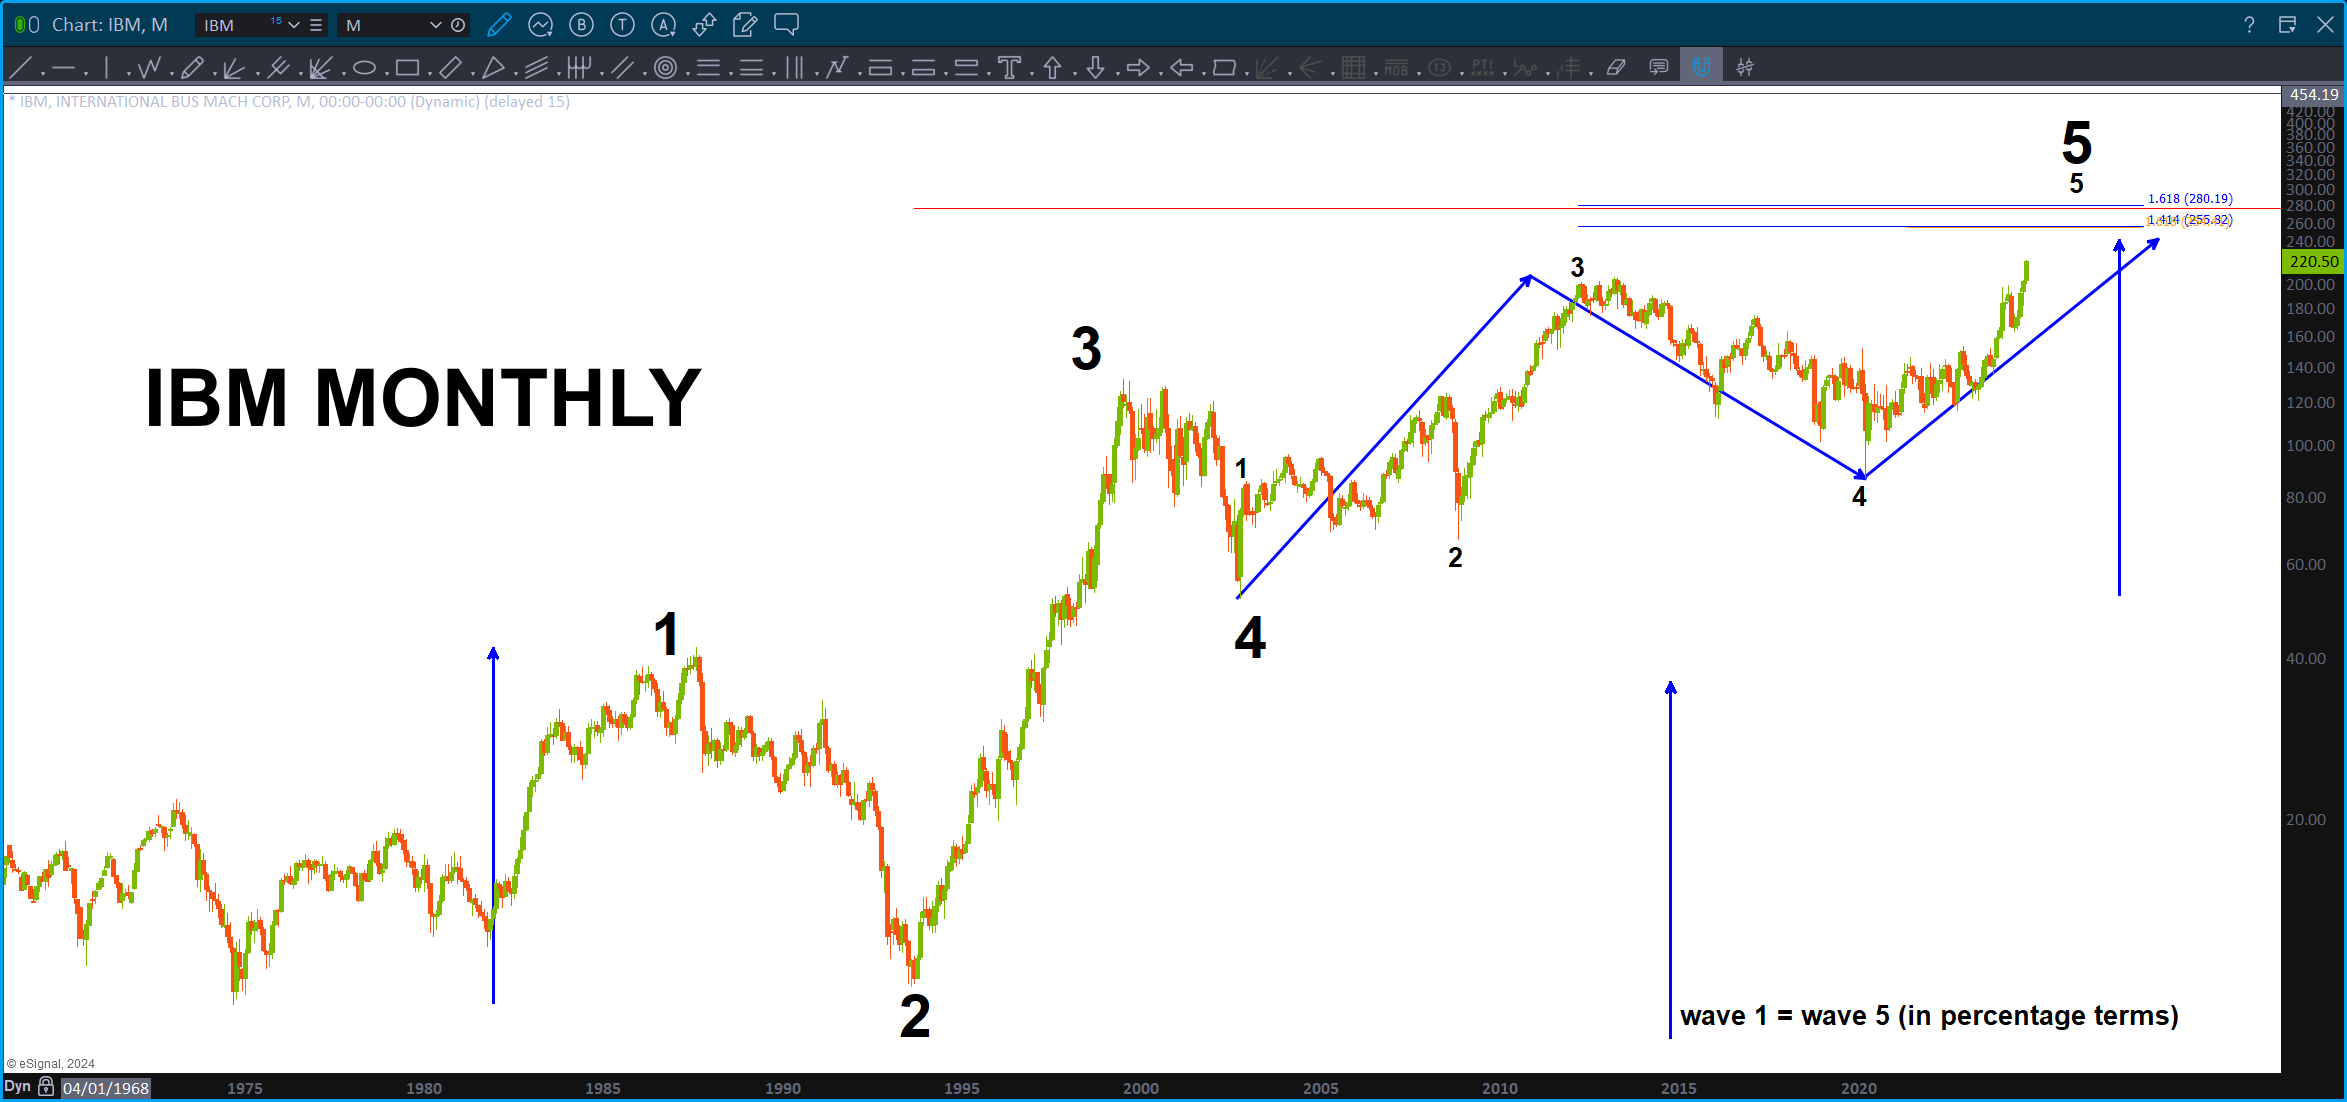
This has been a good run. Here was the low:
I went to LOG scale and did a count …doesn’t break any rules, but, again, my counting is like my golf game. I mean, it kind of makes sense, so just take it w/ a grain of salt.
NASDAQ Composite – 9/22/2024
Posted on September 22, 2024 Leave a Comment

I’ve put a ‘rudimentary’ count together on the NASDAQ and from a price perspective, it does not violate any rules of Elliott BUT notice how LONG (time) wave 1 and wave 3 were …?
Might be a hard argument to win that this is THE 5th wave …maybe 1 of 5 but I do think we have some resistance here or a little higher.
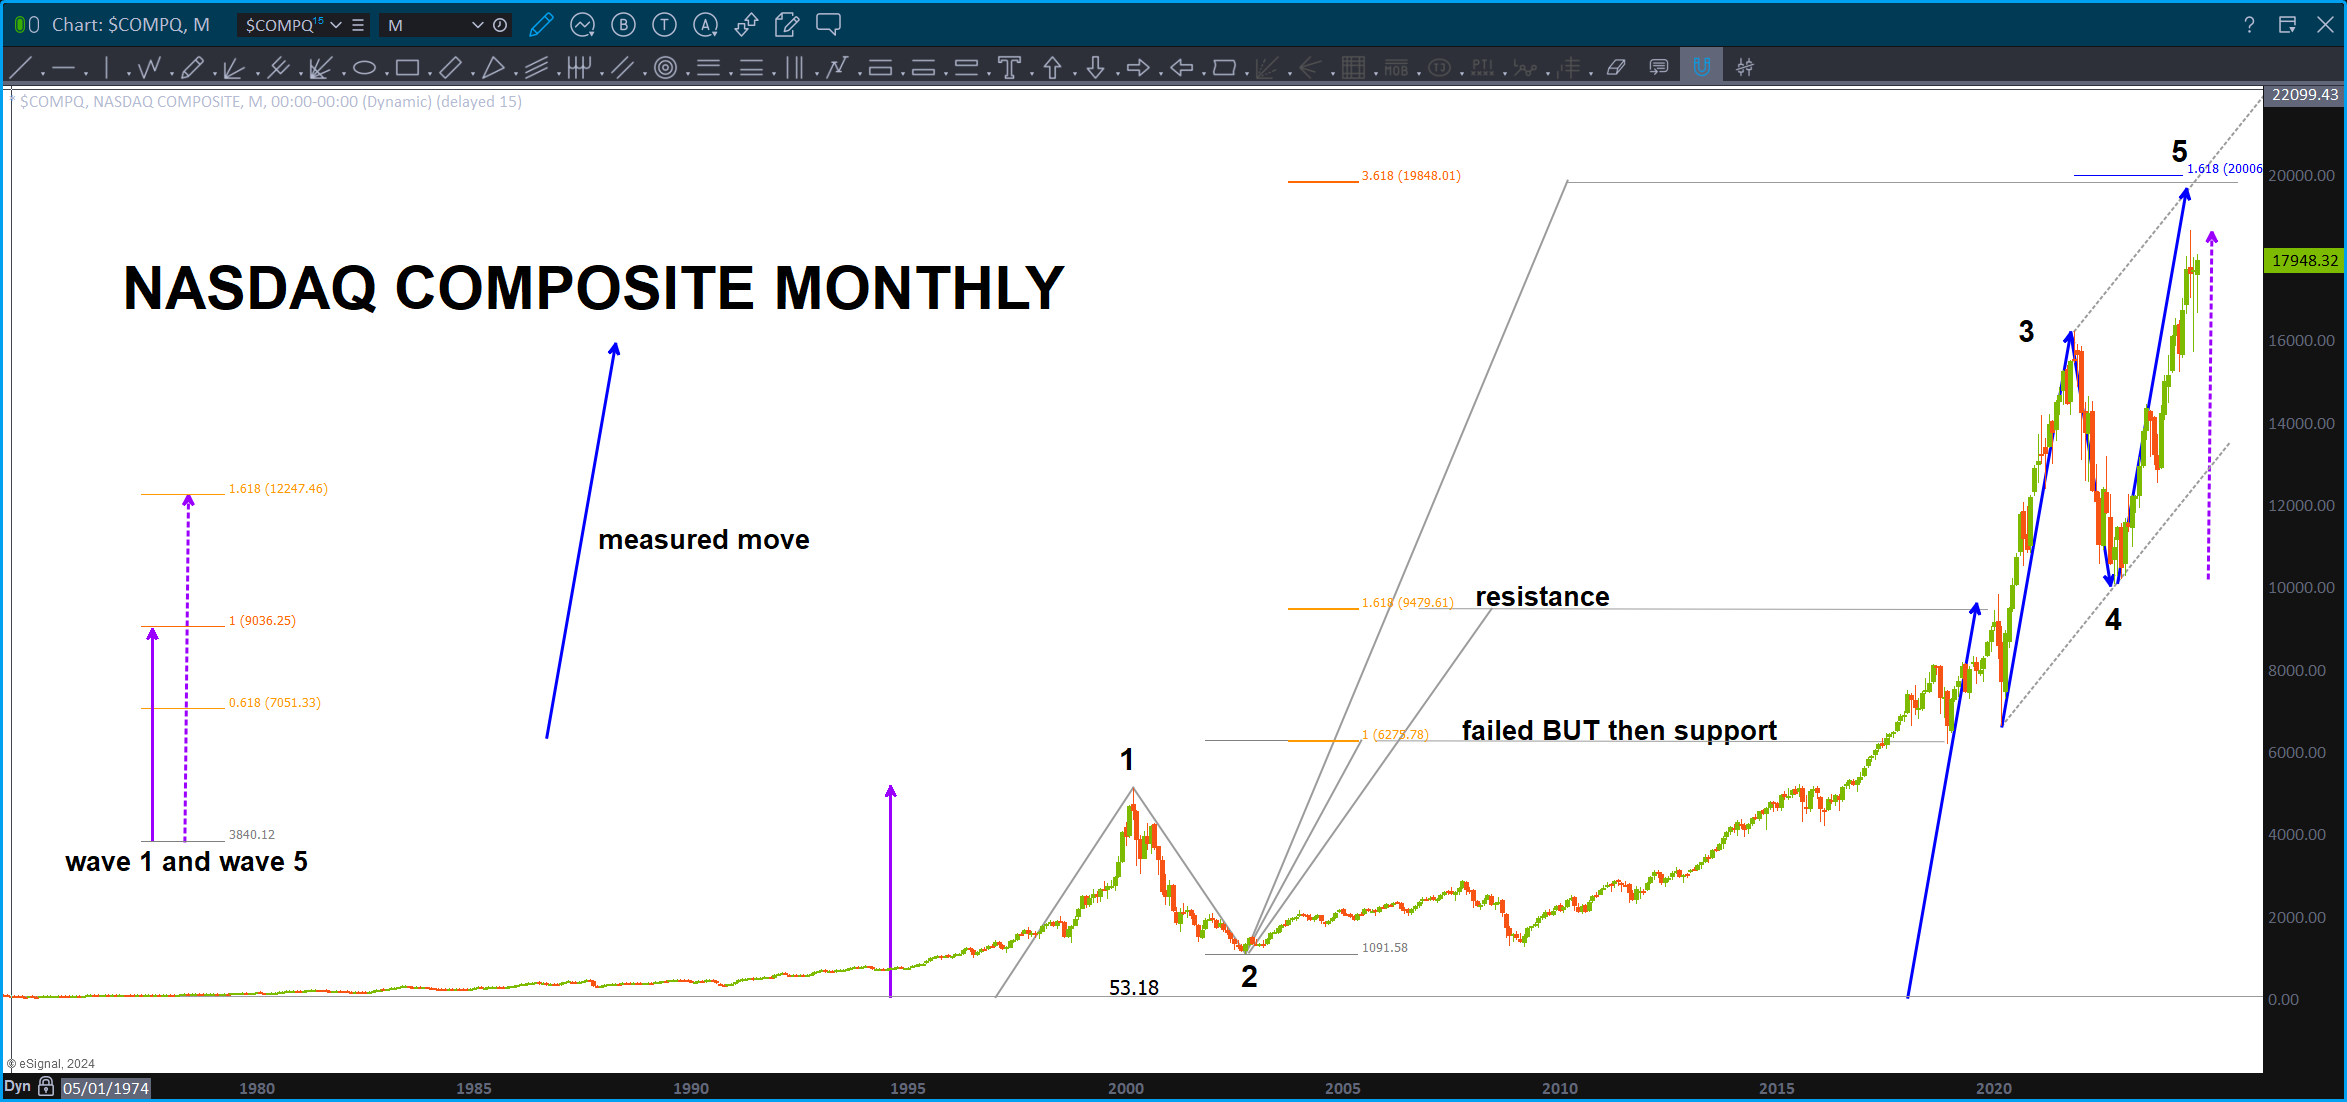
Interestingly enough, the all time high, so far, on the NASDAQ was exactly equal to 1.618 * wave 1.
NY Stock Exchange Index – September 22, 2024
Posted on September 22, 2024 1 Comment

Folks,
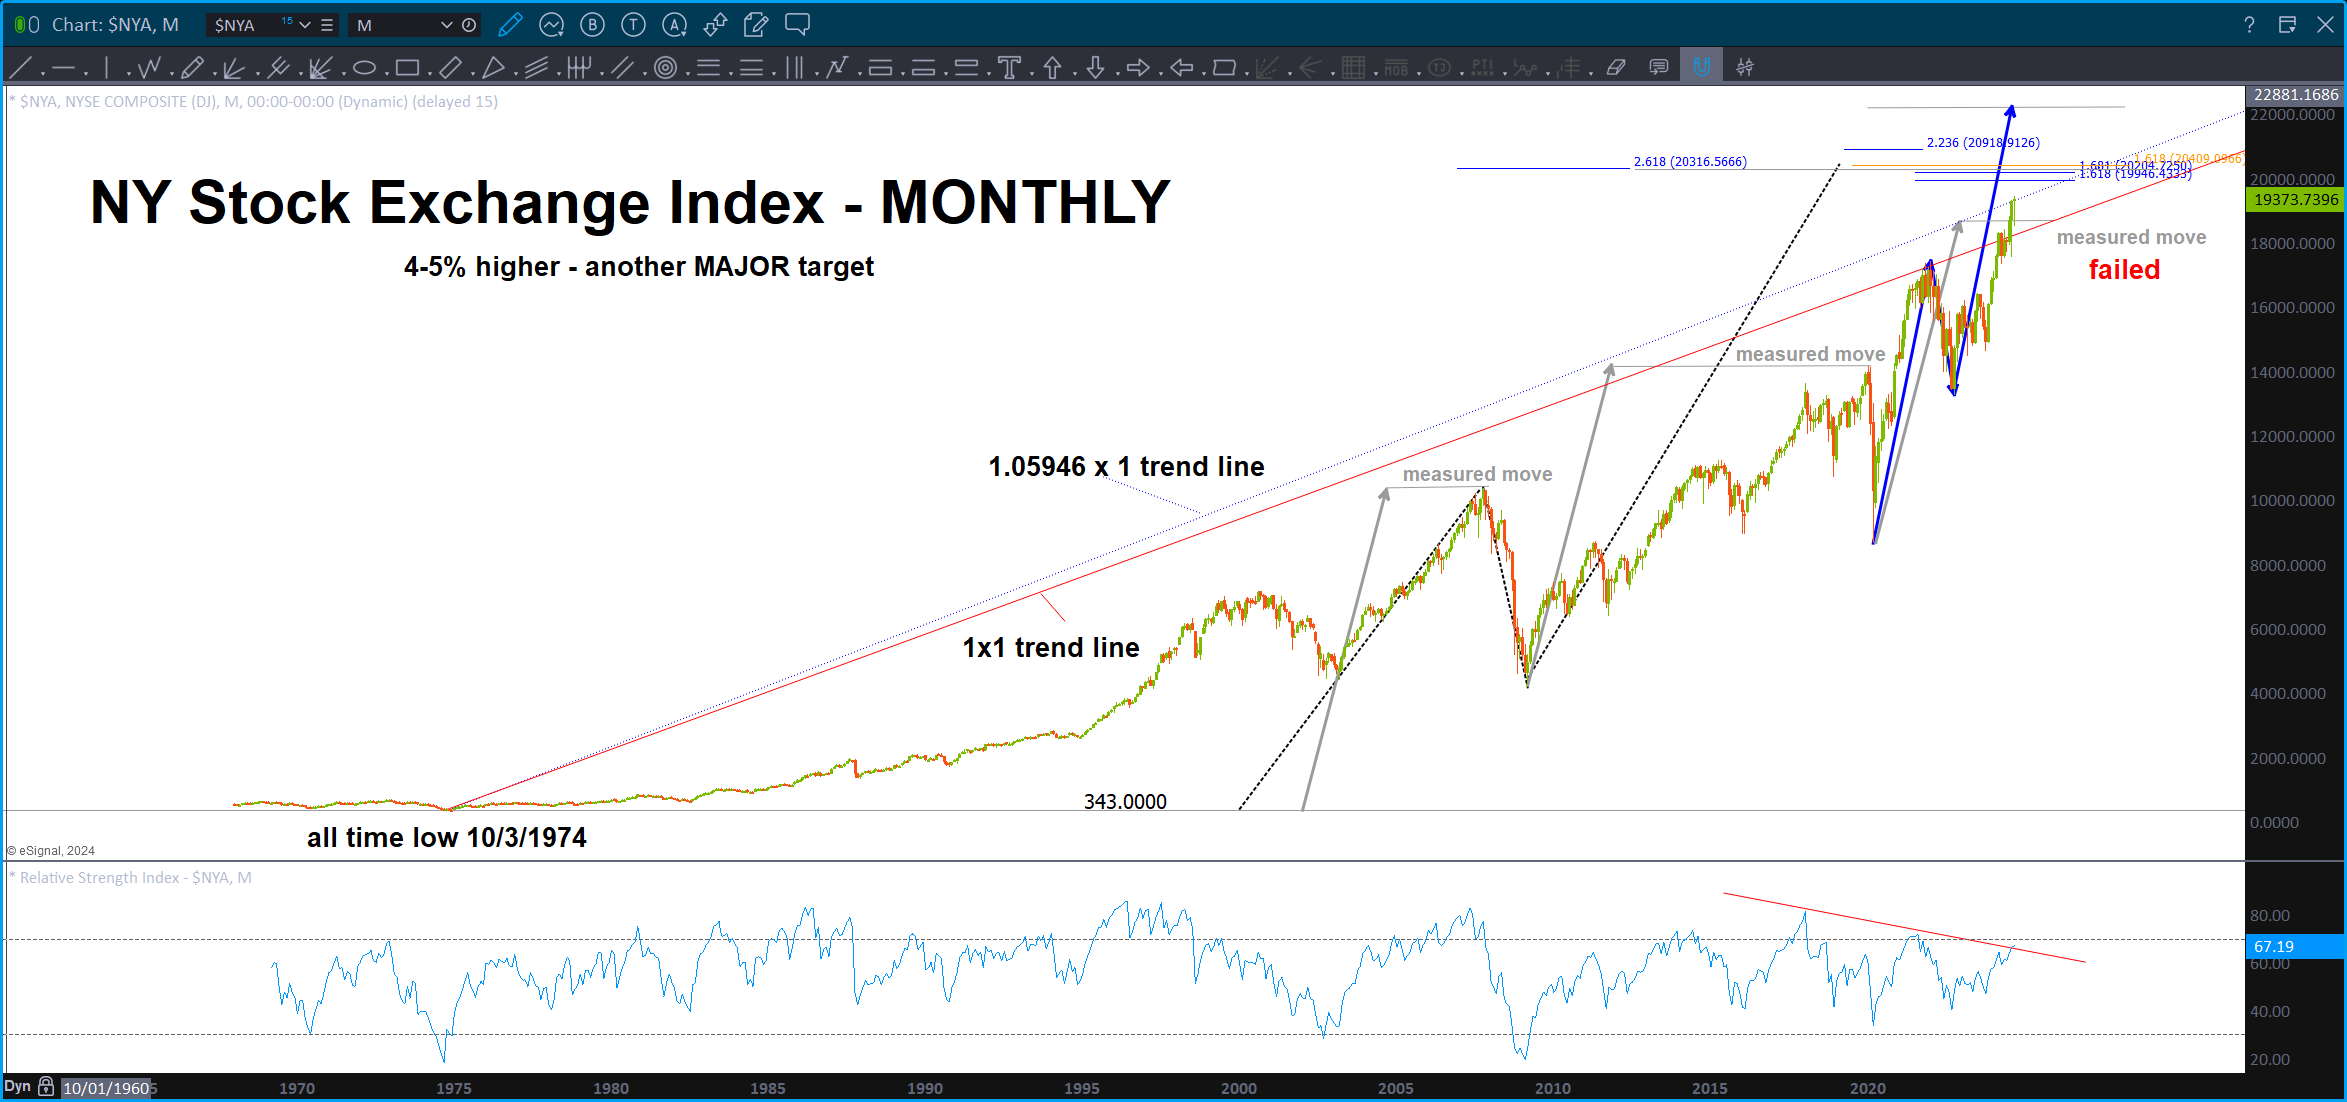
have to admit, somewhat ‘surprised’ at the continued strength of the US equity indices.
the YEN ‘surprise’, the all time low square out on the NYA, the perfectly harmonic measured moves on the DJIA, etc. etc. etc. and the market just doesn’t seem to care.
so, we have ‘another’ major target on the NYA a little higher (about 4-6%) and that “SHOULD” cause resistance but …who knows.
Metals – September 21, 2024
Posted on September 21, 2024 Leave a Comment

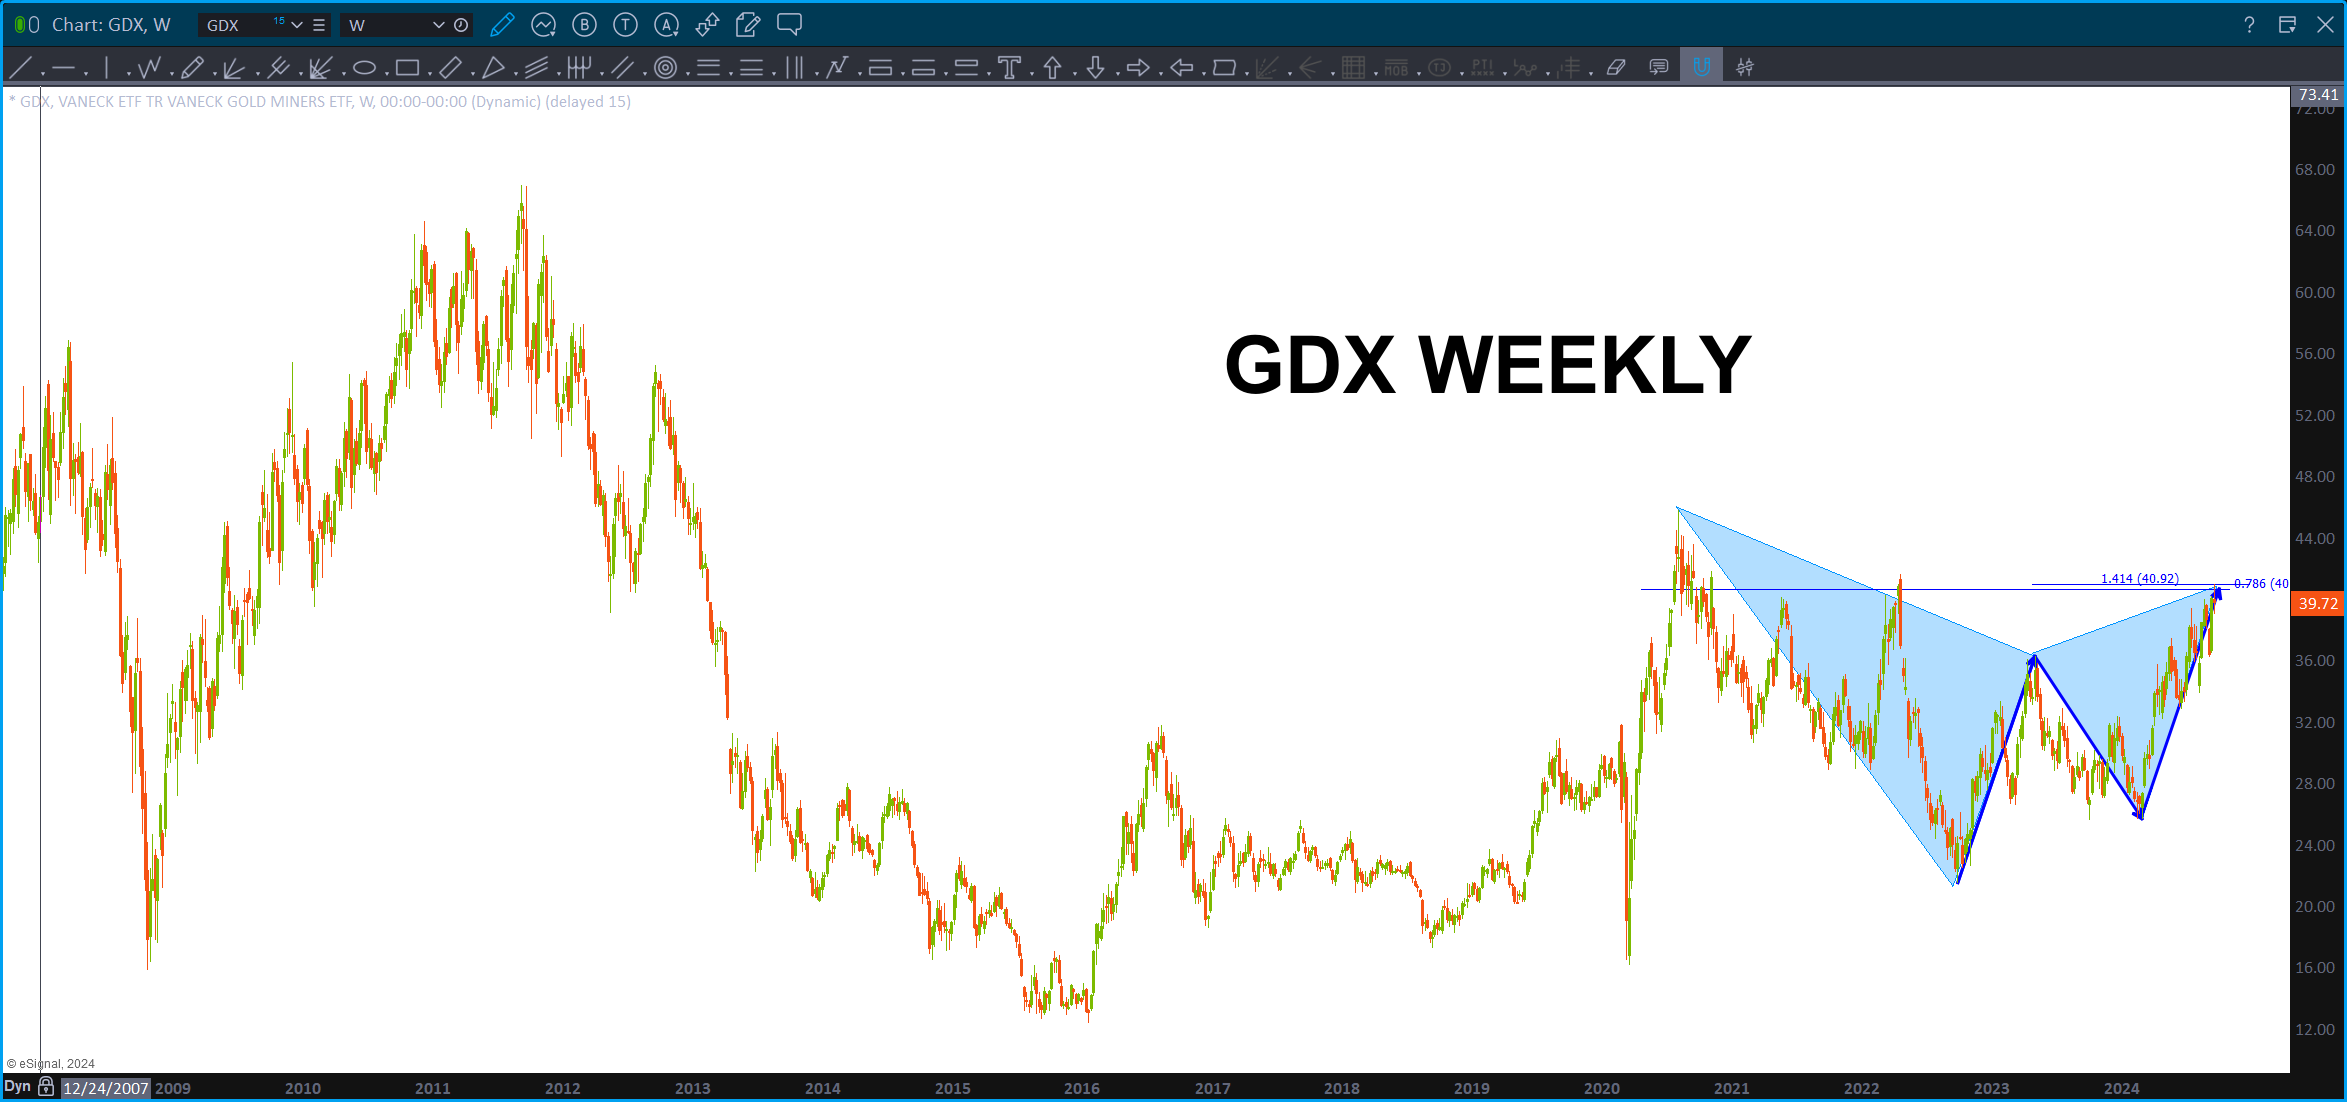
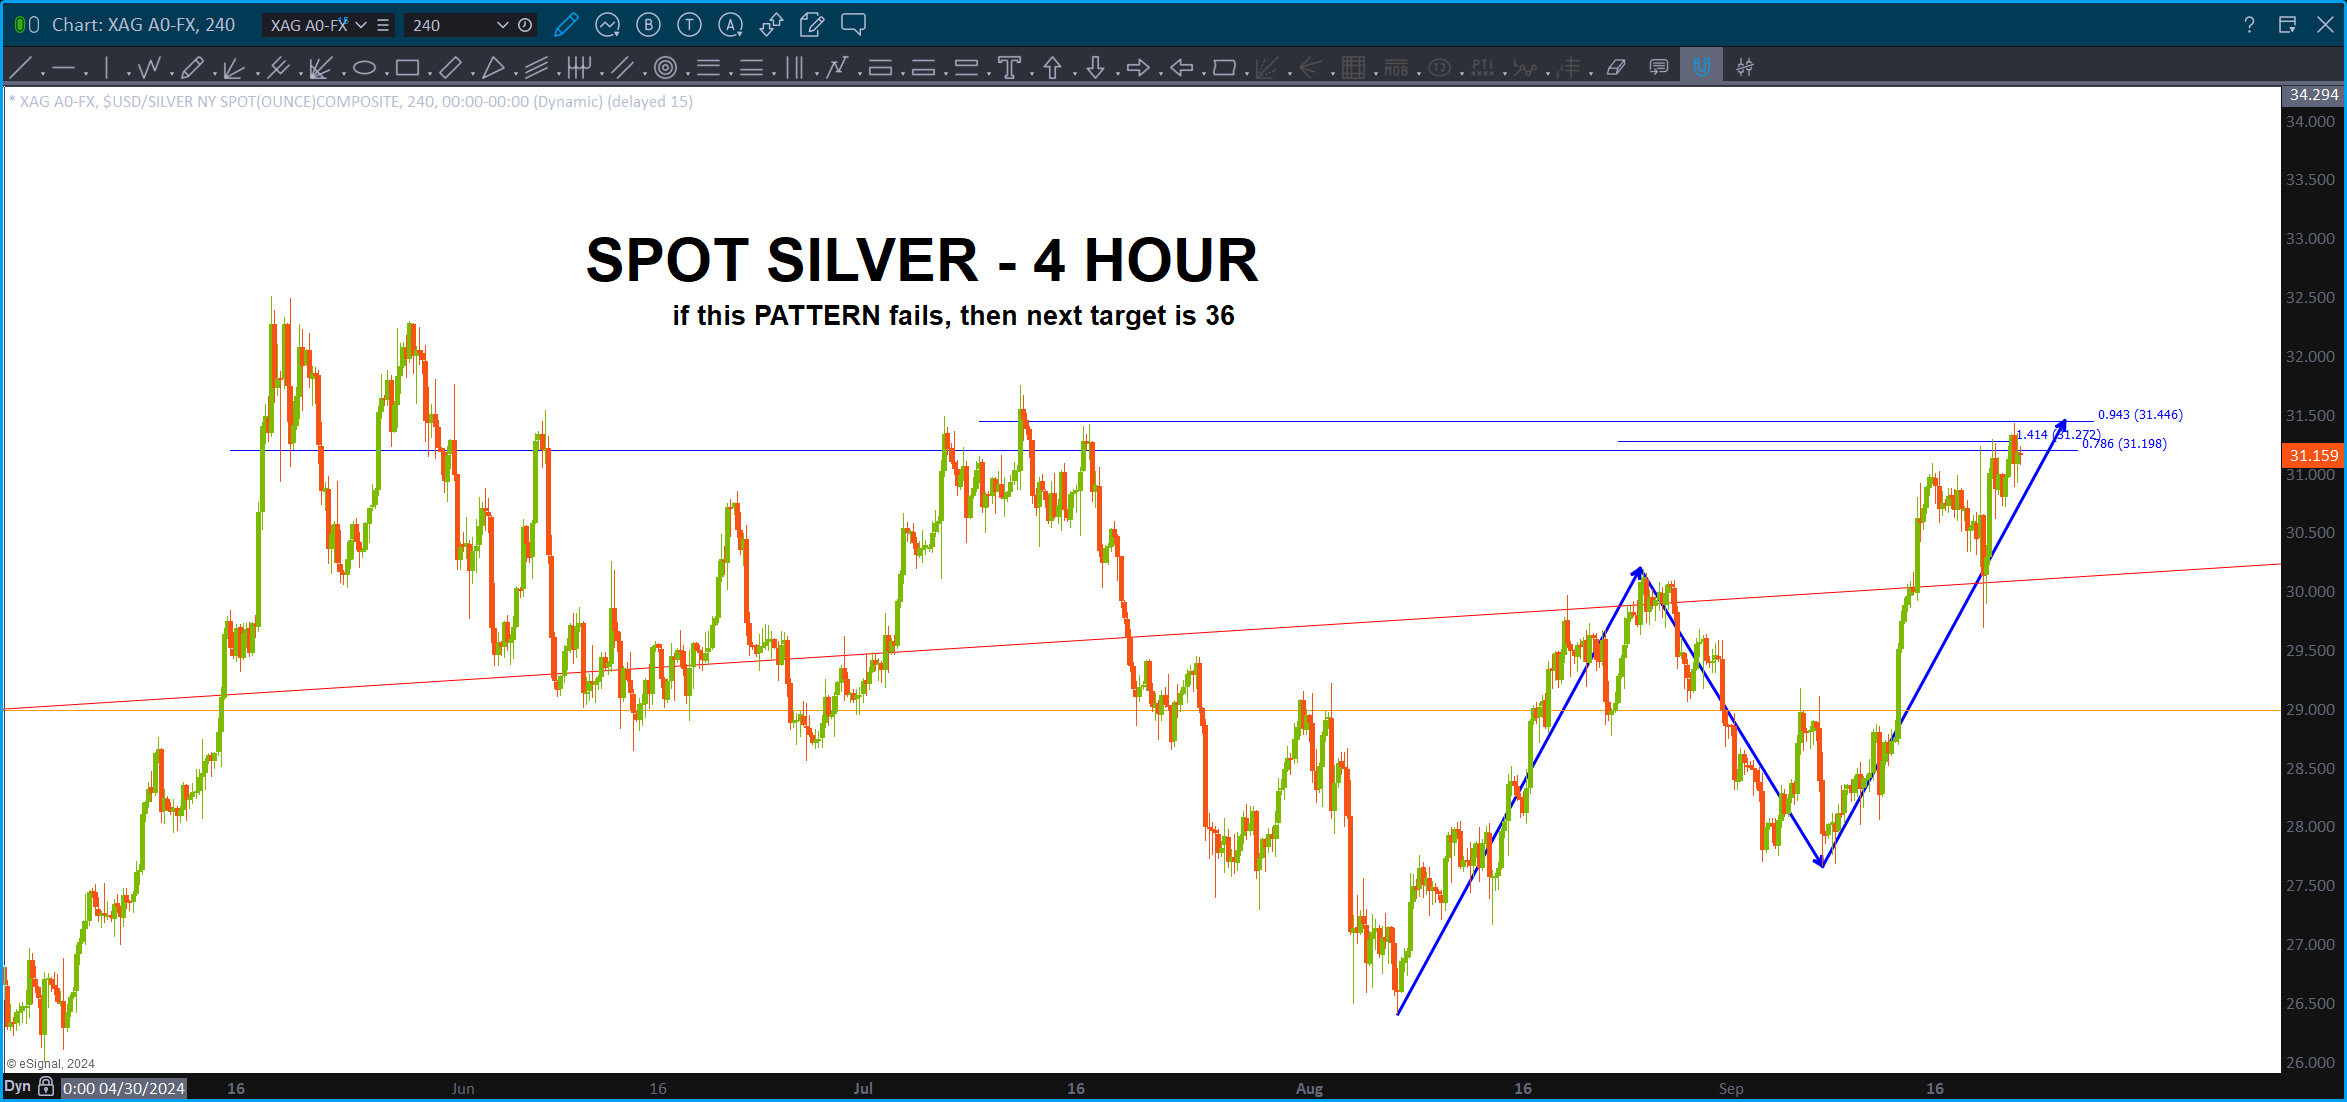
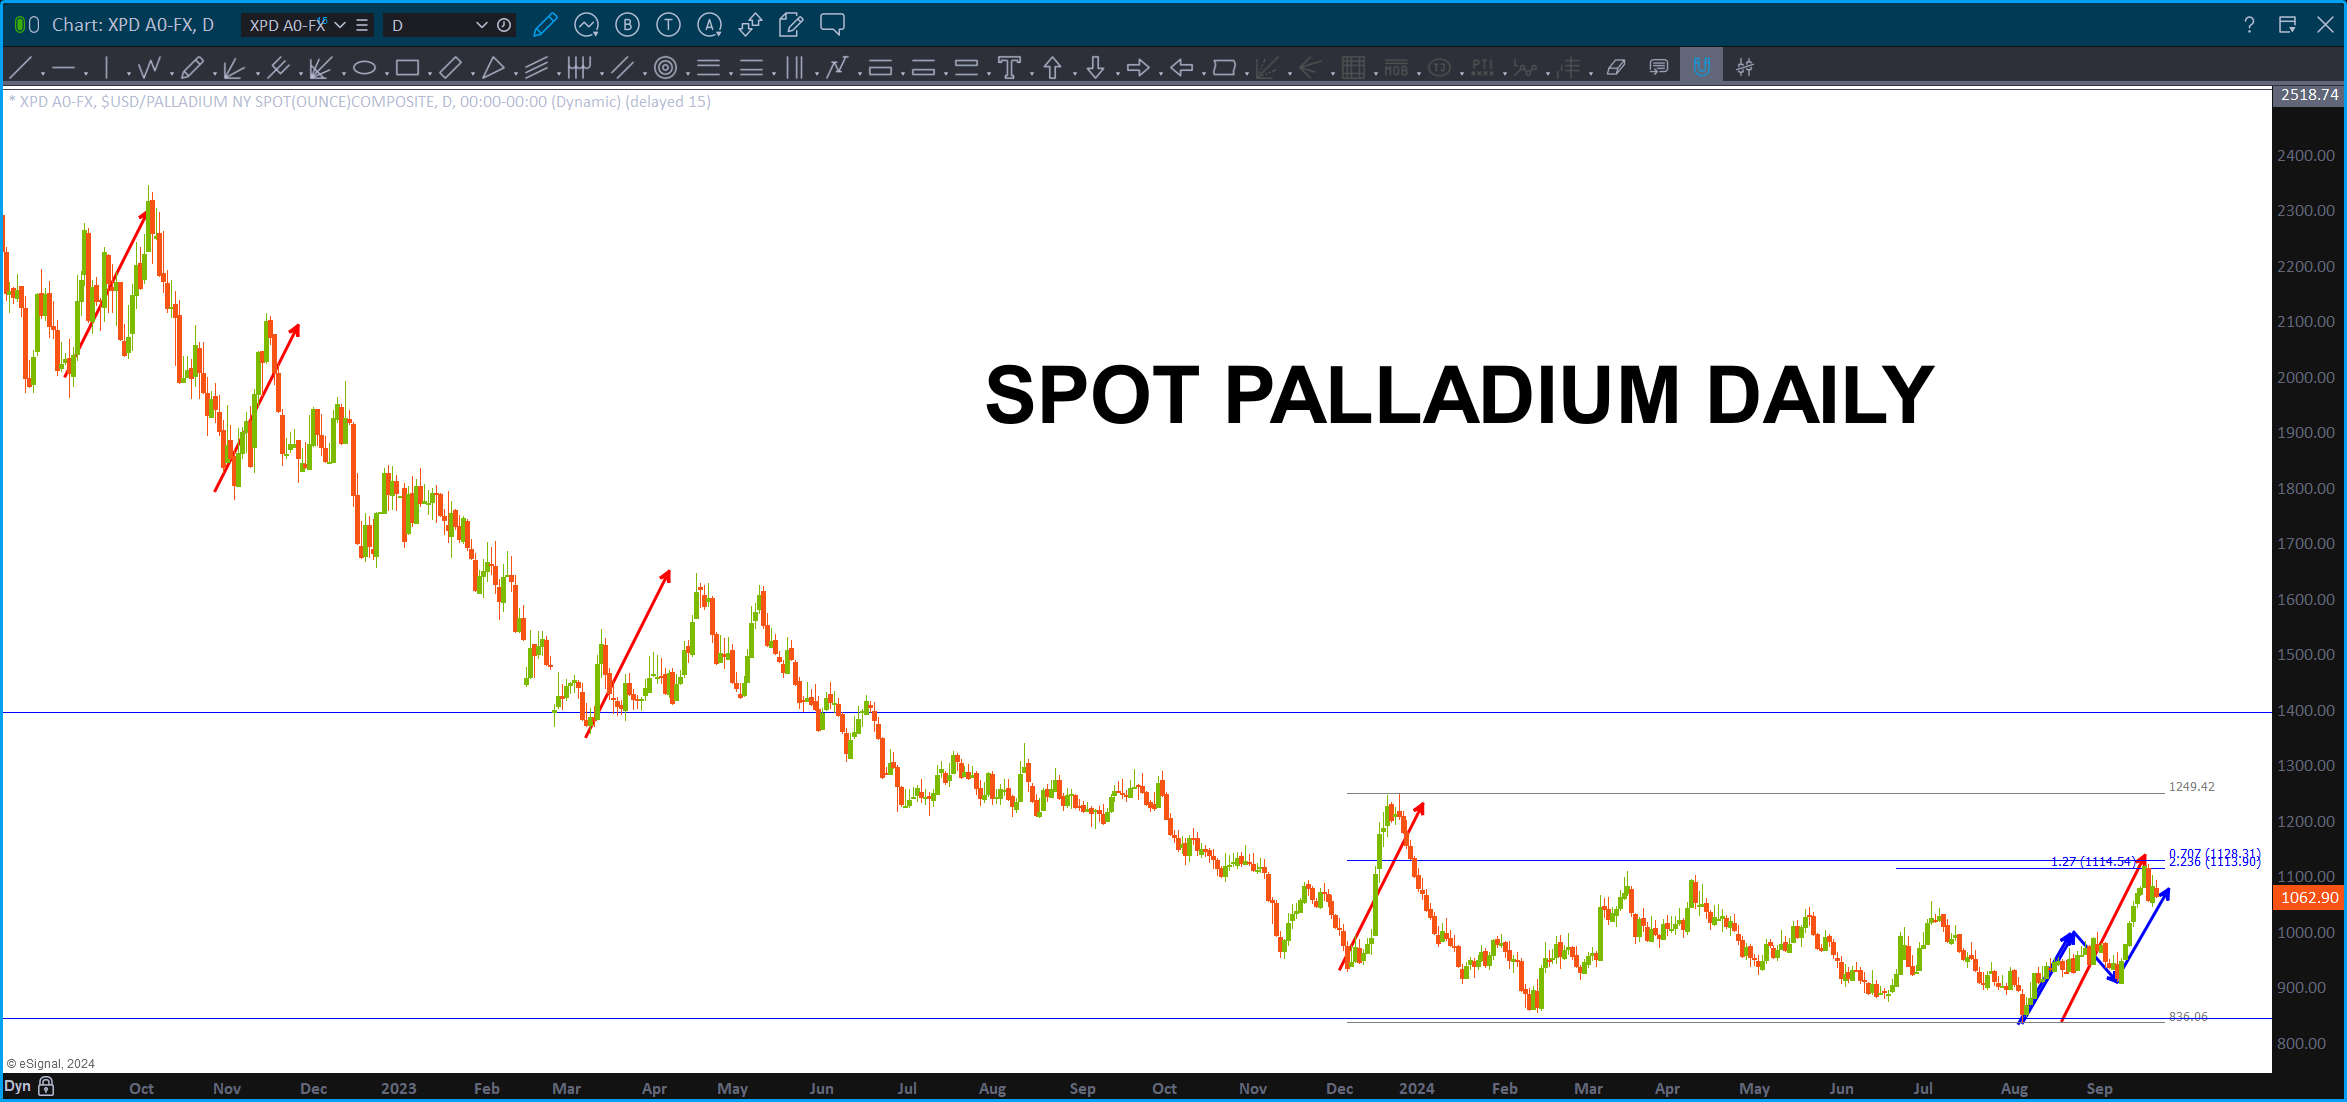
Across the board, the metals are hitting big sell signals. As is the case w/ PATTERNS, we really DO NOT know which ones will work and which ones won’t … but when they all pretty much lineup like they all are now, then something ‘big’ usually occurs.
Mind you, the ‘big’ can be PATTERN failures across the board (the sell signals all fail w/ a daily close above the levels shown below) OR the PATTERNS work and the metals are at a pretty big inflection point and …down they go.
This is a VERY interesting time w/ regard to the ‘circle of life’ (fixed income, FX, equities (global and CONUS) and commodities) … it’s really not a simple bet right now.
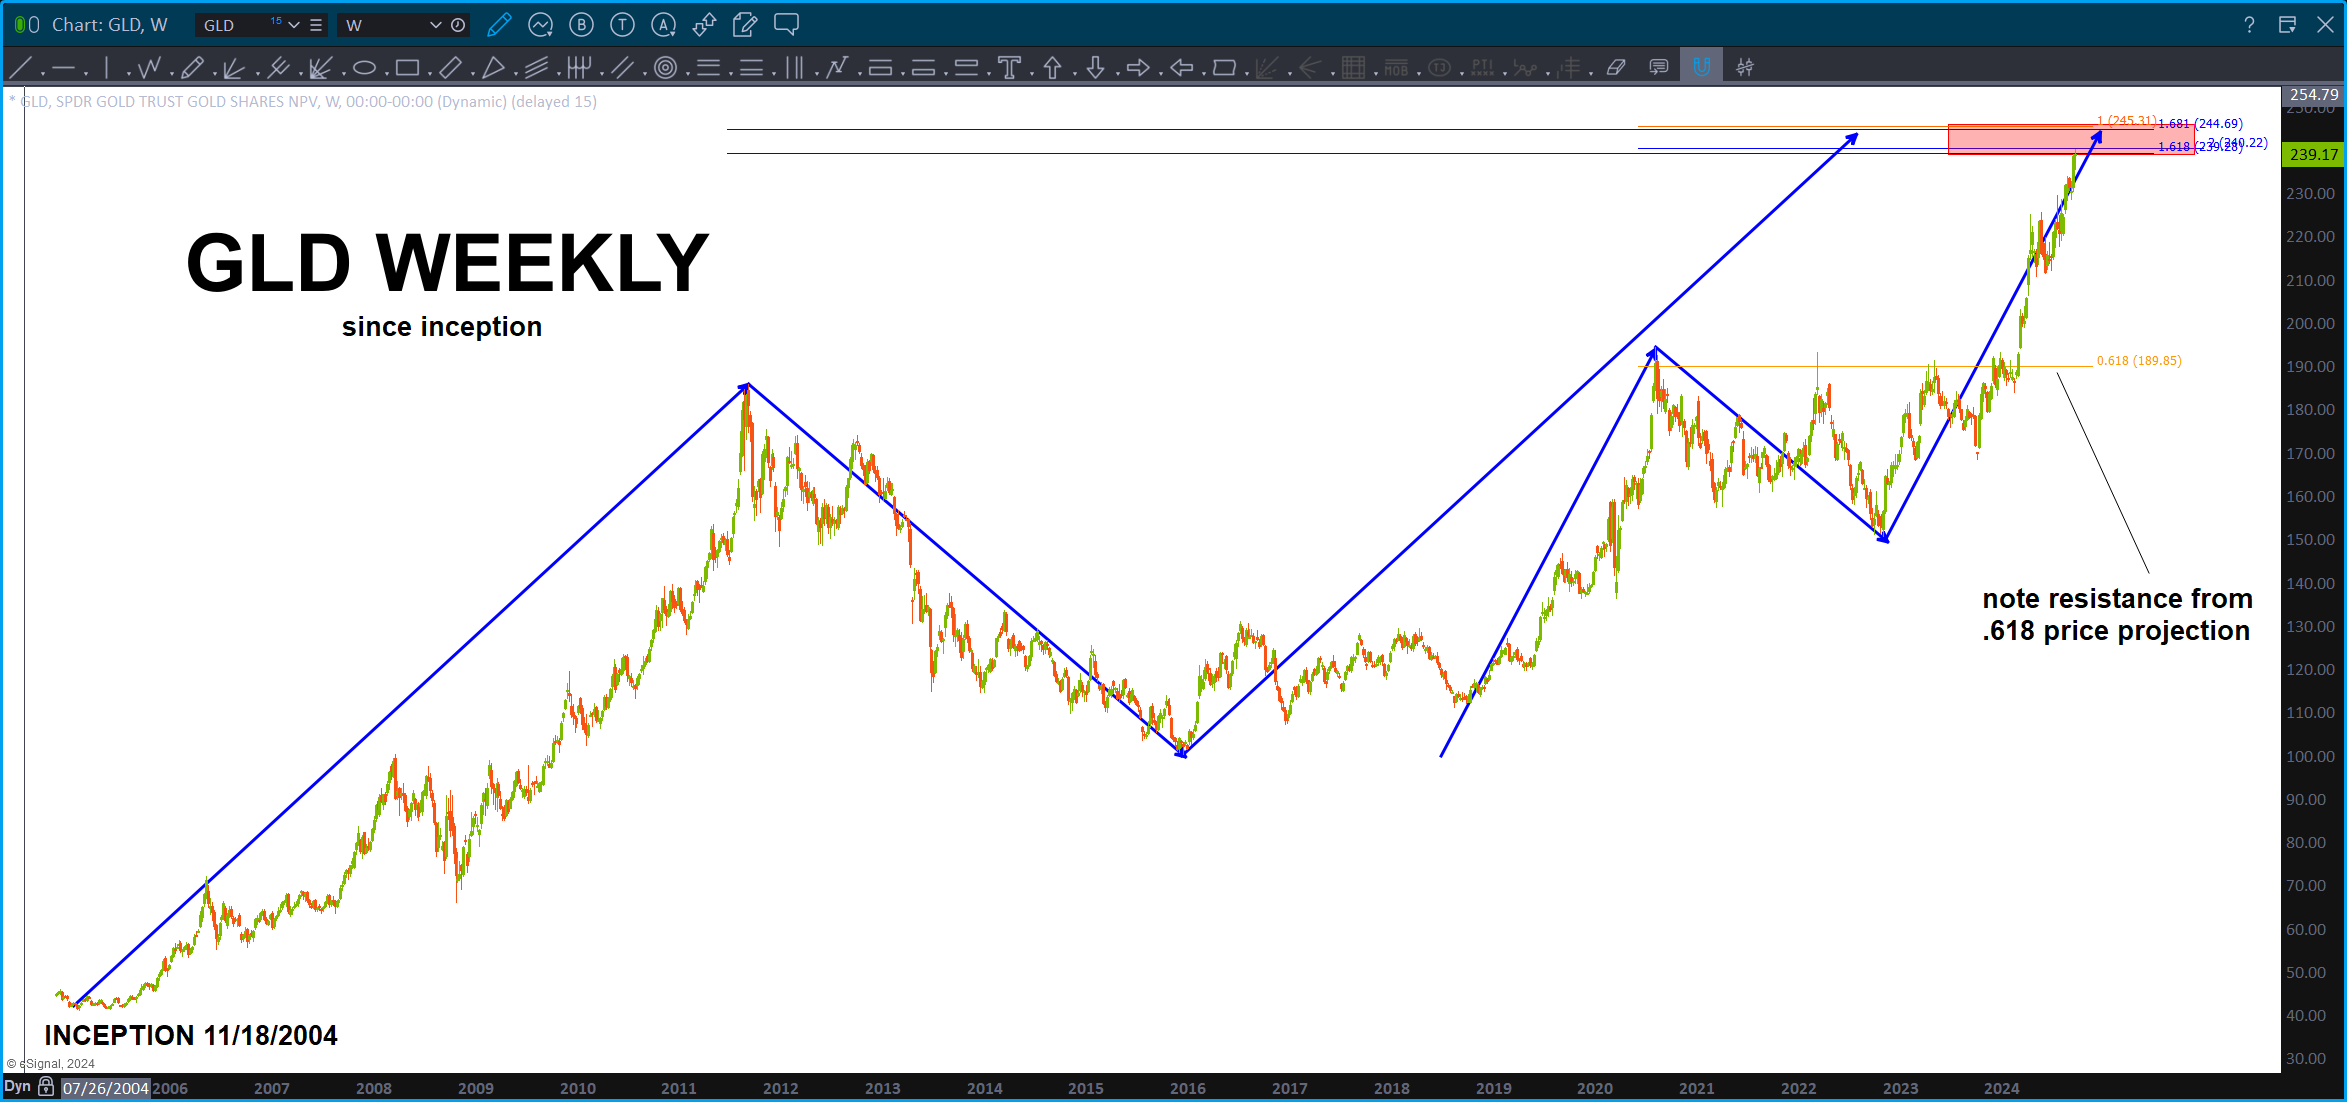
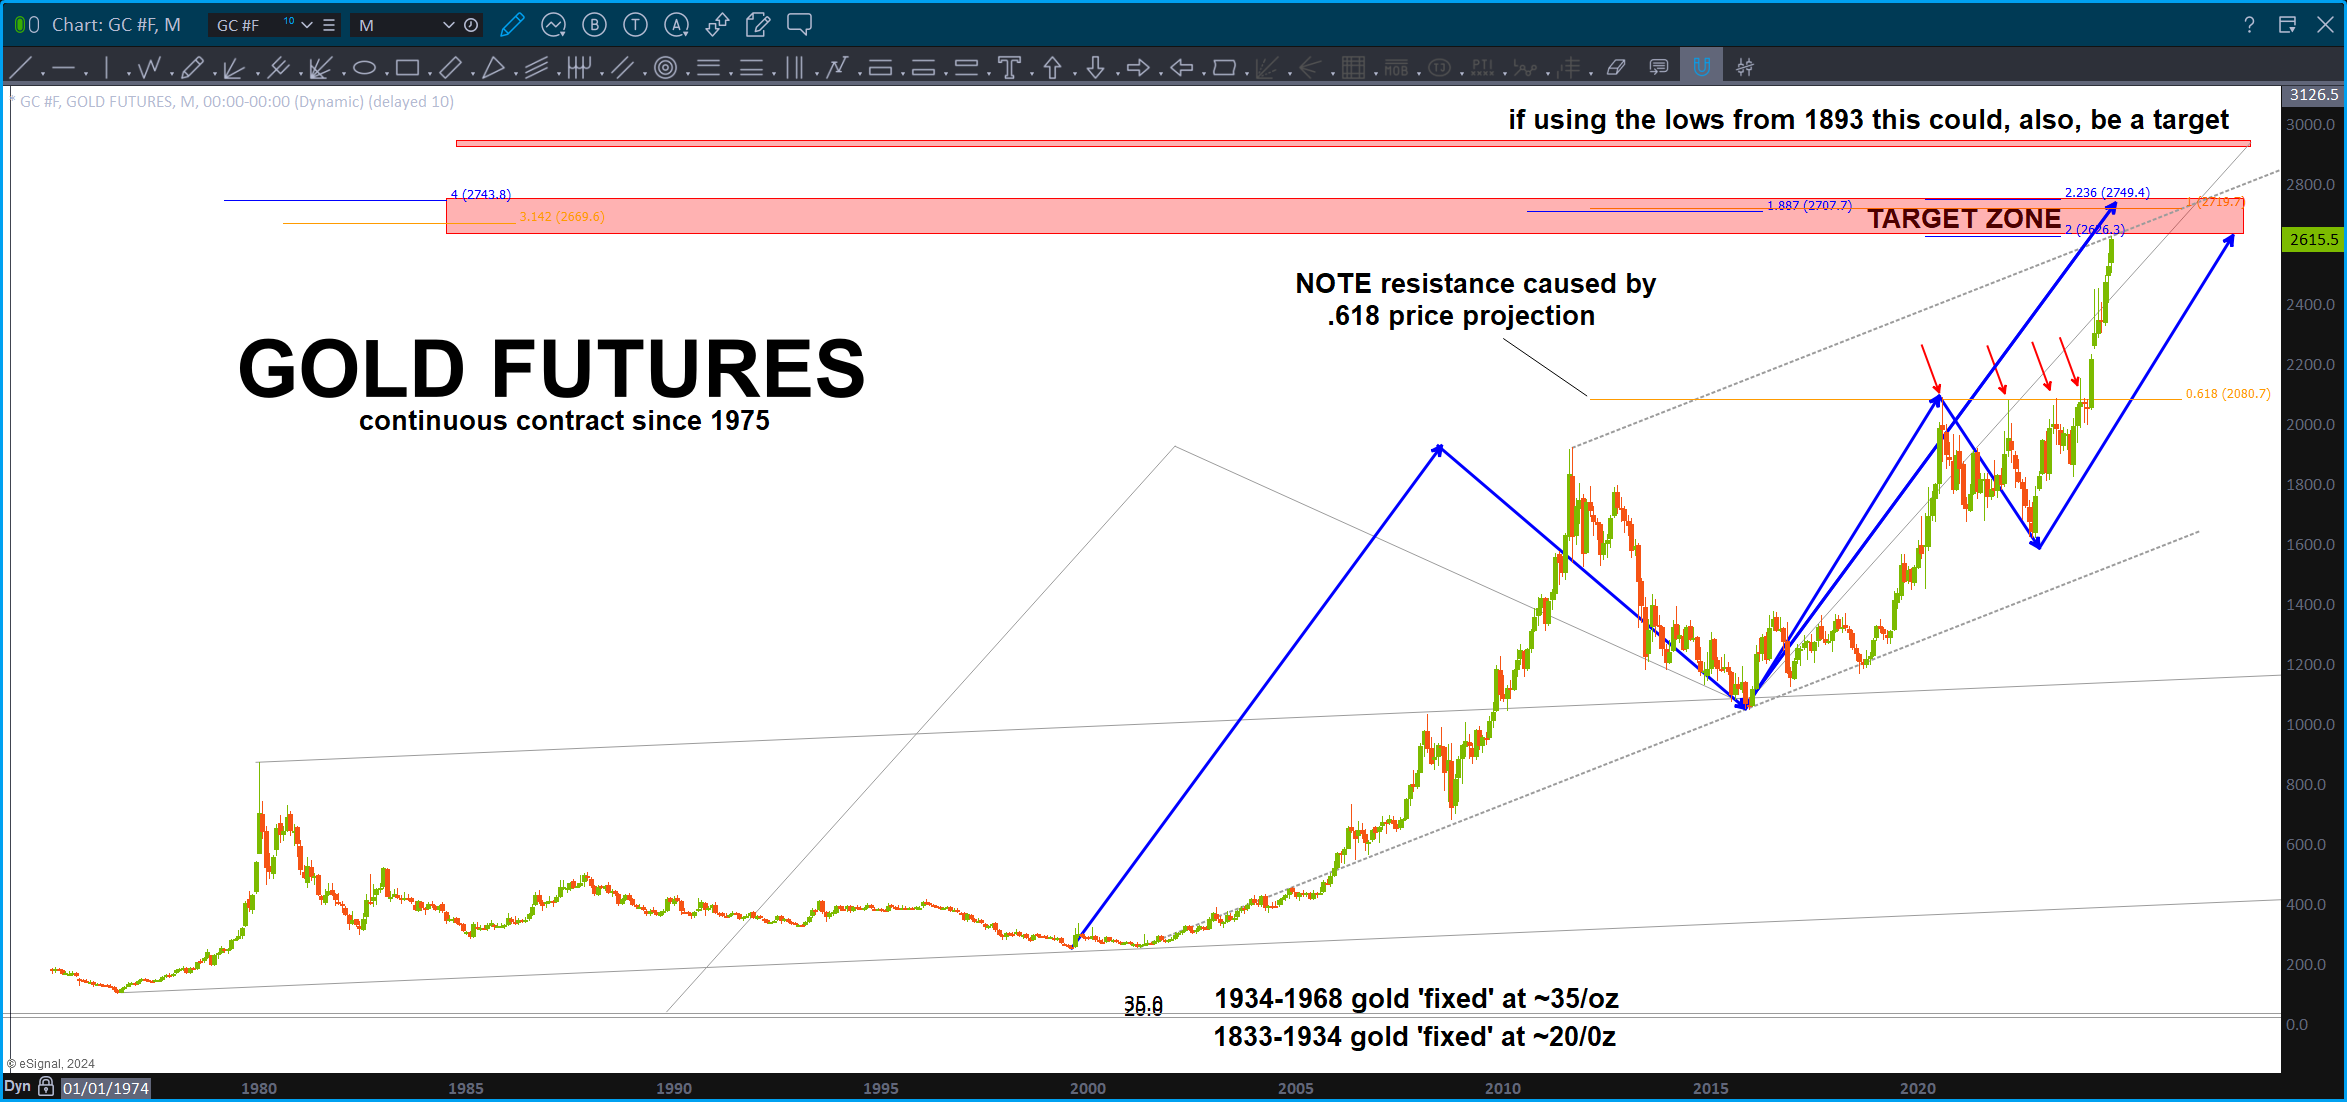
I posted yesterday about Gold. I mean, folks, it really doesn’t get any better than this. Long term ABCD’s are BIG DEALS. That, coupled w/ the rest of the metal sell patterns shown below, will make you realize that this is THE inflection point for the next couple months or, perhaps, year (s).
Gold: https://atomic-temporary-44460632.wpcomstaging.com/2024/09/19/gold-september-19-2024/
Silver:
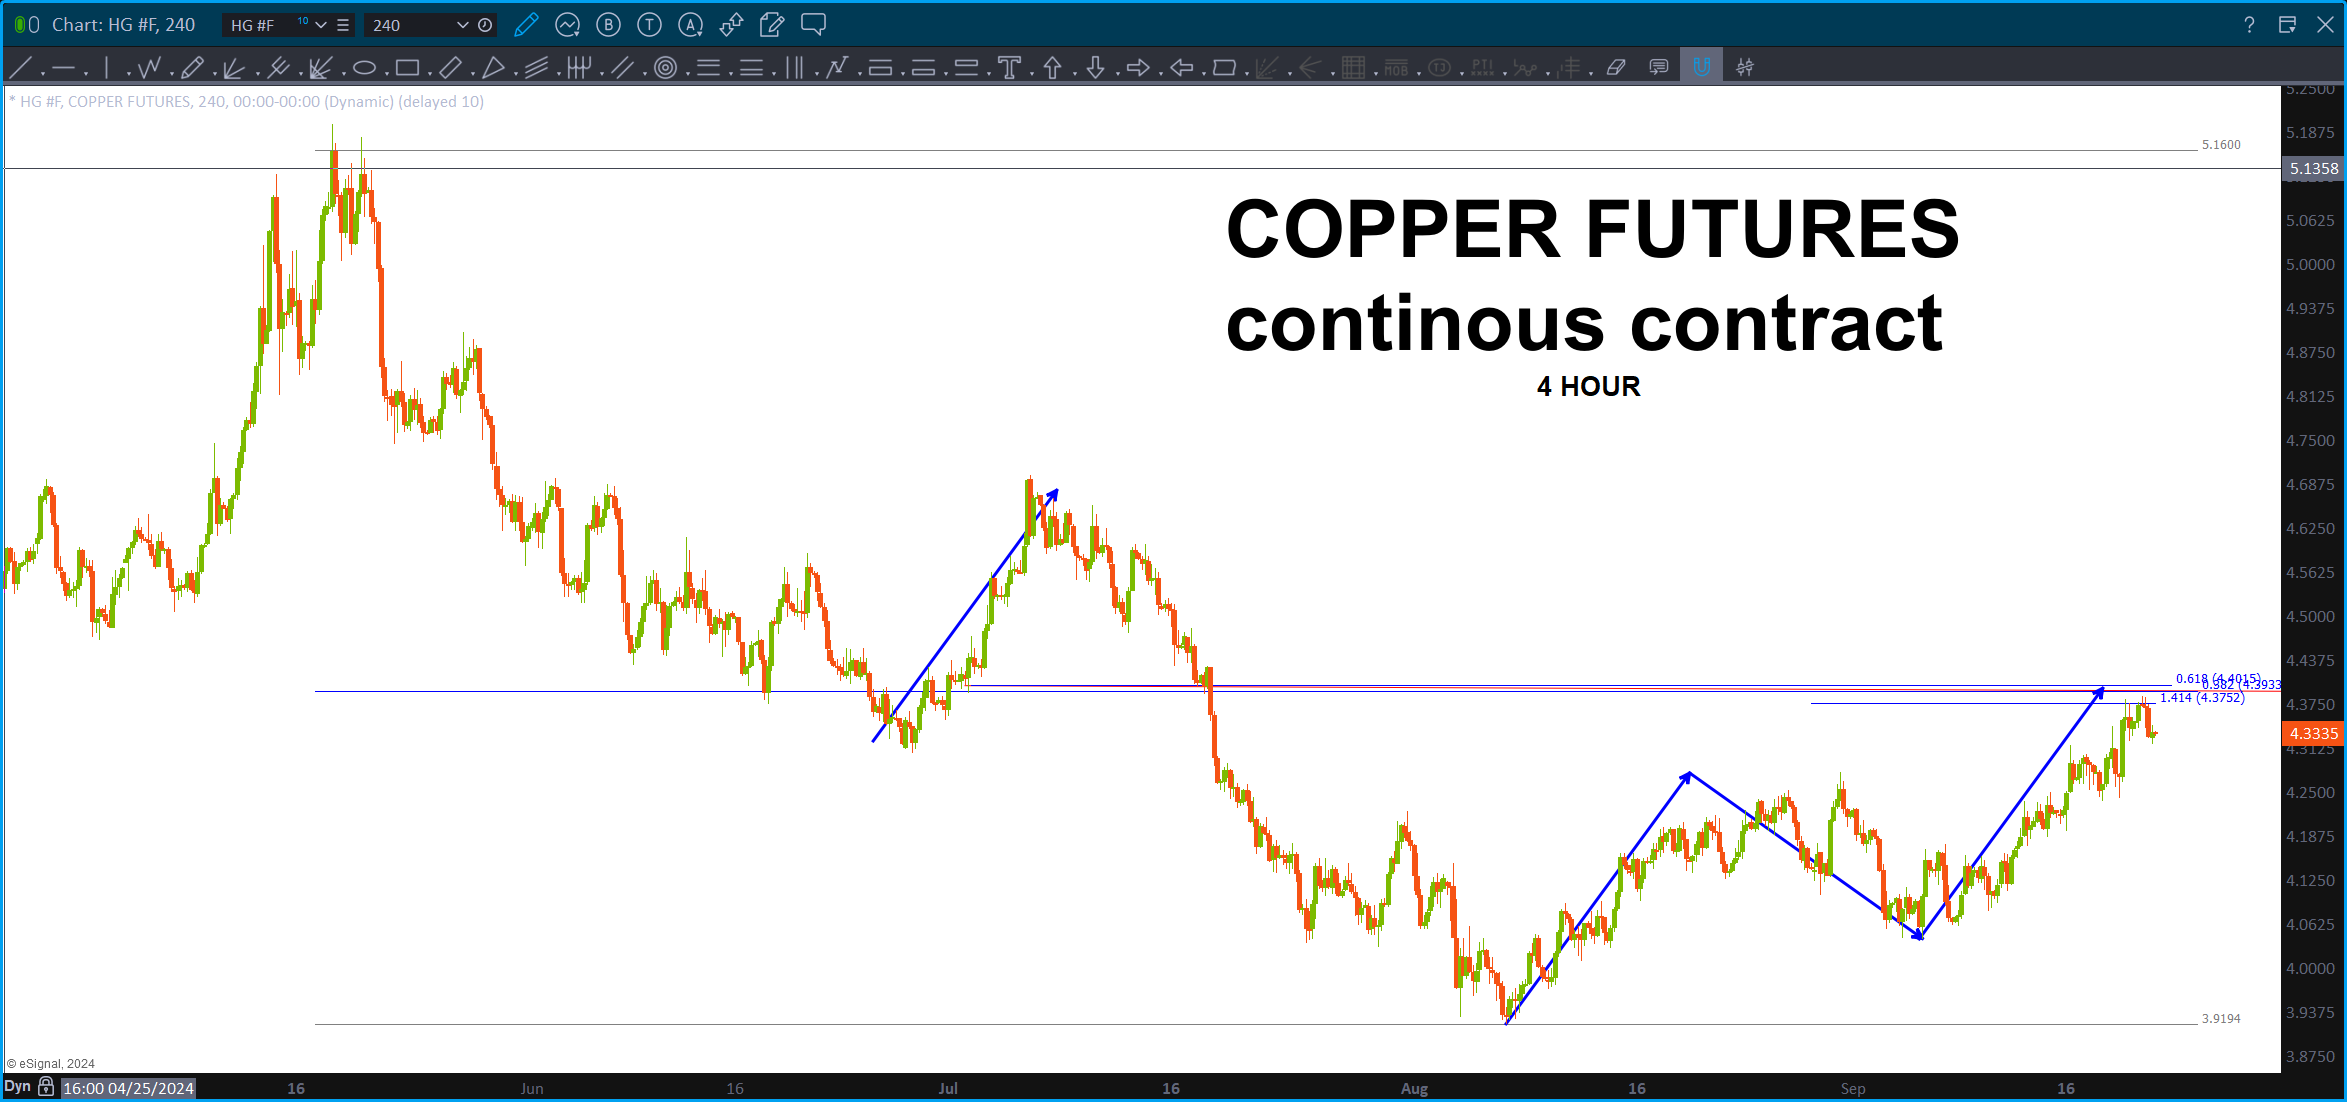
Copper – BTW – where is Copper? W/ the move occurring in the equities, shouldn’t copper be following? It’s barely made a .382 – hmm. PS – this is a VERY nice PATTERN – ABCD, .382+.618 confluence and 1.4142 extension.
Palladium:
Gold – September 19, 2024
Posted on September 19, 2024 1 Comment

Gold approaching MAJOR resistance …