EUFN – August 19, 2025
Posted on August 19, 2025 Leave a Comment

On Friday we had a “planetary parade” –
Pretty amazing – due to the darn marine layer here – I was unable to see it. But, could you feel it? I certainly could … more on that later, maybe. 😉
The last time we had a planetary parade ….see the chart below:
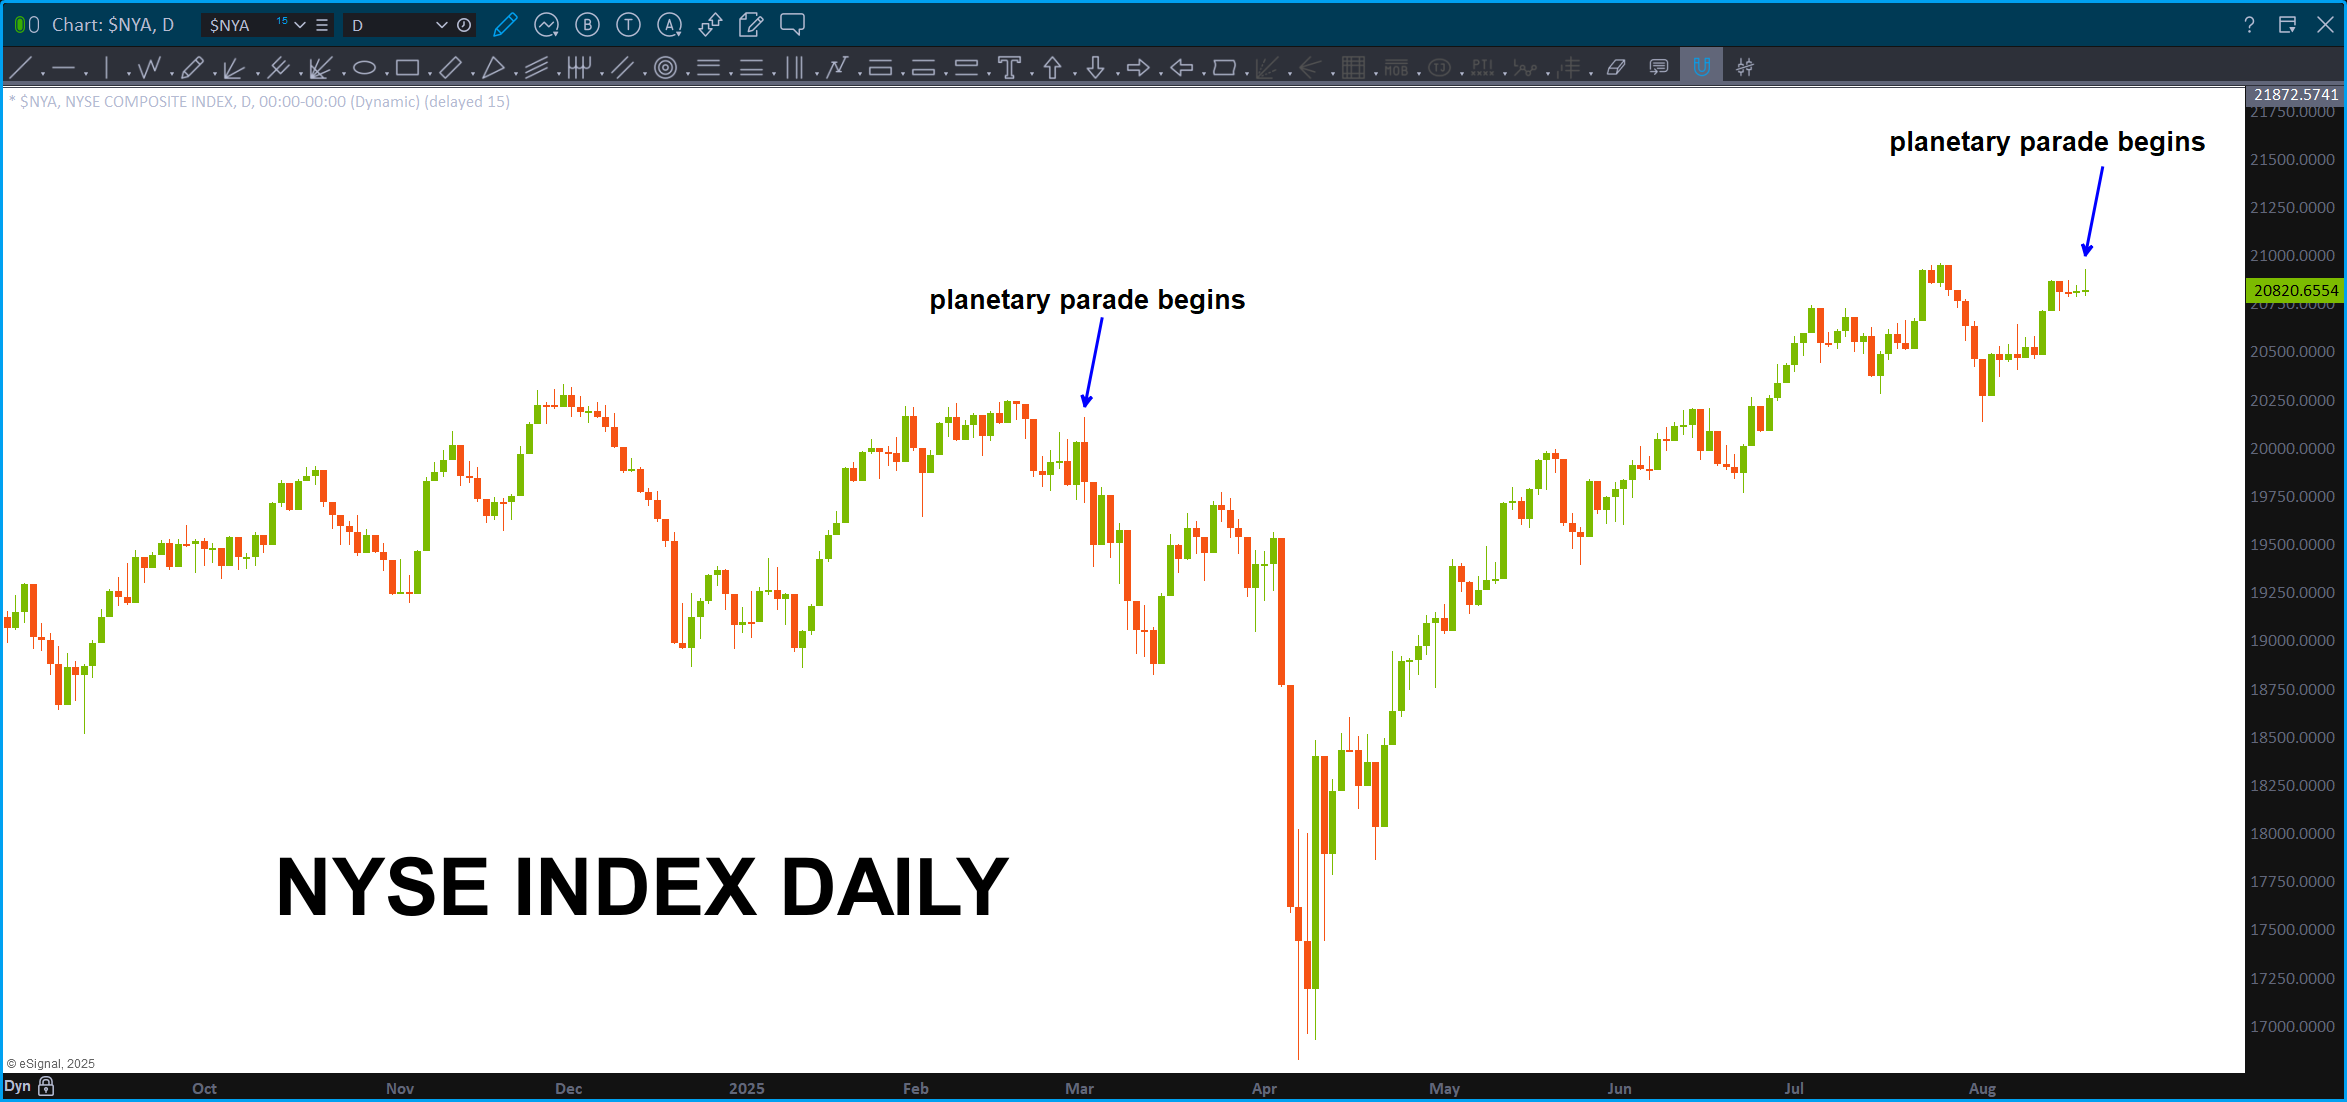
I asked Grok about the planetary parades since 2000 and I would say that ‘most’ of the time (80%?) it marked a pretty nice pivot. Majority were bearish but I would say it was a 65/35 split of bearish/bullish. Either way … w/ so many targets being hit, it was a ‘high’ probability that resistance was going to eventually show up. I think we are there …down into the end of the year and then BUY for a parabolic explosion or a big thump (my friend and mentor who has been trading for 50 years – Larry P) or a Grand Super Cycle III (EWT peeps)?
Here’s what I’m certain: I DO NOT KNOW. I do believe we have hit resistance.
Folks, IT IS ALL THE BANKS.
Here’s the next target on EUFN, showing how we can use the Vesica Piscis to project:
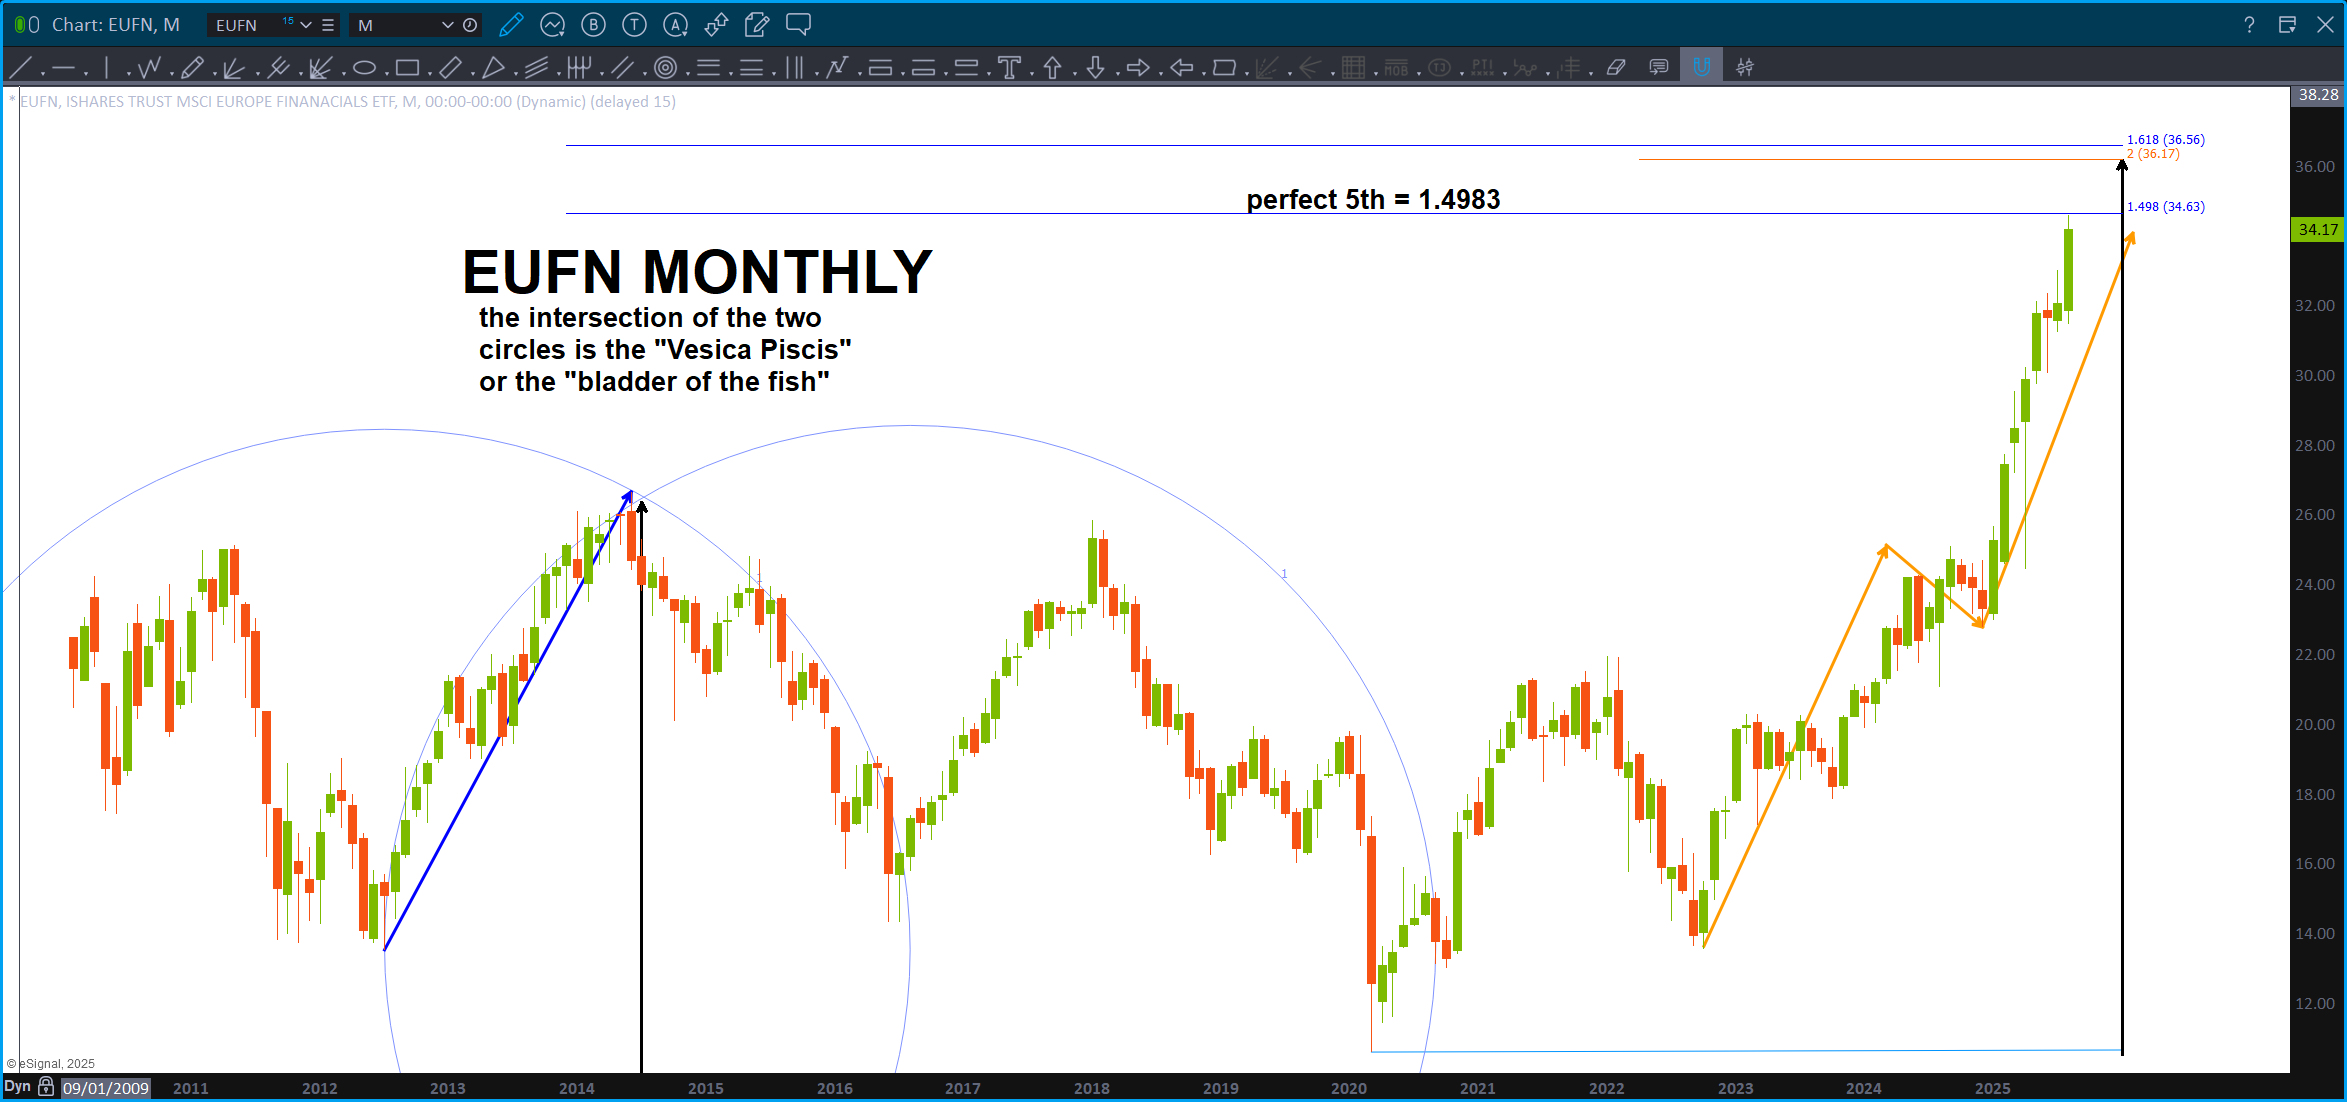
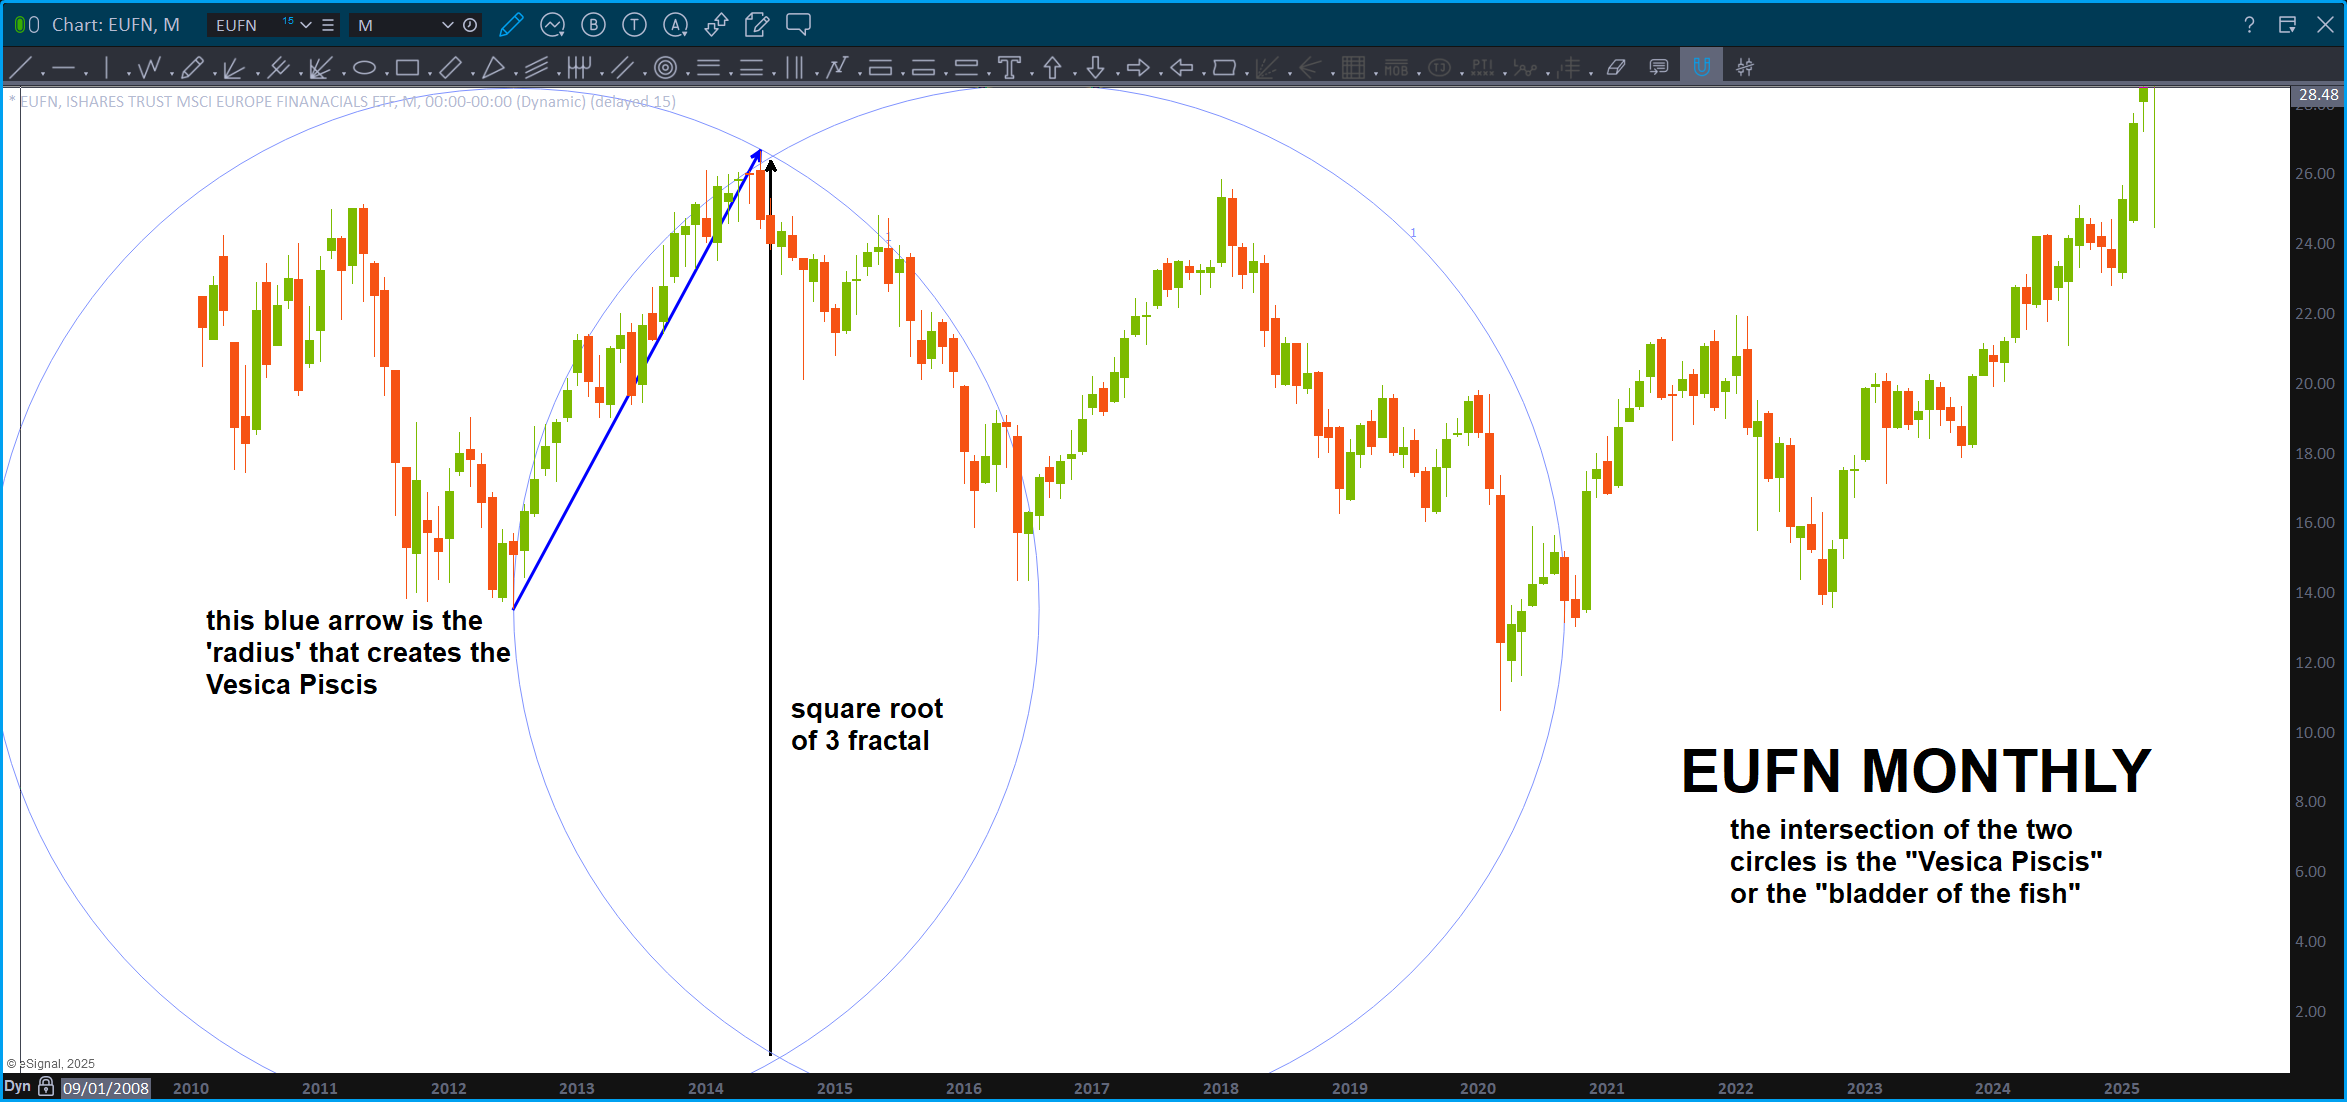
So, yes, we can use the intersection of two circles to project. Why not … it is THE portal?
The Vesica Piscis represents the bladder of the fish as we have ‘just’ left the Age of Pisces. That is why Jesus was a fisher of men who said “throw your nets to the right side of the boat (right brain).”
What’s happening now? We have being birthed the Age of Aquarius. That is the meaning behind Luke 22:10 (look it up) w/ the water bearer being the Age of Aquarius, the House he enters being astorlogical and the end of the age being the end of the age of Pisces. Why was the movie Avatar about …water?
So, now do you understand why Pi is so important?
What is it?
Mr. Grok:
Pi, approximately 3.14159, is an infinite, non-repeating number that unlocks the secrets of every circle in the universe. Esoterically, it’s a sacred thread weaving together math, nature, and the divine in an eternal, mystical dance.
Pi is extremely important. So important .. it’s where God states “I AM.”
Exodus 3:14.
Pretty nutty huh? 😉
And then, just THINK about the number Pi because, heard somewhere, even the very hairs on your head are numbered. Right?
And, come to think of it …that’s from Luke 12:7. Or 127 or 1.27 or the square root of `1.618 the golden mean. Why the square root ? (sorry folks, see above Vesica Piscis) Musical Theory folks … square root of strings tension or 1/ the strings length equals the frequency. And, there we go again … ALL IS VIBRATION. Period. Dot.
I’ve been working w/ my friend Ponch on understanding the OODA loop from the perspective of active inference and the free energy principle. Tilt? Doing this exercise w/ him down the rabbit hole has objectively or scientifically ‘proven’ to me that thoughts and your spoken word ARE CREATING REALITY. It’s real folks … what does this have to do w/ anything? Work with me …
So, vibration is everything … what was the original vibration? And God Said “let there be light.” Up until that point … it was the singularity. But when that first primordial word, or vibration was spoken, the vibration became form:
There it is folks … EVERYTHING is vibration. What causes the vibration? Our thoughts and our words …
It’s get better … really?
Let’s jump to gematria Mr. Grok:
“…Gematria is a mystical practice where each letter in a word is given a number, and you add them up to find hidden meanings or connections between words with the same total. It’s like a secret code in languages like Hebrew, where numbers reveal spiritual truths tying words to the universe’s deeper patterns...”
So, let’s go back to Pi … the decimal points goes on into infinity. (Omnipresent) It never stops. So, if we transition to the gematria of the letter, no letter will ever repeat. EVER. Therefore, it’s only mathematical that EVERY WORD that HAS BEEN SPOKEN, IS BEING SPOKEN, OR WILL BE SPOKEN is contained in Pi. Every aspect of it and the “3” that goes before it … it’s the third octave or dimension – we are in the 3rd dimension. You see?
So, therefore, God is … ALL OF IT. Omnipotent, Omnipresent, Omniscient, omnibenevolent. So, after that first radius making “everything” become light (it’s encoded in our DNA folks, look it up) the circle was set in motion by tying it all together. Perfect … perfection can’t be divided,it can only be squared therefore a second circle was created – creating the vesica piscis. Hence, Adam and Eve – the separation and why the act of human creation is, truly, divine. That is why the divine opposites create the union of the one …
The Portal (Vesica Piscis) sure looks like the area that makes a female a female .. how appropriate. All of creation, the square roots from sacred geometry that are responsible for every fractal that creates this matrix is represented by the divine feminine for life, but not just life but for the ONE to experience this life co-creating every single aspect of it …
It’s a portal folks and here’s to you my sweet and wonderful sunshine … you got this my Maddy and I love you.


When Price Equals Time
Posted on July 23, 2025 Leave a Comment

Posted this over at Stock Market TV: https://www.stockmarkettv.com/barts-charts/2025-07-23/when-price-equals-time
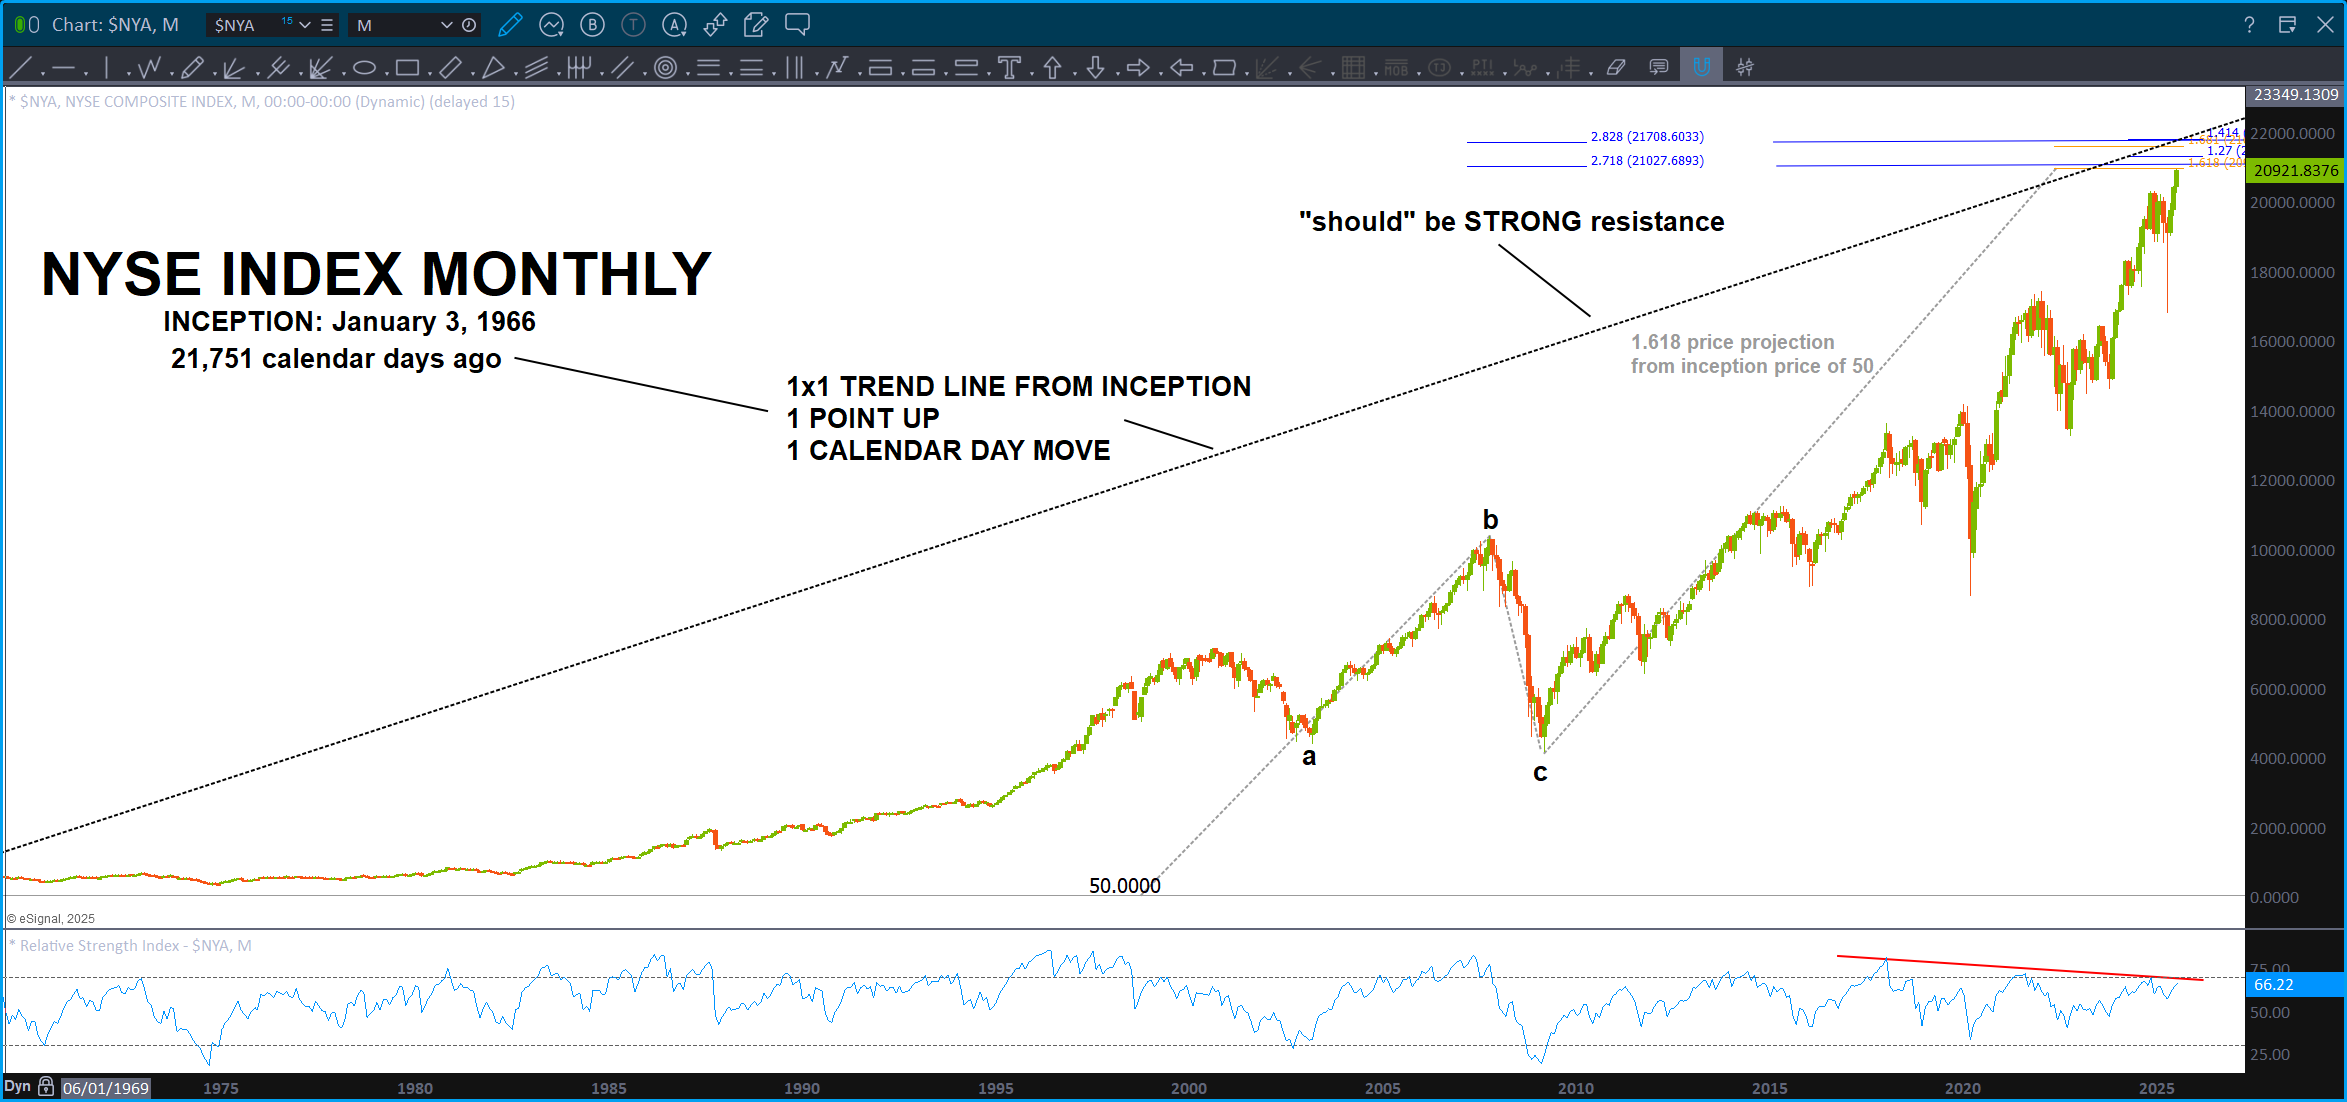
Since the NYSE Composite Index launched in 1966, its trajectory has traced not only the rise and fall of markets, but the structural shifts of a world in transformation. In the decades since, we have witnessed the Vietnam War, the collapse of Bretton Woods, the oil shocks of the 1970s, the Reagan-era deregulation wave, Black Monday, the fall of the Soviet Union, the birth of the euro, 9/11, the 2008 financial crisis, and the COVID-19 pandemic. Today, we stand amidst renewed geopolitical fragmentation, rising multipolar tensions, conflicts in Ukraine and the Middle East, and a visibly fractured American political landscape. These are not isolated events—they are inflection points, waves folding through time. The market, in its silent geometry, now approaches a place it has never touched before: the harmonic return of time meeting value.
Nearly 21,751 days since inception, price nears a point of equilibrium—where the passage of days equals the projected value on the chart. This convergence aligns with Fibonacci extensions, prime-based intervals, and clear momentum divergences. Conventional models may interpret this as resistance. But to those attuned to the deeper cycles that underlie pattern itself, this is more than a top—it is the first kiss of the original impulse, a potential moment of systemic remembrance.
Should the market break cleanly through this point of balance, it may signal not exhaustion but acceleration—an extension of the wave rather than its resolution. Technically, this suggests a continuation into higher harmonic projections; spiritually, it reflects a cycle not rejected but transmuted, the octave integrated rather than paused. Yet even in that extension, the imprint remains—because no spiral escapes its return.
Is the ratio going to break down – July 09, 2025
Posted on July 9, 2025 Leave a Comment

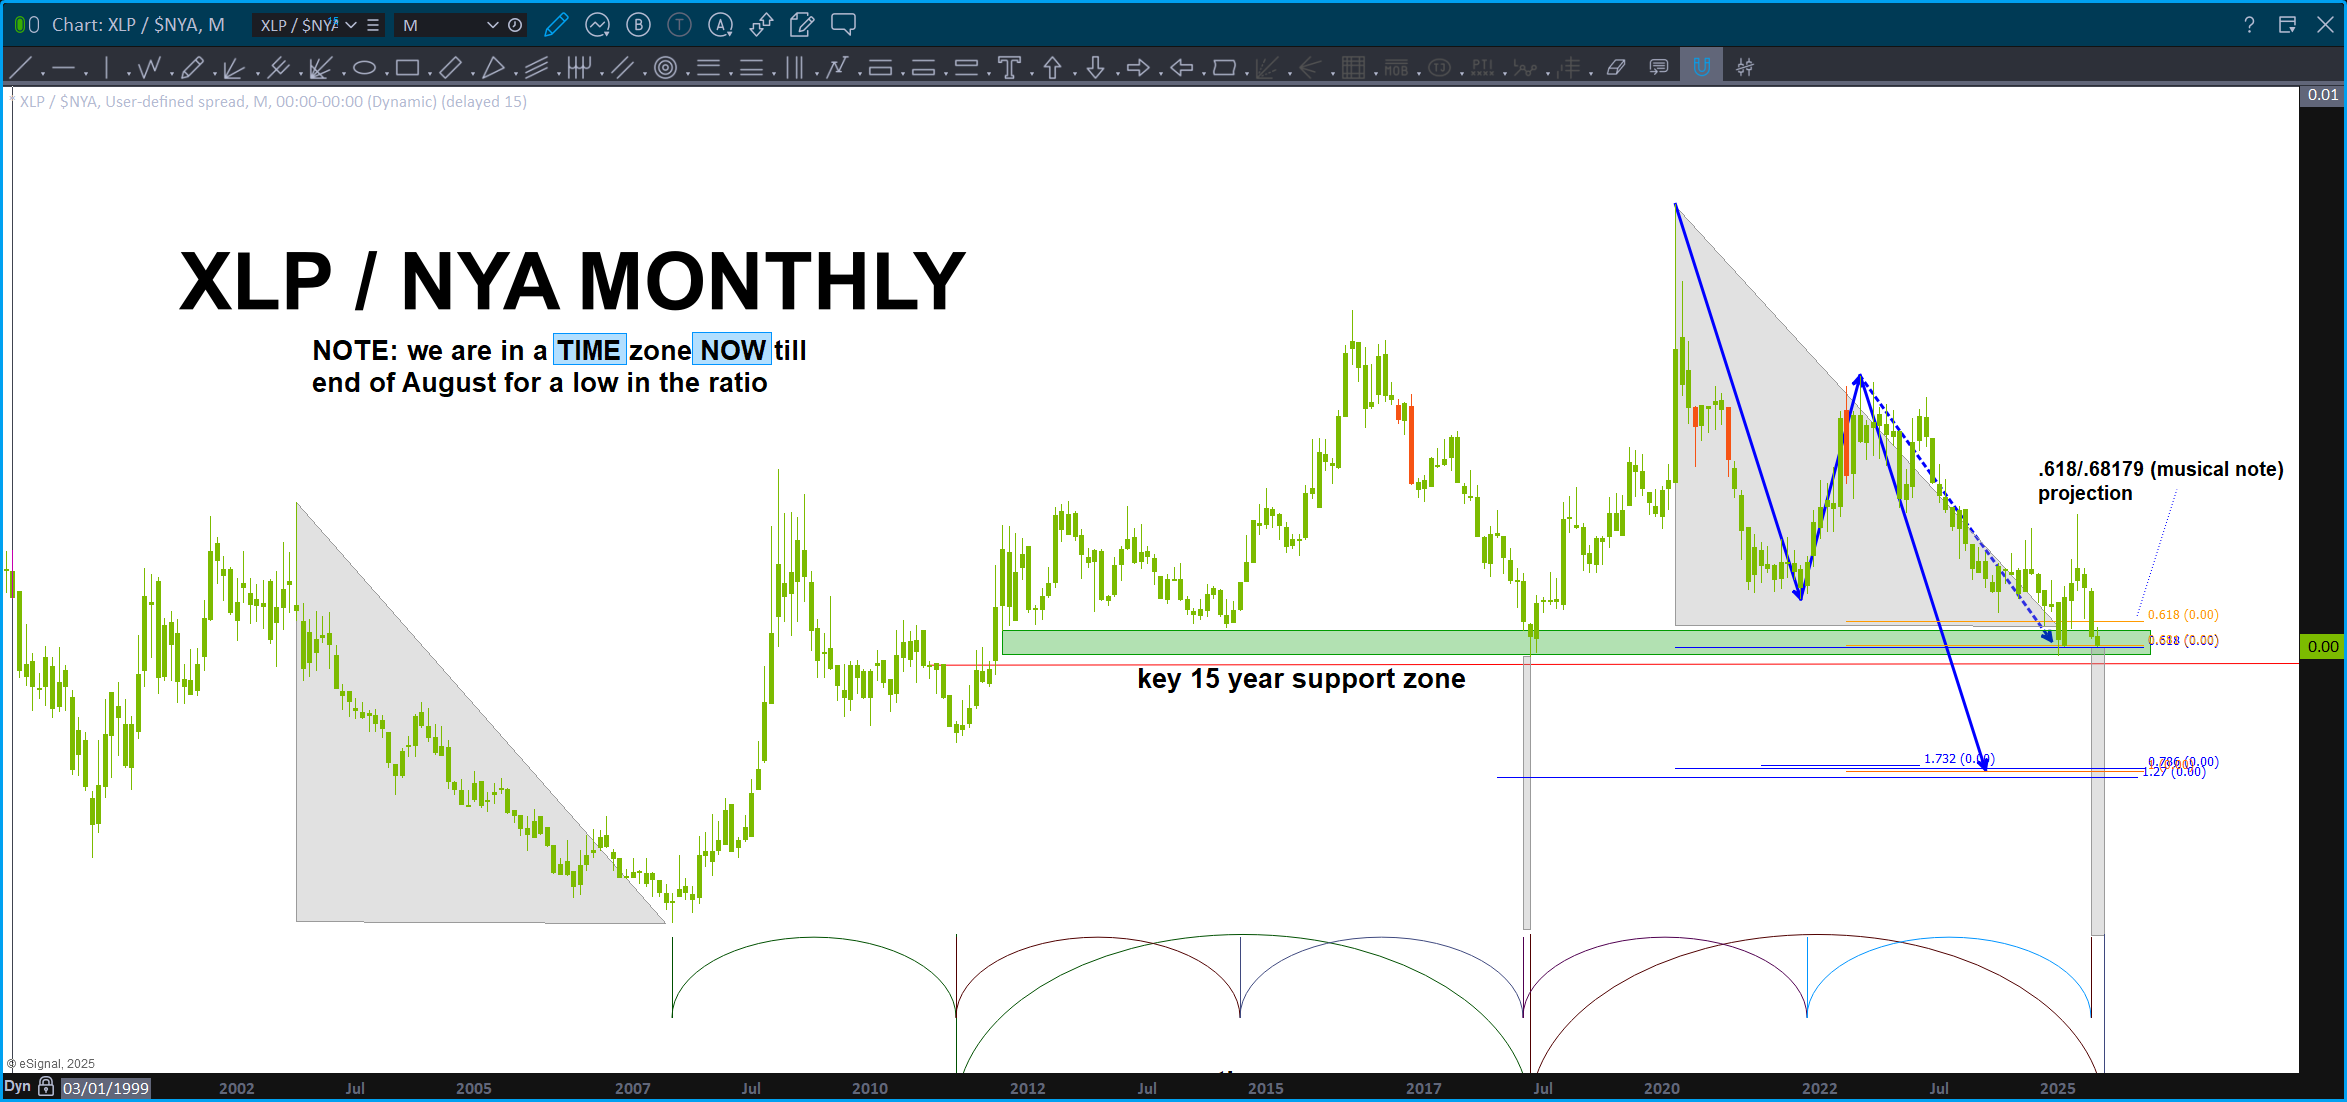
As discussed previously, I’m hawking the XLP/NYA ratio. Noticed, yesterday, that even w/ the market flat/slightly down the ratio was trending lower. Sure looks like it wants to break support and go down to the pattern completion level at the .786. That’s bullish …
However, take note of the time cycles … it’s forecasting a ‘low’ in the ratio now – August.
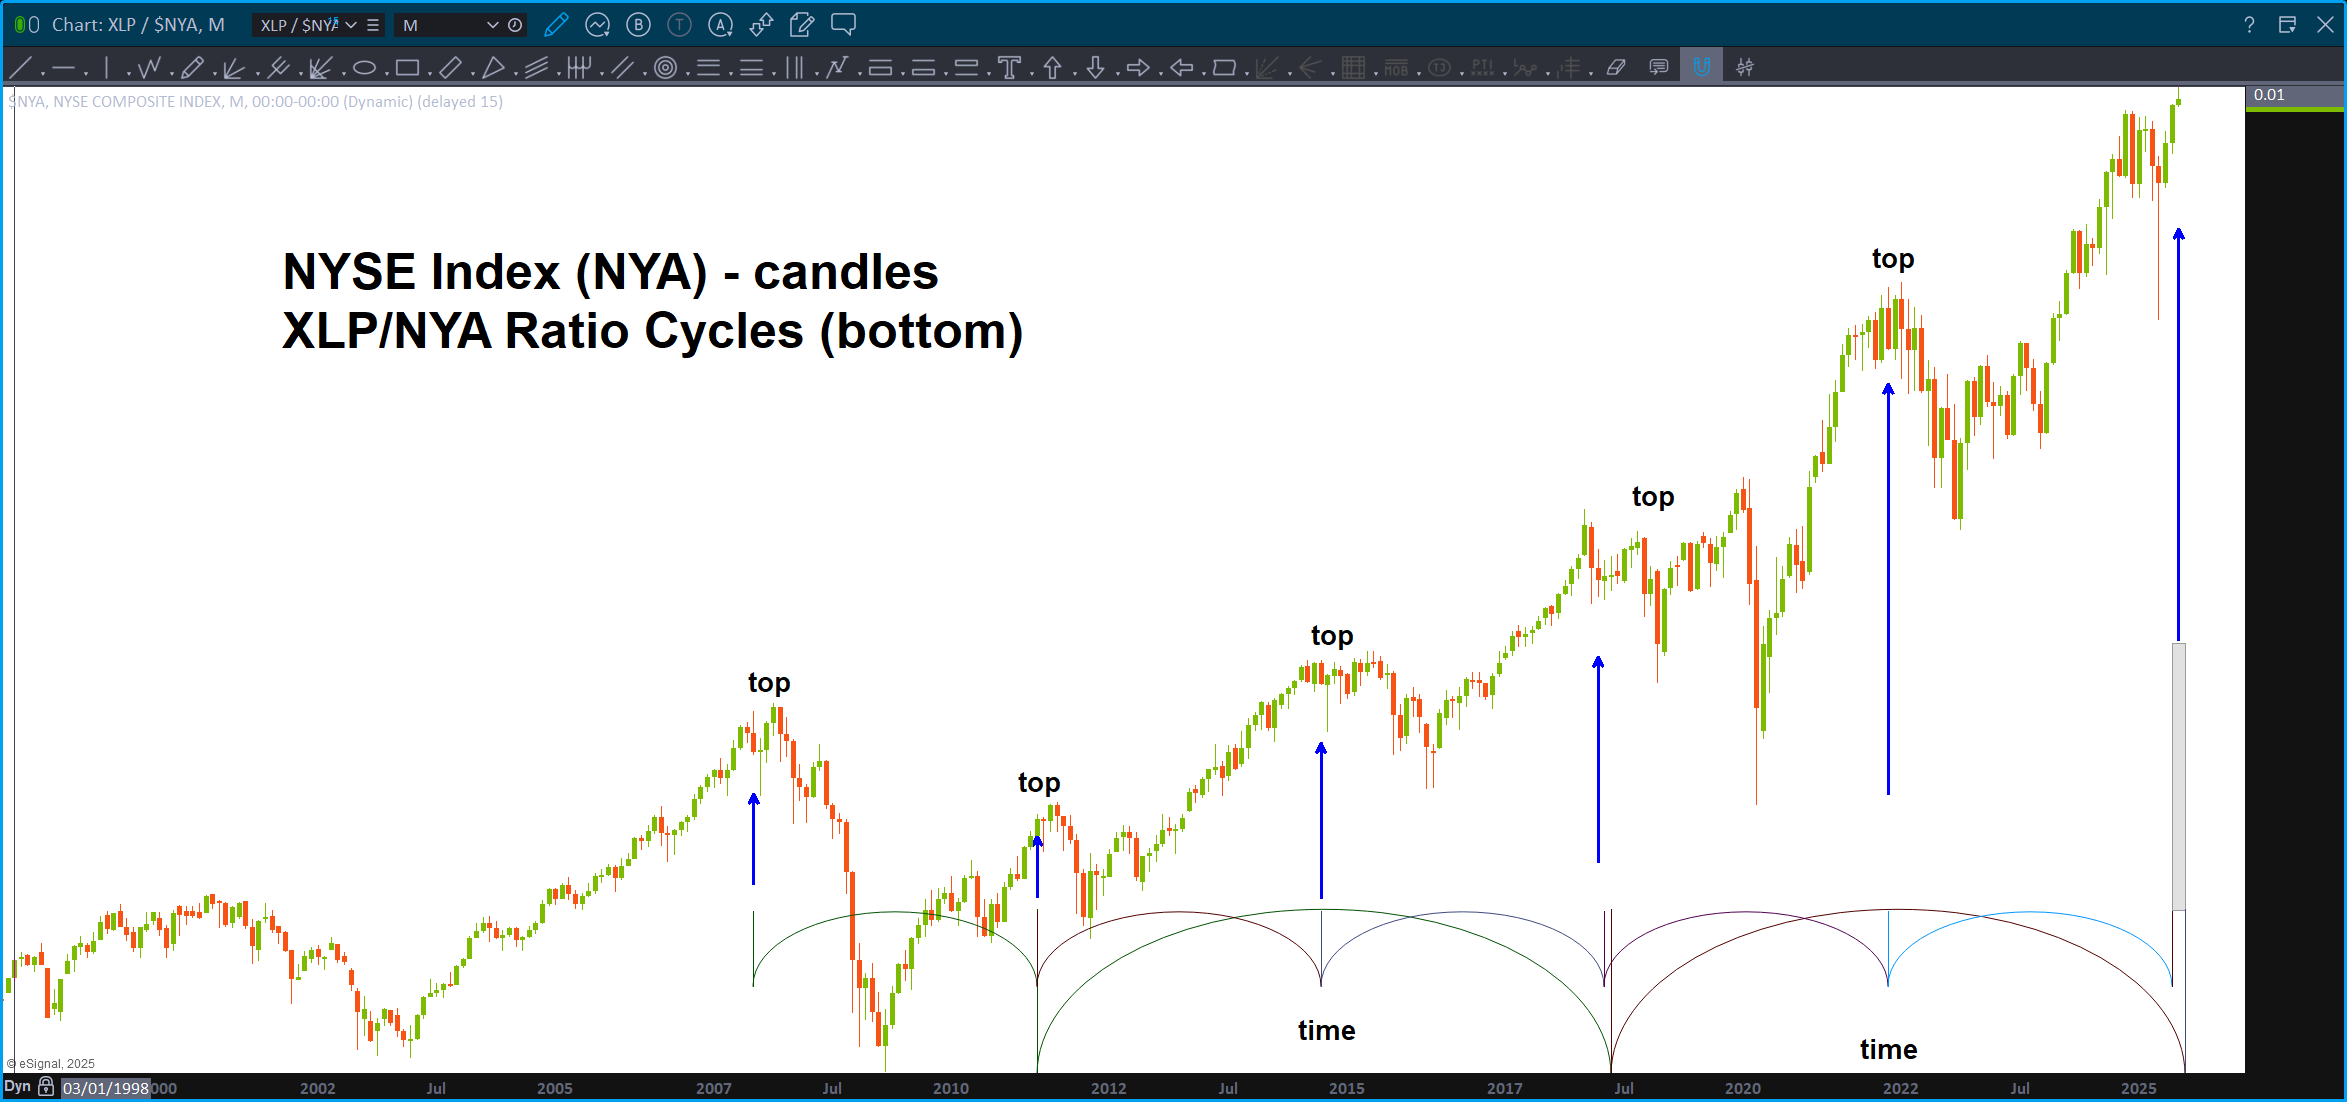
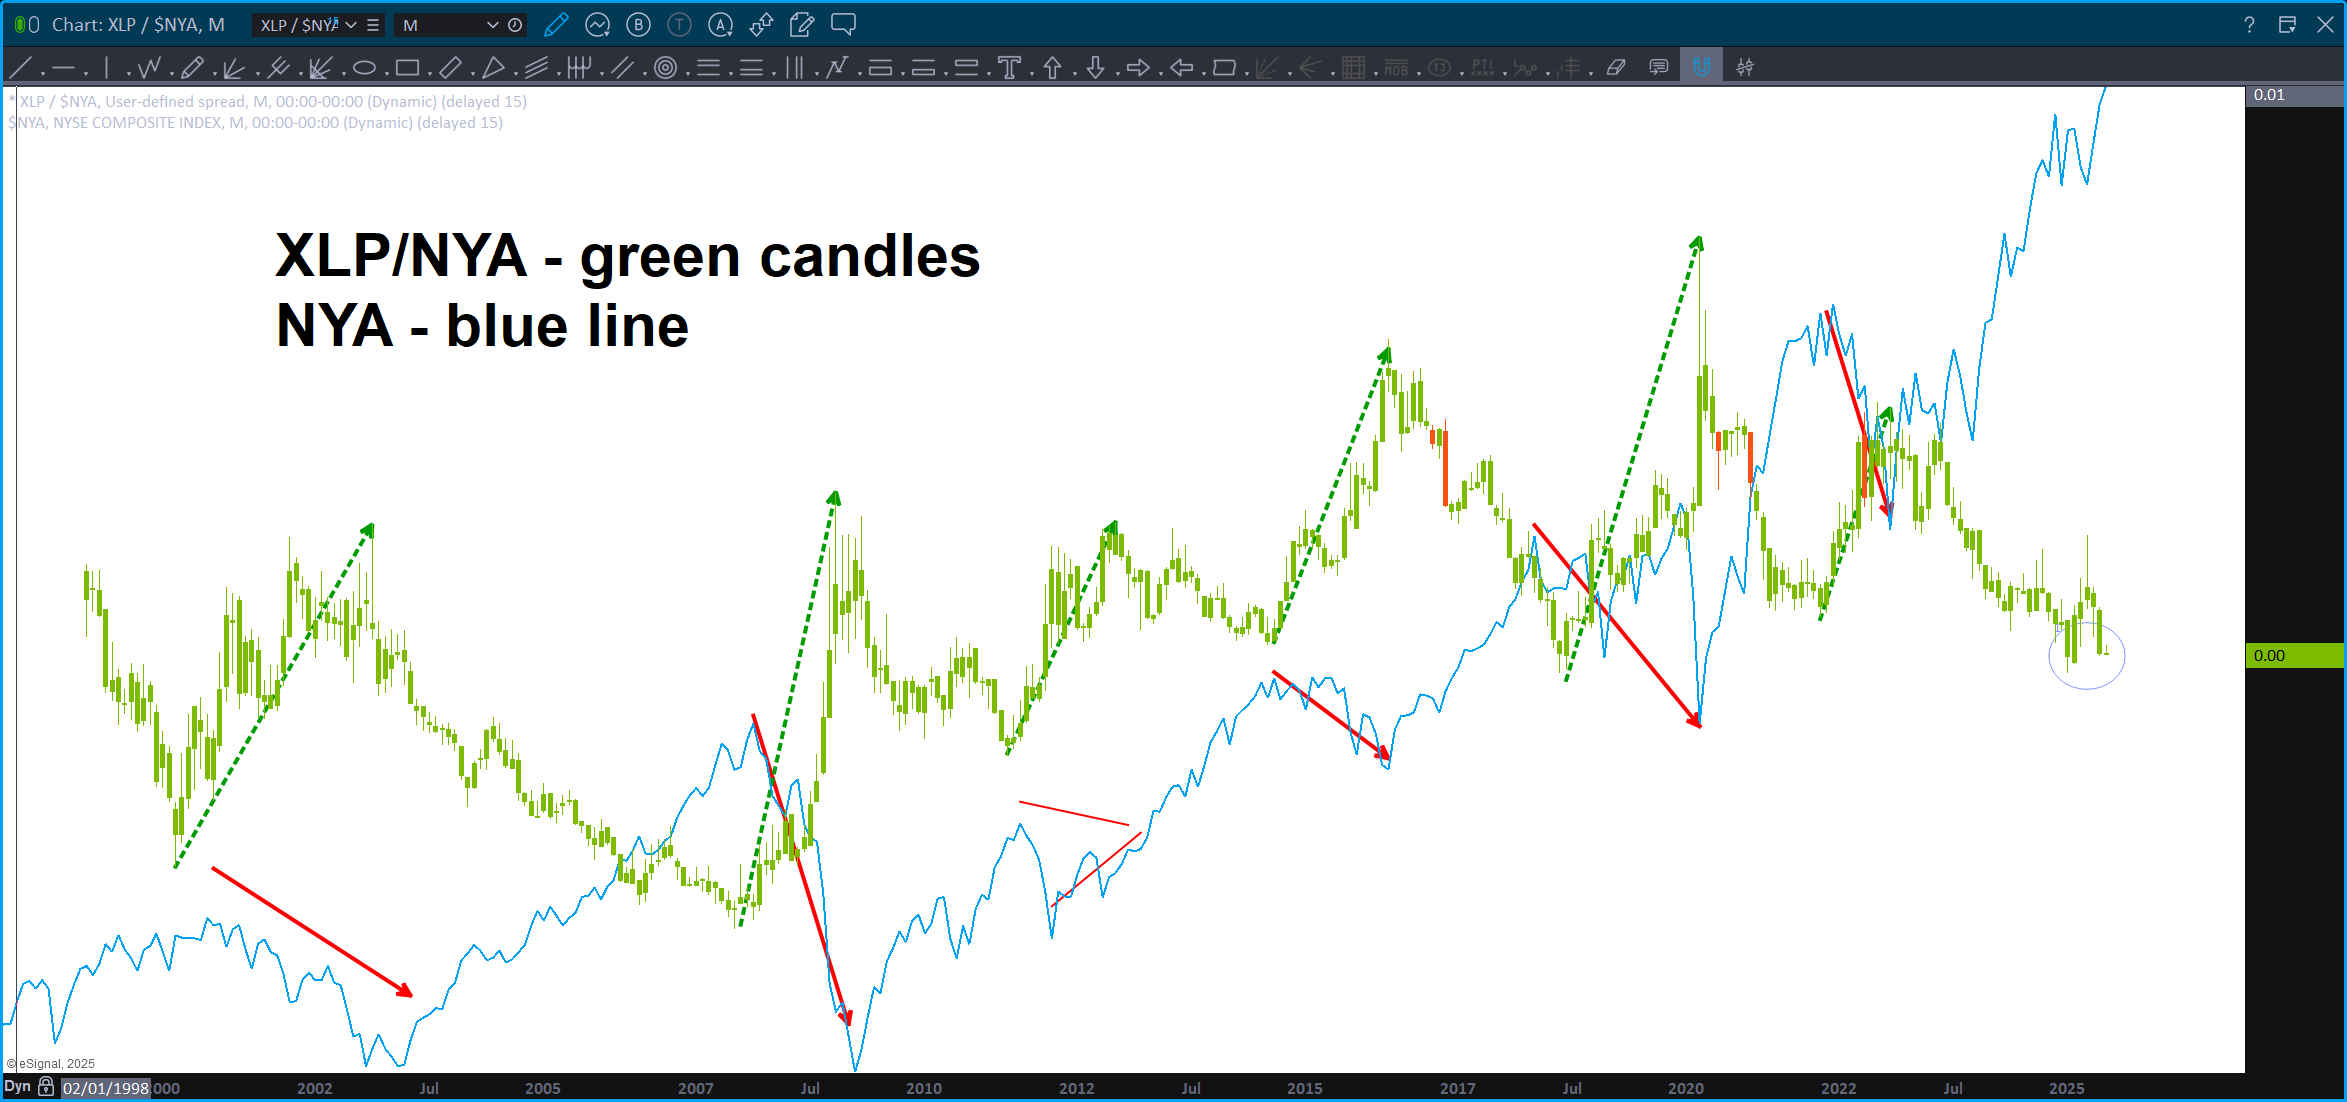
To show the importance of this ratio, I put the NYSE Index (NYA) on top of the XLP/NYA ‘static time’ cycles and you can see that – while not perfect (remember this is a monthly chart and we could have some slippage in the overlay) it’s not a stretch to say that when the ratio has bottomed, the market has topped or topped soon thereafter w/ a month or so.
This market ‘could’ explode higher when we lose this support … all I know is we have 18 years of some pretty accurate ‘static cycles’ shown.
I’ll stay the course … need a WEEKLY close below the “15 year support zone” before initiating a long position.
I’ve been having a lot of fun over at https://www.stockmarkettv.com/ – check out some of the most recent posts: https://www.stockmarkettv.com/james-bartelloni
PS – no reason for the wave picture, I just felt like it would be a cool snap to put as a featured image.
Ratio Analysis and TIME – July 3, 2025
Posted on July 3, 2025 Leave a Comment

Happy 4th of July weekend everyone … enjoy it safely w/ family and friends.
If you’re interested, maybe go checkout the America Codes: https://tobeornottobe.org/
Or this podcast: https://www.youtube.com/watch?v=P9byS1biWtU
Either way ..enjoy.
Posted this last night about ‘risk’ – https://www.stockmarkettv.com/2025-07-02/ratio-analysis-last-resistance-point-still-standing
The key takeaway from this post is the TIME cycles that appear to be converging ‘now into August’ As shown below, anytime the ratio starts heading up – a correction has ensued. The question – are we going to breakdown below the support zone?
I don’t invest in breakdowns or breakouts – lost a lot of money doing that as it would then rip back against me. Nope, I wait …
So, very impressive V recovery and what appears to be another leg up in a roaring economy. Yup … I’ll wait for the PATTERN so I’m flat equities, for now.
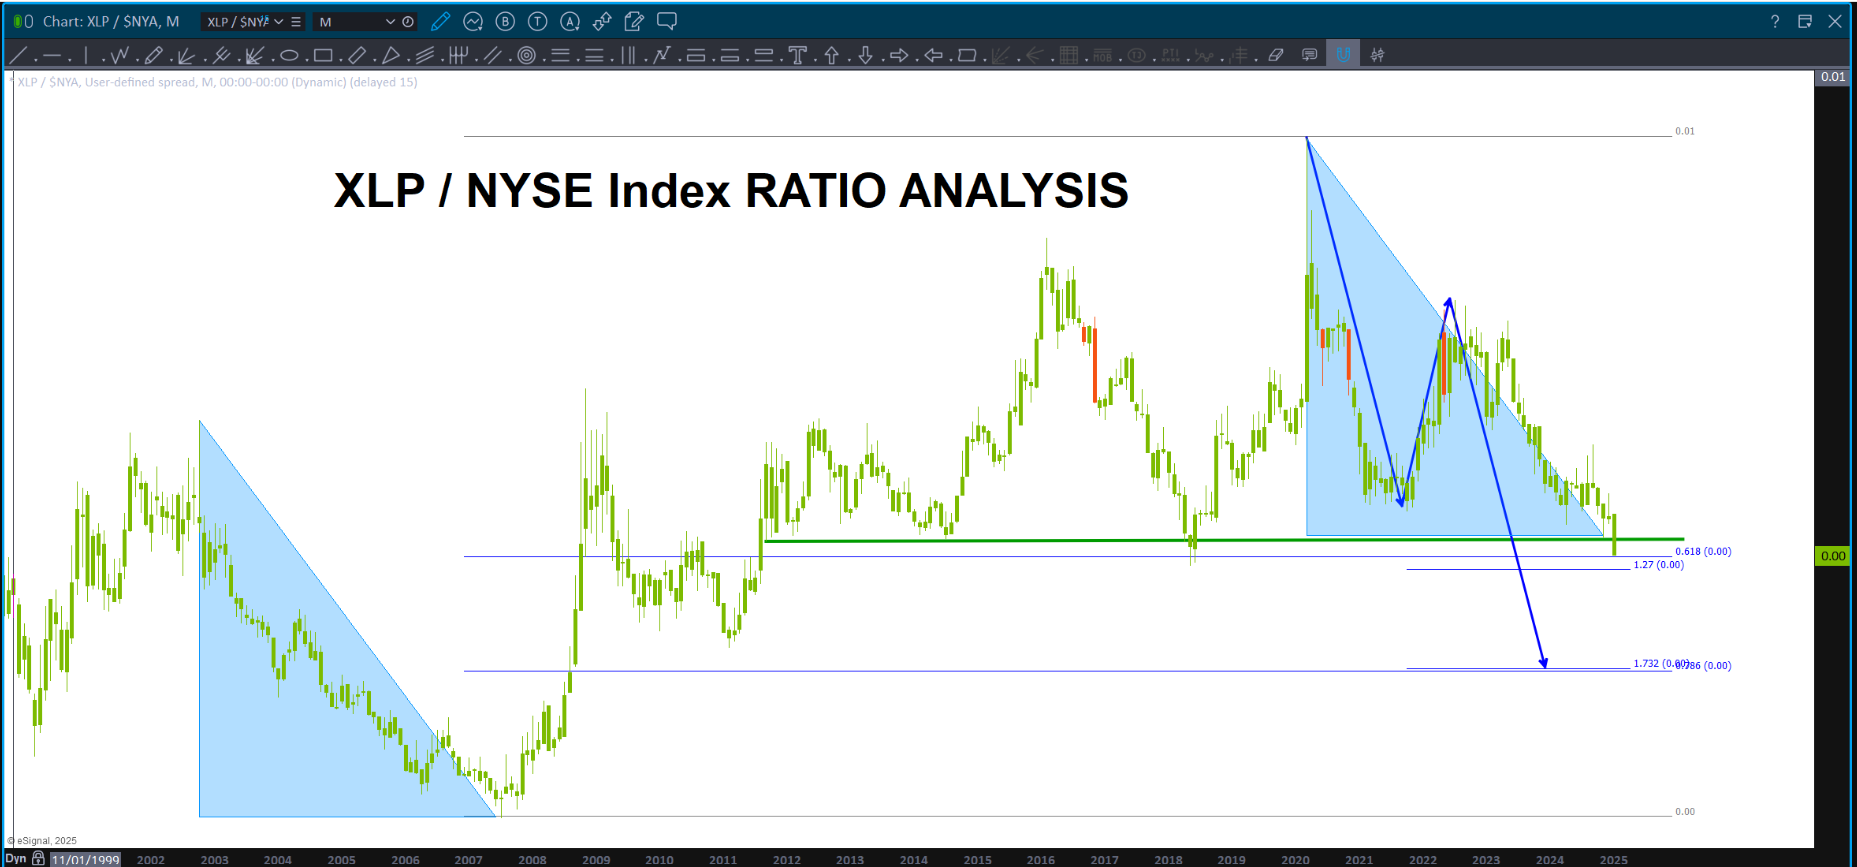
The chart above is the ‘reason’ we have found support and have been bouncing around.
This is why this ratio is soooo key. Anytime it bottoms, the market corrects.
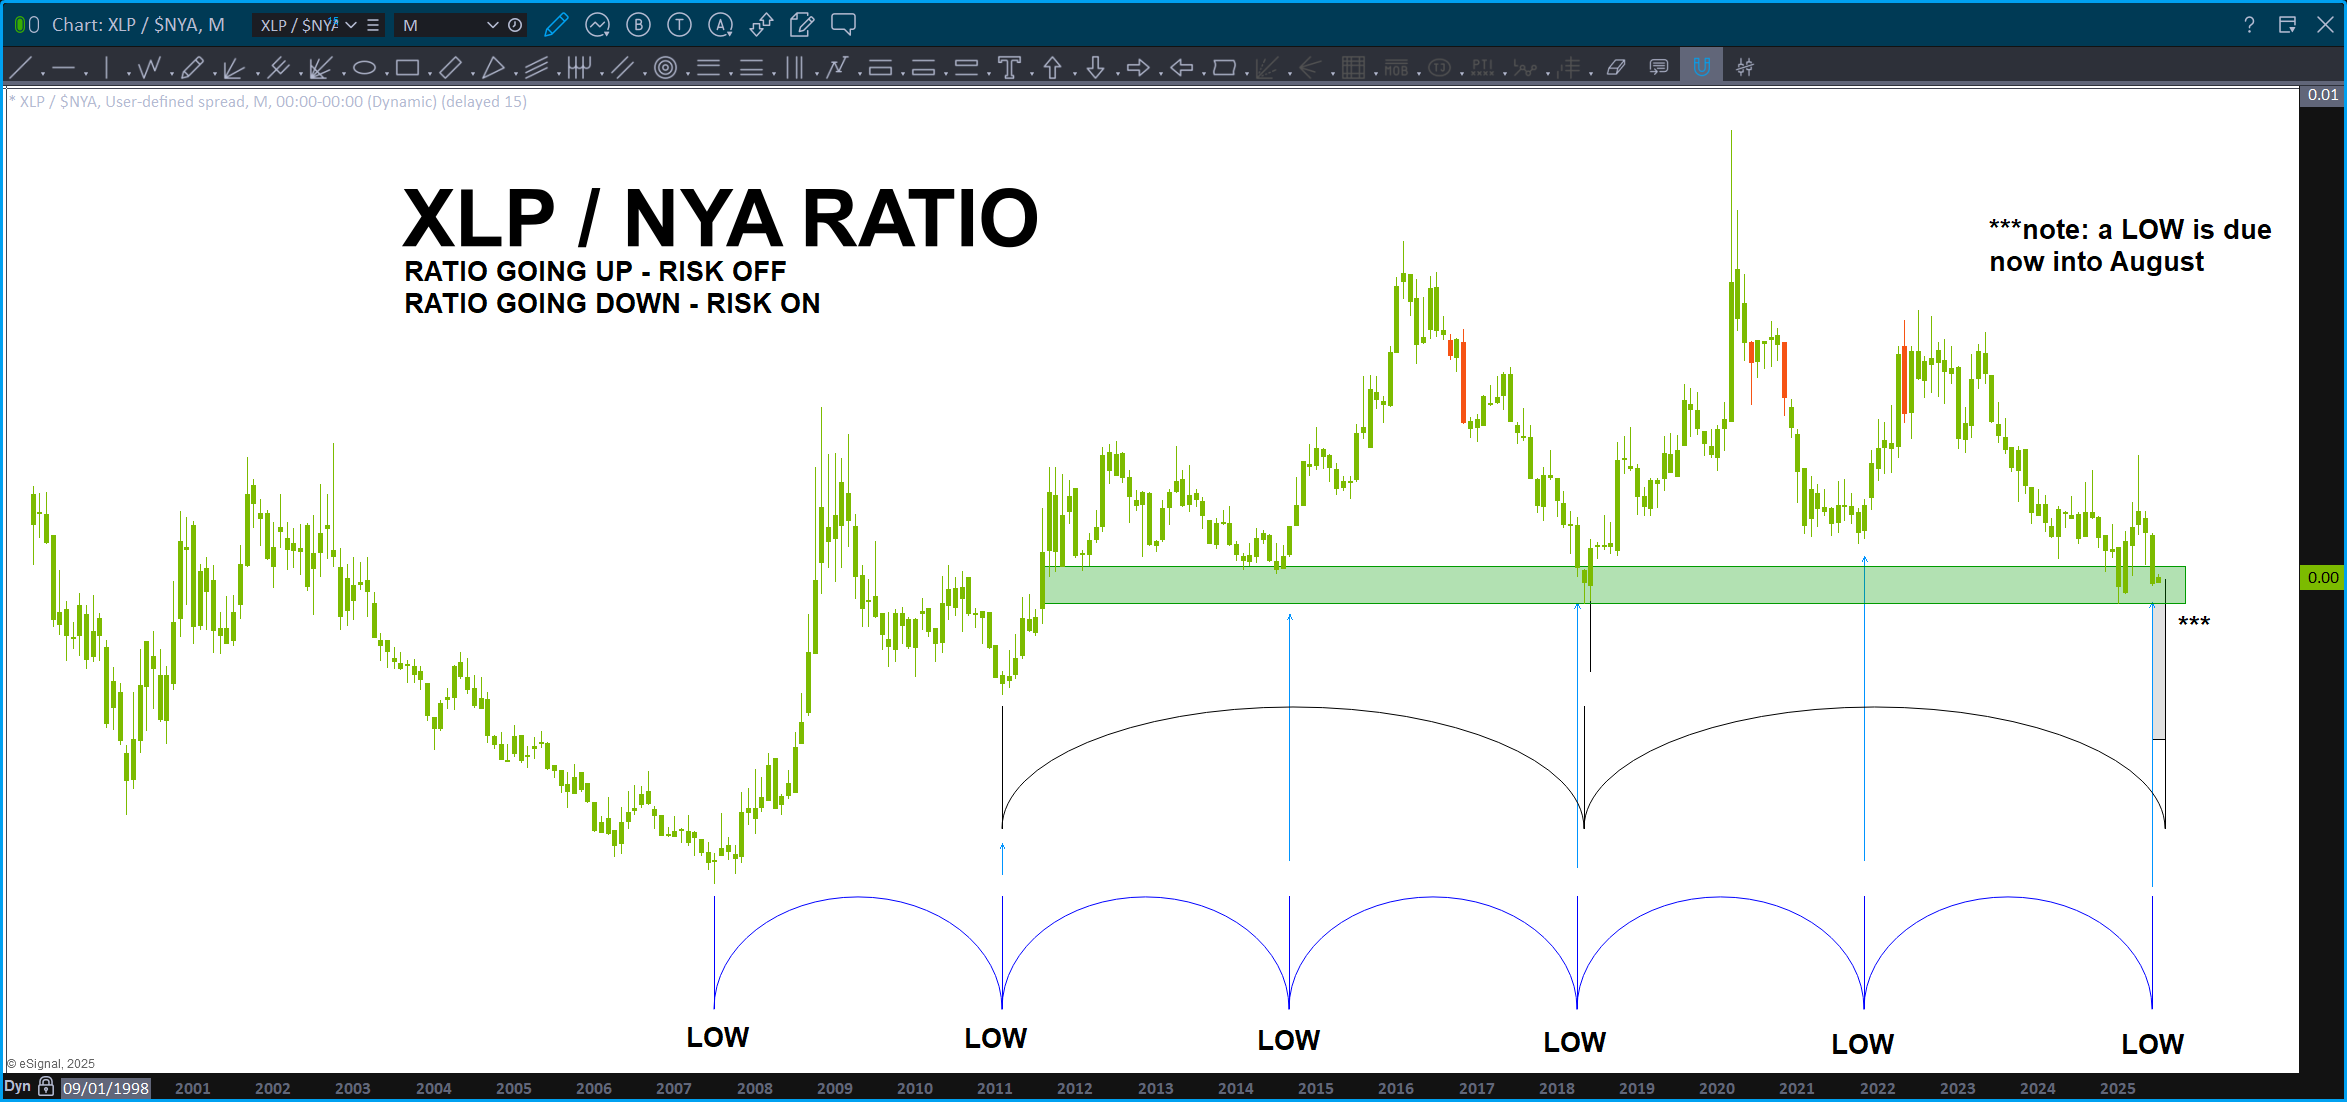
The reason I’m cautious is because of TIME. Note the dual cycle convergence happening now. Remember, this is a monthly chart so we are simply in a time zone where the ratio could bottom and start higher. Historically, that has proven to be resistance for equities.
Of course, it’s different this time.
How about this one …this is
Great weekend to all – Bart
Psychedelics – June 23, 2025
Posted on June 23, 2025 2 Comments

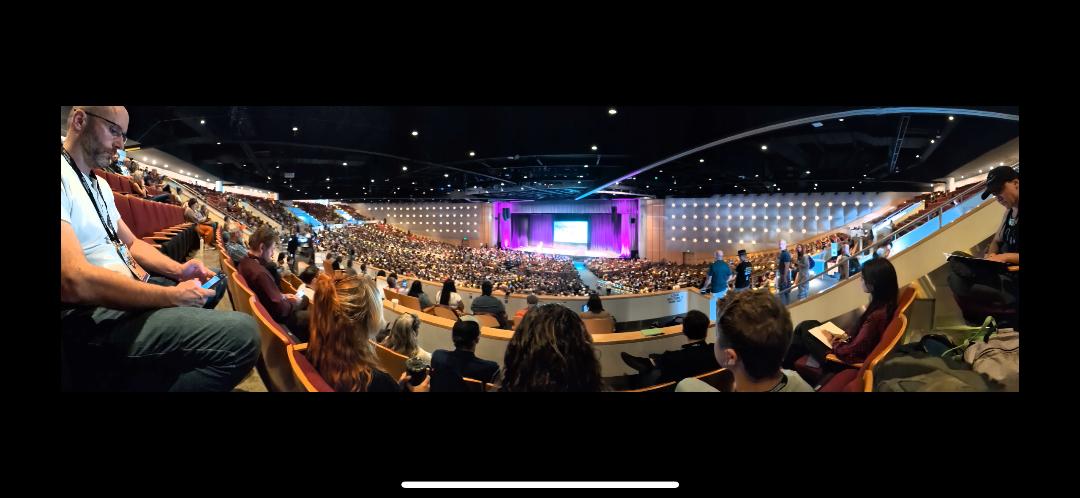
Spent last week in Denver, CO checking out the Psychedelics Science Conference for the company that I am currently working doing strategic business development. Wayne Gretzky says, “skate to where the puck is going to be” and that is the general consensus w/ regards to this community.
It was an interesting perspective for me because, on the one hand my company CHEORS does HEOR/RWE. Basically during the clinical trial phase a LOT of data is spun off, or past CT’s or literature in peer-review articles, etc. etc. Our job is to take all that data and either doing some modeling or ‘RWE – real world evidence’ or evidence synthesis to tell your particular value story. That’s what we do and we do it quite well …
On the other hand, I’m on the board of directors for http://www.behindthinlines.com and we work supporting education and research for entheogenic modalities.
Personally, I’ve done psychedelics and, no kidding, it’s one of the most powerful experience (s) 😉 of my life. I DO NOT do them recreationally because, frankly, that is not in the spirit of the ceremony.
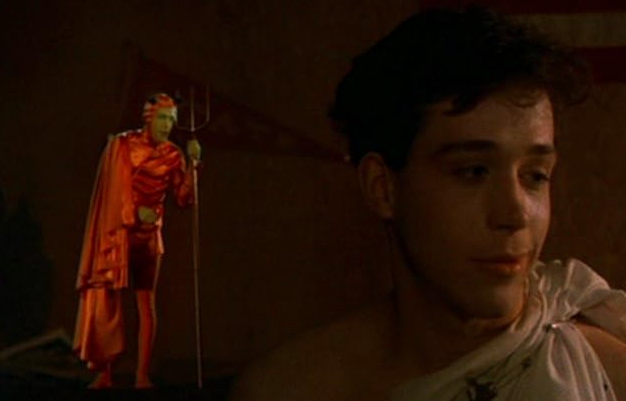
So, it was like the scene from Animal House where both the angel and the devil appear on opposites sides of his shoulder … pharma vs ceremony.
I’m not going to claim to know the answer – I don’t. A blend of ceremony and science – that’s the answer. Compromise people … 🙂
Not all Pharma is bad pharma … I’ve worked in the industry for almost 10 years providing patient support services and am currently knee deep in the biotech world. It’s actually quite fascinating. Think about the intricate nature of the body and the quantum computer it is and … you’re telling me you can find a unique pathway and molecule that not only will interact w/ this temple, but also fix it? Pretty impressive …
Yet, on the other hand, how can a plant or secretions from a toad impact the quantum computer projection device called the brain? Completely bypass your reticular activating system and limbic system to propel you into the void or colloidal condition where ‘stillness’ does exist?
Who knows …
I’m betting that the ‘blend’ of science/ceremony will find common ground and merge – those who want ceremony, go into door 1. Those who want the PROVEN therapeutic value these entheogenic plants can give you, and nothing else (no hallucinations), go into door 2.
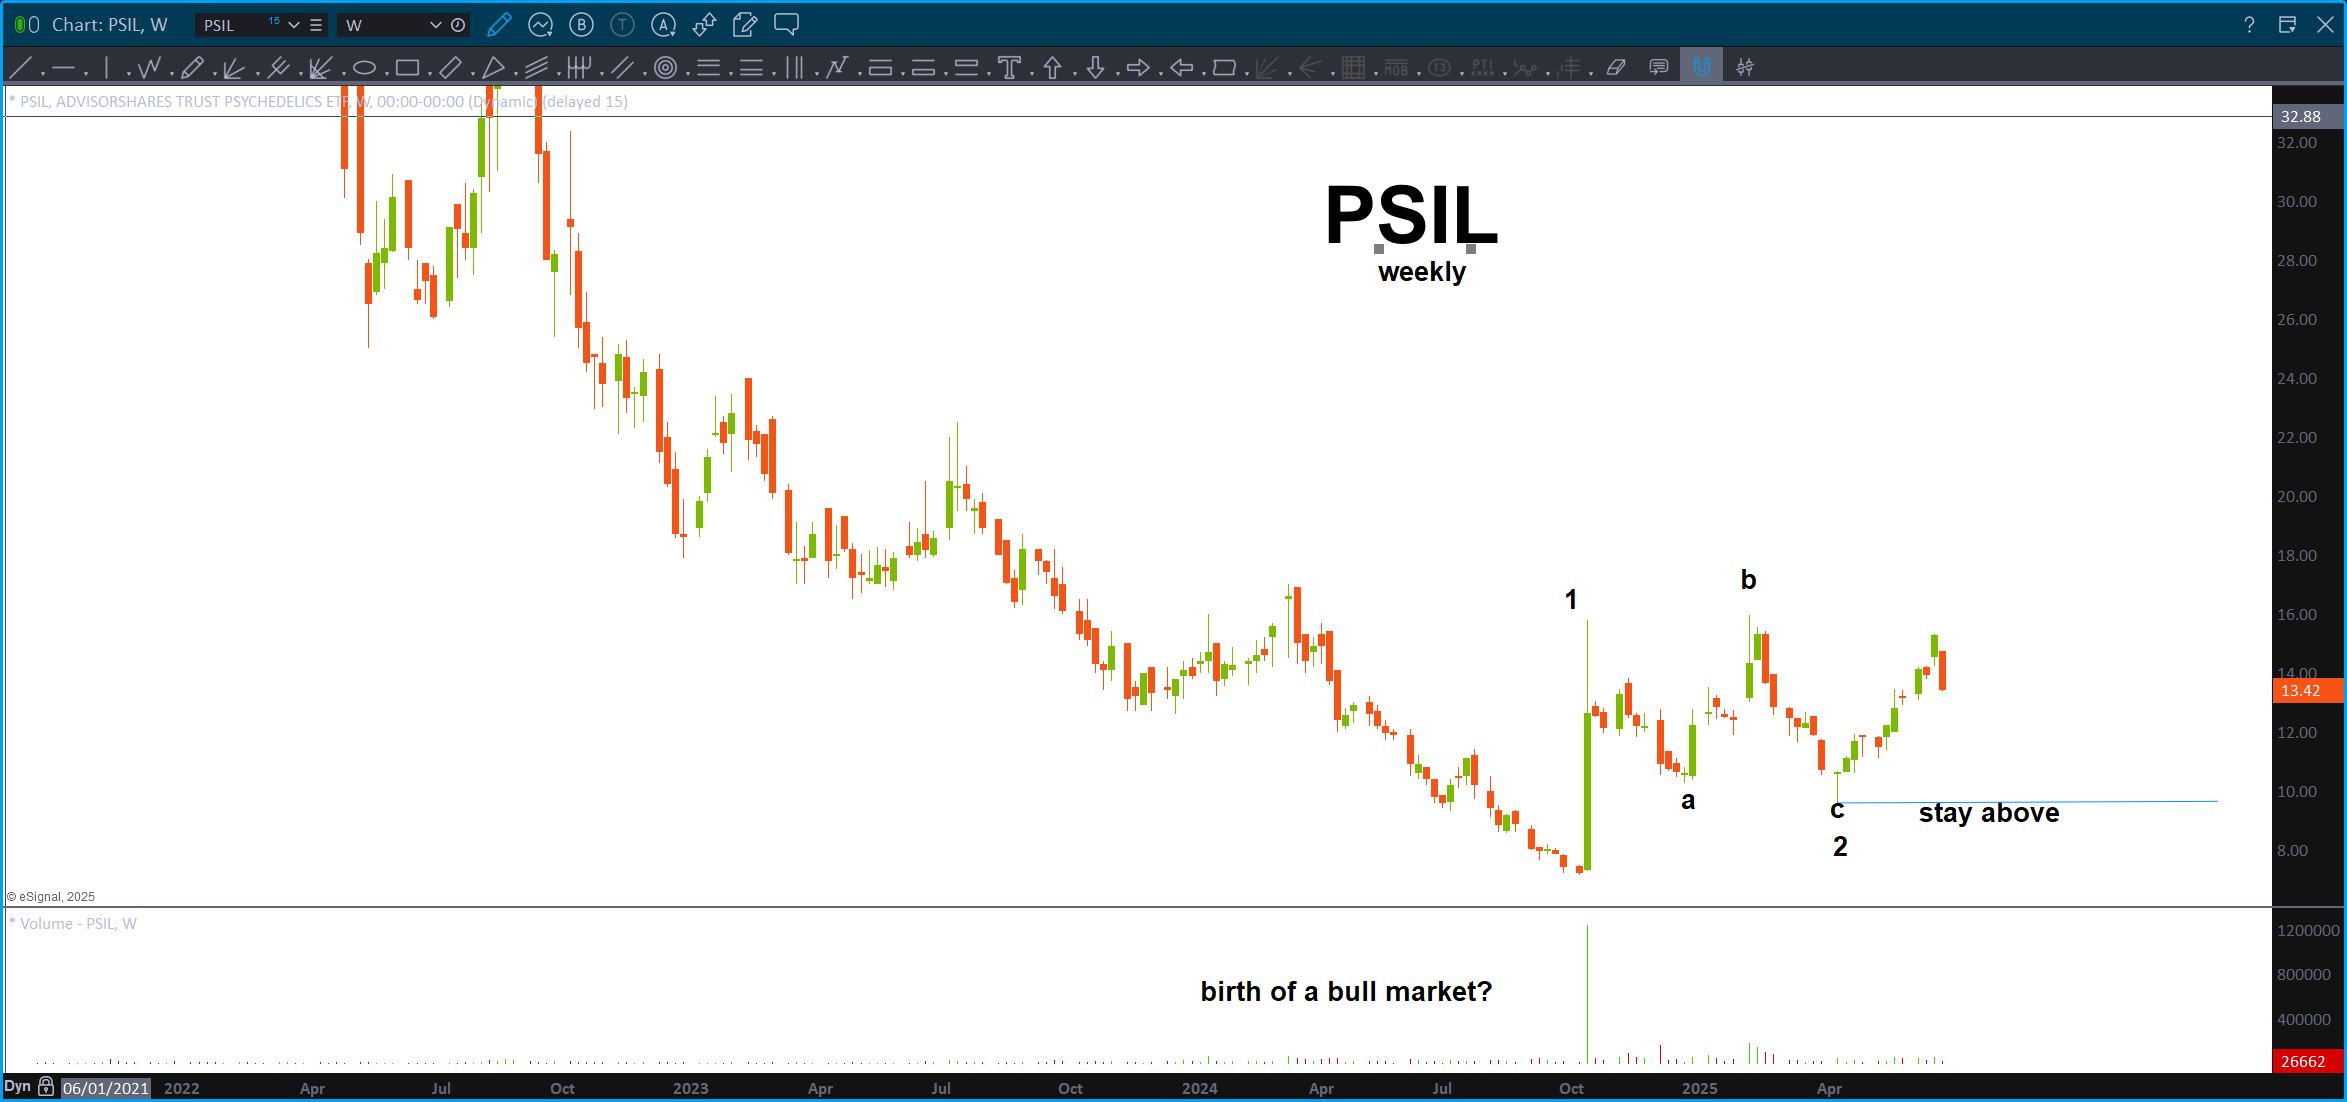
PSIL – I’ve been long for a while and just want to update you on ETF that tracks this nascent (trust me – VERY) sector. For this count to remain valid, price cannot close below “c” or less than 9-10 bucks. Big readout today. Check it out:
Global Dow – June 22, 2025
Posted on June 22, 2025 1 Comment

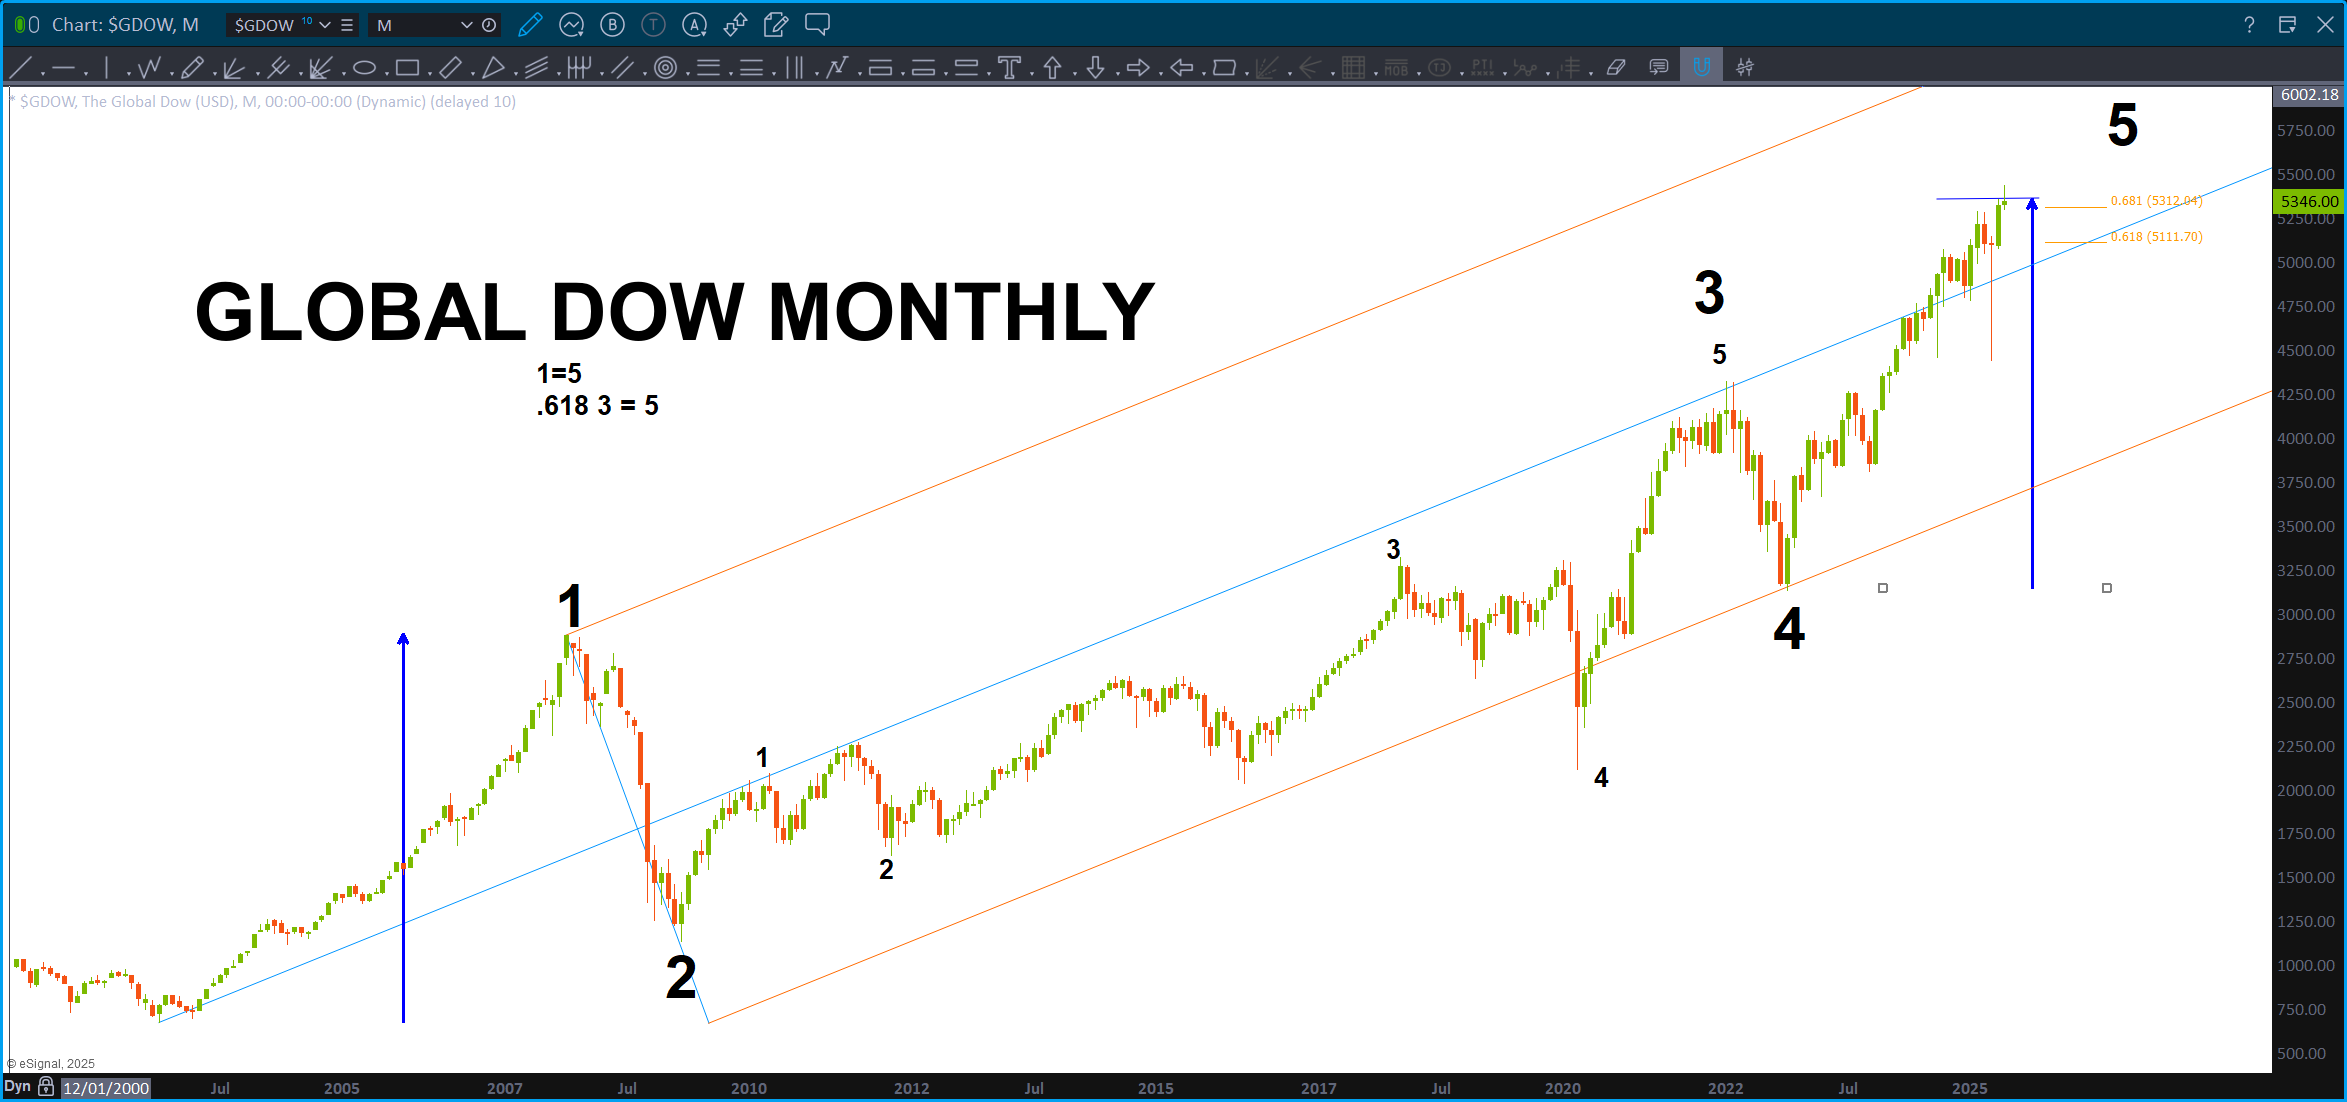
If you search on this site for the Global Dow you will see that I’ve been searching for a top in this index as it certainly appears, from a Ray Charles perspective, to be 1,2,3,4,5.
Did some more work on this when I got back from the Psychedelics Science Conference before the US bombed Iran.
KBW – June 16, 2025
Posted on June 16, 2025 2 Comments

My last post on the KBW showed 139 as the key resistance based on a measured move target. The high being hit on February 7, 2025.
Here’s the link to that post: https://atomic-temporary-44460632.wpcomstaging.com/2025/01/06/kbw-january-6-2025/
That top, in/around 139-140 is SQUARED OUT on 06/26/2025. Keep an eye on that date.
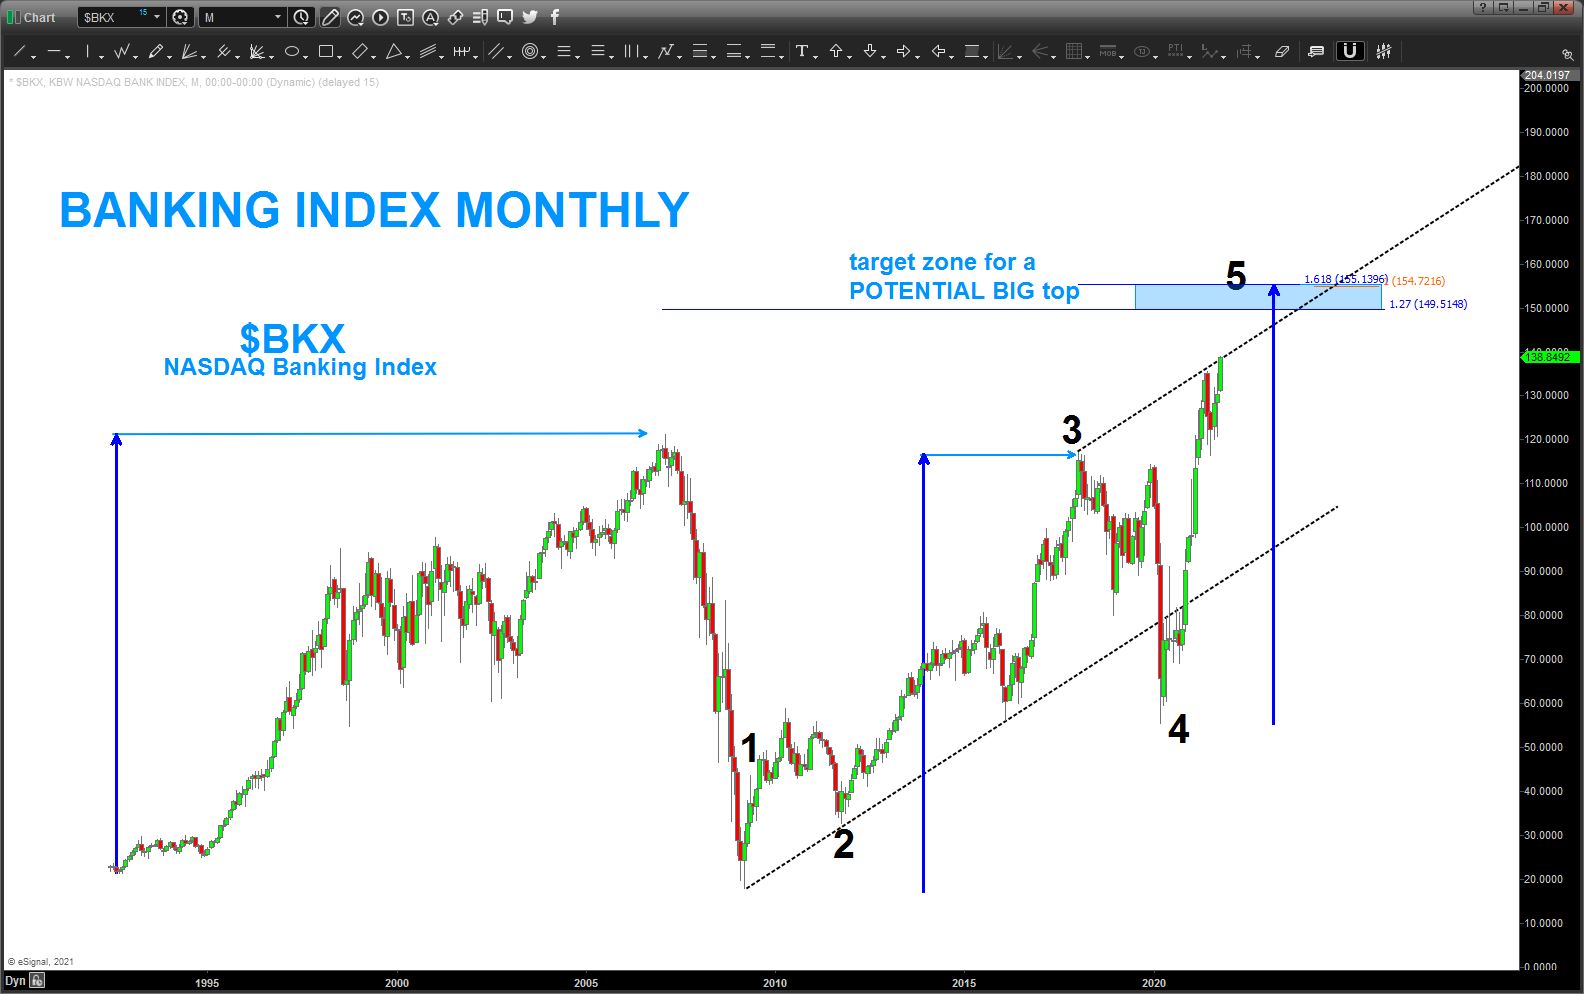
Here’s a chart from a while ago (October 19,2021) showing how, even though time has passed, the targets still remain:
Here’s the most recent price action on a Monthly … if we take the most recent swing high at 139-140 out to the upside then do believe we have a VERY strong target in the 155 area and the 160-162. YES I WILL BE WATCHING 161.8 for the resistance. 🙂
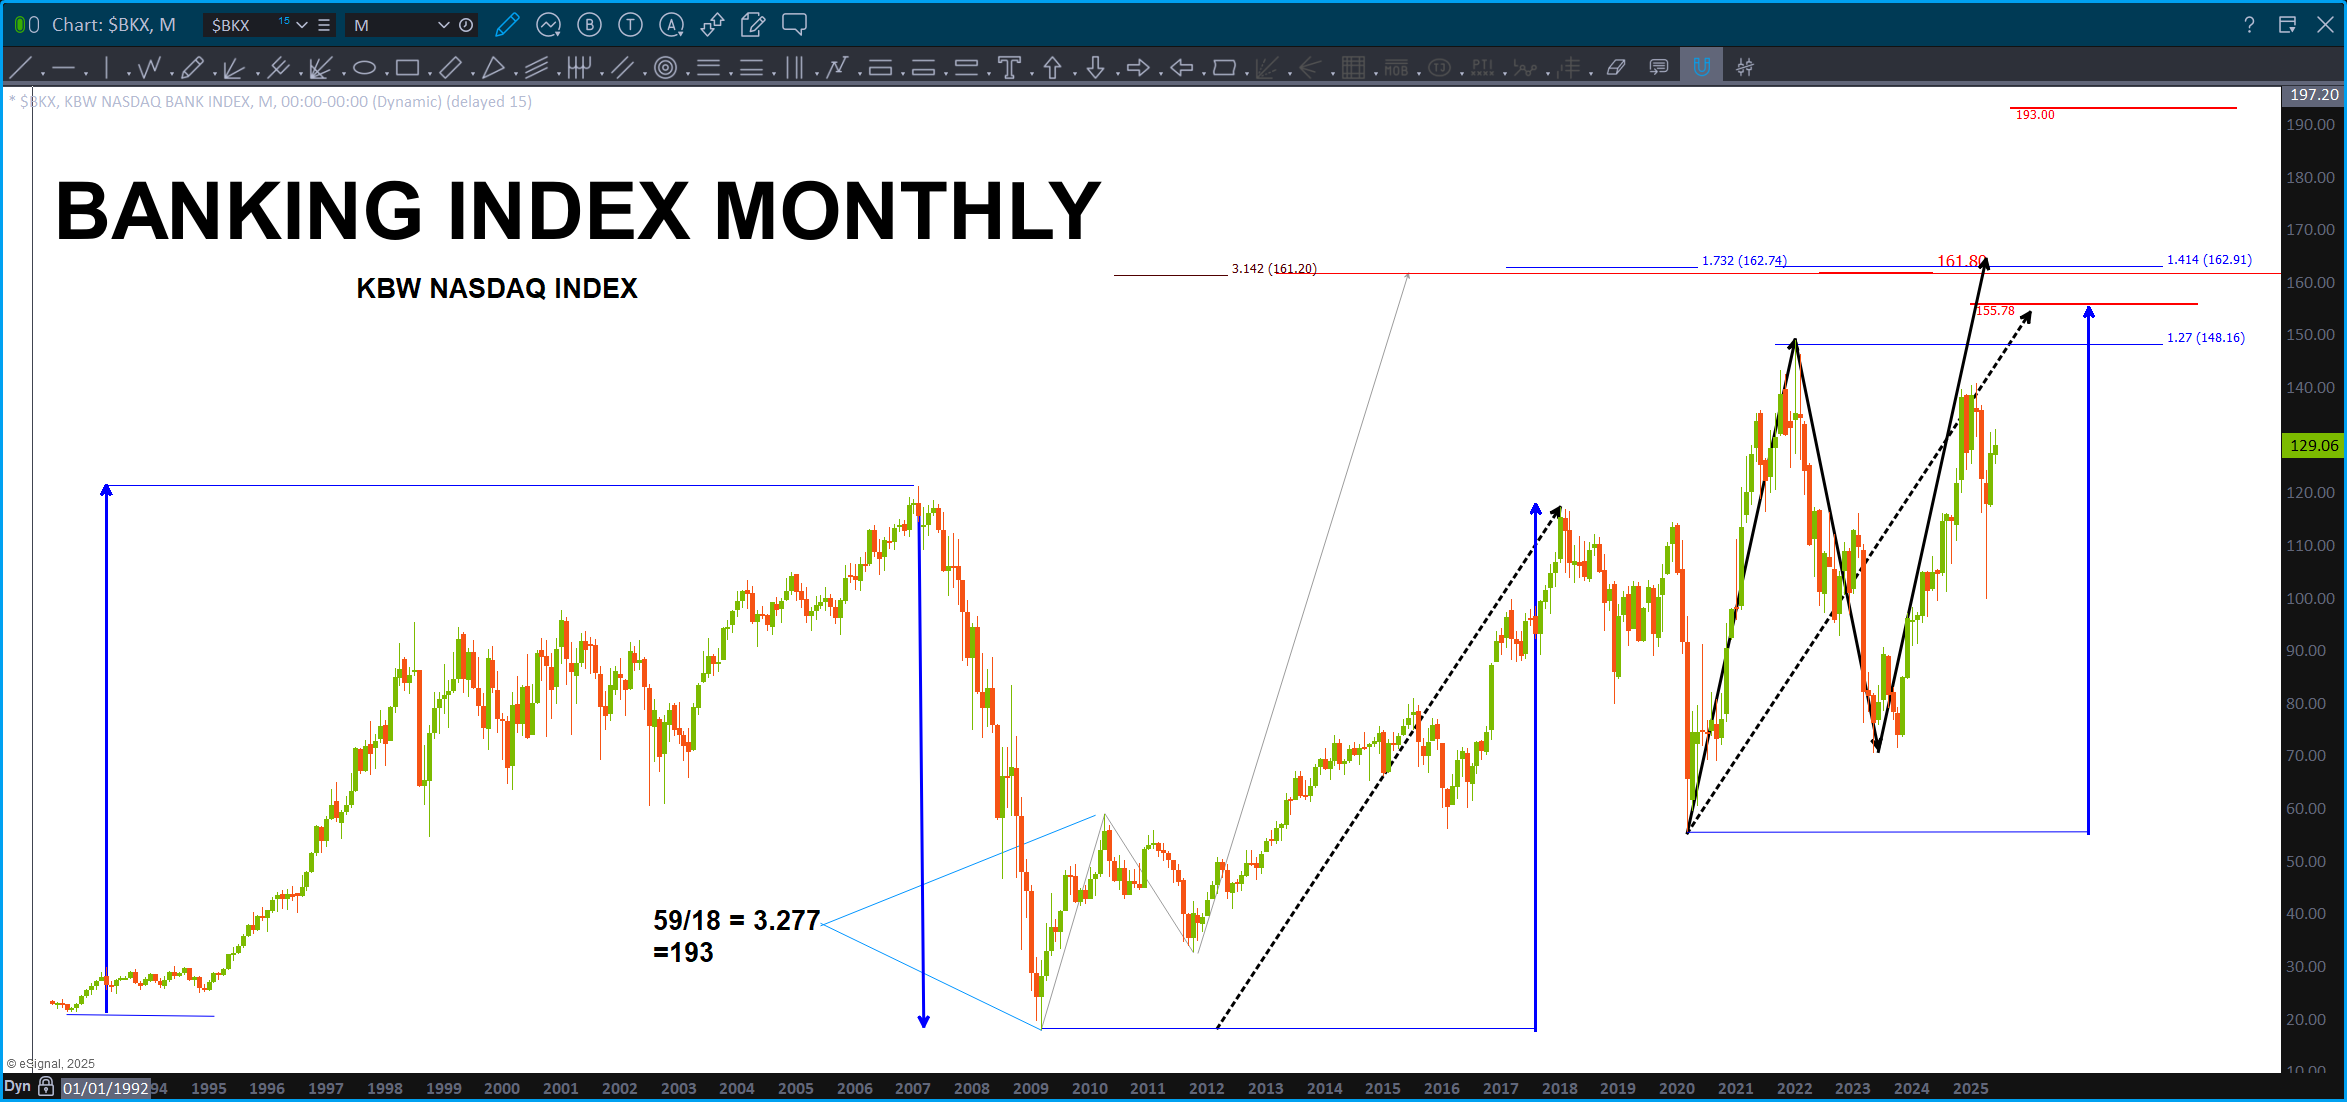
Explanation:
- Blue arrows – represent PRICE measured moves and have been responsible for every up and down move w/in this security. IF (still need to continue surging higher (I DO NOT know if we will or we won’t) we take out the highs then 155 and then 160-162 is the target.
- 59/18 is a calculation of the fundamental frequency … that target is much higher in the top right.
- The black solid and dashed lines are projections … notice the dashed black line lands right where the blue measured move vector ends. 155.
- There are extension targets and the initial impulse move projection is 3.142 AB=CD.
This ‘should’ be very strong resistance for the KBW. Only time will tell.
Remember, we still need to take out the highs … not sure if will do that. Who knows …
