MSFT Microsoft UPDATED and UPDATED again ..
Posted on June 13, 2017 Leave a Comment
06/13/2017 – “still in play” has been hit which equals a 1.27 and AB-CD on a monthly. Note, the ‘big AB-CD’ from the all time low is around 75. That could still be hit. Wait for a monthly SRC (monthly close below 68) to close or short, I believe.
Back in the saddle .. been a great time off marrying off my first daughter.
Bart

_____________________________________________________________________________________
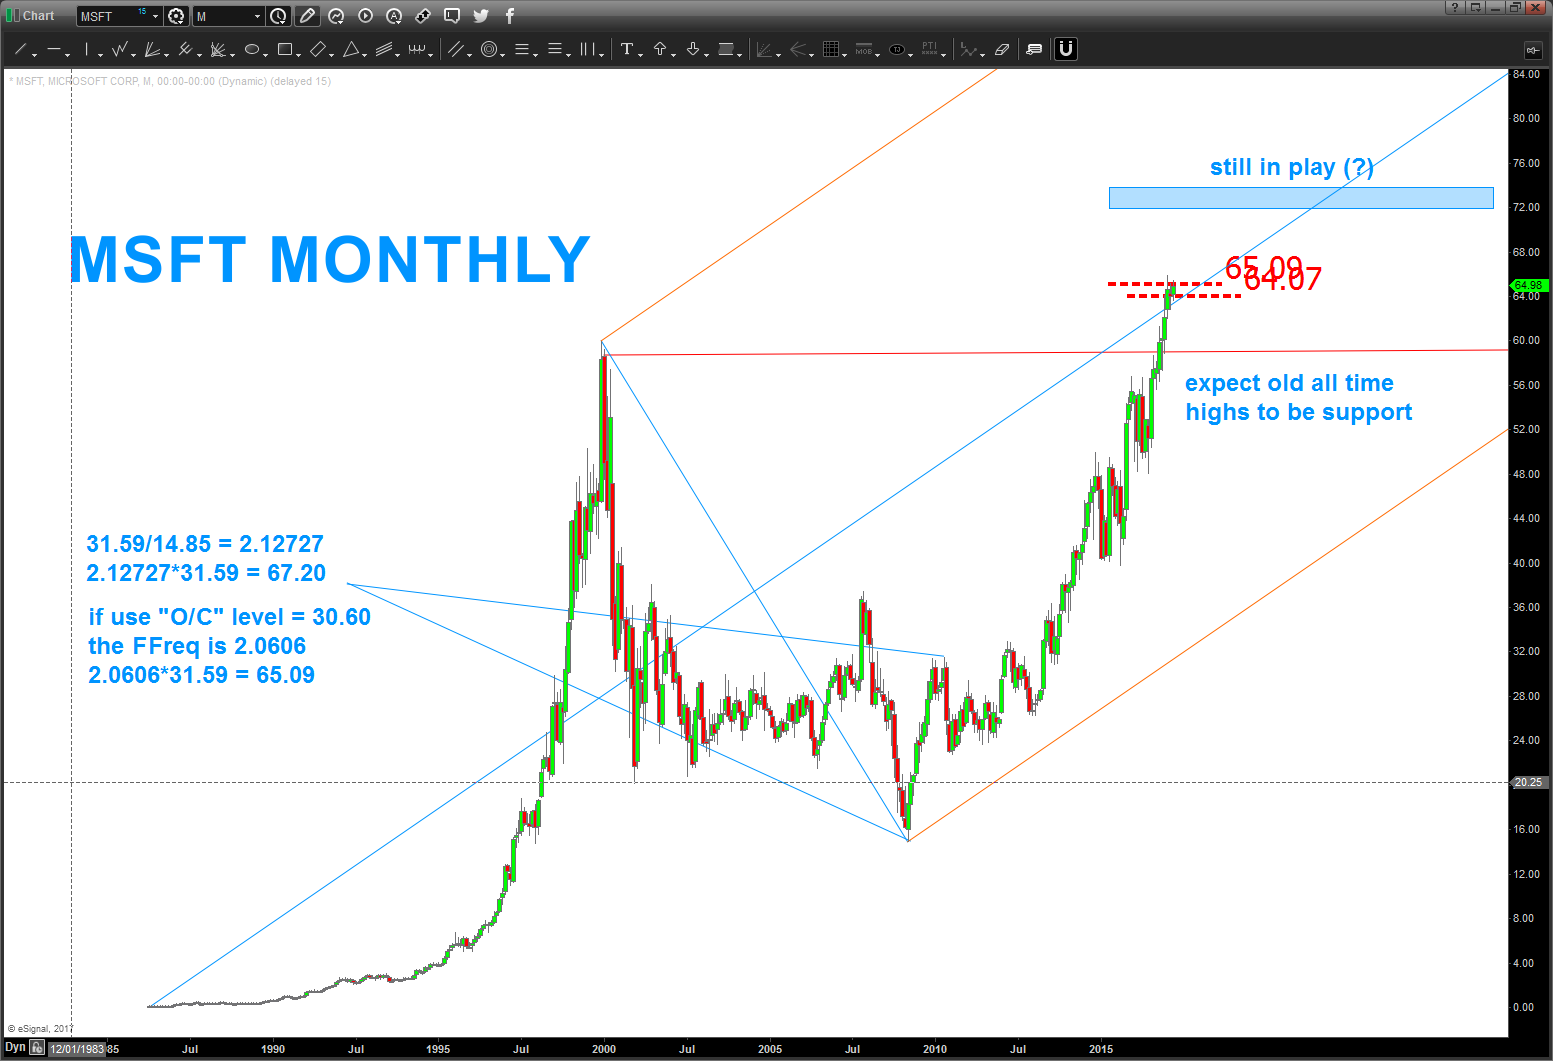
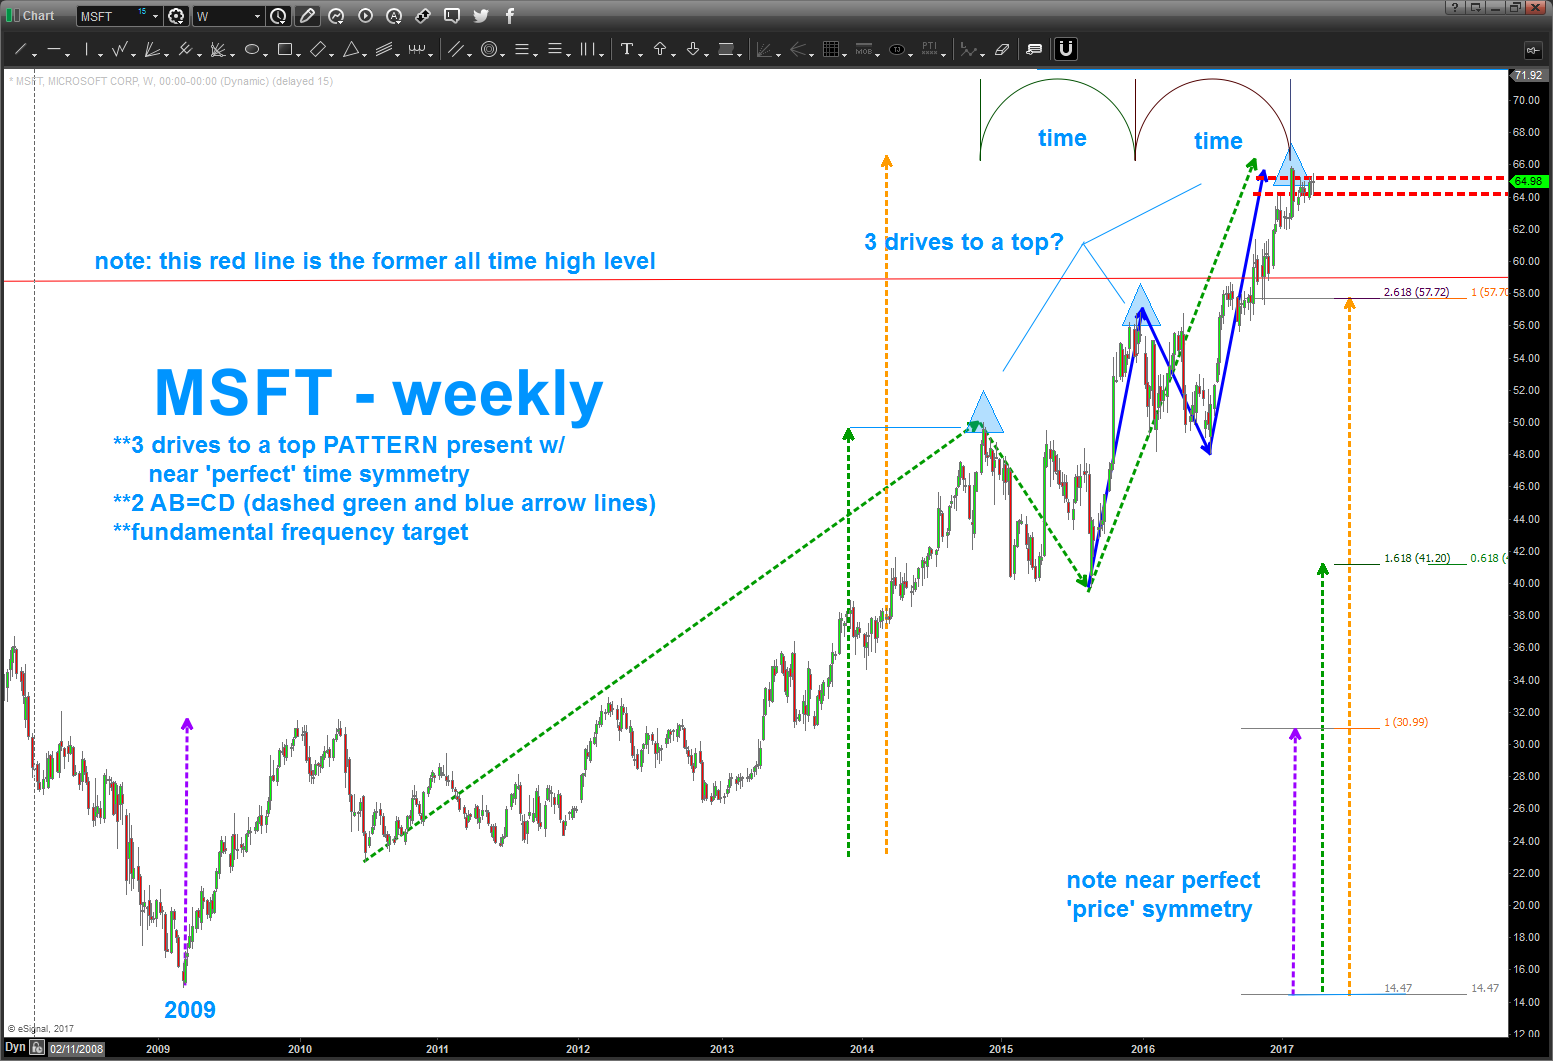
03/25/2017 – appears we have some stalling at new all time highs. below is a monthly w/ the fundamental frequency calculated (FFreq) showing the 64-64 area to resistance. if we pull back from here, a logical first stop and perhaps a buy is around the old all time highs in the early 2000’s.
now, below you will see the weekly chart from 2009. lot’s of stuff going on so I’ll break it down:
- blue triangles shows us a POTENTIAL 3 drive to a top pattern. note the time symmetry … very nice
- the blue arrow lines show the AB=CD
- the dashed green lines show another AB=CD (that one goes up to 66 but it’s pretty much there)
- note the horizontal red line – that’s the old all time high
- on the right side of the chart, note the near perfect price symmetry
so, I can see “why” it’s stopped here. a pullback is to be expected but if we break down below the old all time highs on say, a weekly candle, then something might also be up and a bigger move lower could be in the works.
the BIG PATTERN up in/around 72-74 is still in play, but perhaps not quite yet?
stay tuned.
_______________________________________________________________
10/20/2016 – it’s hard being a musical chartist. inherently you find yourself a contrarian (which you really aren’t) because you just see patterns and music and harmony w/ form, balance and proportion. yes, I get it, MSFT is all the rage because it got to new time highs. but who was ‘talking’ about it when it was about to complete an EXACT pattern based on music and geometry (see below) in/around 13-14 dollars. nobody …also, note, the chart below showing the BUY was “real time” in that, as my faithful readers know, I try really hard to not “should have” or “would have” or “could have” on the chart ….
so, w/ the monster gap up to new highs that opens up the 72-74 area for the next pattern.

note the strength in MSFT .. .618 from Monthly charts (projections) usually cause more resistance.
enjoy.
Bart
Here is the BUY on MSFT – some amazing harmony, form, proportion and balance. Just take one second and look at that chart … no idea what is going on w/ their fundamentals and, it was quite the “crazy” time for it to find support during the 2009 thump. But … a PATTERN is a PATTERN is a PATTERN. so, here’s the BUY on MSFT issued in March 2009.
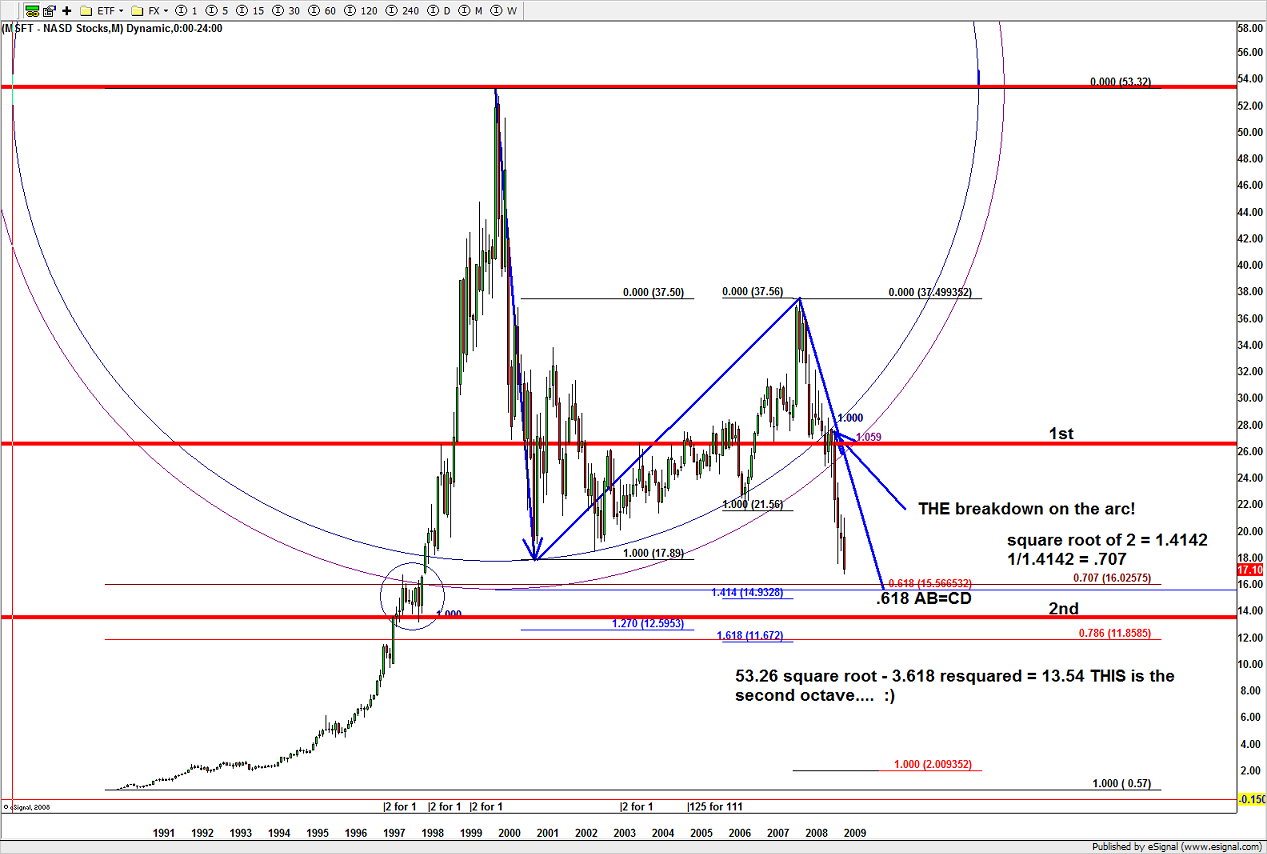
BUY on MSFT in March 2009
so, where are we now?
we are approaching the .618 from the all time high on decreasing volume and an overall market that “should” be correcting. Time to take some off and get ready for the next wave …in my humble opinion. (note – 50-52 is still a target.)
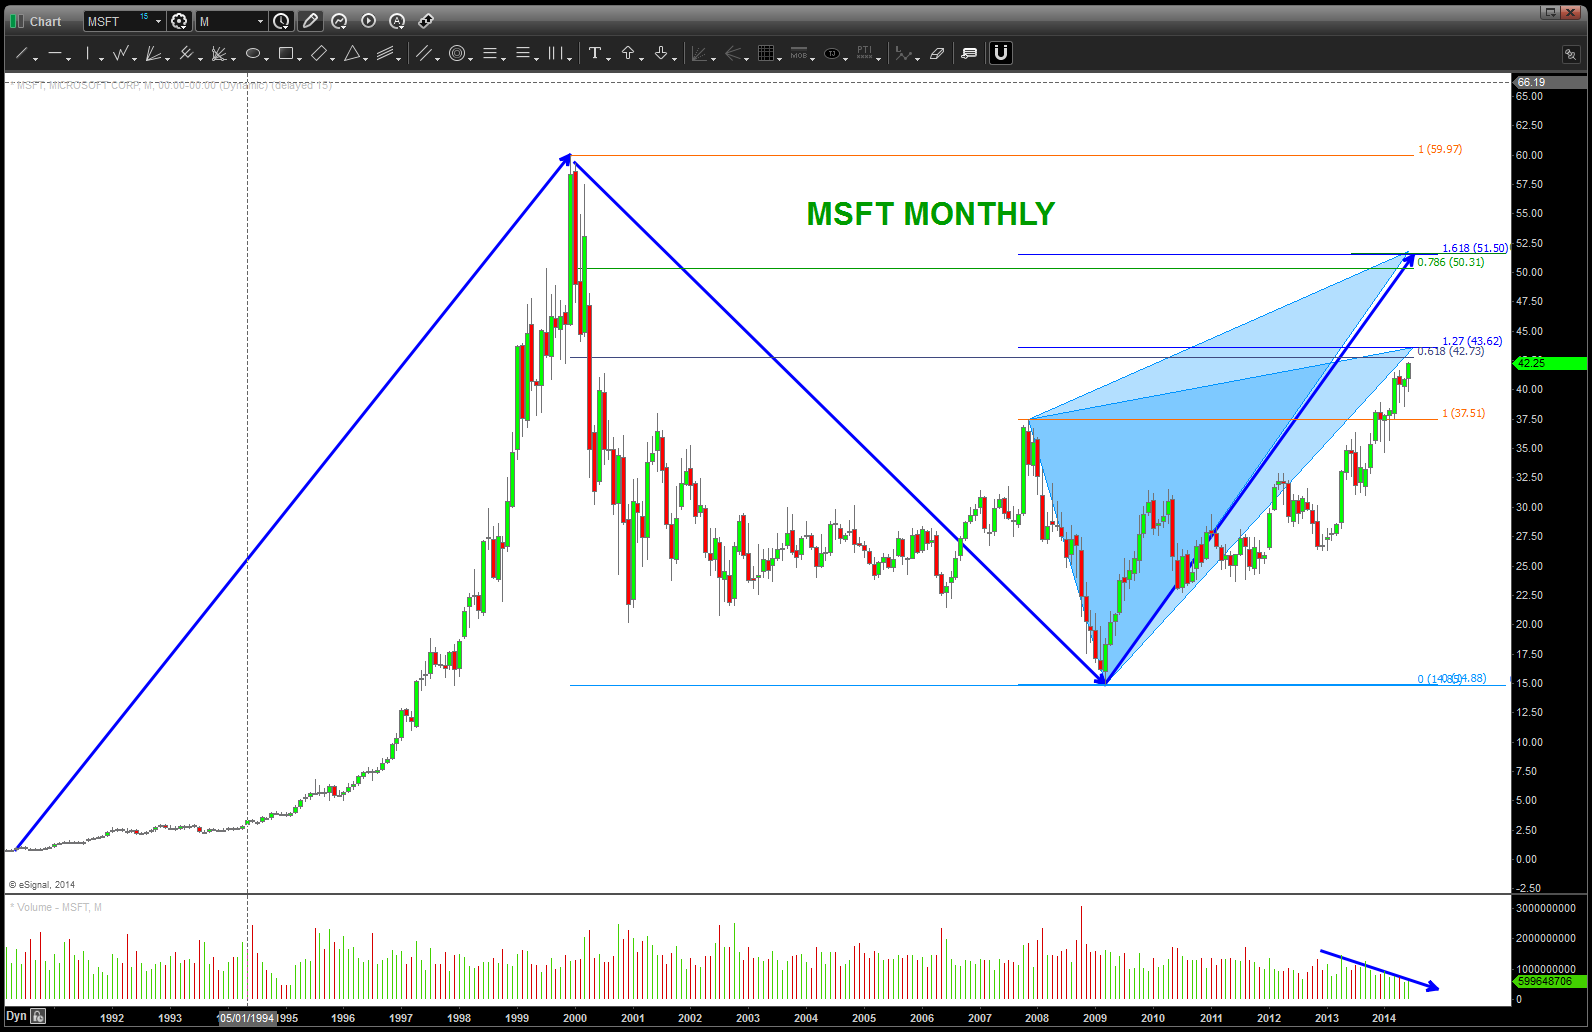
MSFT approaching resistance zones – watch closely or take some off the table
Memorial Day
Posted on May 29, 2017 1 Comment
05/29/2017 – Memorial Day. No matter your political party, it takes all shapes, sizes, color, sexual identity and anything else to run the military of the United States. It’s flipping amazing and I’m so so so honored to have done my small part ….
for some background, back in the day, the F-14 Community would throw a yearly party called the Fighter Fling. It was truly a blast .. the ladies got all dressed up, the crews got their “mess dress” w/ medals on and then the party, well, started. I’ll just leave it at that …
the ‘highlight’ of the ball was the annual video which everyone submitted action shots for …
I can’t remember a fighter fling where – at the end of it – there wasn’t a memorial for someone who had lost his/her life flying. Every single year.
Well, as many of you know, the F-14 was decommissioned and taken over by the FA-18. (smart decision OBTW) In 2004 the Fighter Community got together for one last ball and at the end of the fighter fling video the list of names of everyone who had perished flying and F-14 was listed. It’s a pretty long list …
So, this is my blog and I can do what I want (note the South Park reference). Just wanted to have a few w/ a Navy background and a few w/out to recognize the list of names and if, time permitting, you could just close your eyes and take a deep breadth that would be cool.
Everyone rock on – ok?
Bart
fast forward to 17:25 as it’s pretty cool what they did w/ Van Halen “RIGHT NOW” .. but to get to the list of names go to 22:34.
Dollar Index since the Plaza Accord …room to run, BUT (?) …UPDATED and UPDATED and UPDATED and UPDATED and UPDATED again
Posted on May 29, 2017 2 Comments
05/29/2017 – warning, this is going to get geeky. sorry …
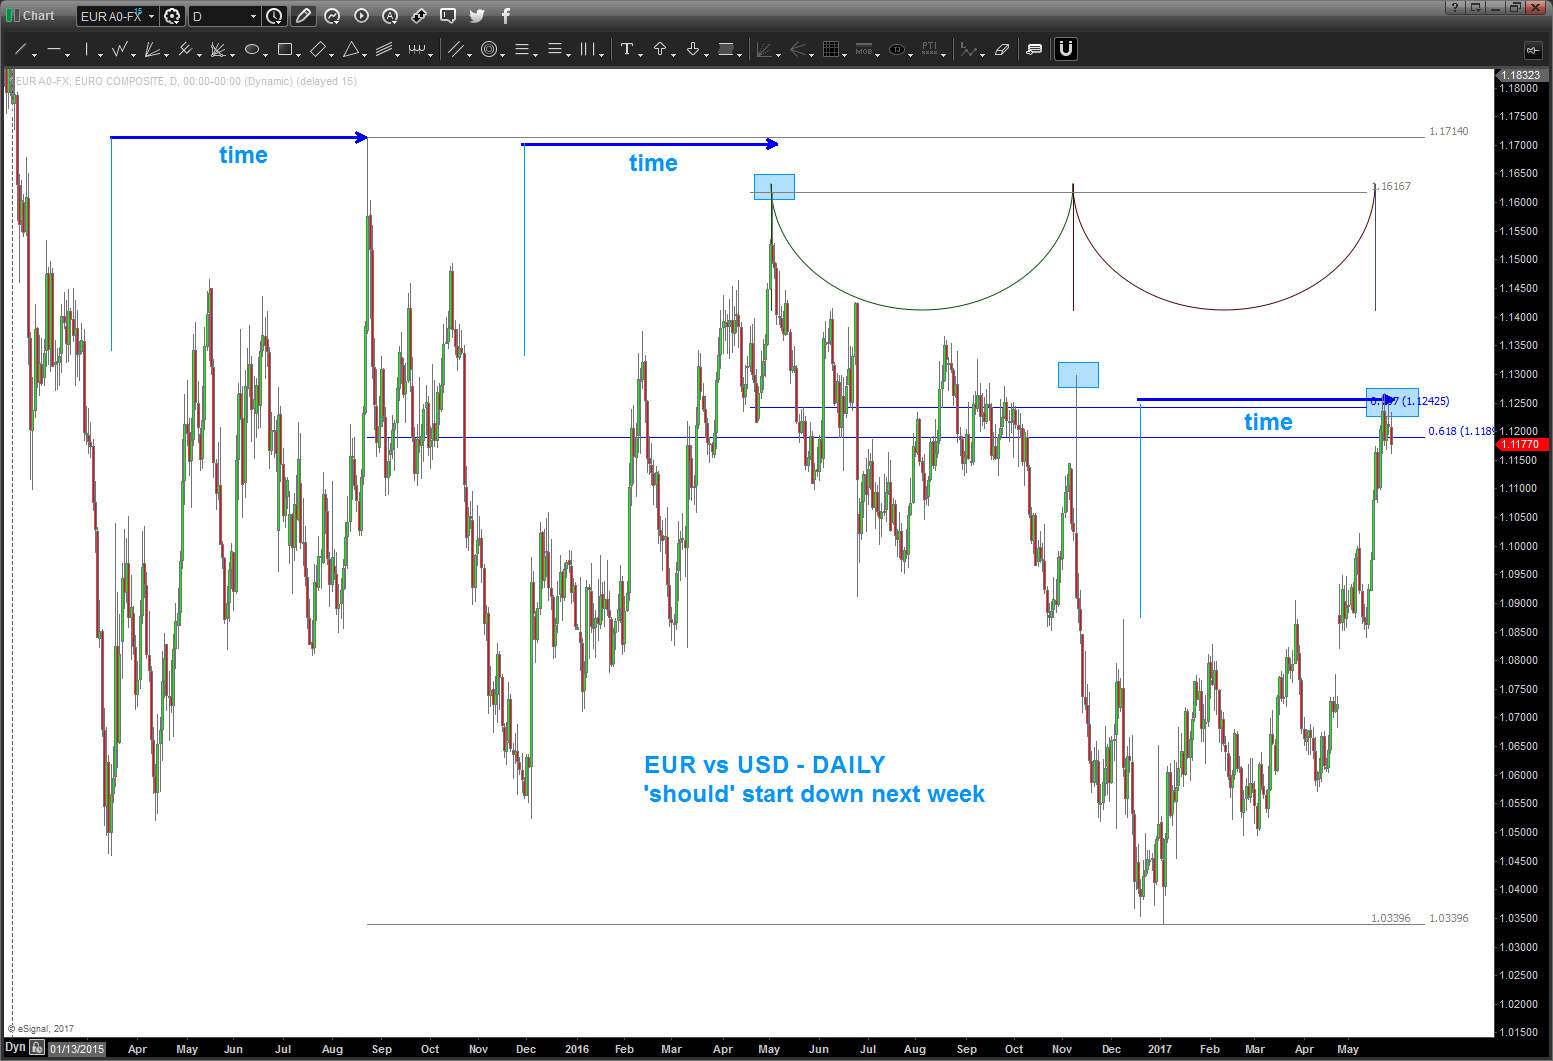
first chart below is of the Euro. Much like the Chief, sure appears that it’s ‘time’ for the dollar to rally. Note below, the time component of the rally off the lows. folks, this isn’t easy and I’ve talked to multiple people this weekend about “is the dollar toast” or is the “king dollar going to roar again”. I DO NOT KNOW … but, in the next couple weeks, w/ sentiment down at 8% dollar bulls we are do for a pause or a dollar rally.
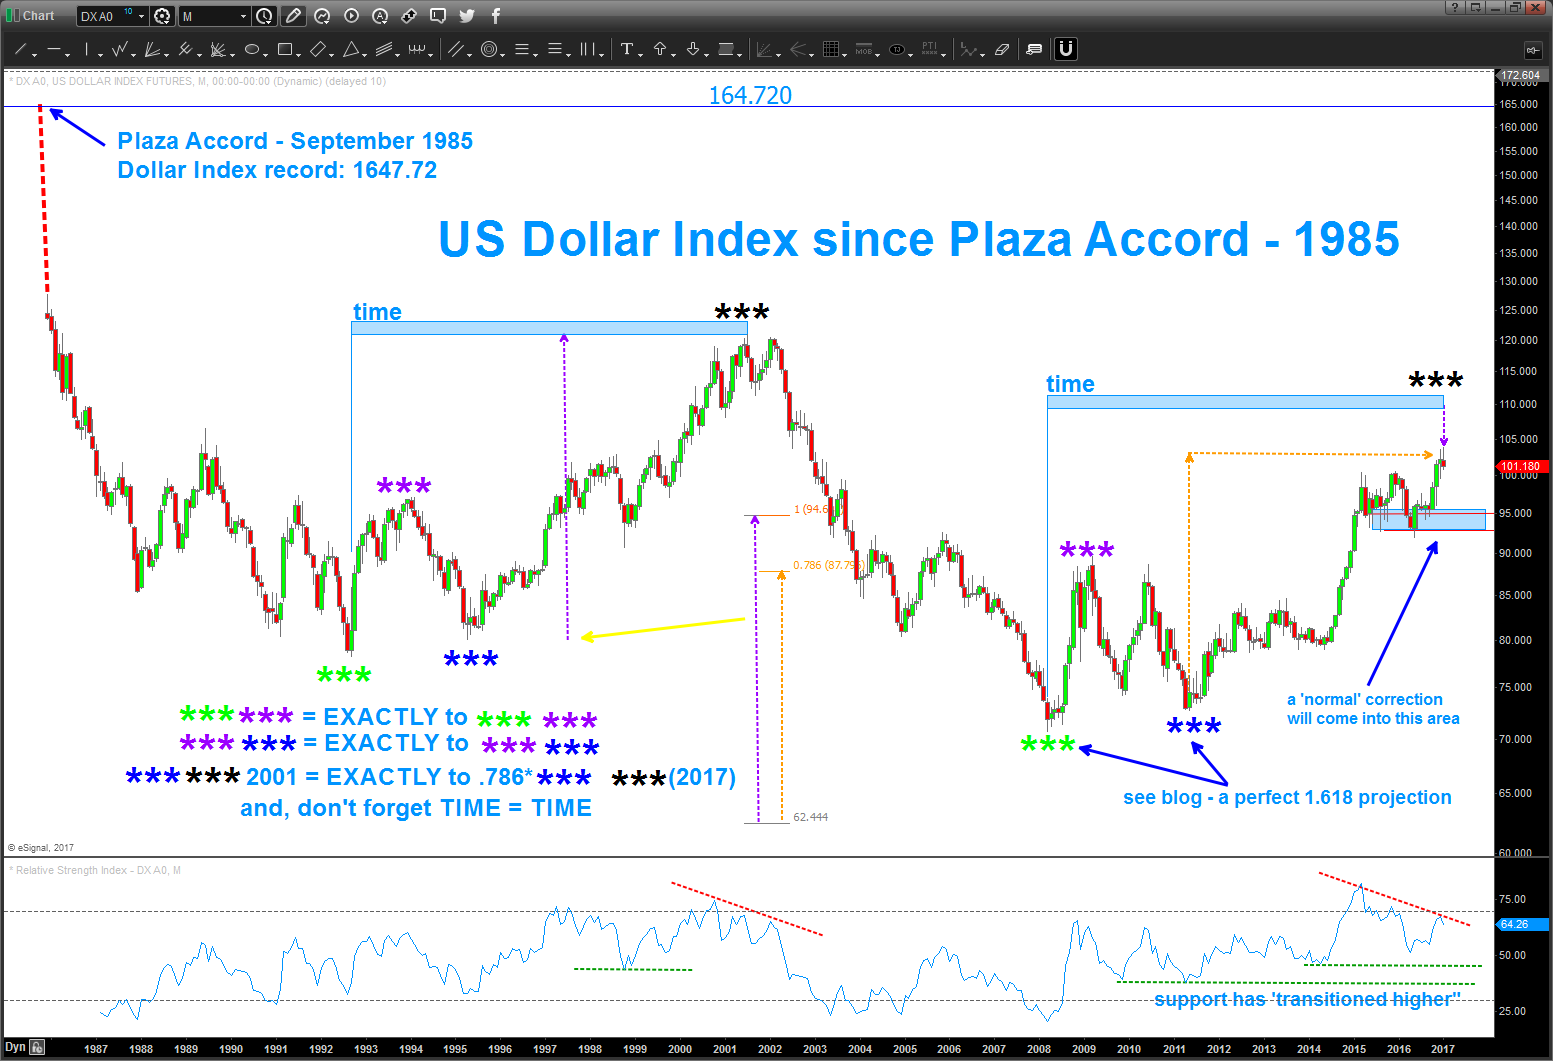
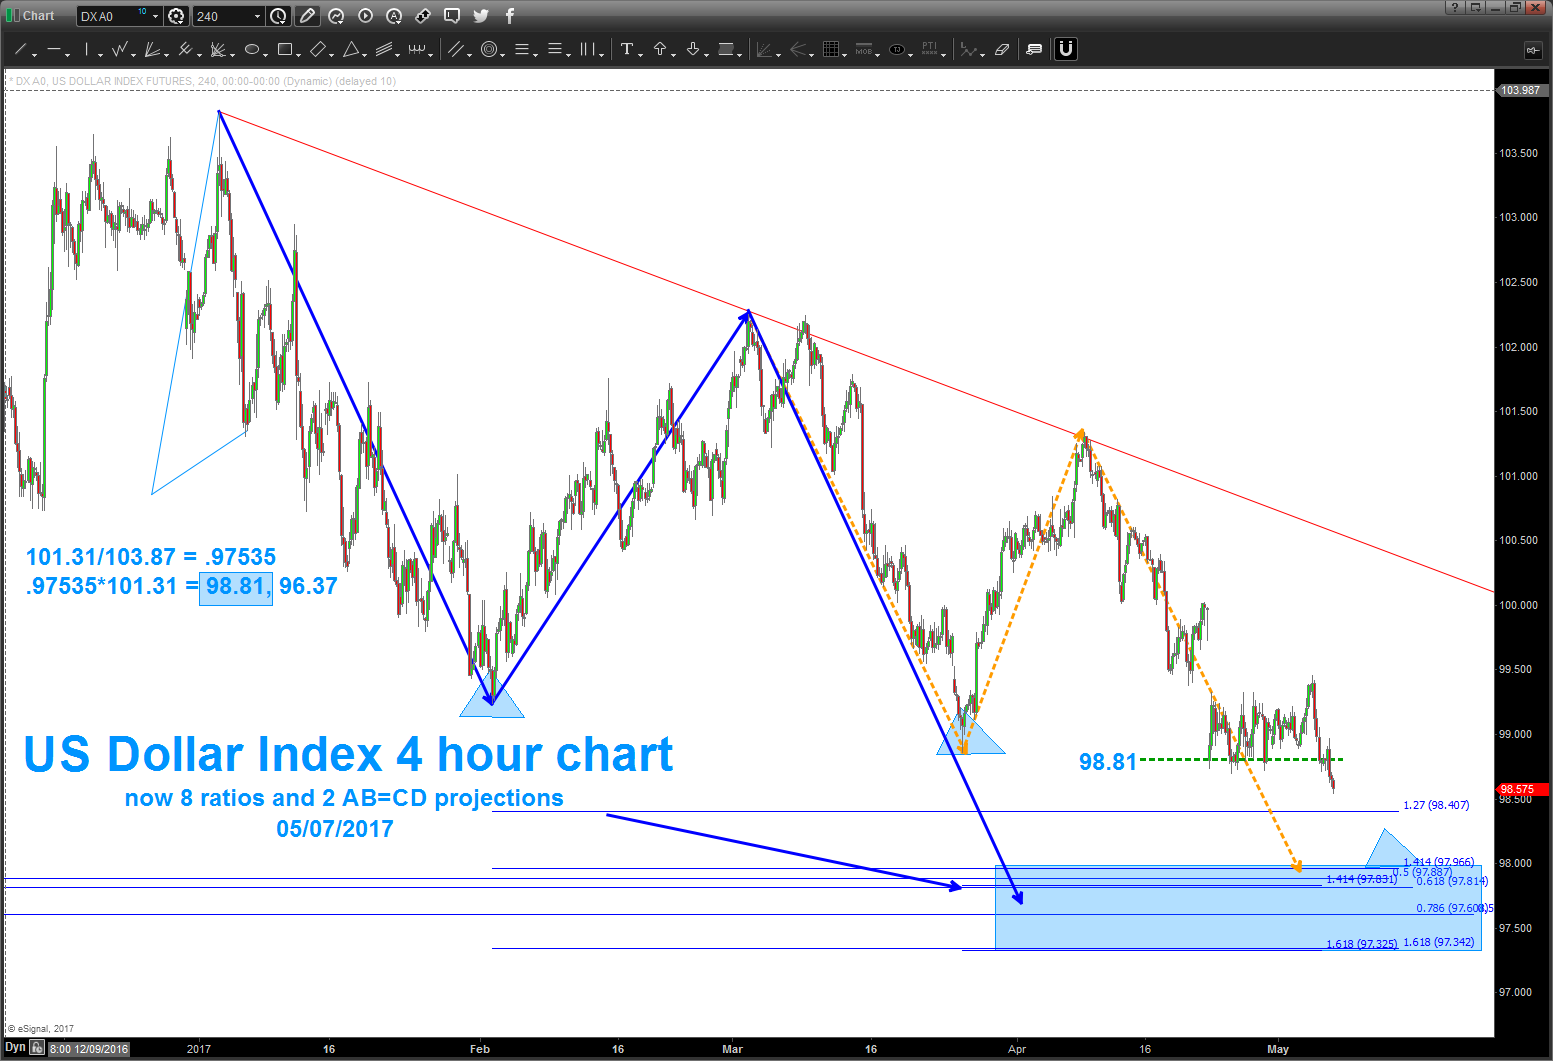
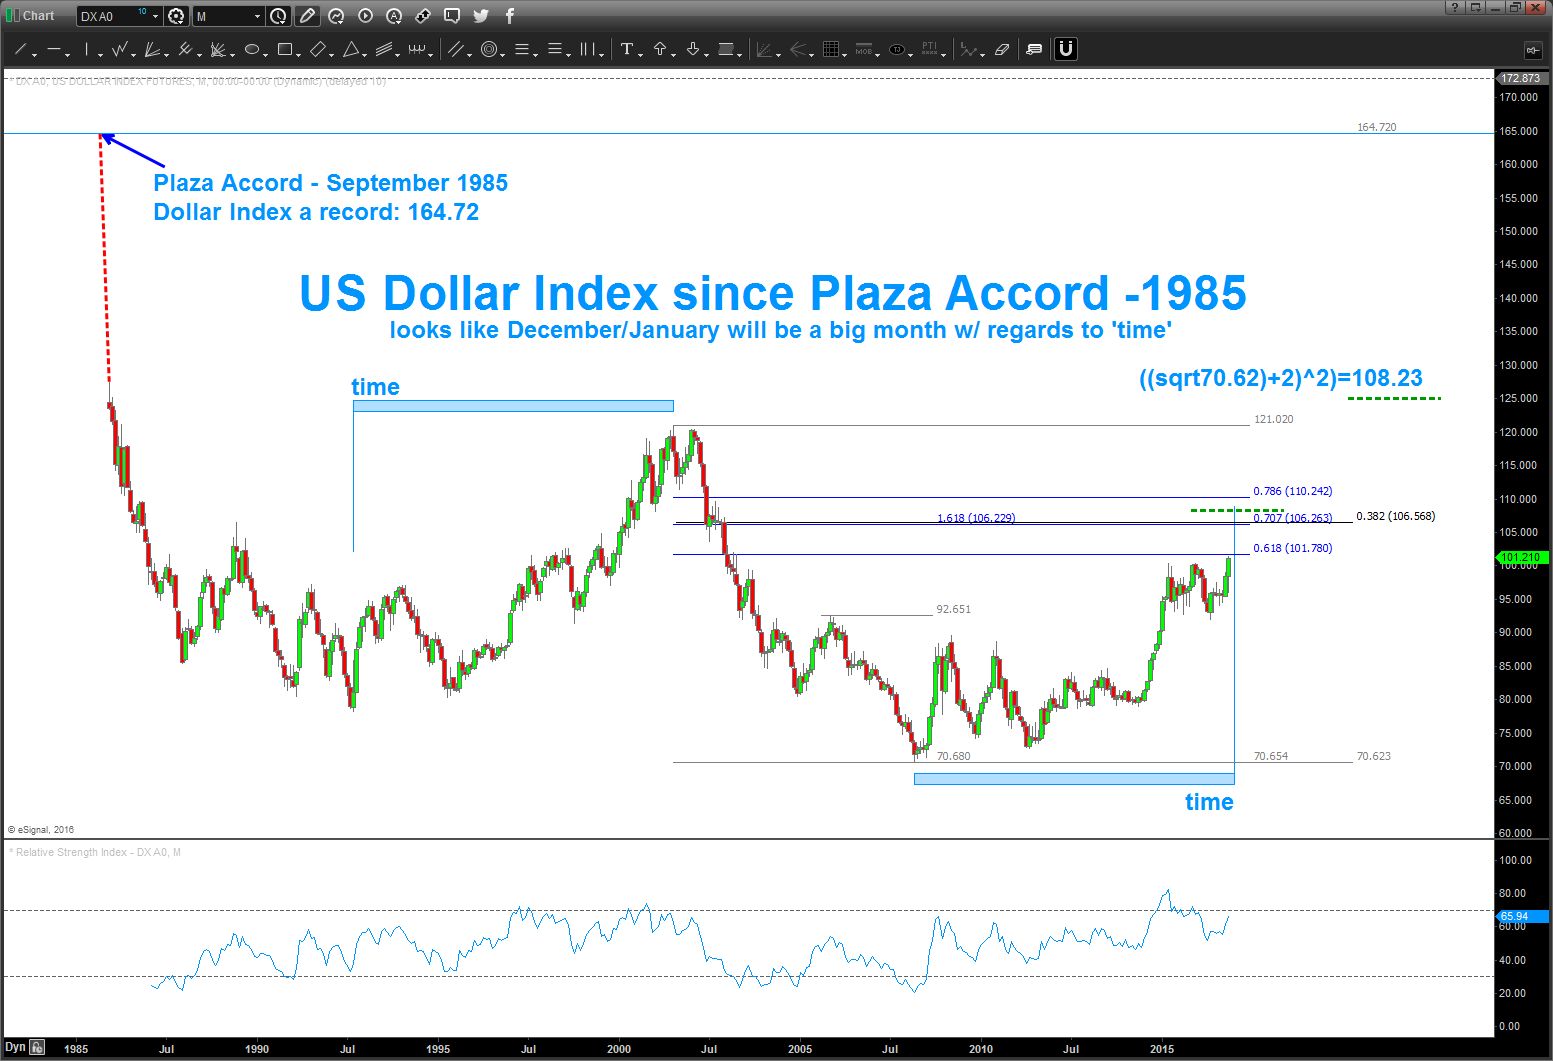
I want to insert this chart on the dollar index, I posted it a couple months ago and it was showing the mathematical harmony. This is important because the ‘high’ that occurred a couple months ago ‘made sense’ in terms of resistance. the math was perfect …
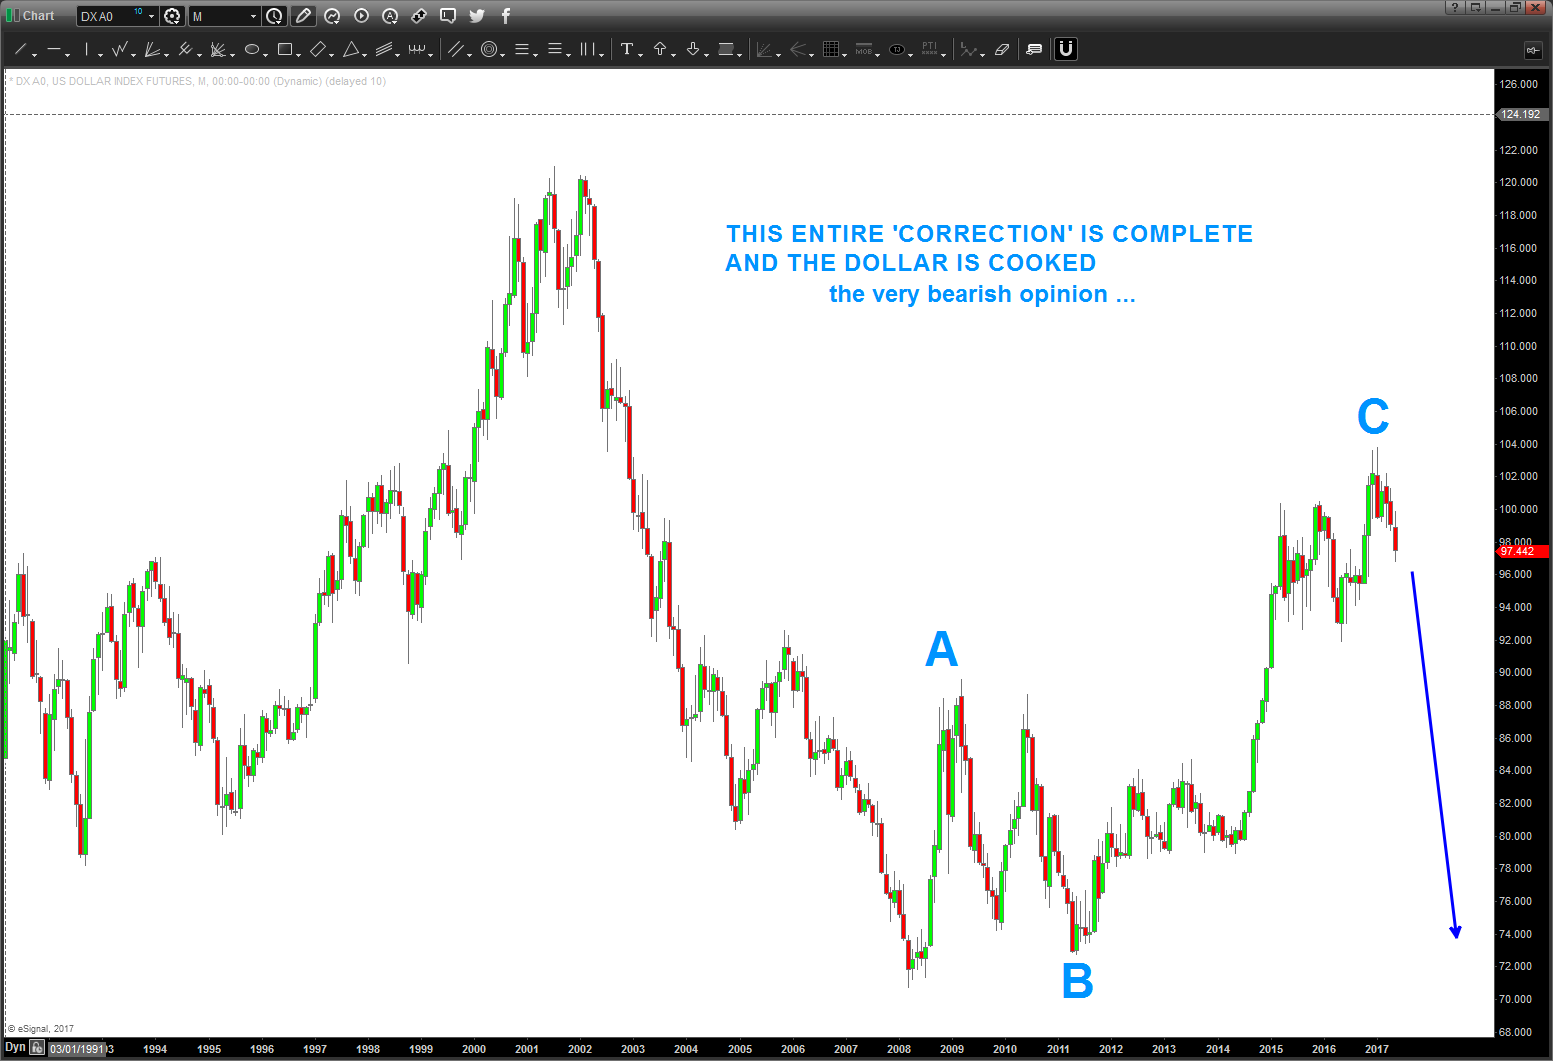
but here is the rub … have we completed an Elliott Wave corrective A-B-C and the dollar is toast OR are we correcting 4 of 5 right now …?
So, if you read below we looked for May 2017 to be a cycle and so far it has worked … that being said, I apologize again but I need to go do a little “Elliott stuff” to get a picture for the roadmap.
Some background: I am a CMT and w/ that designation comes a modicum of understanding of Elliott Wave. (it’s a requirement) That being said I also trained under the Master Constance Brown (http://aeroinvest.com/) not once but twice! (she also told me at one point to never count a wave again ) … to add to that I actually taught the CMT (i) Level III Elliott Wave online to hundreds of students. What’s that mean … I love Elliott Wave – when it works! (Work w/ me folks, that was supposed to be funny.)
Elliott Wave rules of the road:
- Trust and do not break the RULES. There are only 3 ….
- Wave 3 can’t be the shortest
- Wave 2 cannot go below/above Wave 1
- Wave 4 cannot overlap ANY of Wave 1.
- Master the corrections …
- Triangles, Flats, Expanded Flats, Zig-Zag, W-X-Y, double and triple threes
- Learn to recognize B waves .. (hint – they are always 3 waves)
- Learn to recognize a 3rd of a 3rd (read: thrust)
- Learn to use and trust LONG TERM (monthly and weekly) Elliott Wave counts … intraday is hard as hell.
- DO NOT USE Elliott in isolation …ever. use a MA, oscillator, price targets, RSI, etc. etc.
So, there you have it … it’s a very helpful tool (that’s all it is) and it’s NOT the panacea. it’s a tool folks …
but, it’s important right now w/ regard to the dollar index.
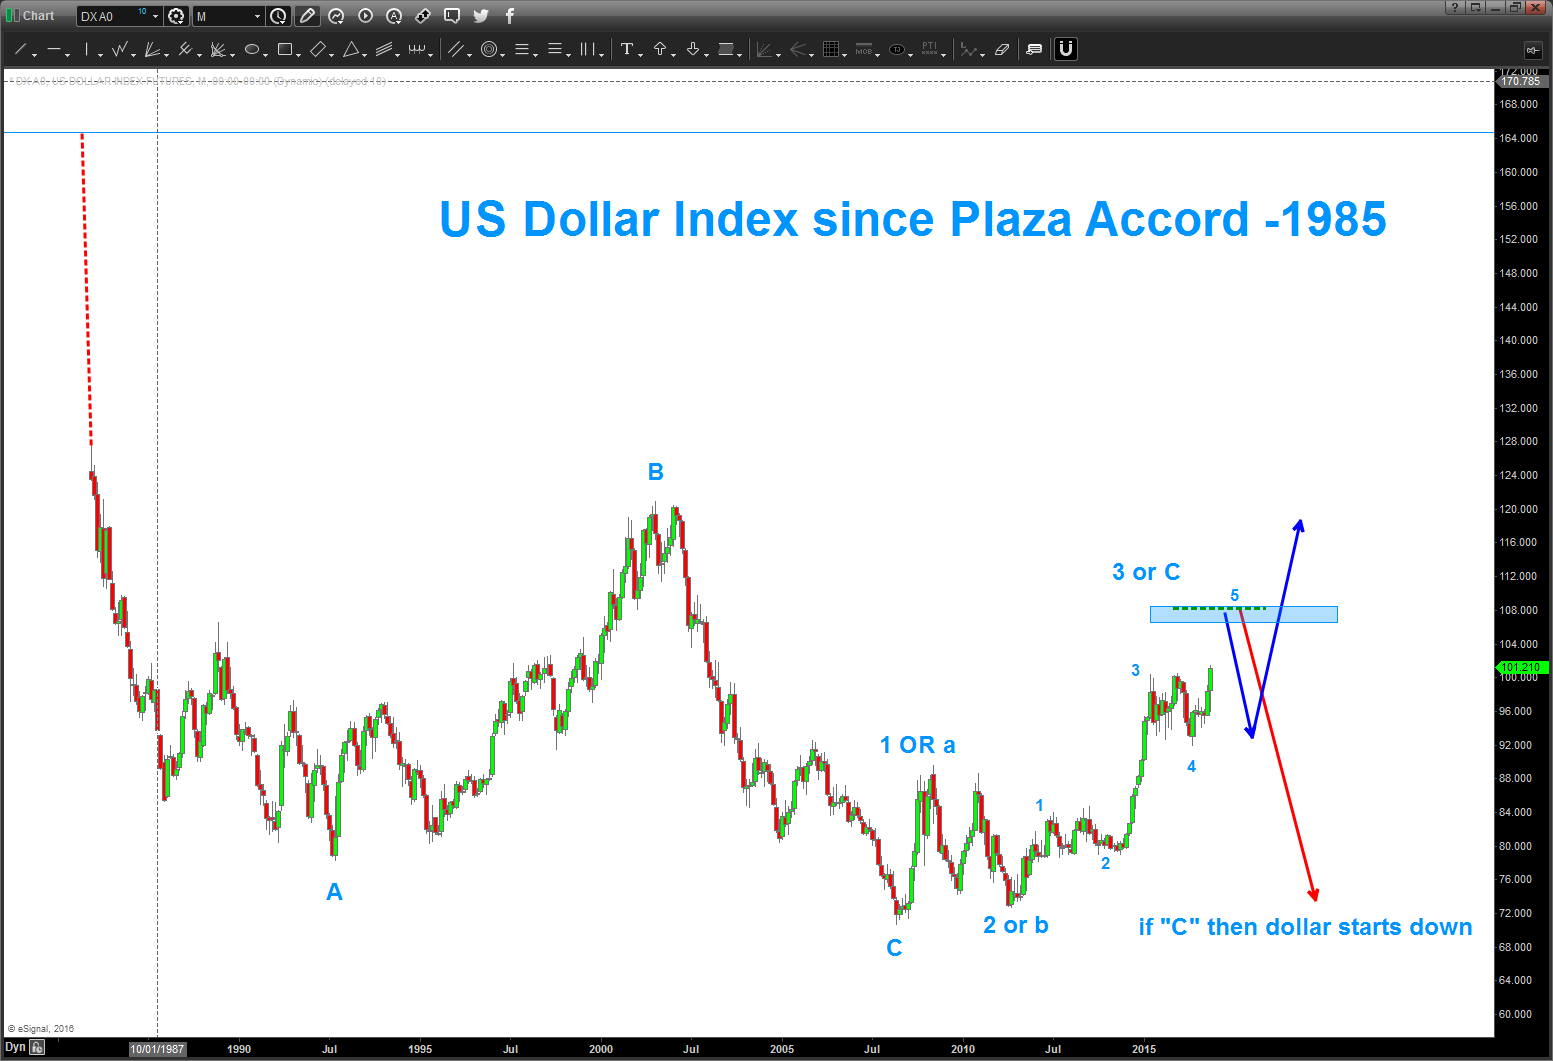
here’s the BEARISH VIEW – we finished an A-B-C correction (note on the cycle month) and down she goes …
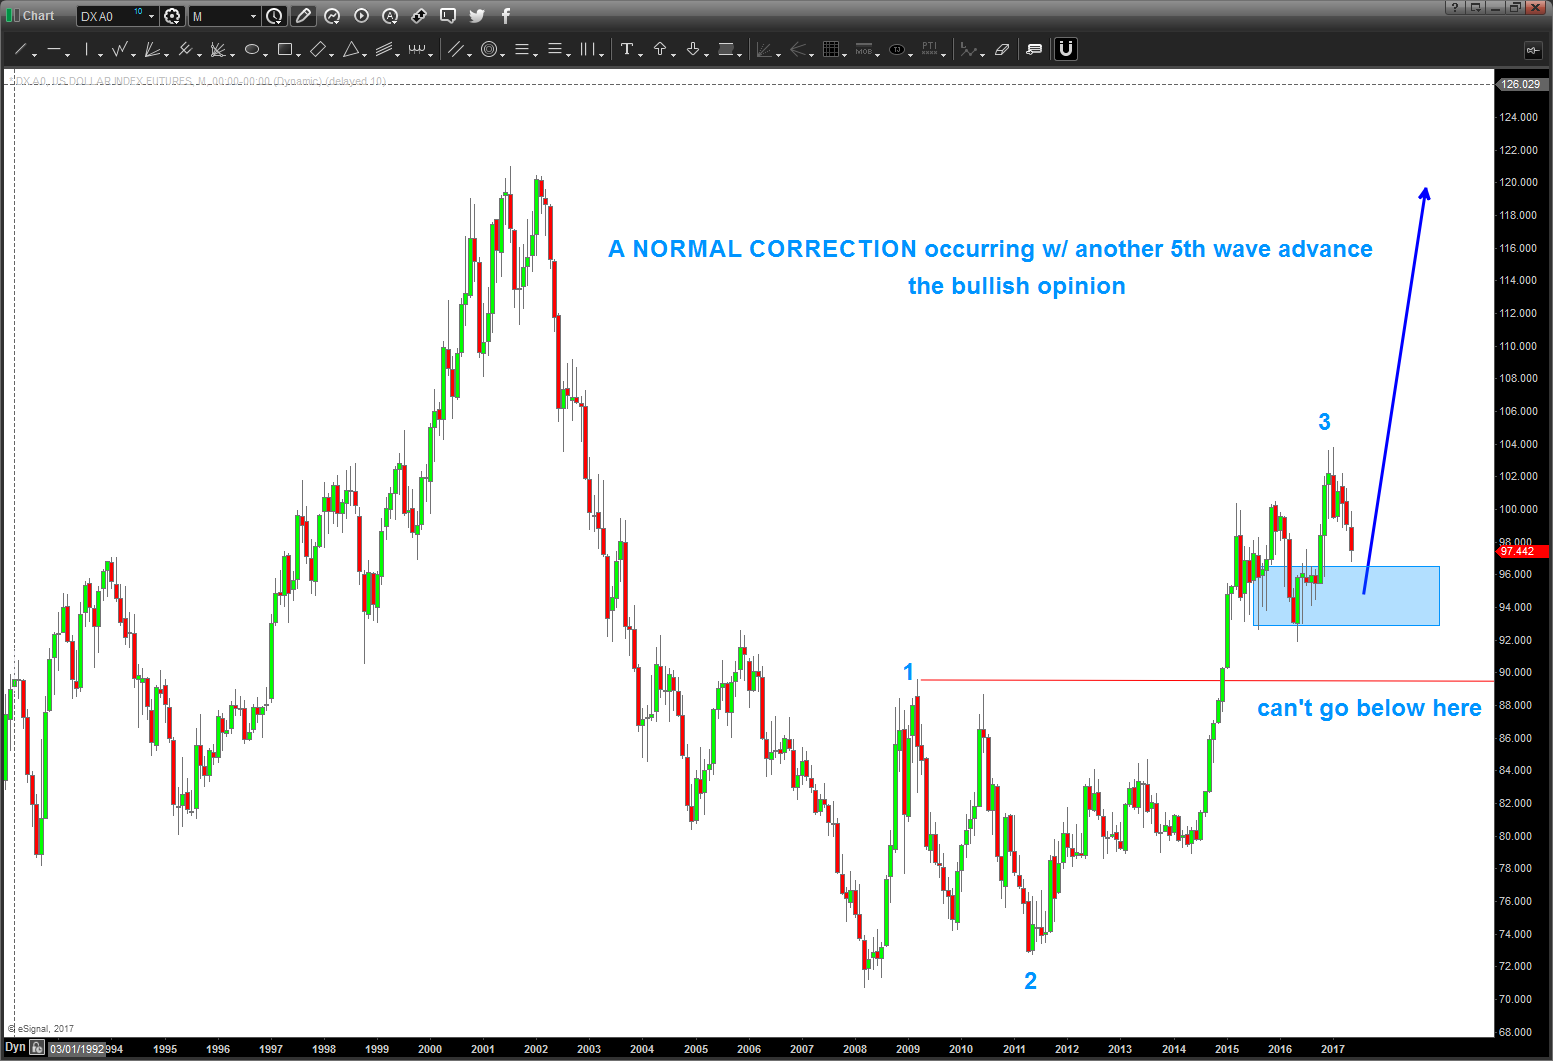
here’s the BULLISH VIEW – we just finished 3 and are correcting in 4 and a new high on the USD is to be made w/ a 5 up ….
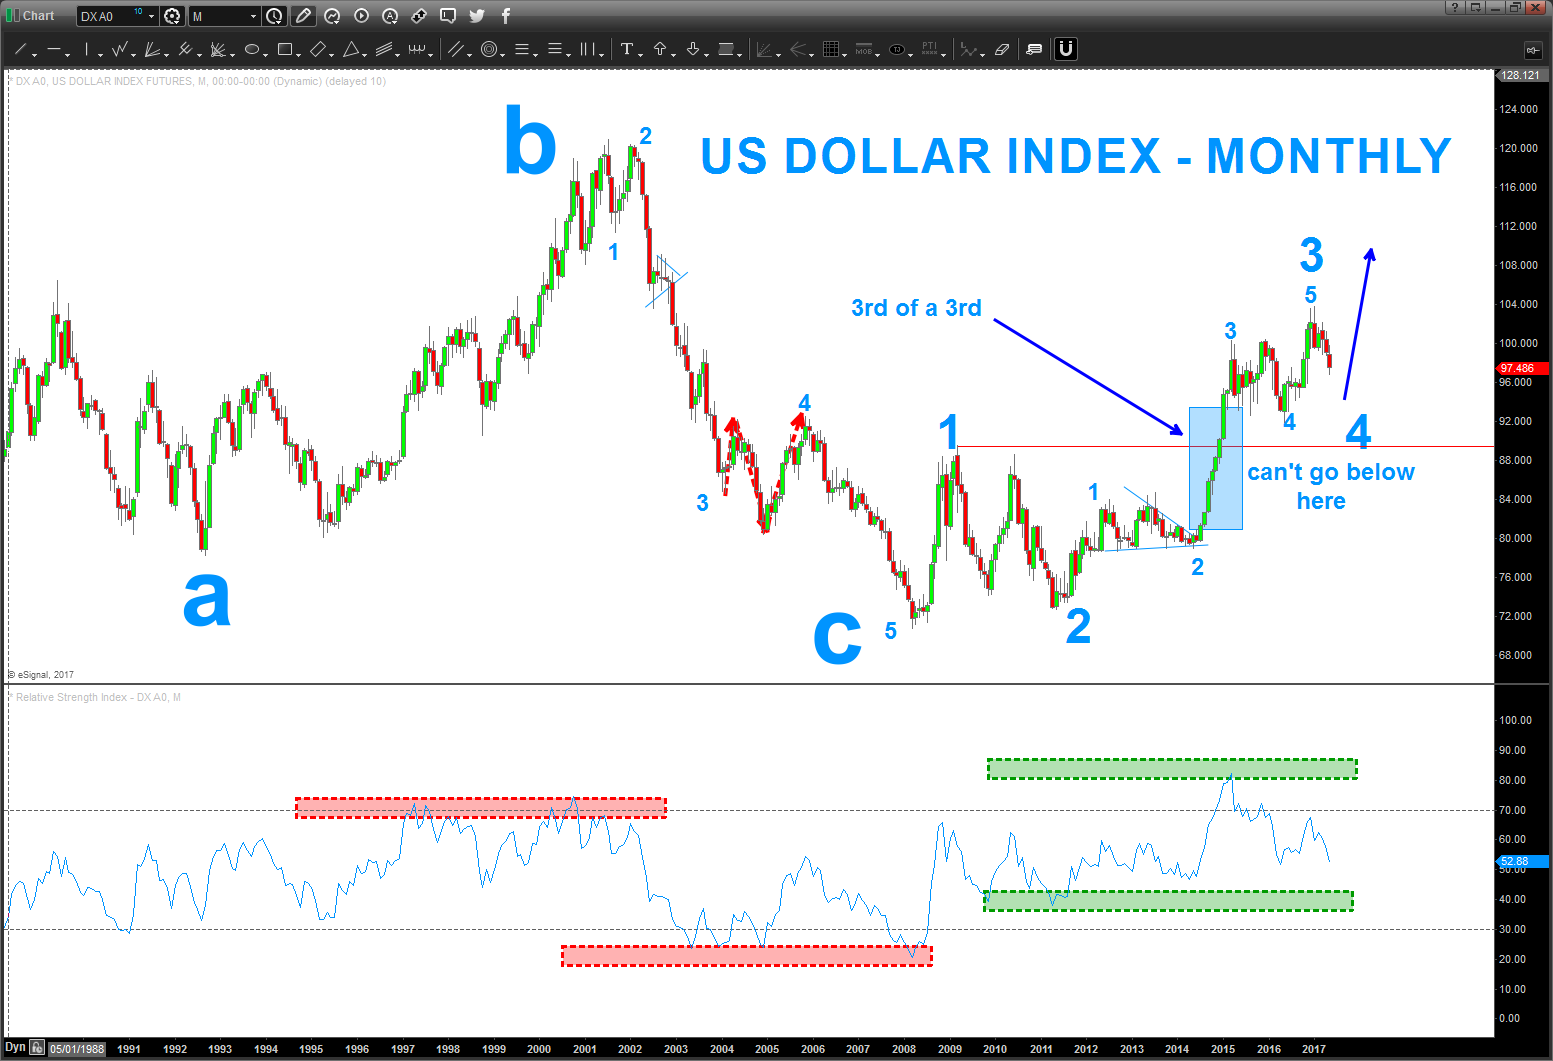
so, here’s where I really think we are:
- I want us to notice the 3rd of a 3rd action below. That certainly makes me think we just finished the 3 ….
- Note the ‘range’ transition that occurred w/ the RSI – if we are patient enough on a LONG TERM charts the RSI will ‘tell you’ when it moves from the bearish to bullish ranges or vice versa. in this case … believe we moved up into the bullish zone and the dollar will, in due time, continue to advance higher after this correction (is it ending?)
- Dollar Bulls are at 8%
so, in conclusion, I see patterns and sentiment that call for a dollar low/rally. as this rally progresses it will take on 5 waves or 3 waves and then a PATTERN to SELL DOLLARS will appear. IF it fails THEN the dollar rallies and IF it works then the dollar fails and we could be at the A-B-C TOP and the dollar is really really going to take it on the chin.
It’s all probability folks … that’s all it is. I HAVE NO IDEA which way it will go and really don’t care. Give it a shot and use a stop.
Bart
_____________________________________________________________________________________________
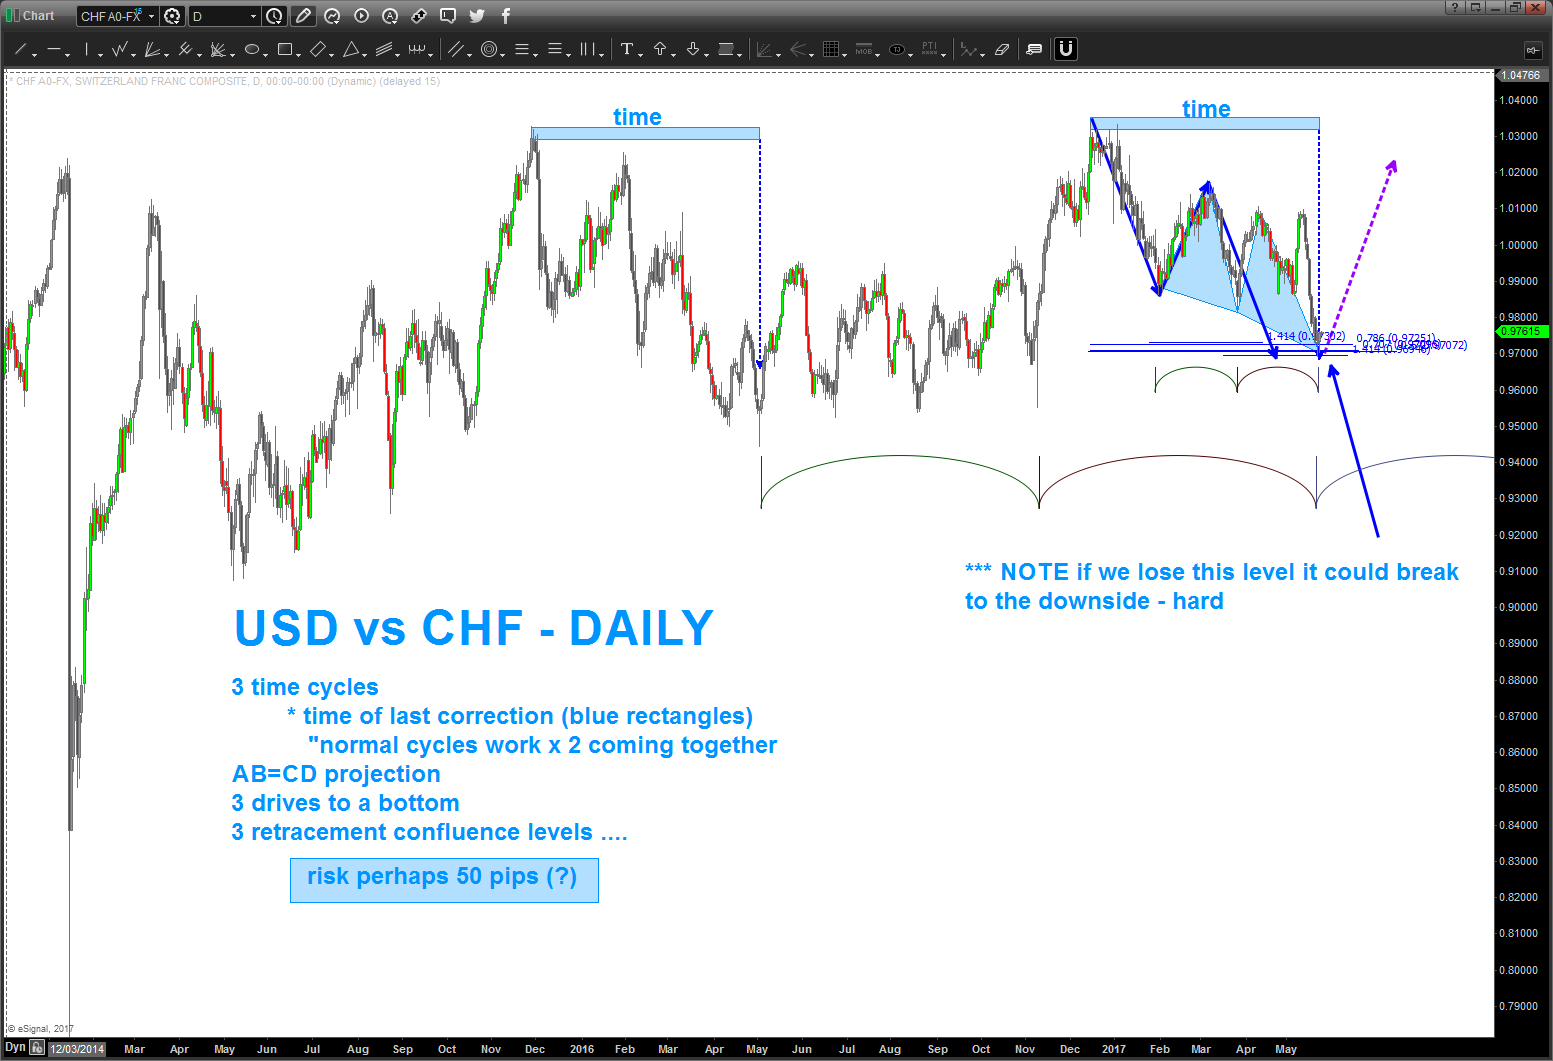
05/17/2017 – well here we go … as you will see we are sitting on the BOTTOM of the BUY RANGE PATTERN that we have been waiting for….some STRONG THRUST DOWN so that begs caution. BUT, note the TIME component of the 3 drives the symmetry is pretty awesome.
so – pause/wait and IF the dashed red trend line is taken out to the upside on a WEEKLY CLOSE (98.50) then perhaps the next big run has begun.
Bart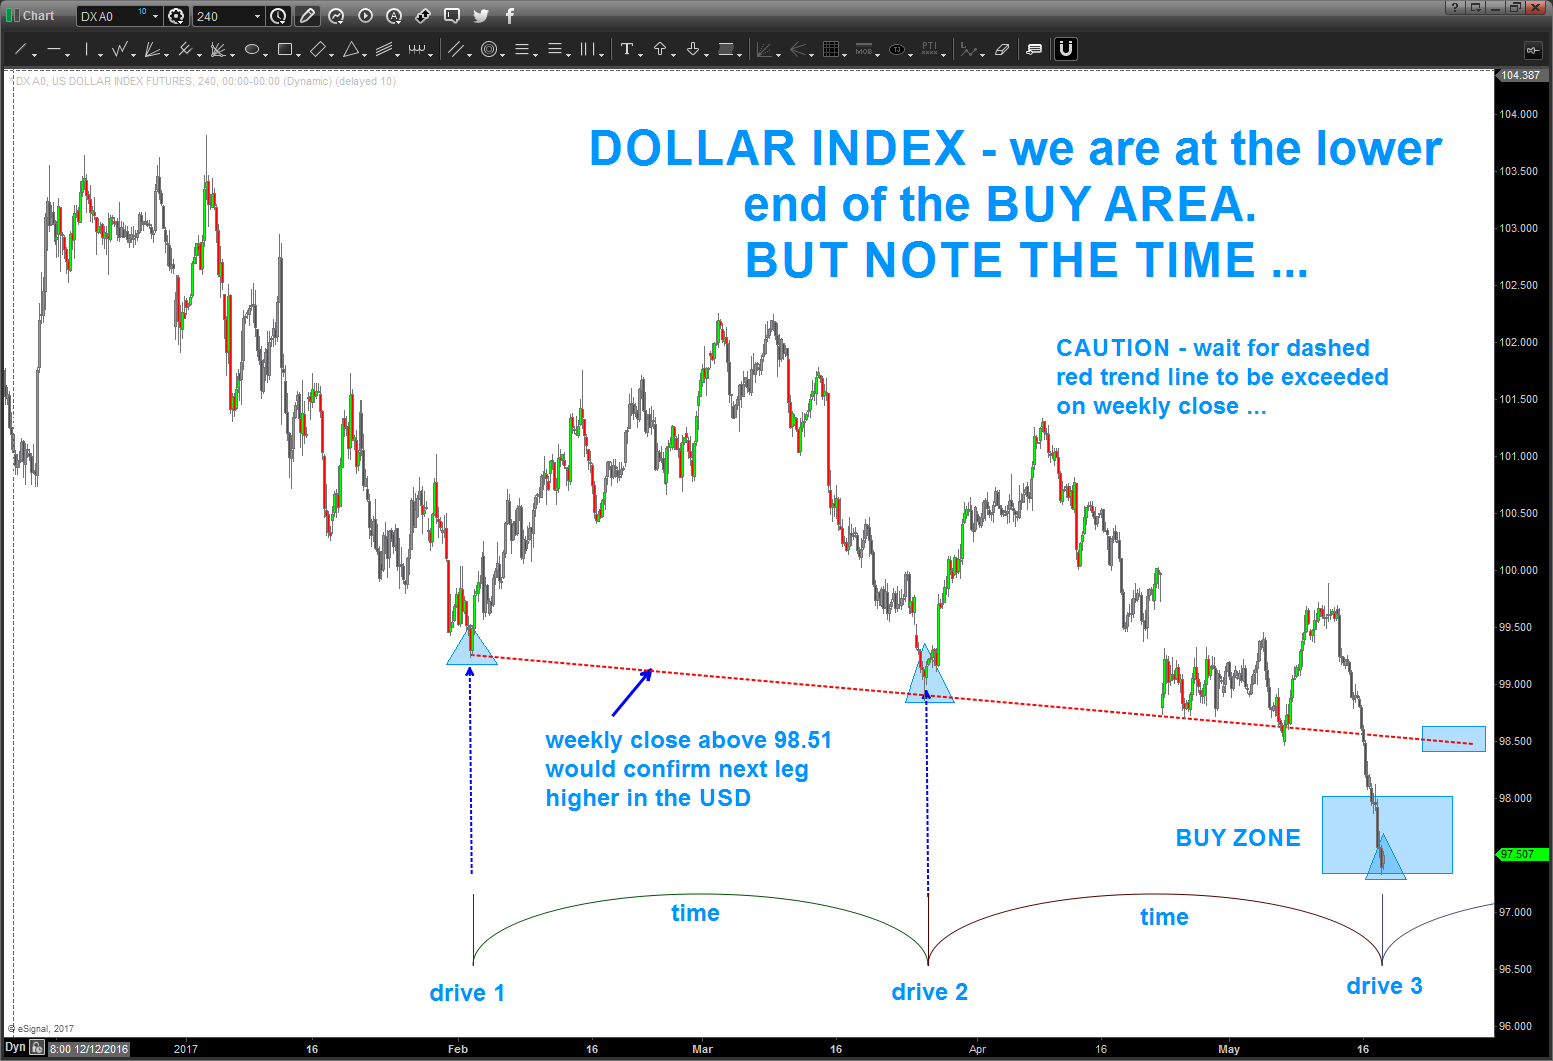
____________________________________________________________________________________________________
05/07/2017 – Happy “insert name here” day … have you noticed that Social Media is making a “insert name here” day for everything? So, for me, I say “Happy Dollar Index Update” day … as an FYI, that’s May 7, 2017.
Anyhoo – man this is getting interesting. I’ve updated both the 4 hour and the monthly since Plaza chart below.
Let’s pay attention to 3 things:
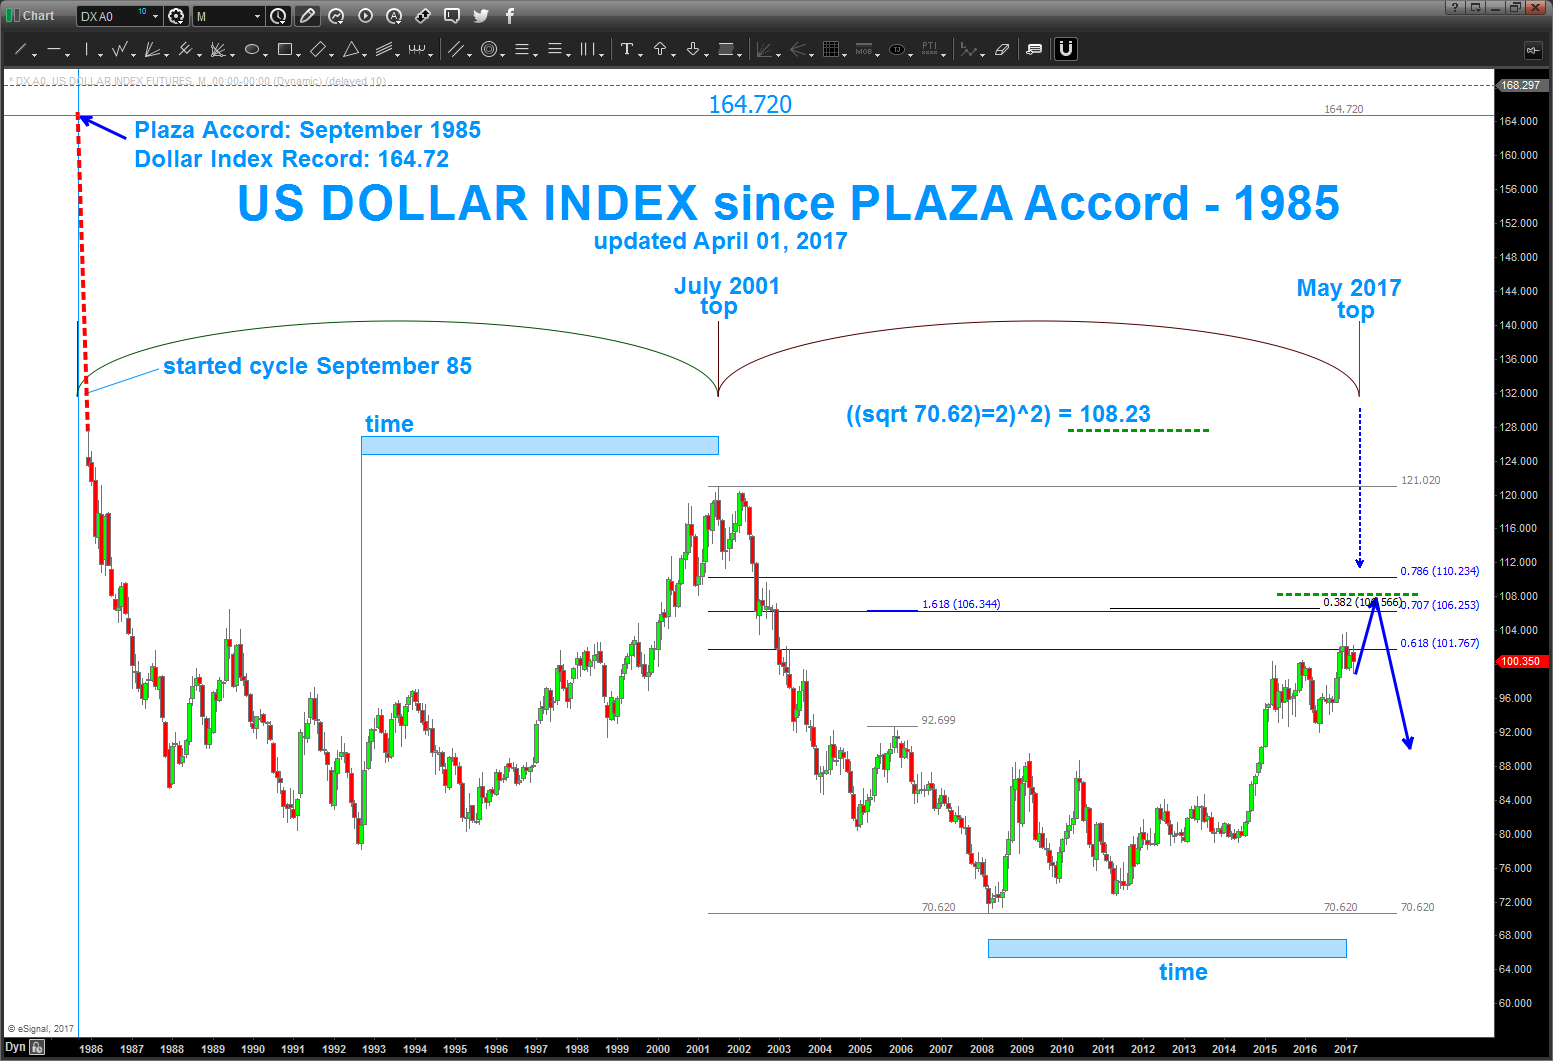
- the level shown back on April Fools Day is now even more important. As you can see below, we now have 2 projections into the same area, we have a 3 drives to a bottom forming and have added another ratio to this area. WOW ..kind of important.
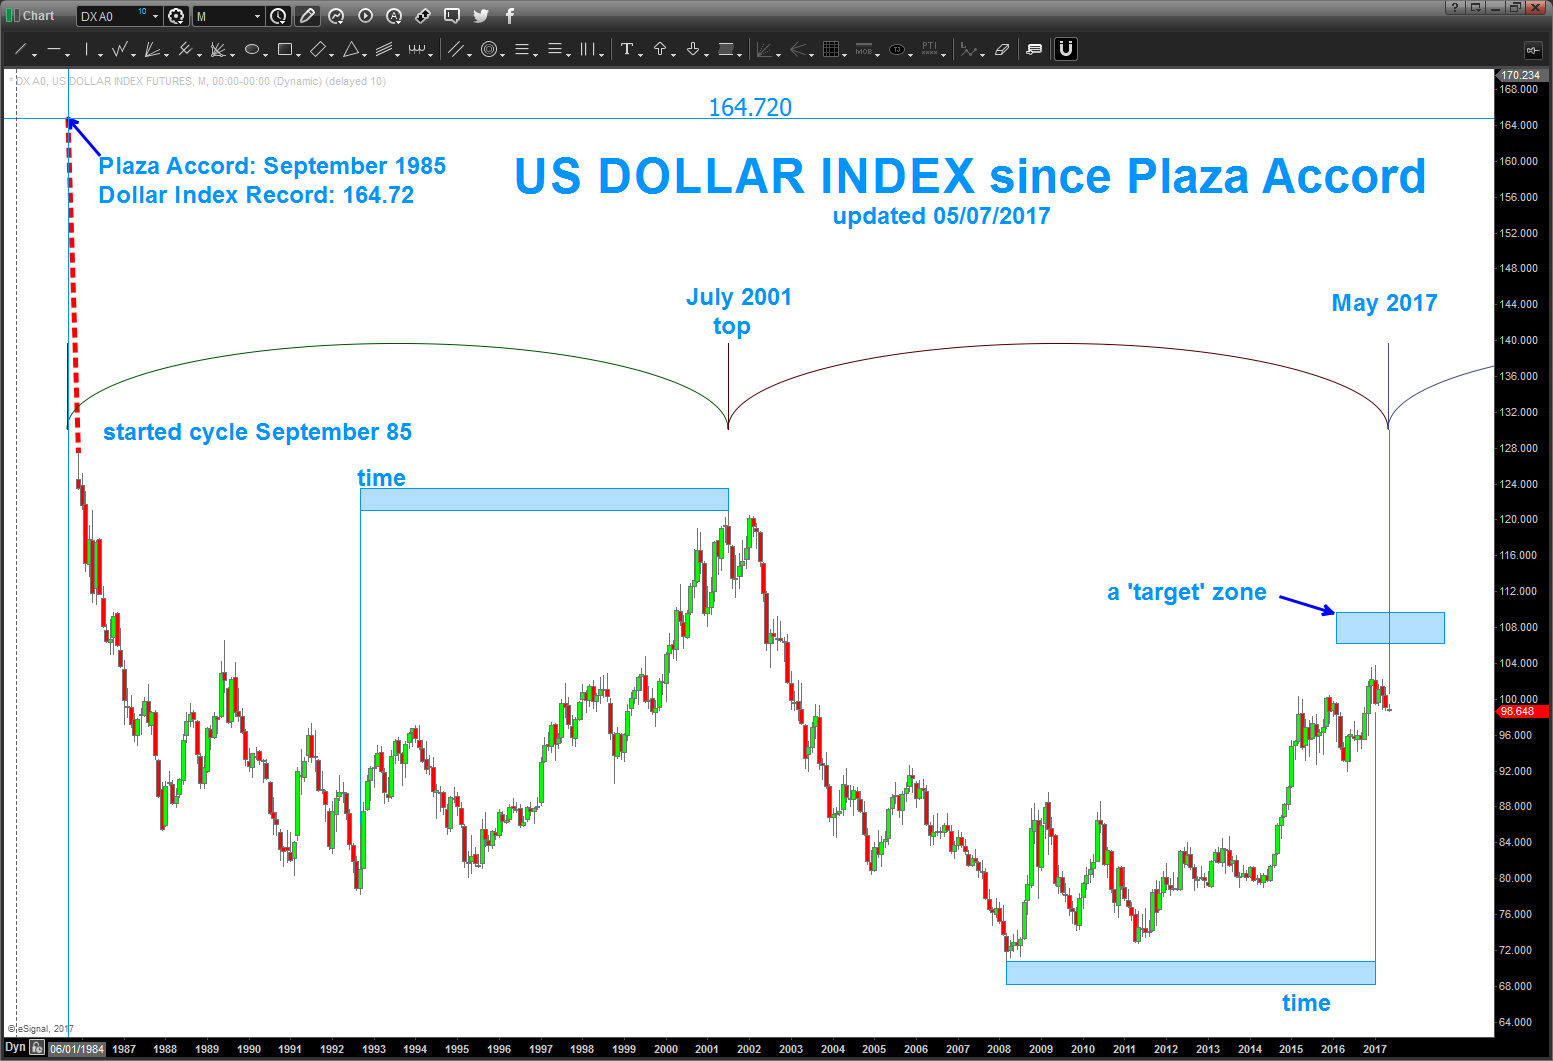
- on the monthly, notice the blue rectangle w/ time above/below it. That represents, in months, the EXACT time it took to rally after falling from 164 and it hit – exactly – from the rally low in 2008 to now. The key here is that it hit right at a very powerful PRICE relationship. it was an exact 1.618 price projection relationship. Very well could have finished A-B-C Elliott Wave correction – we simply don’t know yet … is this a 3 or a C. (that’s the big deal)
- also, on the monthly, note the cycle we started from 1985. It’s smacking right into May (now) and so …it DID NOT rally up into the ‘target zone’ ID’d and it’s finishing an important BUY pattern in the 98-99 area. IF THIS HOLDS and rallies us UP into the target zone we still have to consider this to be a BIG resistance area ALONG w/ time so …
W/ all of this going on AND w/ the French doing the elections right now believe this will resolve – SOON.
WATCH 98-99 level for the first chess move to occur … hope this helps.
_____________________________________________________________________________________
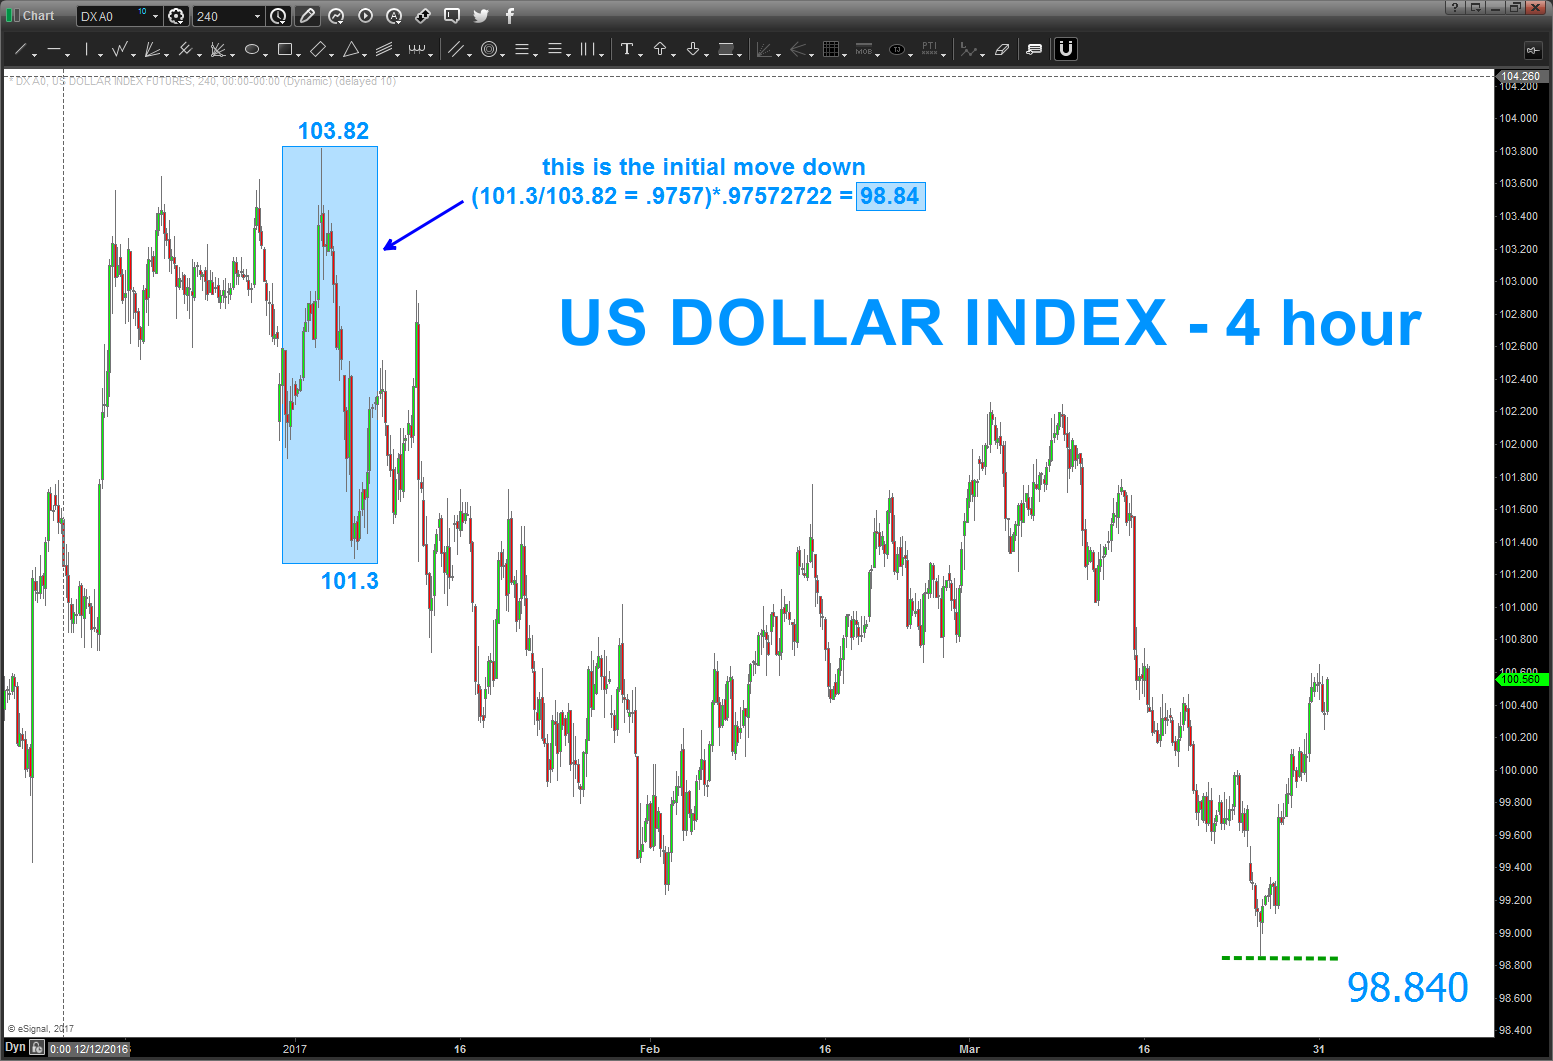
04/01/2017 – Happy April Fools Day!
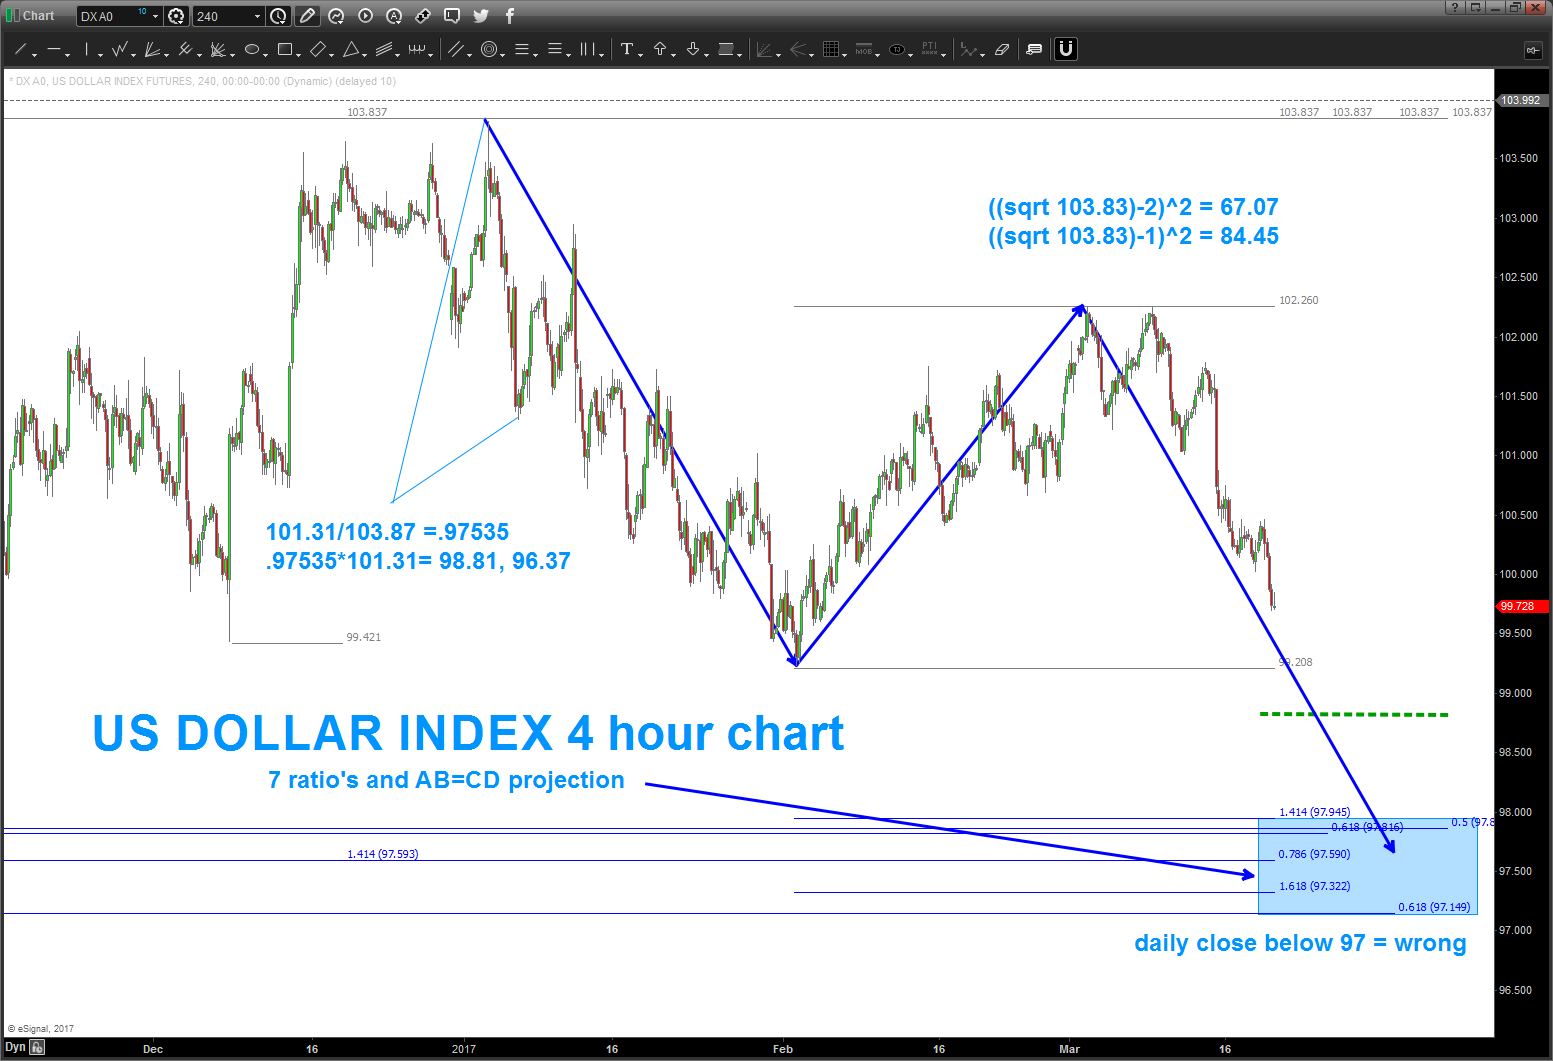
per below, the US Dollar Index smacked right into our target …but, the PATTERN certainly looks like one more wave ahead. Then, well, things are going to get really interesting! Next stop is more than likely 106-108 on the index.
it’s quite clear to see 5 waves completing up into that area …
also, was ‘hoping’ for a deeper correction as shown on the dollar index but the ‘fundamental frequency’ stopped it and, for now, probability says a low is in place for the USD and it should vault higher in the coming weeks.
one last, on the chart below, note the cycle tops from 1985, 2001 line up in May 2015.
Going to get really interesting.
________________________________________________________________________________
1/14/2017 – if your into harmonics and patterns, then read below. If you just want the bottom line up font (BLUF) then read this: WAIT to do anything on the US Dollar.

Obviously, I’m “called” or “attracted” to a movie like this because of the amazing synchronicity to ‘string theory’ and ‘time’ … so if I really want to go ‘deep’, so to speak, I will play a soundtrack like this w/ only this music in the background and a chart …
what’s most important .. ? where are we now ..,
- there is BEARISH RSI divergence on the monthly
- the TIME component (a big deal) is EXACTLY equal to the last major rally in the index since the Plaza Accord
- the most recent high is a 1.1618 projection and EXACTLY .786 the rally from 1995-2201 – EXACTLY
- we have RECORD NEGATIVE/BEARISH sentiment for the EURO (a major component of the index)
- see blog and note the cycles on the POUND and the AUSSIE and LOONIE
- note: the RSI ‘transition’ to higher support zones … that’s bullish
So, UNFORTUNATELY, my friend we need to WAIT and IF (the big IF ) every thing is to come together then we should see support come in around 92-95 to get long on the dollar.
Bart
PS – you read it here … I’m REALLY ‘believing’ (not supposed to do that) that the $$$ will find support in/around the areas sighted below. BUT .. if you try and SEE the picture that’s painted .. this COULD BE A MONSTROUS $$$ TOP. How will we know …. no flipping idea. You guys/gals tell me ….

12/30/2016 – updating the US Dollar Index post
- bearish divergence – check
- 1.618 price projection hit – is this an a-b-c correction and the dollar has peaked? Potentially … or is wave 3 of 5 concluding w/ a pull back imminent?
- SENTIMENT is extreme bearish for the EURO and GOLD
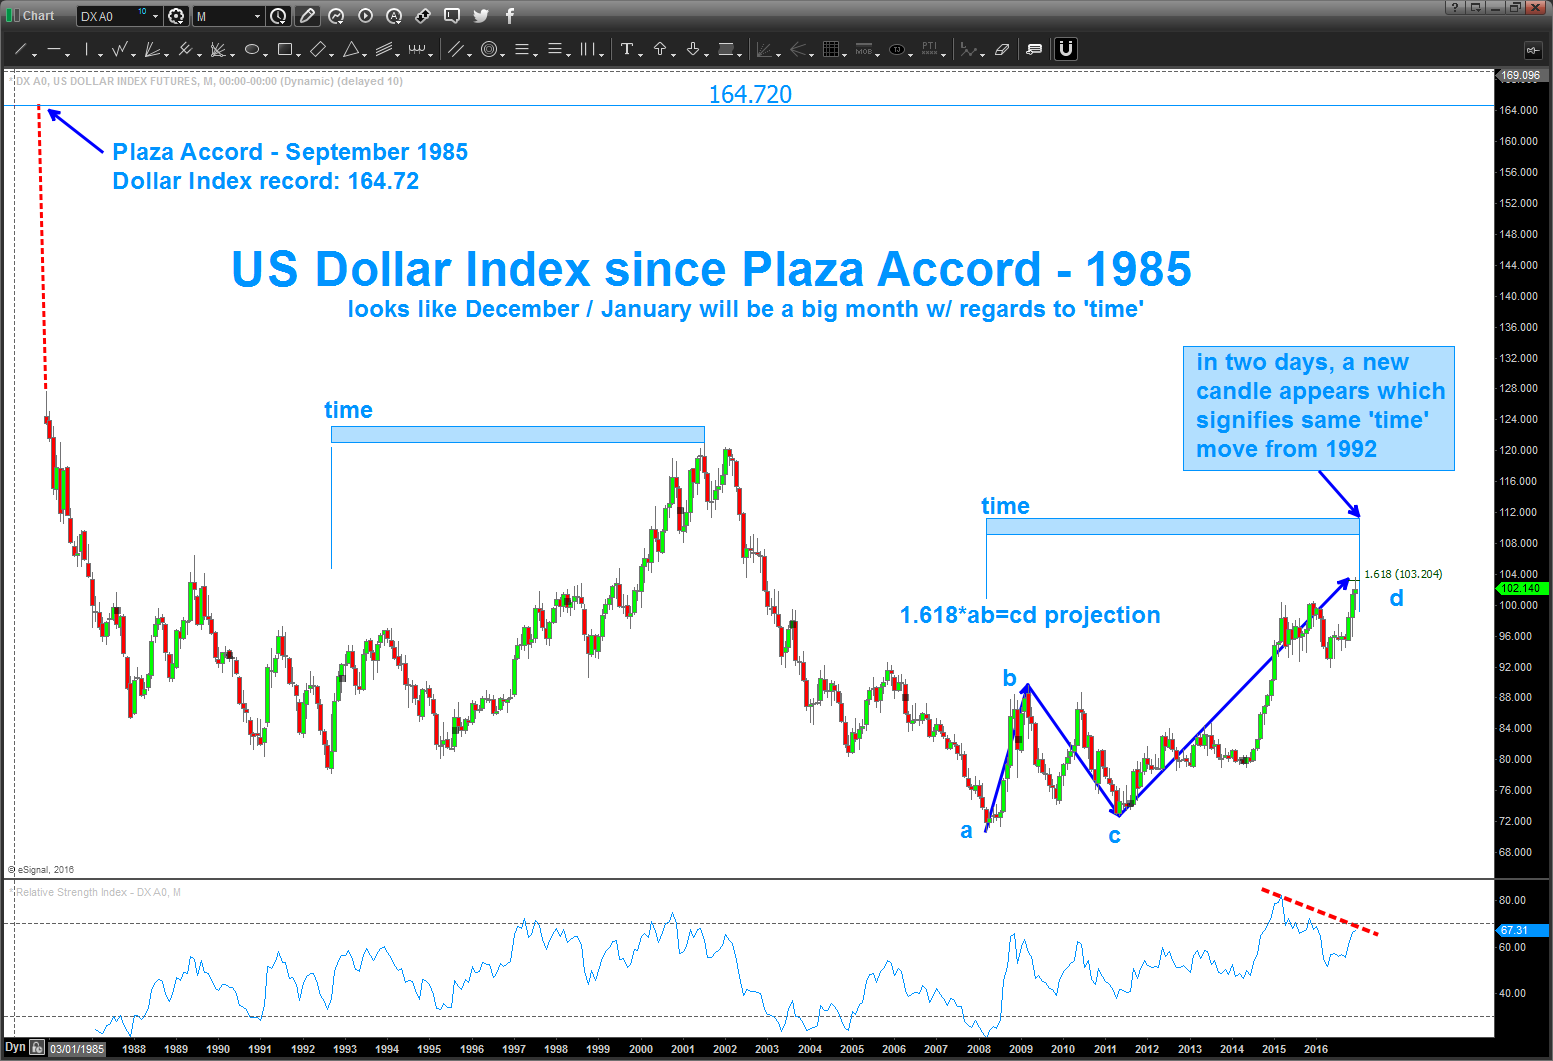
- note – we are hitting the same TIME correction in a couple days as the move up from 1992-2001
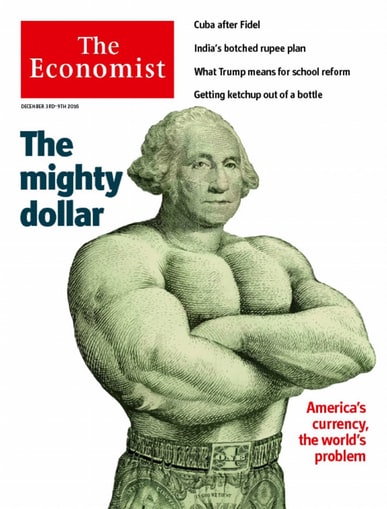
- Economist .. the best contrarian indicator out there.
CLIFF NOTES: if you read below you’ll see there are other targets higher. We are approaching the same TIME as the last move up in the dollar against the smash from the Plaza accord so the ‘no brainer’ long dollar trade is one that begs of caution. Is this THE top in the USD and now we go back below 70? Don’t know, but a preponderance of evidence suggests STIFF resistance from now into January for the USD.
11/19/2016 – if you want to follow the Dollar posts, just search dollar on the top right area of the blog. the overall thesis, which has proven to be correct so far, was the dollar was going to strengthen all the way from the low 70’s. it’s been a nice run …
is there higher to go … yes.
but then …
here’s the picture – note, I’ve used the high from the Plaza Accord in 1985 to put the .382 retracement on the chart. That also overlaps w/ some nice other extension and retracement ratios. Believe the highlighted area in/around 107-108 is going to be key.
also, note the TIME component between the last major rally from 1992-2001. Next month, or, depending on how you draw the time component, perhaps January the Dollar Index should run into some pretty stiff resistance in TIME.
last thing is the Elliott Wave count … I always tell people – I LOVE Elliott wave – when it works. here, the count has been pretty much a “Ray Charles count” on a long term basis. I’ll try to walk you thru the importance:
- market corrects in 3 waves labeled a-b-c
- the market moves impulsively in 5 waves
- wave 2 can’t overlap the beginning of wave 1
- wave 3 can’t be the shortest
- wave 4 can’t overlap the beginning of wave 1
- if you take the low in 2008 and start working your way up we see that we are ‘clearly’ creating 3 waves into yesterdays price action.
- here’s where it gets tricky .. simply, I don’t know if this an a-b-c big corrective move OR we are impulsively going higher in a 1-2-3-4-5 sequence.
- the key here – wave c (of a-b-c) always has to be 5 waves (unless in a triangle)
- so if you look you can see the ‘small’ 1,2,3,4,5 being carved out (Turkey reference) so the blue highlighted area 107-108 COULD be the end of a C wave and the entire A-B-C move OR the end of wave 3 and we correct 4 and then off we go again in 5.
I honestly have no idea ….
Here’s what the charts are SHOWING US:
- square root target
- the ‘time’ of the last corrective move
- the ‘count’ showing we are in the 5th wave of C and 3
- EXTREME sentiment for a strong dollar
- the .382 from the all time high
- divergence set up on Monthly RSI
- ‘other’ extension and retracement targets
Expect some major resistance .. again, we are 6 handles away from the target area and that represents HUGE moves in currency .. BUT remember, right now, we are at extreme (not historic) but extreme sentiment and this has never proven to be wrong from a contrarian indicator. This puppy could snap back on you really really quick.
only TIME will tell … let me know if you have any questions.
B
BITCOIN Investment Trust … why did it stop today?
Posted on May 25, 2017 Leave a Comment
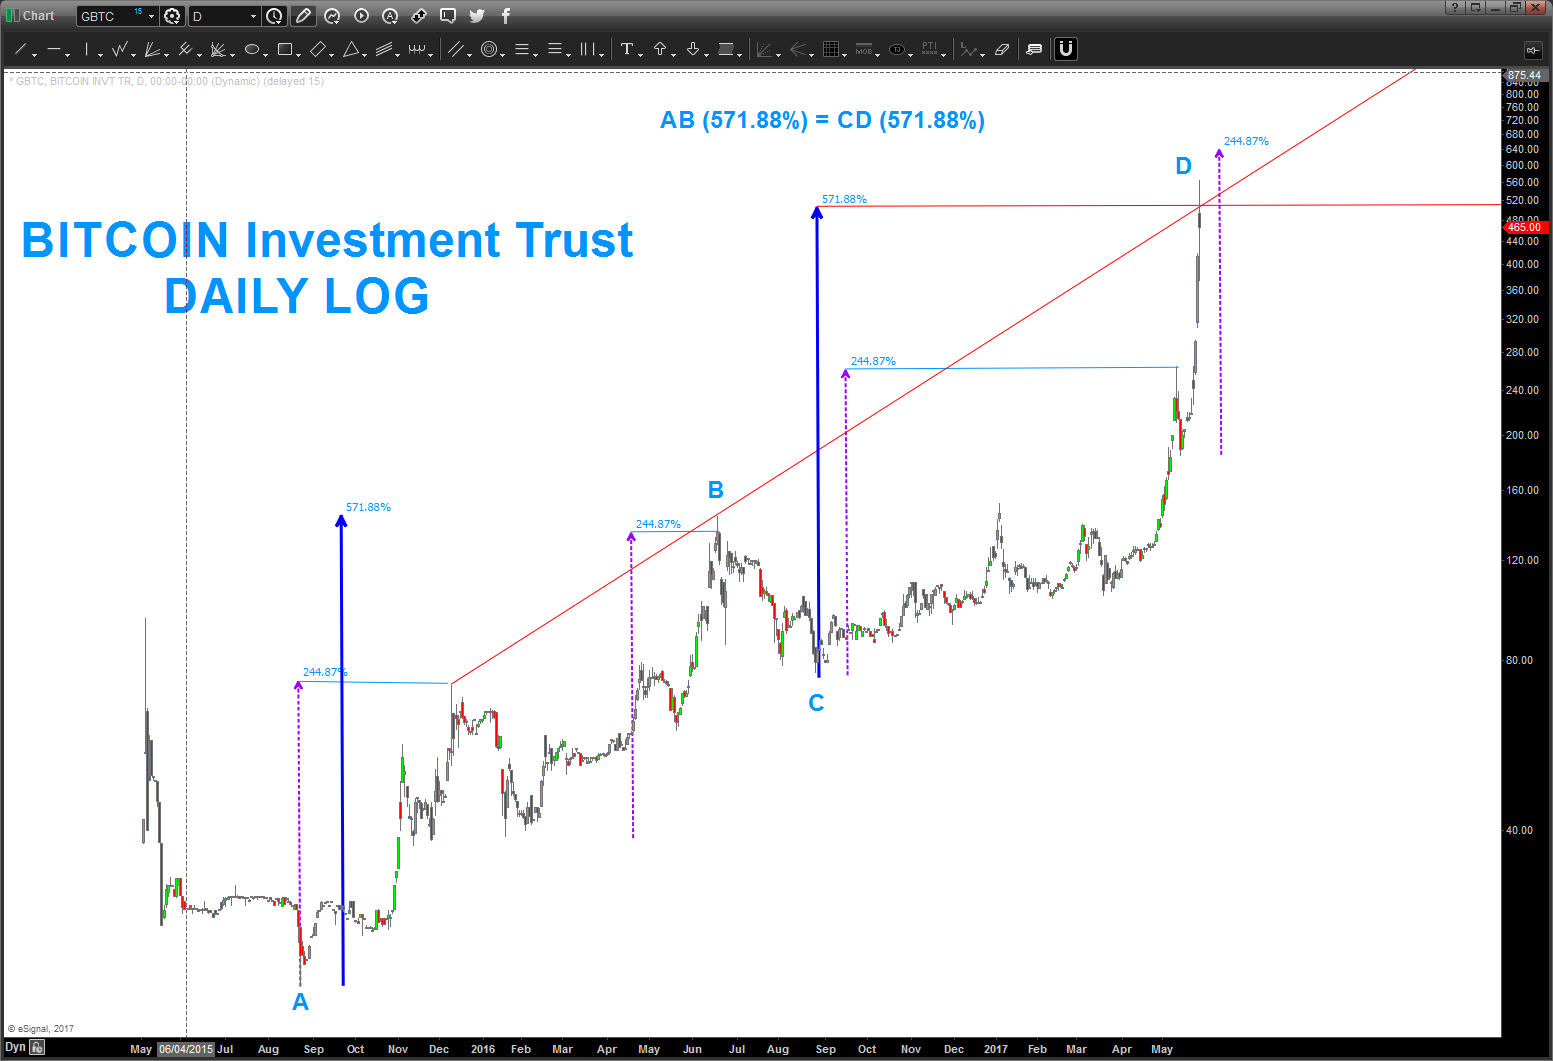
05/25/2017 – I hate to do the ‘could have and would have and should have’ when using charts. Those of you who have been following me know that. I wanted to get to this chart before the open to just give it a shot … was on travel and in the airport yesterday and I kept seeing the PARABOLIC ROCKET SHIP of BITCOIN …couldn’t wait to throw some geometry on the chart.
When we see parabolic moves – THINK LOGS. It’s why the darn things were created in the first place.
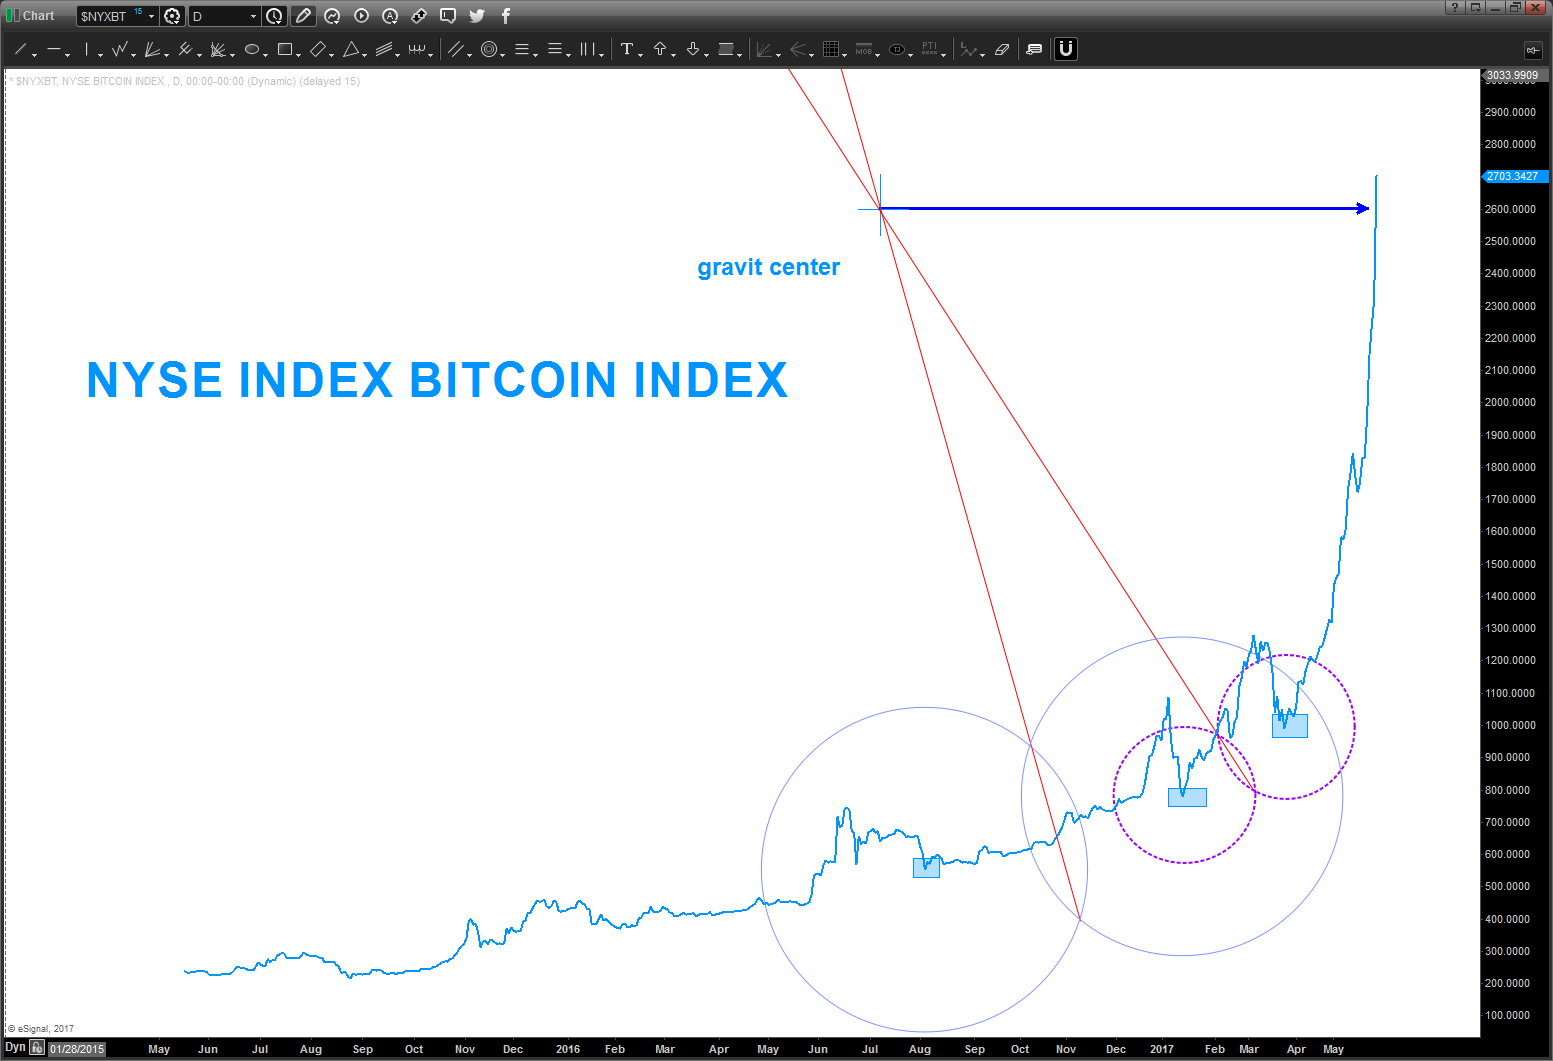
As you can see below .. we are stretched and could go higher but today it ran smack into a LOG AB=CD and a key LOG trend line .. resistance was to be expected. You can also see – and why not – that there is another set of targets higher. I’ve also included the NYSE Bitcoin index … it’s data isn’t updated yet but you can see that it also ran smack into the GRAVITY CENTER. (I used the technique taught to us in elementary school on how to make a circle using three points. (dead serious). Again, for you my loyal readers, I didn’t know if it would work. You get to the point where you can ‘see it’ …
For now … man, it’s great to get on the rocket ship and ride it but there was always a REASON we landed w/ 2000 lbs of gas. Always .. because if you ran out of gas, your screwed. When parabolic blast off end they don’t end w/ a whimper .. .they THUMP hard.
Caveat Emptor for the Bitcoin craze ….
Bart
Quick update – FED FUNDS INTEREST RATE FUTURES – FF
Posted on May 22, 2017 Leave a Comment
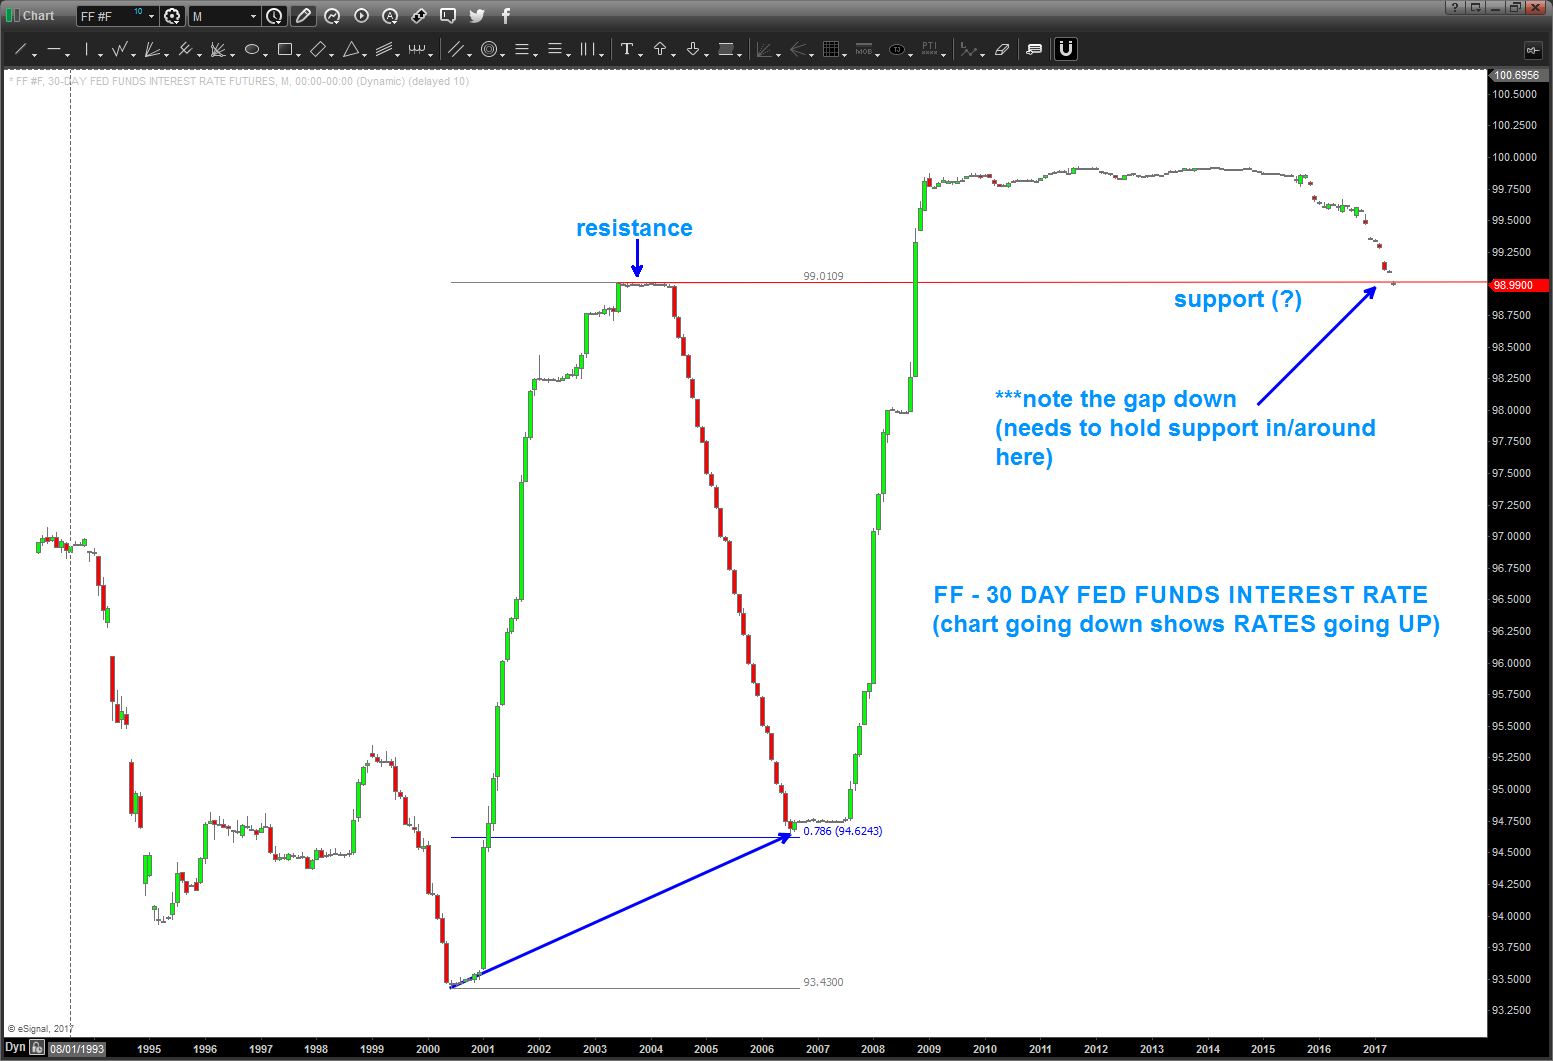
05/22/2017 – take note of the ‘potential’ for the polarity principle to take place. in this case, where there is resistance there ‘should be’ support.
***note: the gap down below the former resistance w/ this months action. something to watch … a gap down and move lower signifies higher interest rates. monitor closely.
have a good night.
B
Dollar Index since the Plaza Accord …room to run, BUT (?) …UPDATED and UPDATED and UPDATED and UPDATED again
Posted on May 17, 2017 Leave a Comment
05/17/2017 – well here we go … as you will see we are sitting on the BOTTOM of the BUY RANGE PATTERN that we have been waiting for….some STRONG THRUST DOWN so that begs caution. BUT, note the TIME component of the 3 drives the symmetry is pretty awesome.
so – pause/wait and IF the dashed red trend line is taken out to the upside on a WEEKLY CLOSE (98.50) then perhaps the next big run has begun.
Bart
____________________________________________________________________________________________________
05/07/2017 – Happy “insert name here” day … have you noticed that Social Media is making a “insert name here” day for everything? So, for me, I say “Happy Dollar Index Update” day … as an FYI, that’s May 7, 2017.
Anyhoo – man this is getting interesting. I’ve updated both the 4 hour and the monthly since Plaza chart below.
Let’s pay attention to 3 things:
- the level shown back on April Fools Day is now even more important. As you can see below, we now have 2 projections into the same area, we have a 3 drives to a bottom forming and have added another ratio to this area. WOW ..kind of important.
- on the monthly, notice the blue rectangle w/ time above/below it. That represents, in months, the EXACT time it took to rally after falling from 164 and it hit – exactly – from the rally low in 2008 to now. The key here is that it hit right at a very powerful PRICE relationship. it was an exact 1.618 price projection relationship. Very well could have finished A-B-C Elliott Wave correction – we simply don’t know yet … is this a 3 or a C. (that’s the big deal)
- also, on the monthly, note the cycle we started from 1985. It’s smacking right into May (now) and so …it DID NOT rally up into the ‘target zone’ ID’d and it’s finishing an important BUY pattern in the 98-99 area. IF THIS HOLDS and rallies us UP into the target zone we still have to consider this to be a BIG resistance area ALONG w/ time so …
W/ all of this going on AND w/ the French doing the elections right now believe this will resolve – SOON.
WATCH 98-99 level for the first chess move to occur … hope this helps.
_____________________________________________________________________________________
04/01/2017 – Happy April Fools Day!
per below, the US Dollar Index smacked right into our target …but, the PATTERN certainly looks like one more wave ahead. Then, well, things are going to get really interesting! Next stop is more than likely 106-108 on the index.
it’s quite clear to see 5 waves completing up into that area …
also, was ‘hoping’ for a deeper correction as shown on the dollar index but the ‘fundamental frequency’ stopped it and, for now, probability says a low is in place for the USD and it should vault higher in the coming weeks.
one last, on the chart below, note the cycle tops from 1985, 2001 line up in May 2015.
Going to get really interesting.
________________________________________________________________________________
1/14/2017 – if your into harmonics and patterns, then read below. If you just want the bottom line up font (BLUF) then read this: WAIT to do anything on the US Dollar.
Obviously, I’m “called” or “attracted” to a movie like this because of the amazing synchronicity to ‘string theory’ and ‘time’ … so if I really want to go ‘deep’, so to speak, I will play a soundtrack like this w/ only this music in the background and a chart …
what’s most important .. ? where are we now ..,
- there is BEARISH RSI divergence on the monthly
- the TIME component (a big deal) is EXACTLY equal to the last major rally in the index since the Plaza Accord
- the most recent high is a 1.1618 projection and EXACTLY .786 the rally from 1995-2201 – EXACTLY
- we have RECORD NEGATIVE/BEARISH sentiment for the EURO (a major component of the index)
- see blog and note the cycles on the POUND and the AUSSIE and LOONIE
- note: the RSI ‘transition’ to higher support zones … that’s bullish
So, UNFORTUNATELY, my friend we need to WAIT and IF (the big IF ) every thing is to come together then we should see support come in around 92-95 to get long on the dollar.
Bart
PS – you read it here … I’m REALLY ‘believing’ (not supposed to do that) that the $$$ will find support in/around the areas sighted below. BUT .. if you try and SEE the picture that’s painted .. this COULD BE A MONSTROUS $$$ TOP. How will we know …. no flipping idea. You guys/gals tell me ….
12/30/2016 – updating the US Dollar Index post
- bearish divergence – check
- 1.618 price projection hit – is this an a-b-c correction and the dollar has peaked? Potentially … or is wave 3 of 5 concluding w/ a pull back imminent?
- SENTIMENT is extreme bearish for the EURO and GOLD
- note – we are hitting the same TIME correction in a couple days as the move up from 1992-2001
- Economist .. the best contrarian indicator out there.
CLIFF NOTES: if you read below you’ll see there are other targets higher. We are approaching the same TIME as the last move up in the dollar against the smash from the Plaza accord so the ‘no brainer’ long dollar trade is one that begs of caution. Is this THE top in the USD and now we go back below 70? Don’t know, but a preponderance of evidence suggests STIFF resistance from now into January for the USD.
11/19/2016 – if you want to follow the Dollar posts, just search dollar on the top right area of the blog. the overall thesis, which has proven to be correct so far, was the dollar was going to strengthen all the way from the low 70’s. it’s been a nice run …
is there higher to go … yes.
but then …
here’s the picture – note, I’ve used the high from the Plaza Accord in 1985 to put the .382 retracement on the chart. That also overlaps w/ some nice other extension and retracement ratios. Believe the highlighted area in/around 107-108 is going to be key.
also, note the TIME component between the last major rally from 1992-2001. Next month, or, depending on how you draw the time component, perhaps January the Dollar Index should run into some pretty stiff resistance in TIME.
last thing is the Elliott Wave count … I always tell people – I LOVE Elliott wave – when it works. here, the count has been pretty much a “Ray Charles count” on a long term basis. I’ll try to walk you thru the importance:
- market corrects in 3 waves labeled a-b-c
- the market moves impulsively in 5 waves
- wave 2 can’t overlap the beginning of wave 1
- wave 3 can’t be the shortest
- wave 4 can’t overlap the beginning of wave 1
- if you take the low in 2008 and start working your way up we see that we are ‘clearly’ creating 3 waves into yesterdays price action.
- here’s where it gets tricky .. simply, I don’t know if this an a-b-c big corrective move OR we are impulsively going higher in a 1-2-3-4-5 sequence.
- the key here – wave c (of a-b-c) always has to be 5 waves (unless in a triangle)
- so if you look you can see the ‘small’ 1,2,3,4,5 being carved out (Turkey reference) so the blue highlighted area 107-108 COULD be the end of a C wave and the entire A-B-C move OR the end of wave 3 and we correct 4 and then off we go again in 5.
I honestly have no idea ….
Here’s what the charts are SHOWING US:
- square root target
- the ‘time’ of the last corrective move
- the ‘count’ showing we are in the 5th wave of C and 3
- EXTREME sentiment for a strong dollar
- the .382 from the all time high
- divergence set up on Monthly RSI
- ‘other’ extension and retracement targets
Expect some major resistance .. again, we are 6 handles away from the target area and that represents HUGE moves in currency .. BUT remember, right now, we are at extreme (not historic) but extreme sentiment and this has never proven to be wrong from a contrarian indicator. This puppy could snap back on you really really quick.
only TIME will tell … let me know if you have any questions.
B
bottoms and tops of circles …S&P 500 an update
Posted on May 17, 2017 Leave a Comment
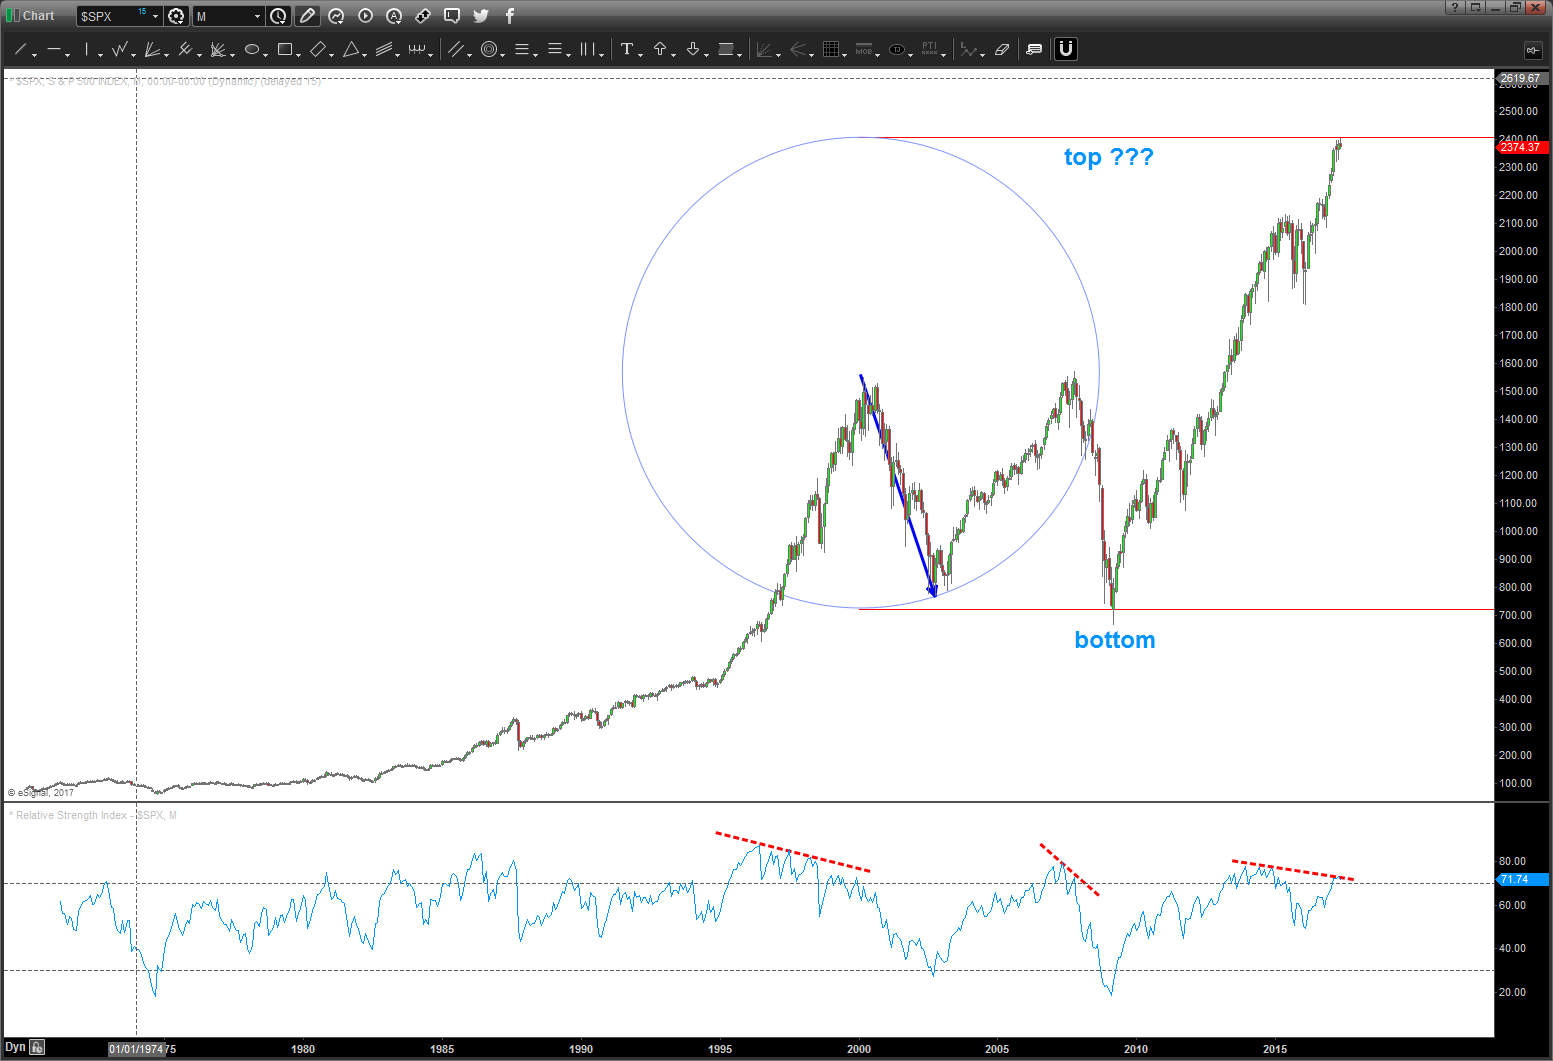
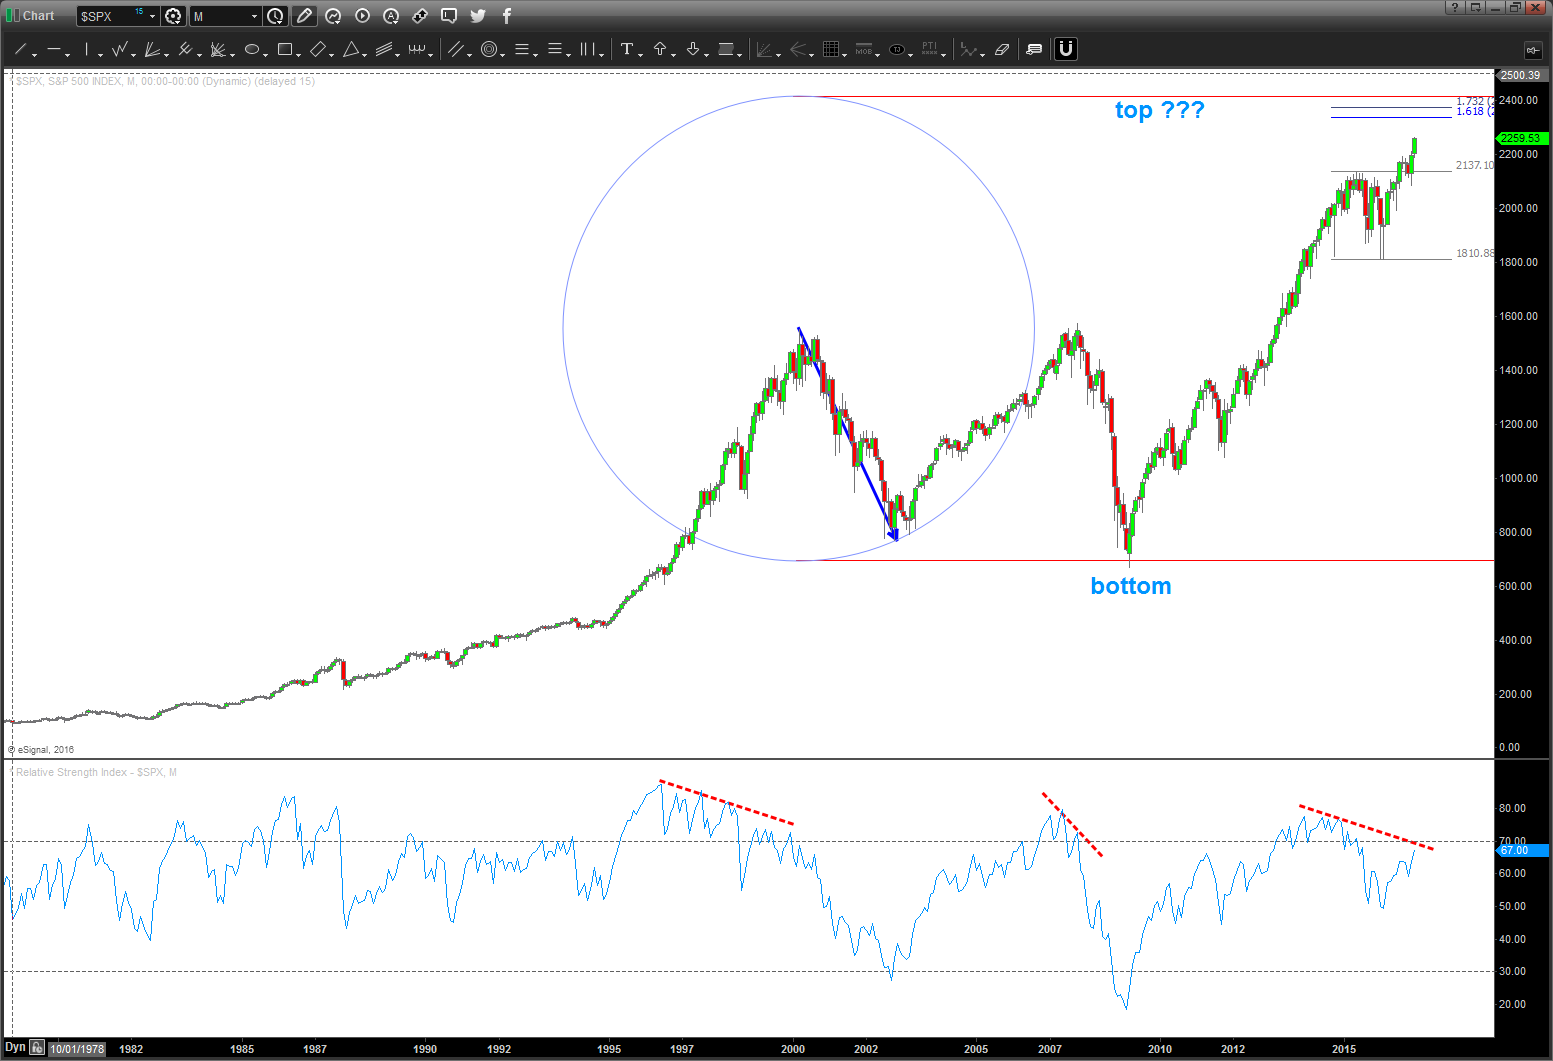
05/17/2016 – the noise in the market right now is crazy – bull this, bear that, Trump this, Fed that and on and on …today’s sell off hit the top of a circle. see how easy that makes it …? the below was posted 5 months ago looking at this area for a resistance zone. there is a reason but perhaps it’s as simple as it was the top of a circle? Probably not, but that’s what I think …
__________________________________________________________________________________________________
sometimes you eat the bar and sometimes the bar eats you …
Posted on May 16, 2017 Leave a Comment
Well … sheesh. let’s see …
- MCD – KABOOM did that pattern fail or what?
- GOOGL – OUCH, did that pattern fail or what?
- PCLN – smack down baby, did that pattern fail or what?
- NFLX – trend line held baby and KABOOM 2, did that pattern fail or what?
- XHB – hanging in there .. not showing that much strength but it certainly hasn’t crumbled
- AMZN – see above … holy smokes
- XIV – inverse VIX, it’s a flipping Saturn 5 (that’s a rocket ship) higher
- MSFT – where are you … ? Looking for that 72-73 zone
- TREE – bonk, ouch the apple fell from the tree and KABOOM higher
- LOW – gap up and bam ..higher
so, if your a follower of mine you can go back and put these symbols into the ‘search’ cue and you’ll see that these patterns fail. And that’s the point … guess what they fail.
the key here is these are runaway trains of buying … holy smokes, look at some of the monthly candles.
for me, for all these patterns to fail so gracefully well, that scares me … euphoria and chaos have hit. who knows how long this will continue but it will end badly.
enjoy the ride while you can … but use a ‘monthly’ signal reversal or weekly signal reversal to book profits or get conservative … sheesh, these are runaway trains.
Again, as the Cowboy says on the Big Labowski – “sometimes you eat the bar and sometimes the bar eats you.” I get it … thanks Cowboy.
Bart
PS – also, I do enjoy you my followers so if you look, there is some nice patterns that worked.
EEM and HYG
Posted on May 15, 2017 Leave a Comment
So, guess, of late, all the rage is the EEM new bull market.
VERY HARD to believe but … let’s remove the subjectivity and pull out some patterns:
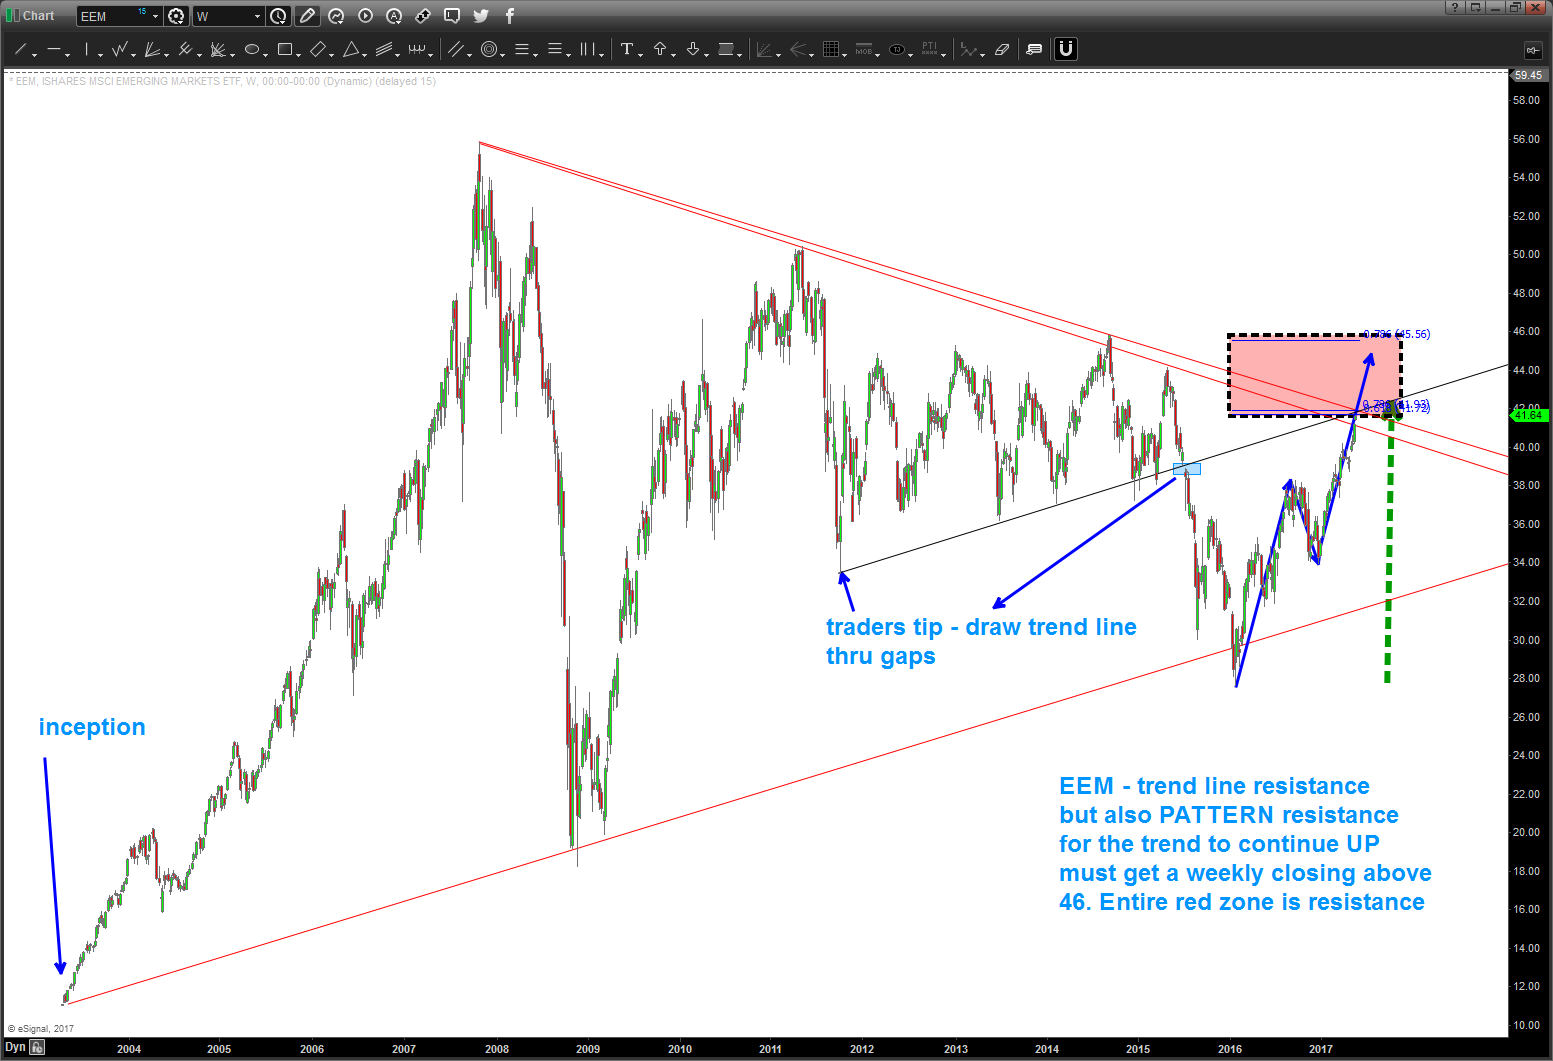
EEM:
- banging right into .618/.786 retracement confluence – usually very strong R or S. in this case R.
- Note – a basic projection takes us up into the 45-46 area
- Double trend line resistance
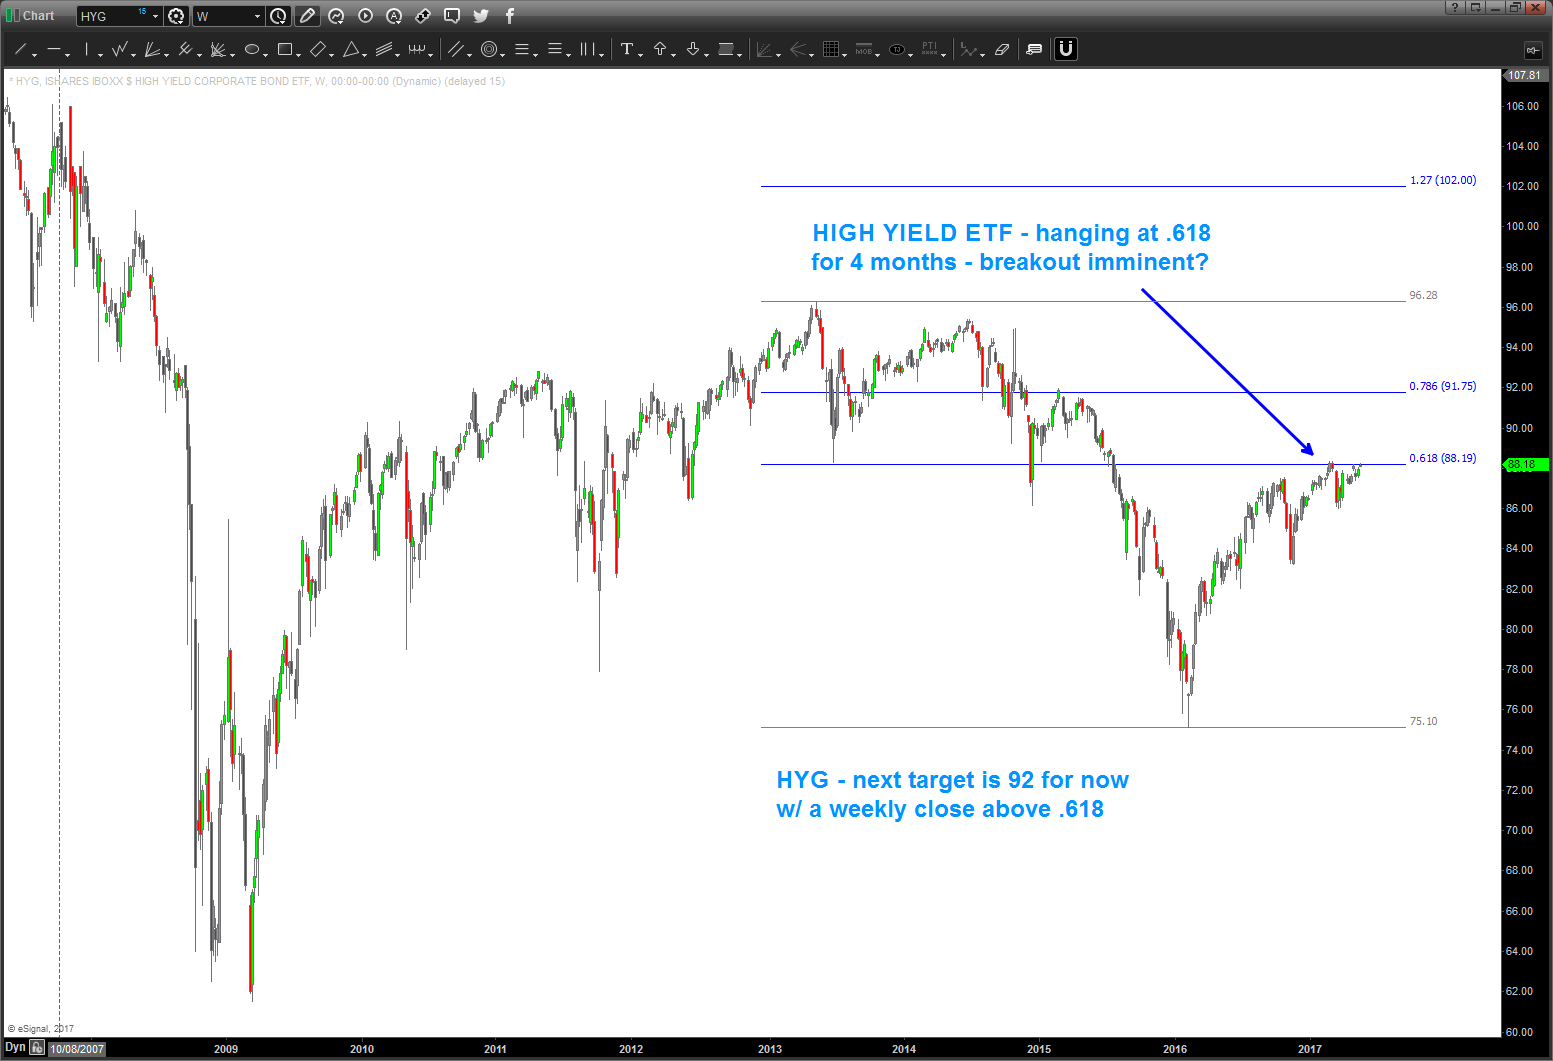
HYG – high yield debt
- note, it’s been hanging at the .618 for basically 4 months … sure looks like it wants to break out higher.
IF HYG breaks the .618 expect the EEM to target the upper zone of the red box …
IF HYG does not break above the .618 and starts back down THEN perhaps the EEM will start down from current levels.
either way, believe we can goose a little more in the EEM world and the HYG world but .. stiff resistance ahead.
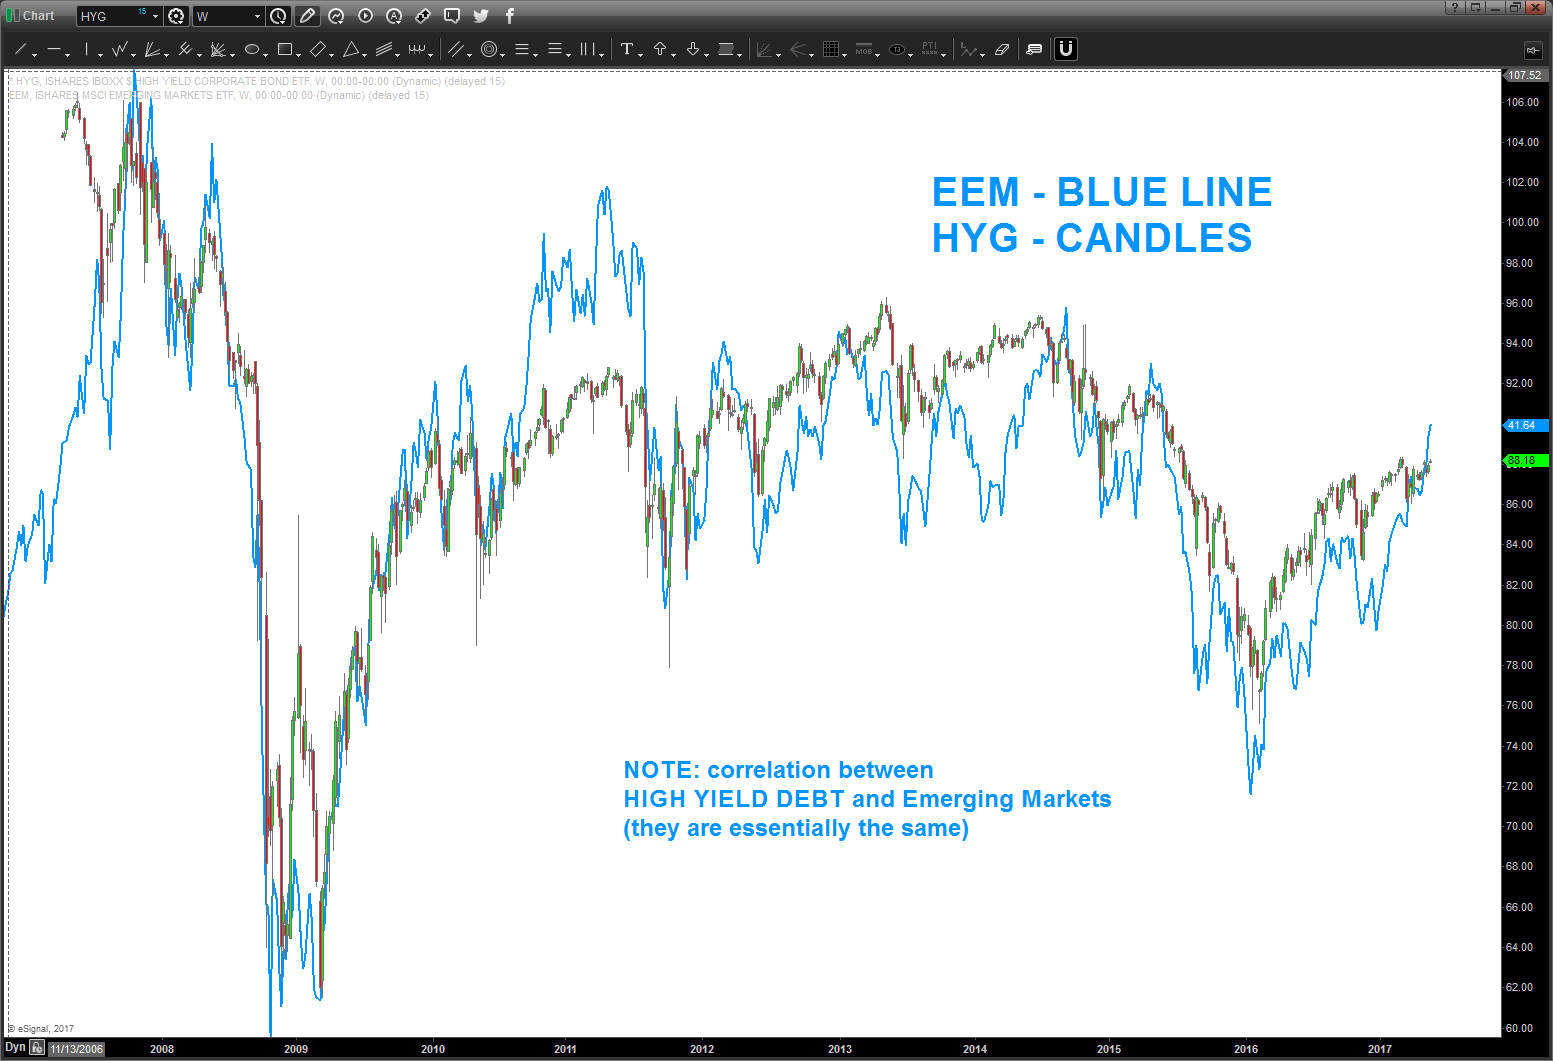
Also, note how correlated HYG (high yield DEBT) is w/ the EMERGING MARKETS (EEM) … hmmmmmmmm
Bart