BITCOIN Investment Trust … why did it stop today?
05/25/2017 – I hate to do the ‘could have and would have and should have’ when using charts. Those of you who have been following me know that. I wanted to get to this chart before the open to just give it a shot … was on travel and in the airport yesterday and I kept seeing the PARABOLIC ROCKET SHIP of BITCOIN …couldn’t wait to throw some geometry on the chart.
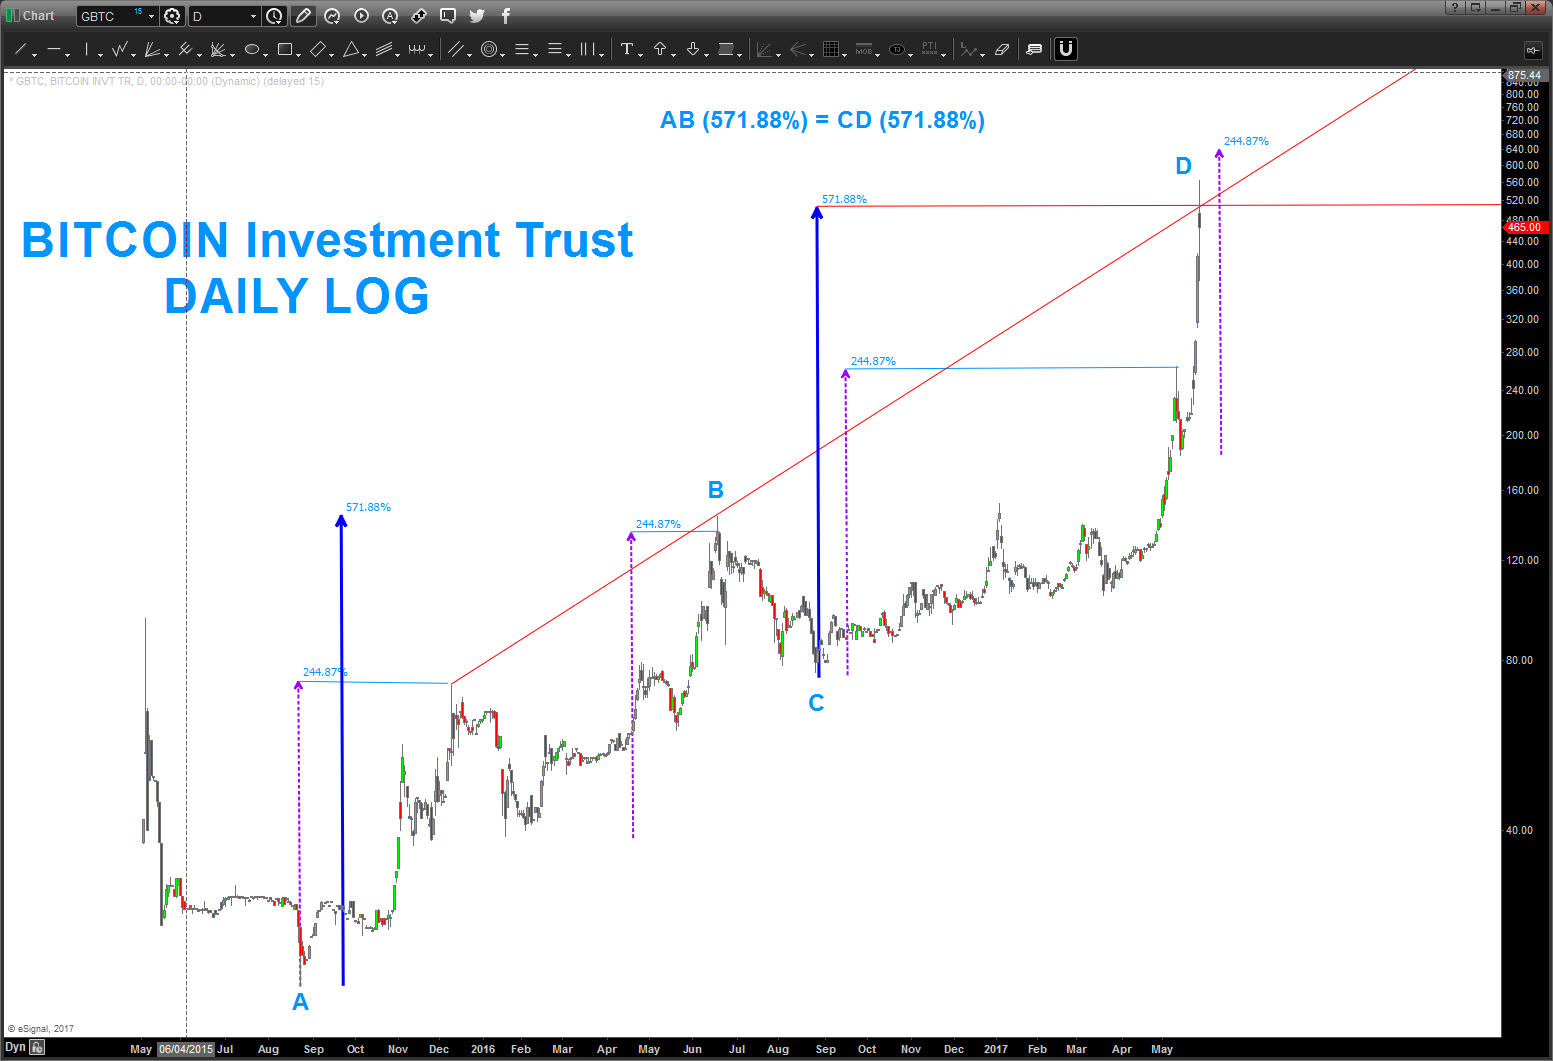
When we see parabolic moves – THINK LOGS. It’s why the darn things were created in the first place.
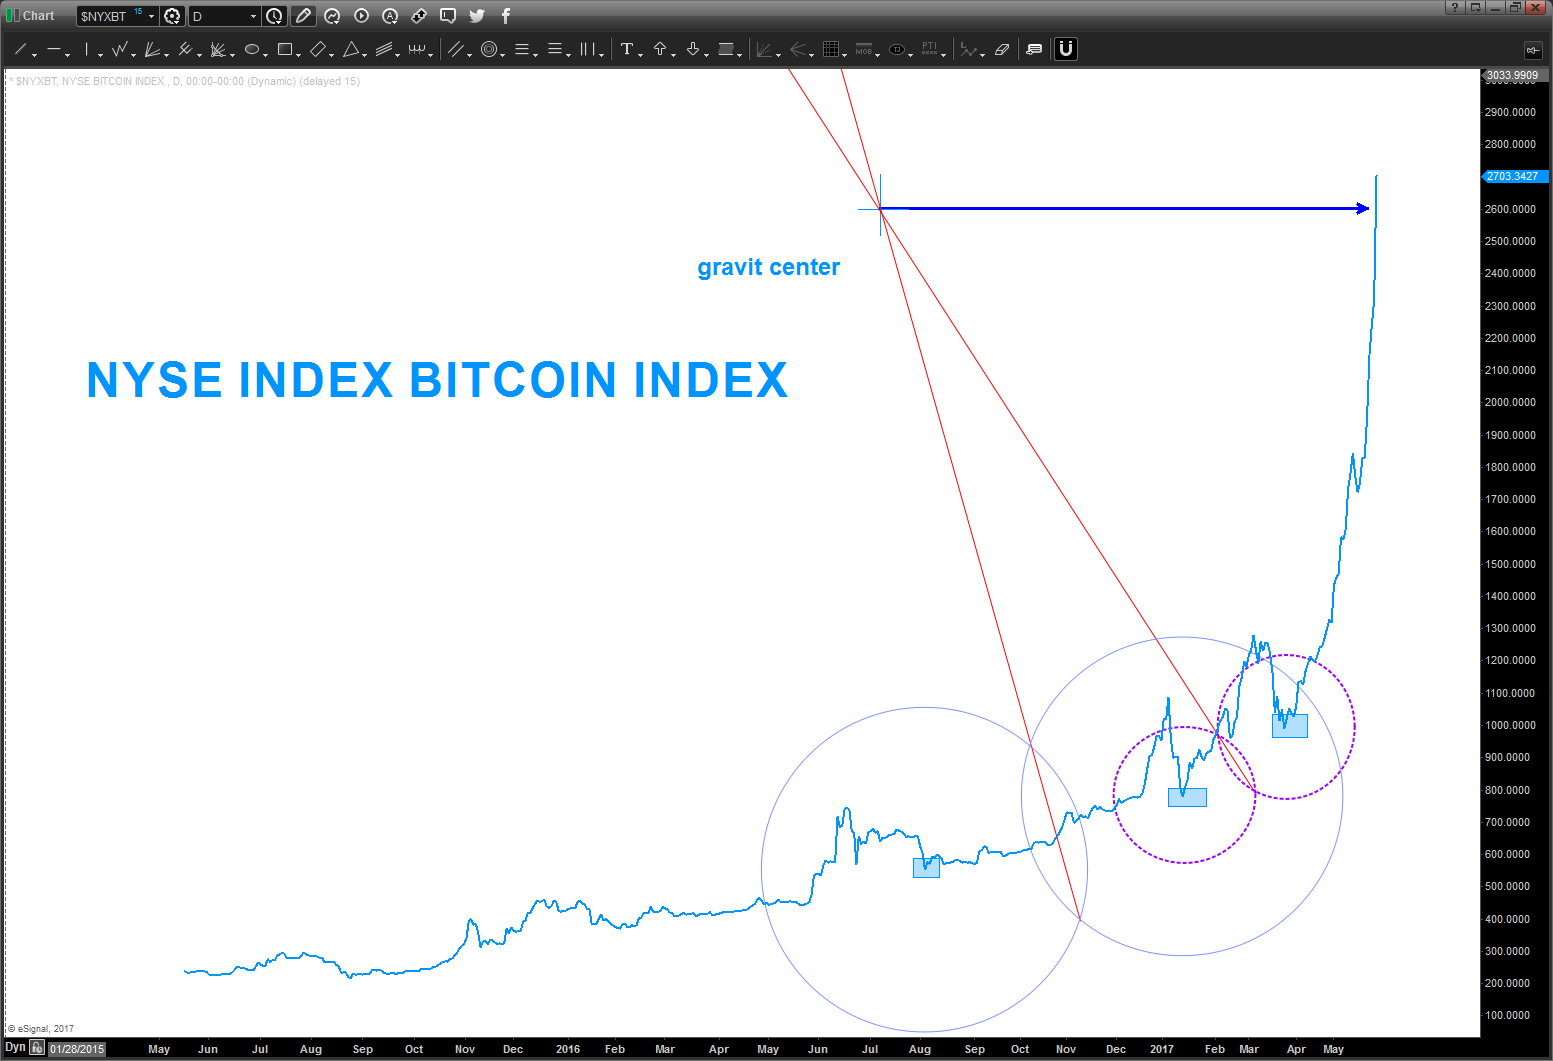
As you can see below .. we are stretched and could go higher but today it ran smack into a LOG AB=CD and a key LOG trend line .. resistance was to be expected. You can also see – and why not – that there is another set of targets higher. I’ve also included the NYSE Bitcoin index … it’s data isn’t updated yet but you can see that it also ran smack into the GRAVITY CENTER. (I used the technique taught to us in elementary school on how to make a circle using three points. (dead serious). Again, for you my loyal readers, I didn’t know if it would work. You get to the point where you can ‘see it’ …
For now … man, it’s great to get on the rocket ship and ride it but there was always a REASON we landed w/ 2000 lbs of gas. Always .. because if you ran out of gas, your screwed. When parabolic blast off end they don’t end w/ a whimper .. .they THUMP hard.
Caveat Emptor for the Bitcoin craze ….
Bart