Dollar Index since the Plaza Accord …room to run, BUT (?) …UPDATED and UPDATED and UPDATE again
Posted on May 7, 2017 Leave a Comment
05/07/2017 – Happy “insert name here” day … have you noticed that Social Media is making a “insert name here” day for everything? So, for me, I say “Happy Dollar Index Update” day … as an FYI, that’s May 7, 2017.
Anyhoo – man this is getting interesting. I’ve updated both the 4 hour and the monthly since Plaza chart below.
Let’s pay attention to 3 things:
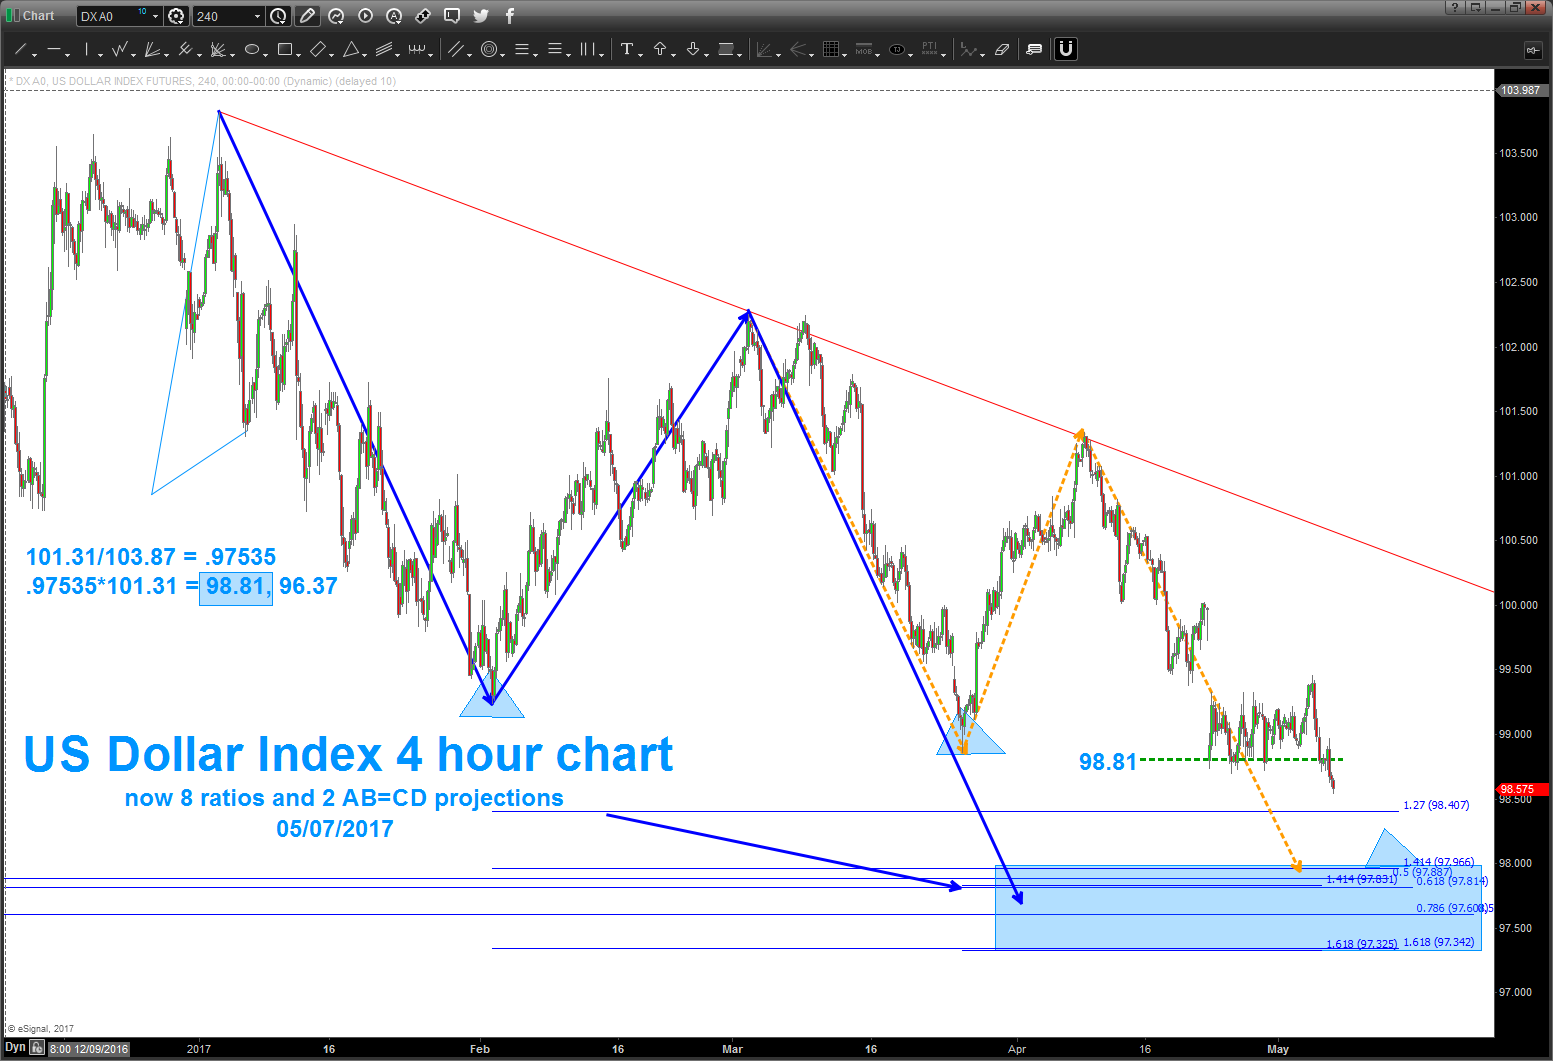
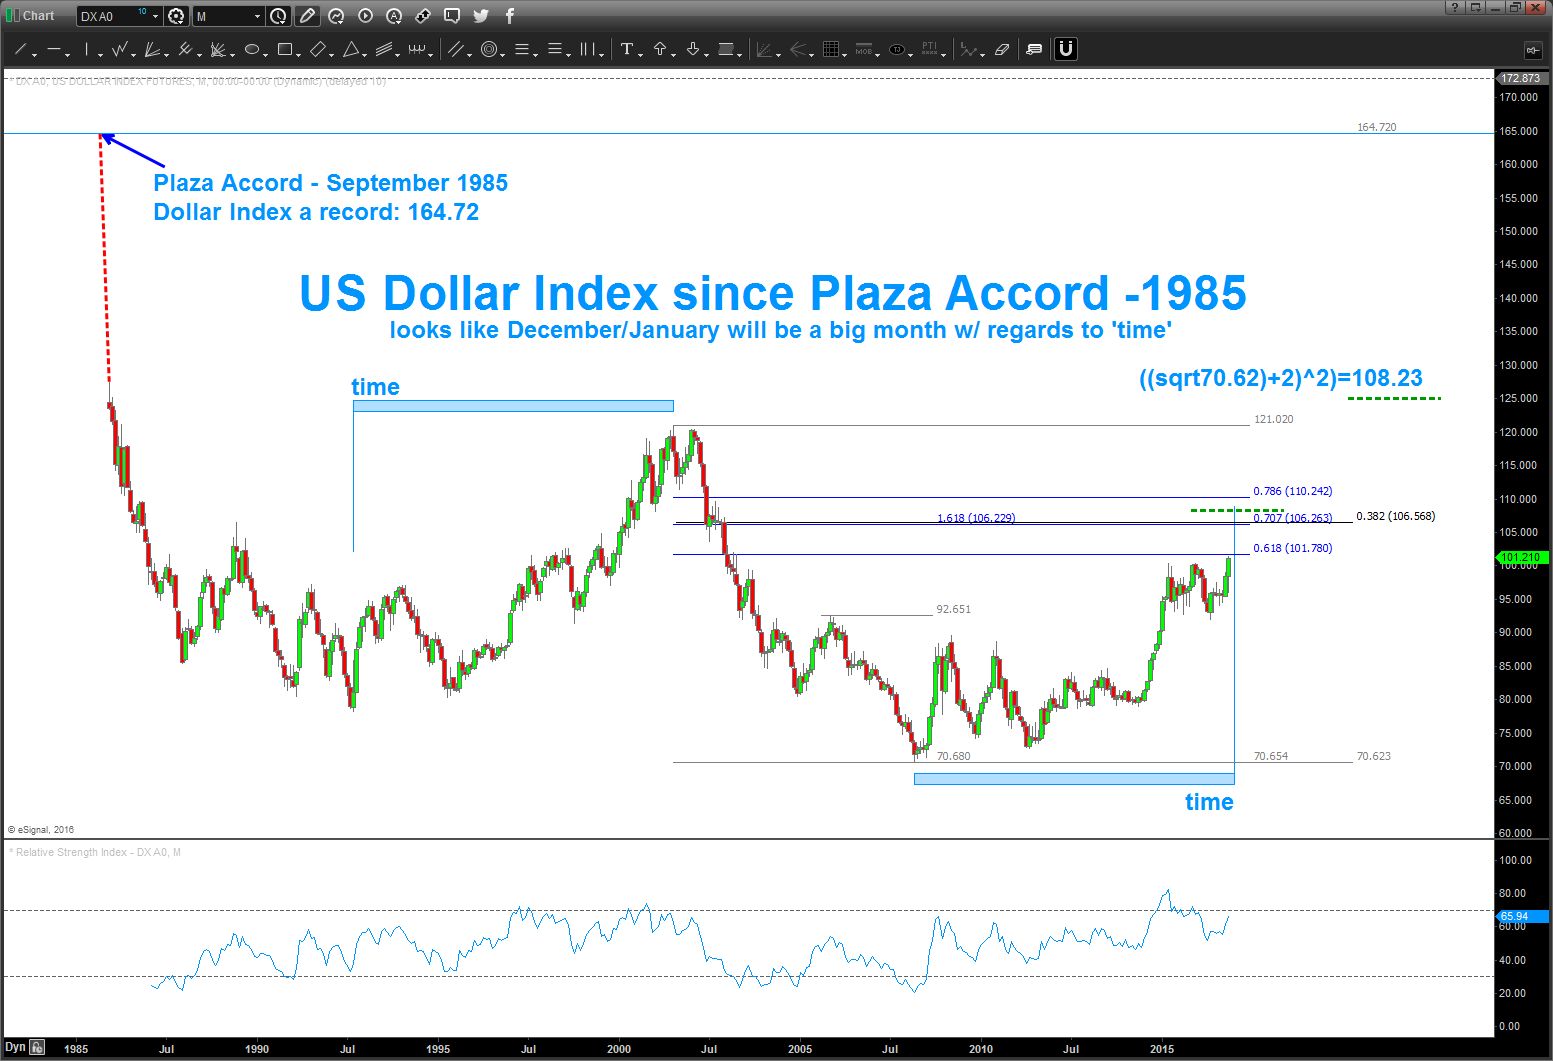
- the level shown back on April Fools Day is now even more important. As you can see below, we now have 2 projections into the same area, we have a 3 drives to a bottom forming and have added another ratio to this area. WOW ..kind of important.
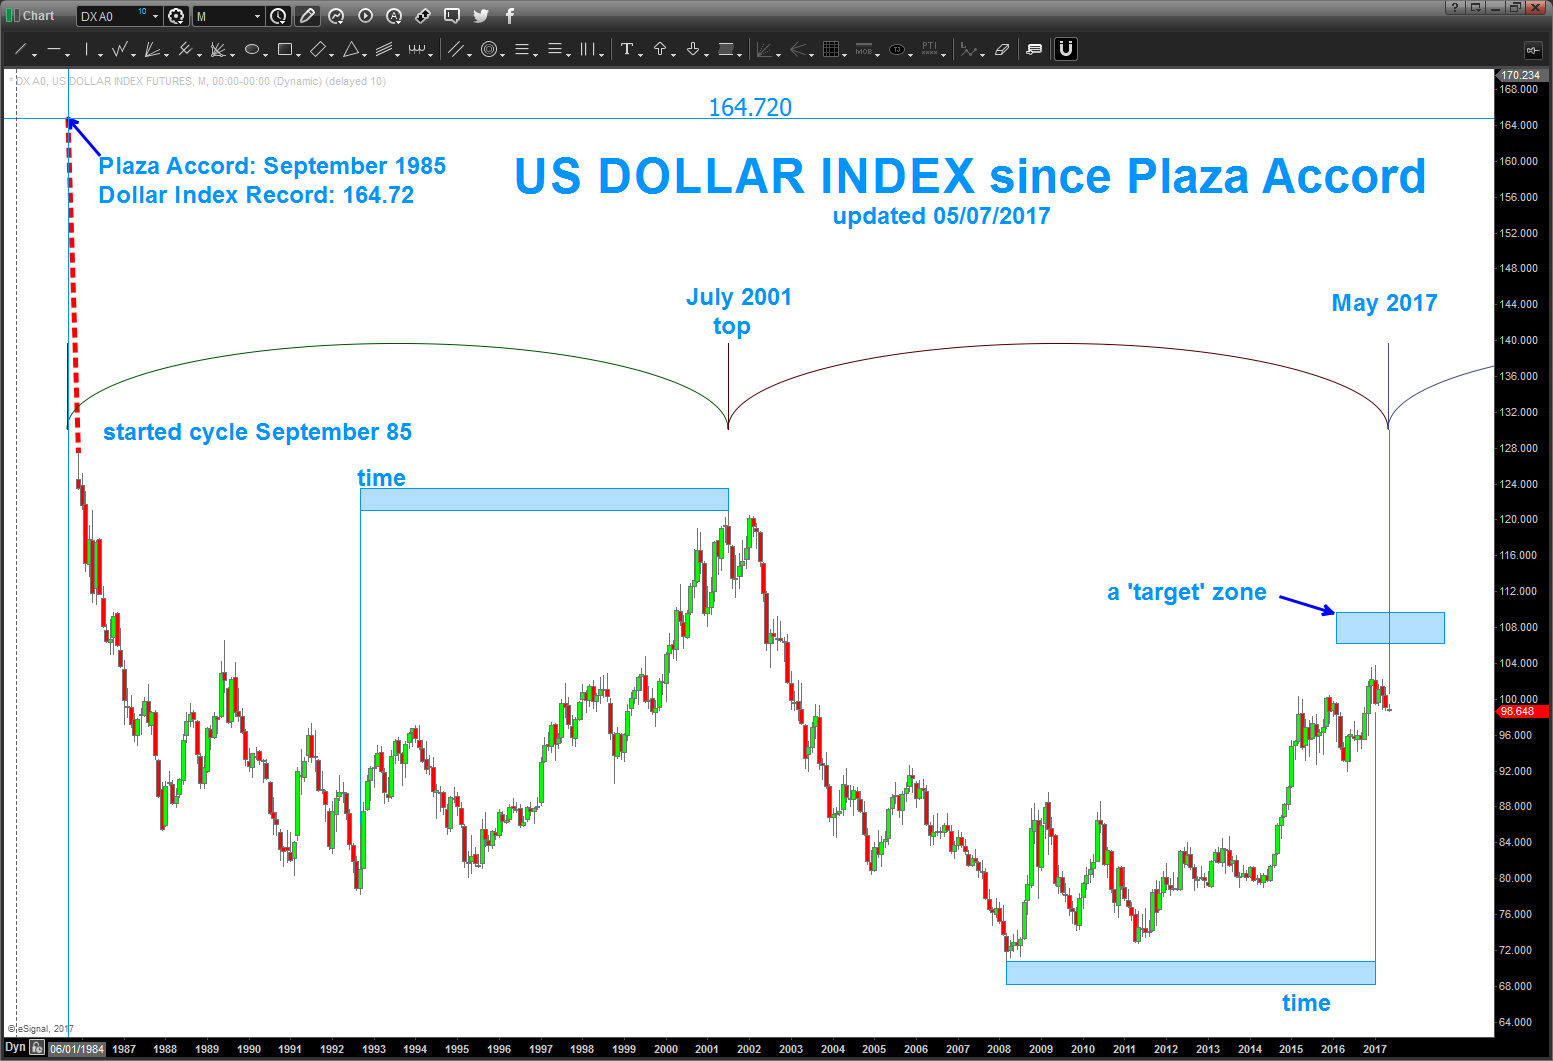
- on the monthly, notice the blue rectangle w/ time above/below it. That represents, in months, the EXACT time it took to rally after falling from 164 and it hit – exactly – from the rally low in 2008 to now. The key here is that it hit right at a very powerful PRICE relationship. it was an exact 1.618 price projection relationship. Very well could have finished A-B-C Elliott Wave correction – we simply don’t know yet … is this a 3 or a C. (that’s the big deal)
- also, on the monthly, note the cycle we started from 1985. It’s smacking right into May (now) and so …it DID NOT rally up into the ‘target zone’ ID’d and it’s finishing an important BUY pattern in the 98-99 area. IF THIS HOLDS and rallies us UP into the target zone we still have to consider this to be a BIG resistance area ALONG w/ time so …
W/ all of this going on AND w/ the French doing the elections right now believe this will resolve – SOON.
WATCH 98-99 level for the first chess move to occur … hope this helps.
_____________________________________________________________________________________
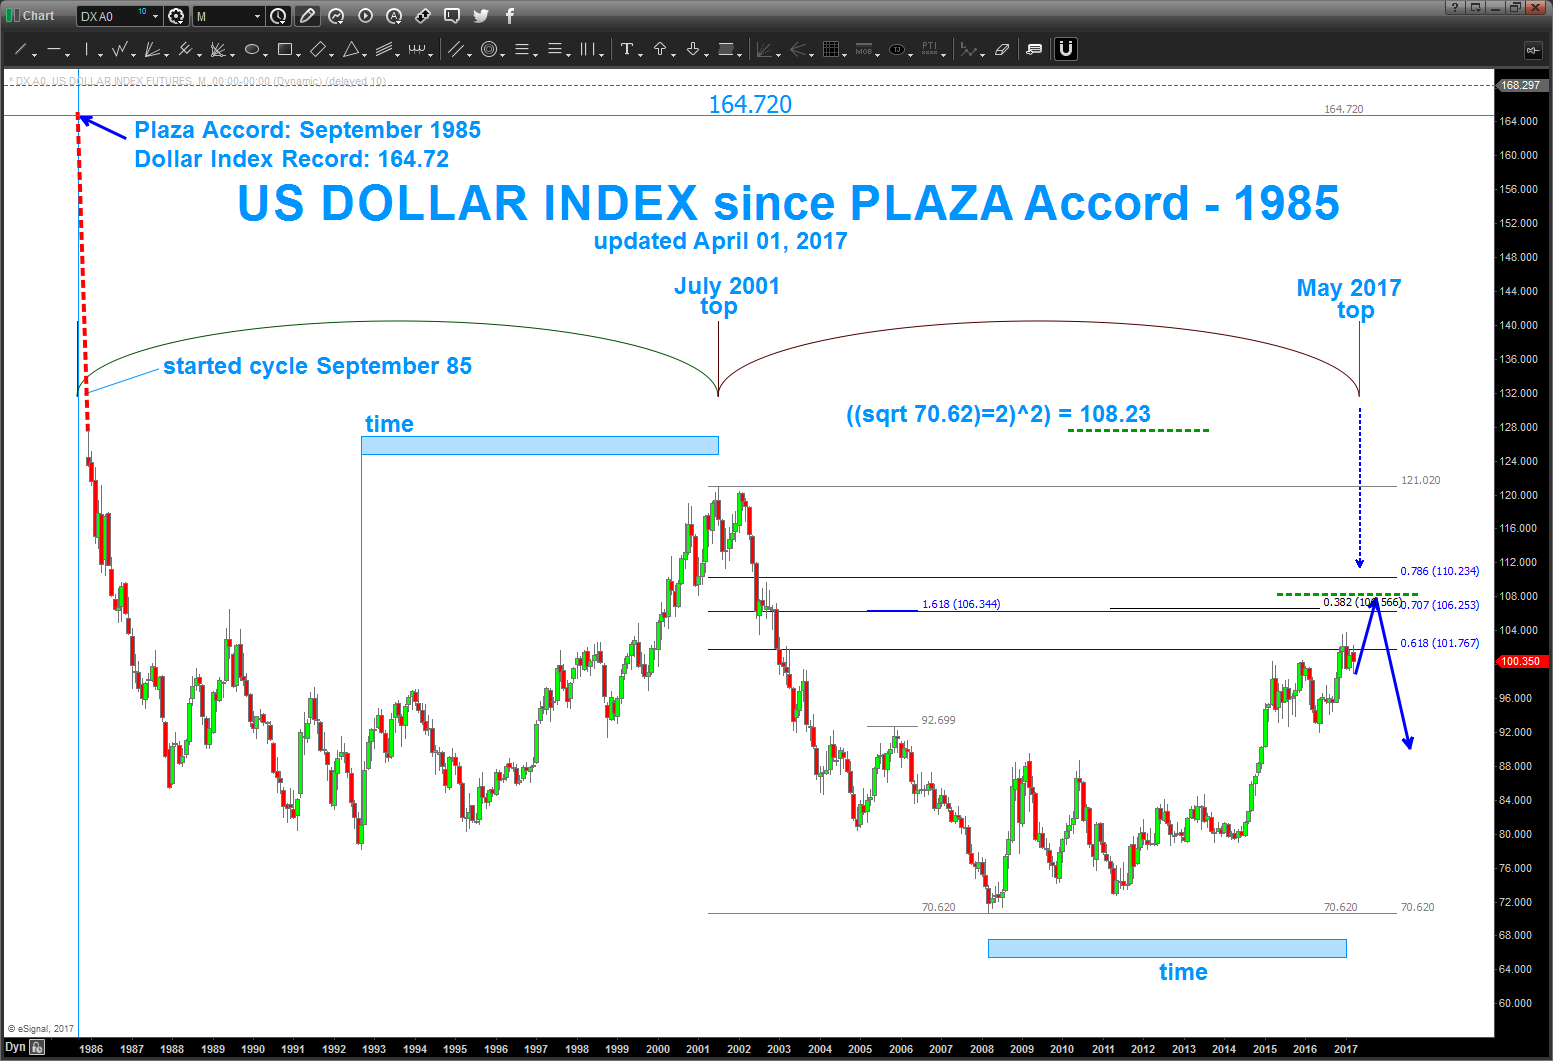
04/01/2017 – Happy April Fools Day!
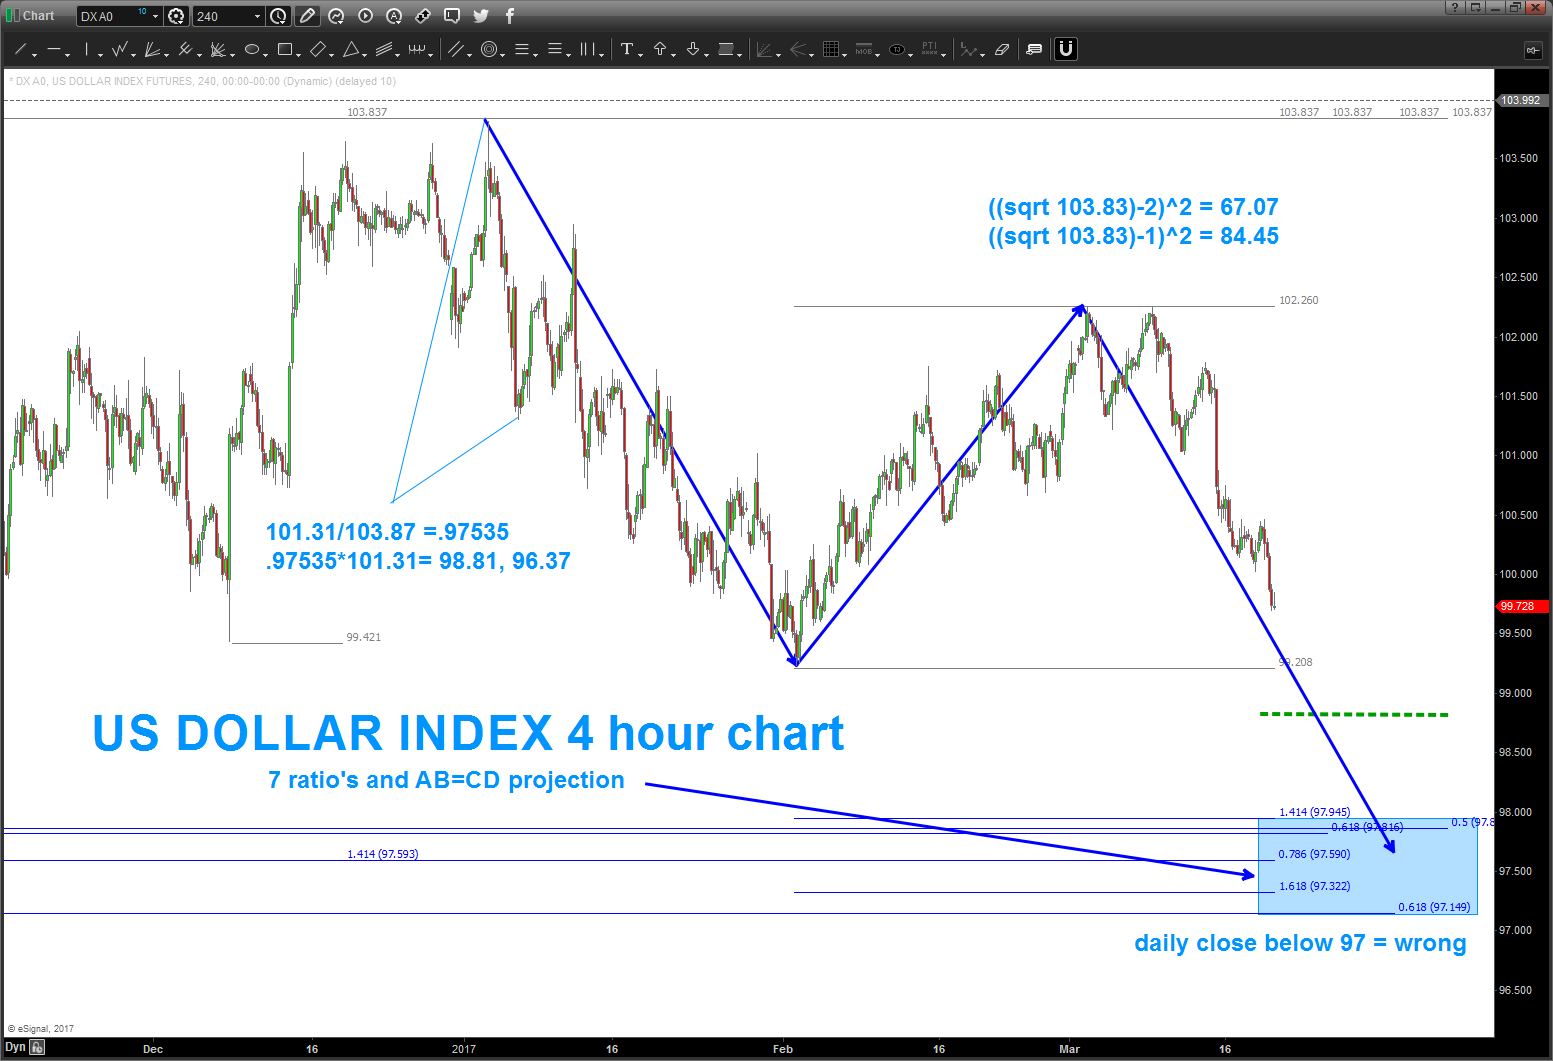
per below, the US Dollar Index smacked right into our target …but, the PATTERN certainly looks like one more wave ahead. Then, well, things are going to get really interesting! Next stop is more than likely 106-108 on the index.
it’s quite clear to see 5 waves completing up into that area …
also, was ‘hoping’ for a deeper correction as shown on the dollar index but the ‘fundamental frequency’ stopped it and, for now, probability says a low is in place for the USD and it should vault higher in the coming weeks.
one last, on the chart below, note the cycle tops from 1985, 2001 line up in May 2015.
Going to get really interesting.
________________________________________________________________________________
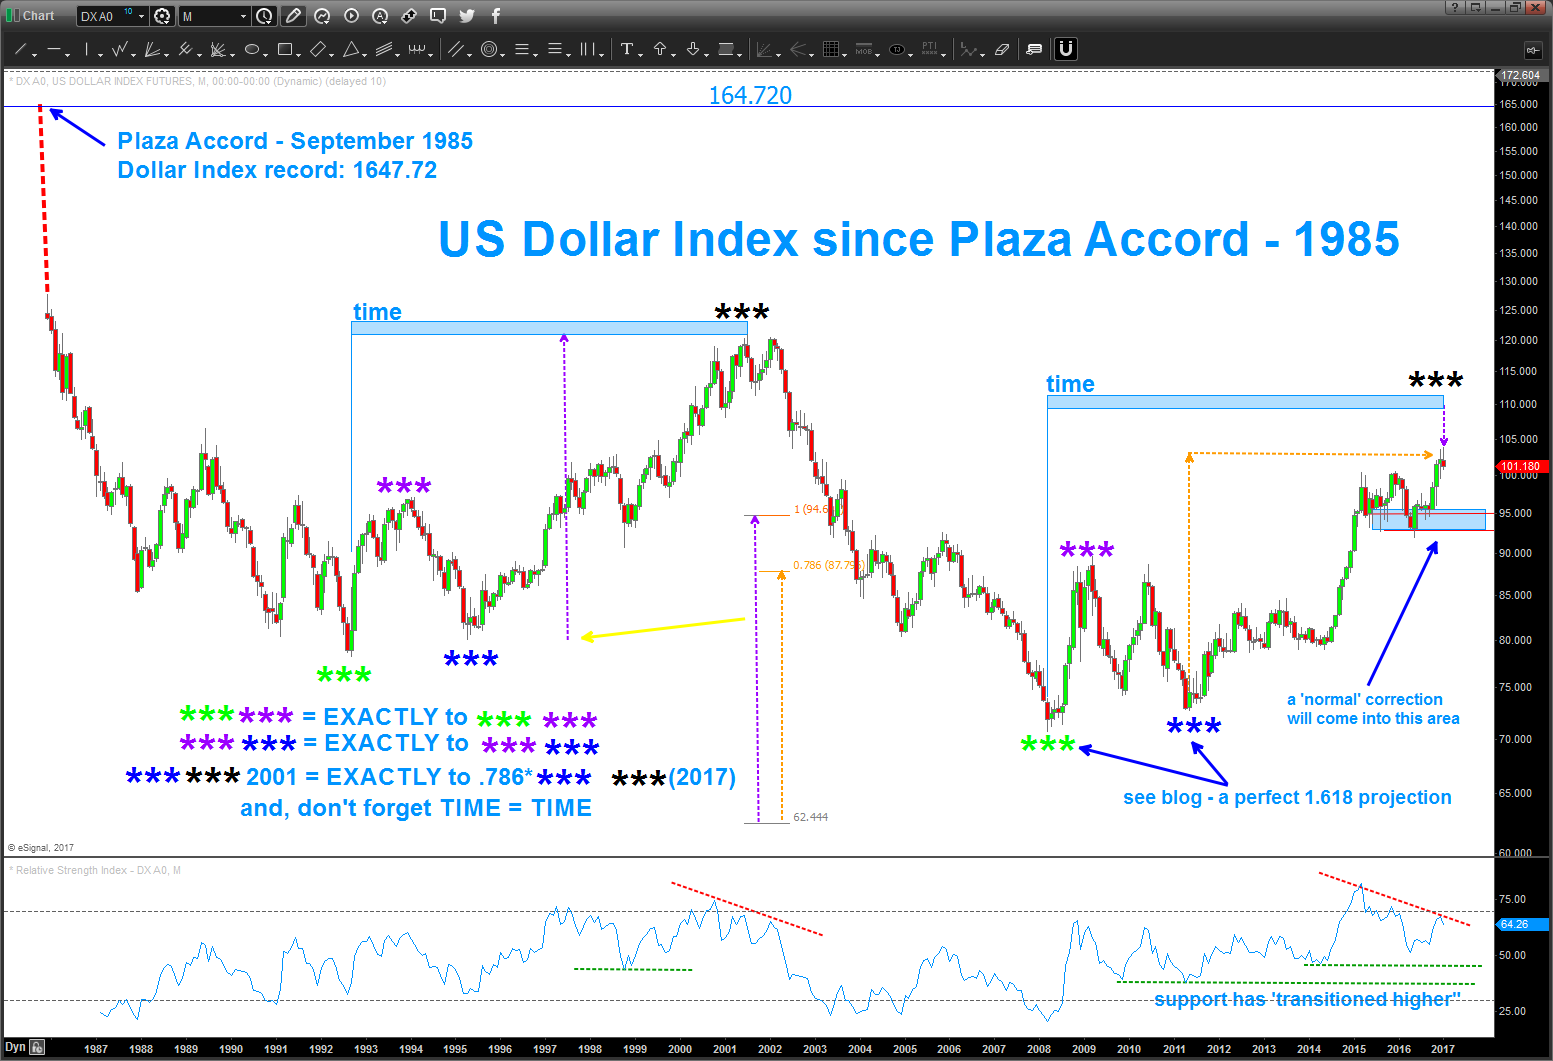
1/14/2017 – if your into harmonics and patterns, then read below. If you just want the bottom line up font (BLUF) then read this: WAIT to do anything on the US Dollar.

Obviously, I’m “called” or “attracted” to a movie like this because of the amazing synchronicity to ‘string theory’ and ‘time’ … so if I really want to go ‘deep’, so to speak, I will play a soundtrack like this w/ only this music in the background and a chart …
what’s most important .. ? where are we now ..,
- there is BEARISH RSI divergence on the monthly
- the TIME component (a big deal) is EXACTLY equal to the last major rally in the index since the Plaza Accord
- the most recent high is a 1.1618 projection and EXACTLY .786 the rally from 1995-2201 – EXACTLY
- we have RECORD NEGATIVE/BEARISH sentiment for the EURO (a major component of the index)
- see blog and note the cycles on the POUND and the AUSSIE and LOONIE
- note: the RSI ‘transition’ to higher support zones … that’s bullish
So, UNFORTUNATELY, my friend we need to WAIT and IF (the big IF ) every thing is to come together then we should see support come in around 92-95 to get long on the dollar.
Bart
PS – you read it here … I’m REALLY ‘believing’ (not supposed to do that) that the $$$ will find support in/around the areas sighted below. BUT .. if you try and SEE the picture that’s painted .. this COULD BE A MONSTROUS $$$ TOP. How will we know …. no flipping idea. You guys/gals tell me ….
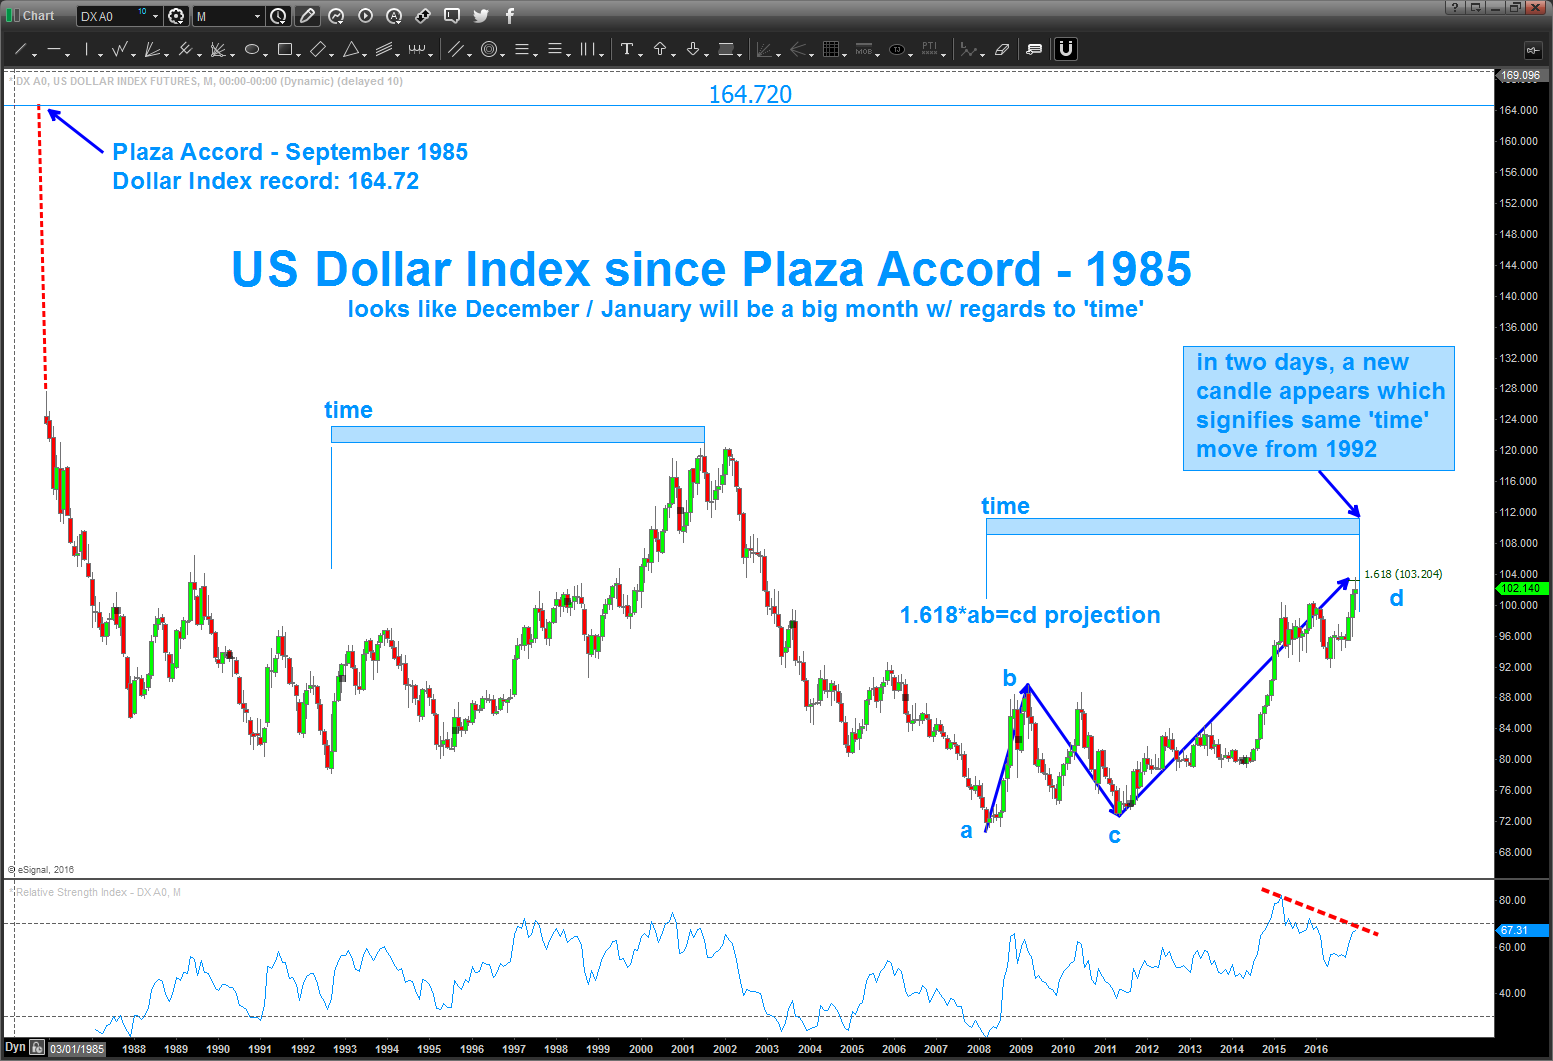
12/30/2016 – updating the US Dollar Index post
- bearish divergence – check
- 1.618 price projection hit – is this an a-b-c correction and the dollar has peaked? Potentially … or is wave 3 of 5 concluding w/ a pull back imminent?
- SENTIMENT is extreme bearish for the EURO and GOLD
- note – we are hitting the same TIME correction in a couple days as the move up from 1992-2001
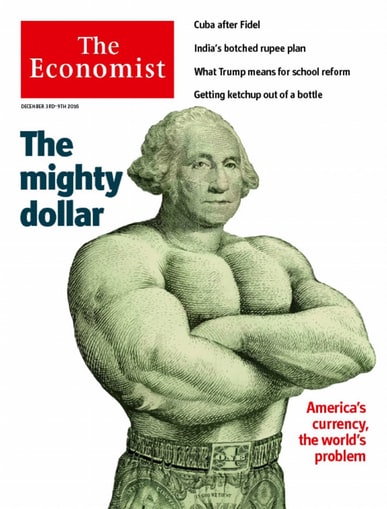
- Economist .. the best contrarian indicator out there.
CLIFF NOTES: if you read below you’ll see there are other targets higher. We are approaching the same TIME as the last move up in the dollar against the smash from the Plaza accord so the ‘no brainer’ long dollar trade is one that begs of caution. Is this THE top in the USD and now we go back below 70? Don’t know, but a preponderance of evidence suggests STIFF resistance from now into January for the USD.
11/19/2016 – if you want to follow the Dollar posts, just search dollar on the top right area of the blog. the overall thesis, which has proven to be correct so far, was the dollar was going to strengthen all the way from the low 70’s. it’s been a nice run …
is there higher to go … yes.
but then …
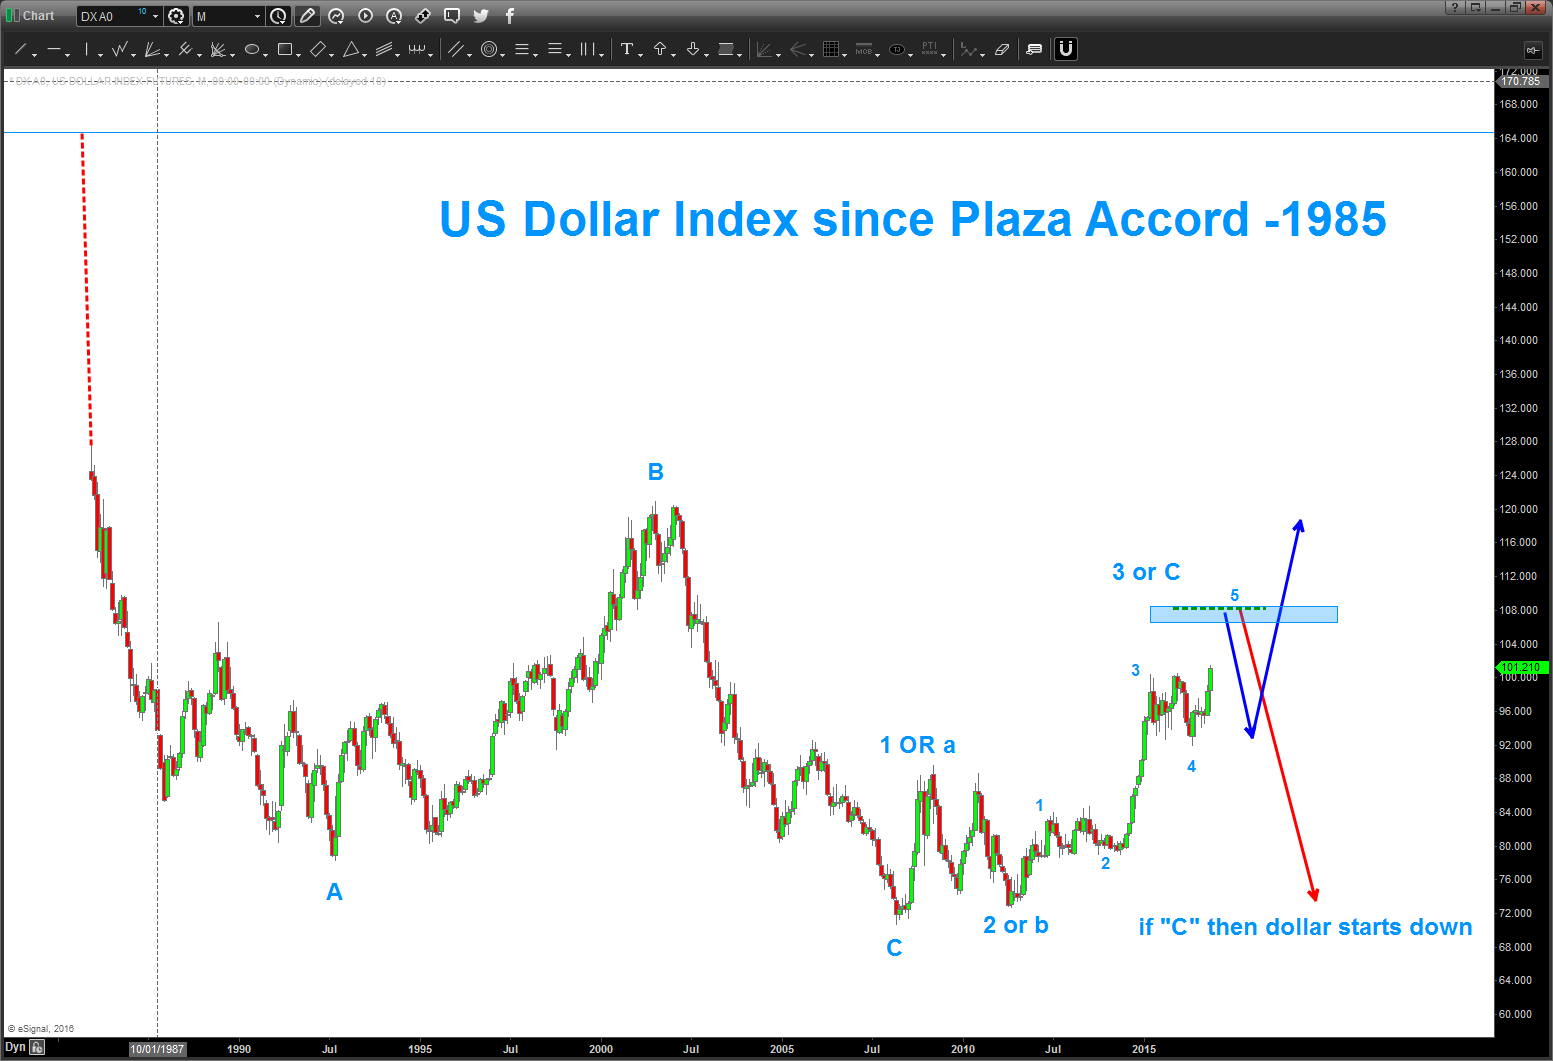
here’s the picture – note, I’ve used the high from the Plaza Accord in 1985 to put the .382 retracement on the chart. That also overlaps w/ some nice other extension and retracement ratios. Believe the highlighted area in/around 107-108 is going to be key.
also, note the TIME component between the last major rally from 1992-2001. Next month, or, depending on how you draw the time component, perhaps January the Dollar Index should run into some pretty stiff resistance in TIME.
last thing is the Elliott Wave count … I always tell people – I LOVE Elliott wave – when it works. here, the count has been pretty much a “Ray Charles count” on a long term basis. I’ll try to walk you thru the importance:
- market corrects in 3 waves labeled a-b-c
- the market moves impulsively in 5 waves
- wave 2 can’t overlap the beginning of wave 1
- wave 3 can’t be the shortest
- wave 4 can’t overlap the beginning of wave 1
- if you take the low in 2008 and start working your way up we see that we are ‘clearly’ creating 3 waves into yesterdays price action.
- here’s where it gets tricky .. simply, I don’t know if this an a-b-c big corrective move OR we are impulsively going higher in a 1-2-3-4-5 sequence.
- the key here – wave c (of a-b-c) always has to be 5 waves (unless in a triangle)
- so if you look you can see the ‘small’ 1,2,3,4,5 being carved out (Turkey reference) so the blue highlighted area 107-108 COULD be the end of a C wave and the entire A-B-C move OR the end of wave 3 and we correct 4 and then off we go again in 5.
I honestly have no idea ….
Here’s what the charts are SHOWING US:
- square root target
- the ‘time’ of the last corrective move
- the ‘count’ showing we are in the 5th wave of C and 3
- EXTREME sentiment for a strong dollar
- the .382 from the all time high
- divergence set up on Monthly RSI
- ‘other’ extension and retracement targets
Expect some major resistance .. again, we are 6 handles away from the target area and that represents HUGE moves in currency .. BUT remember, right now, we are at extreme (not historic) but extreme sentiment and this has never proven to be wrong from a contrarian indicator. This puppy could snap back on you really really quick.
only TIME will tell … let me know if you have any questions.
B
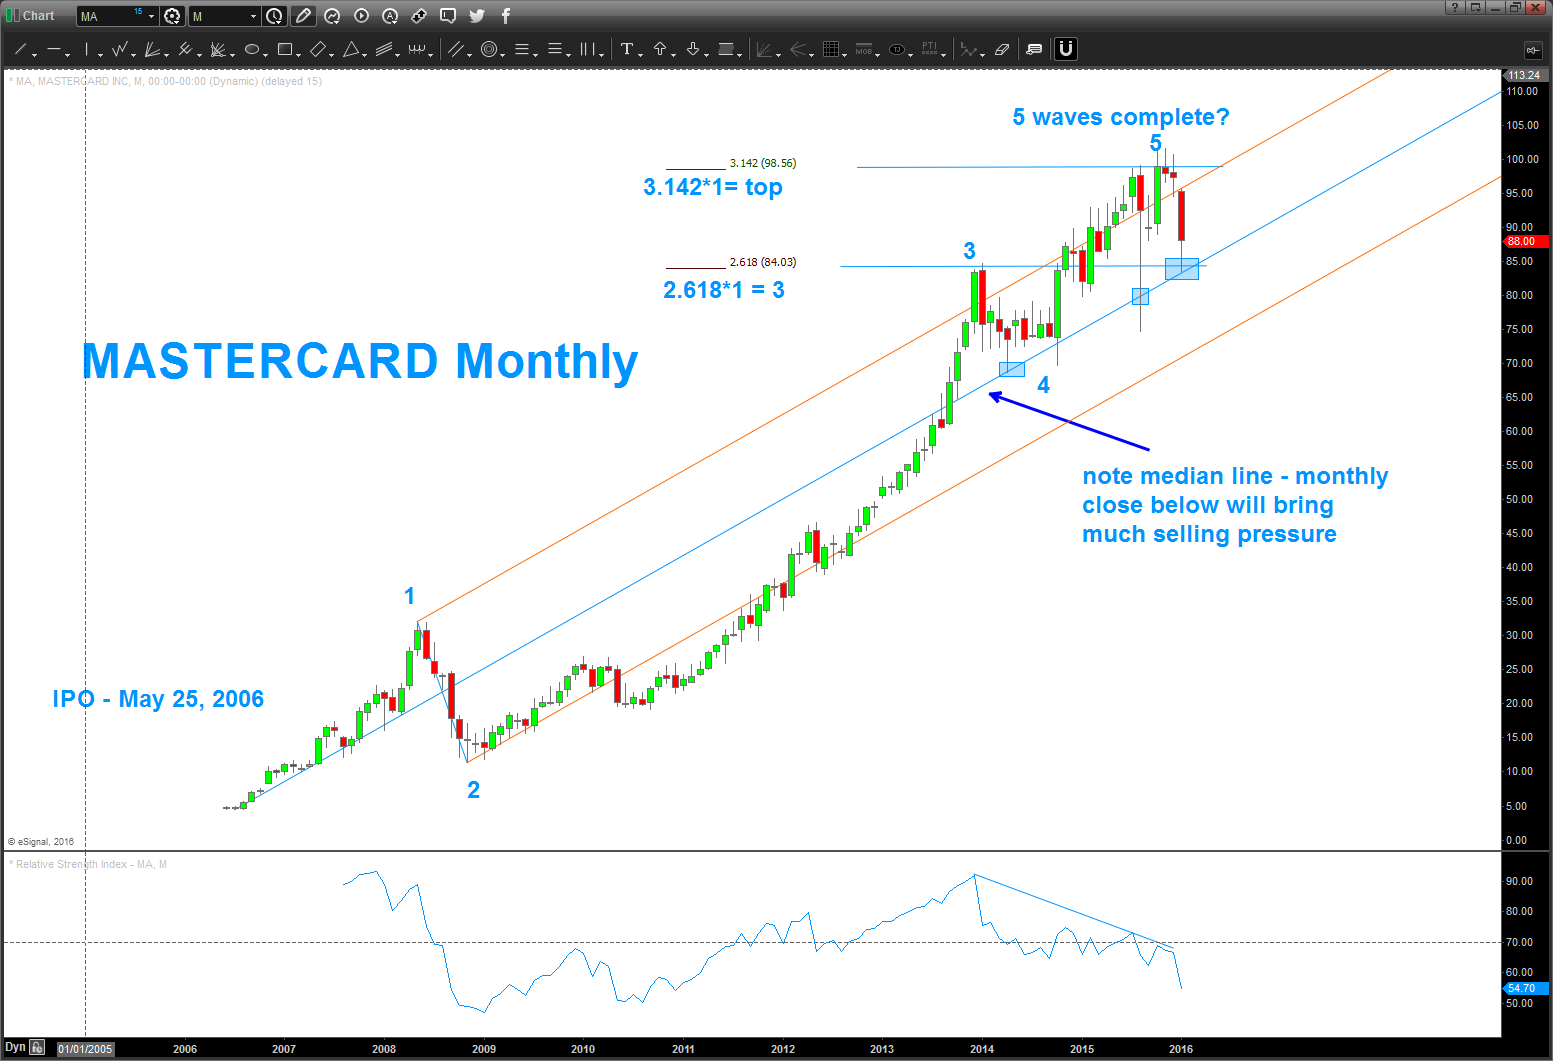
Mastercard 5 waves up complete? an UPDATE
Posted on April 29, 2017 Leave a Comment
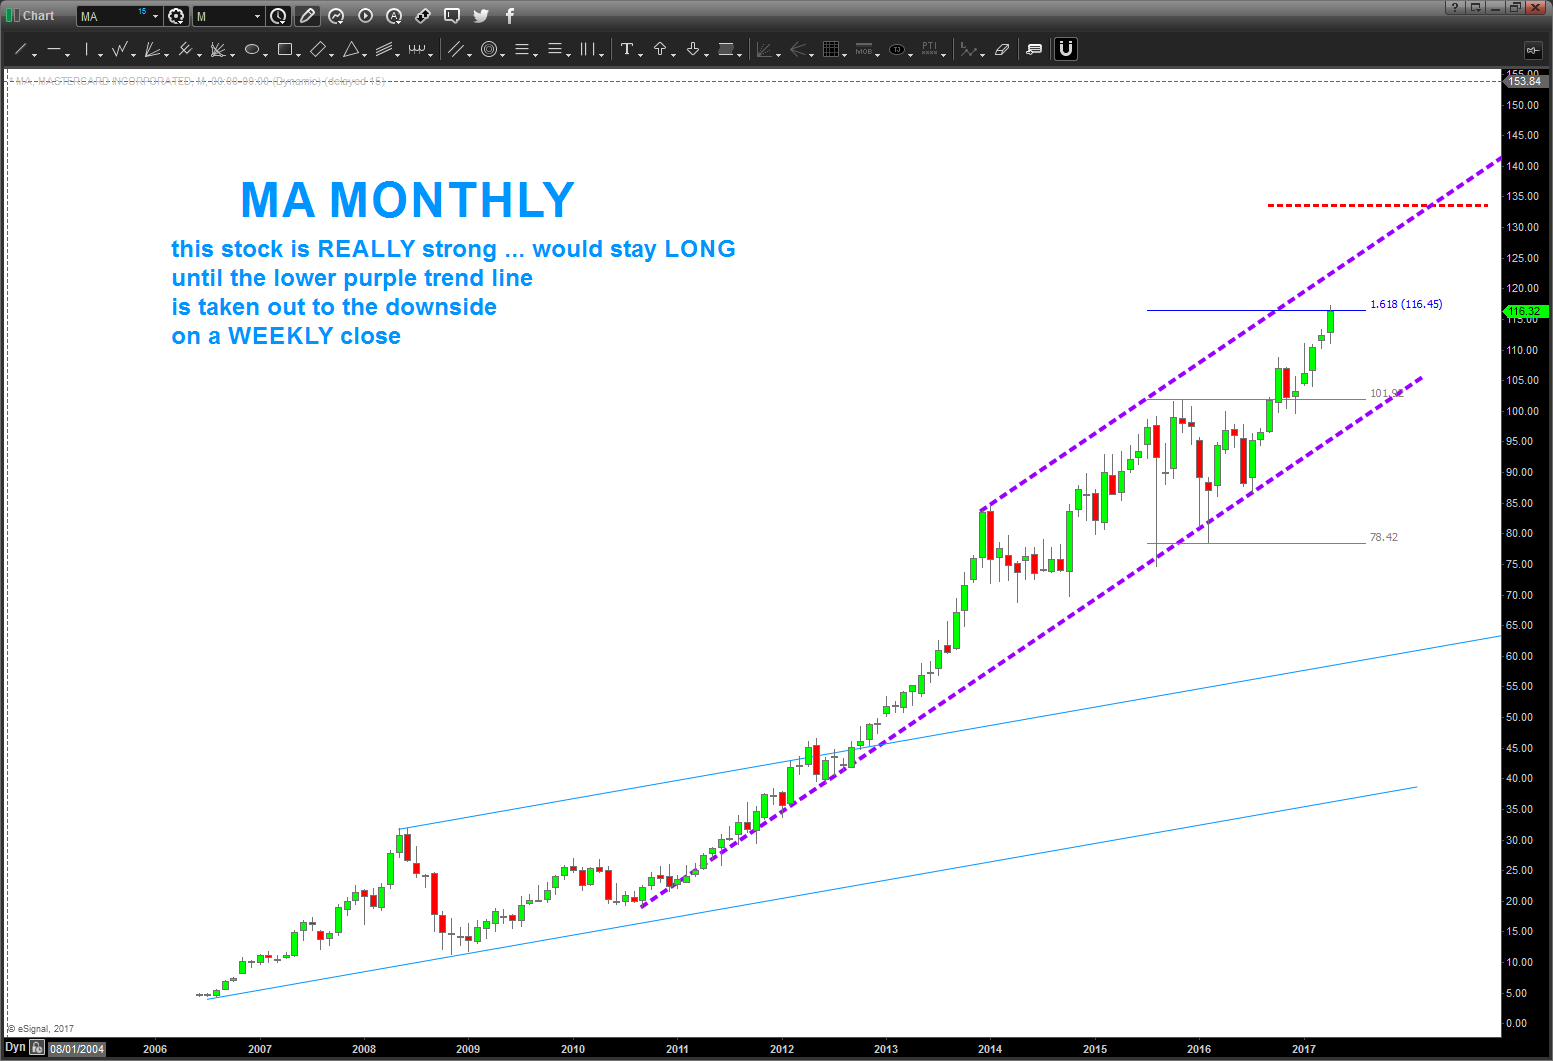
04/29/2017 – the levels shown in the post below held but created a 6-8 month triangle which exploded higher. Triangles are terminal from where they explode (higher or lower) but this stock is really strong. Do I think we are still in a 5th wave – YES. But, I would keep rolling w/ this until the lower purple trend line is broken on a weekly close …this is a VERY powerful stock.
thanks for asking .. I did this post for a colleague but more importantly a trusted friend.
B
__________________________________________________________________________________
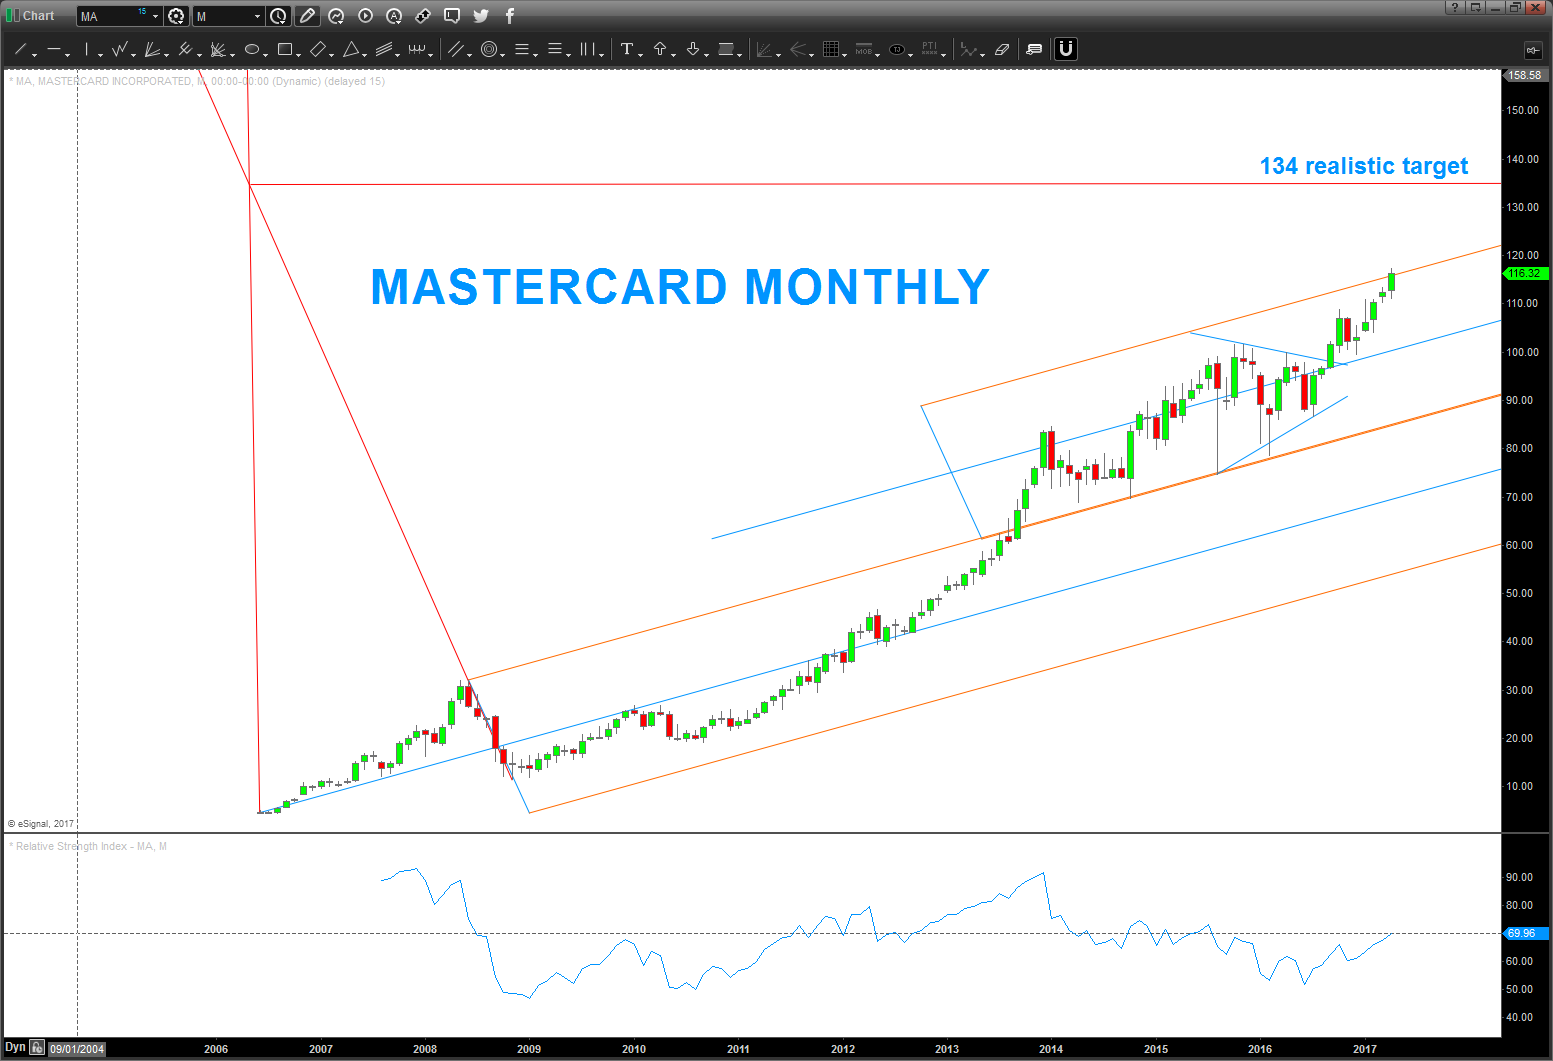
MasterCard – what a great business model. you swipe the card and they get paid ..nice.
that being said, sure looks like 5 waves complete w/ monster bearish divergence. note the blue median line. price has not closed below that on a monthly basis, if we do get that close, then this could accelerate to the downside.
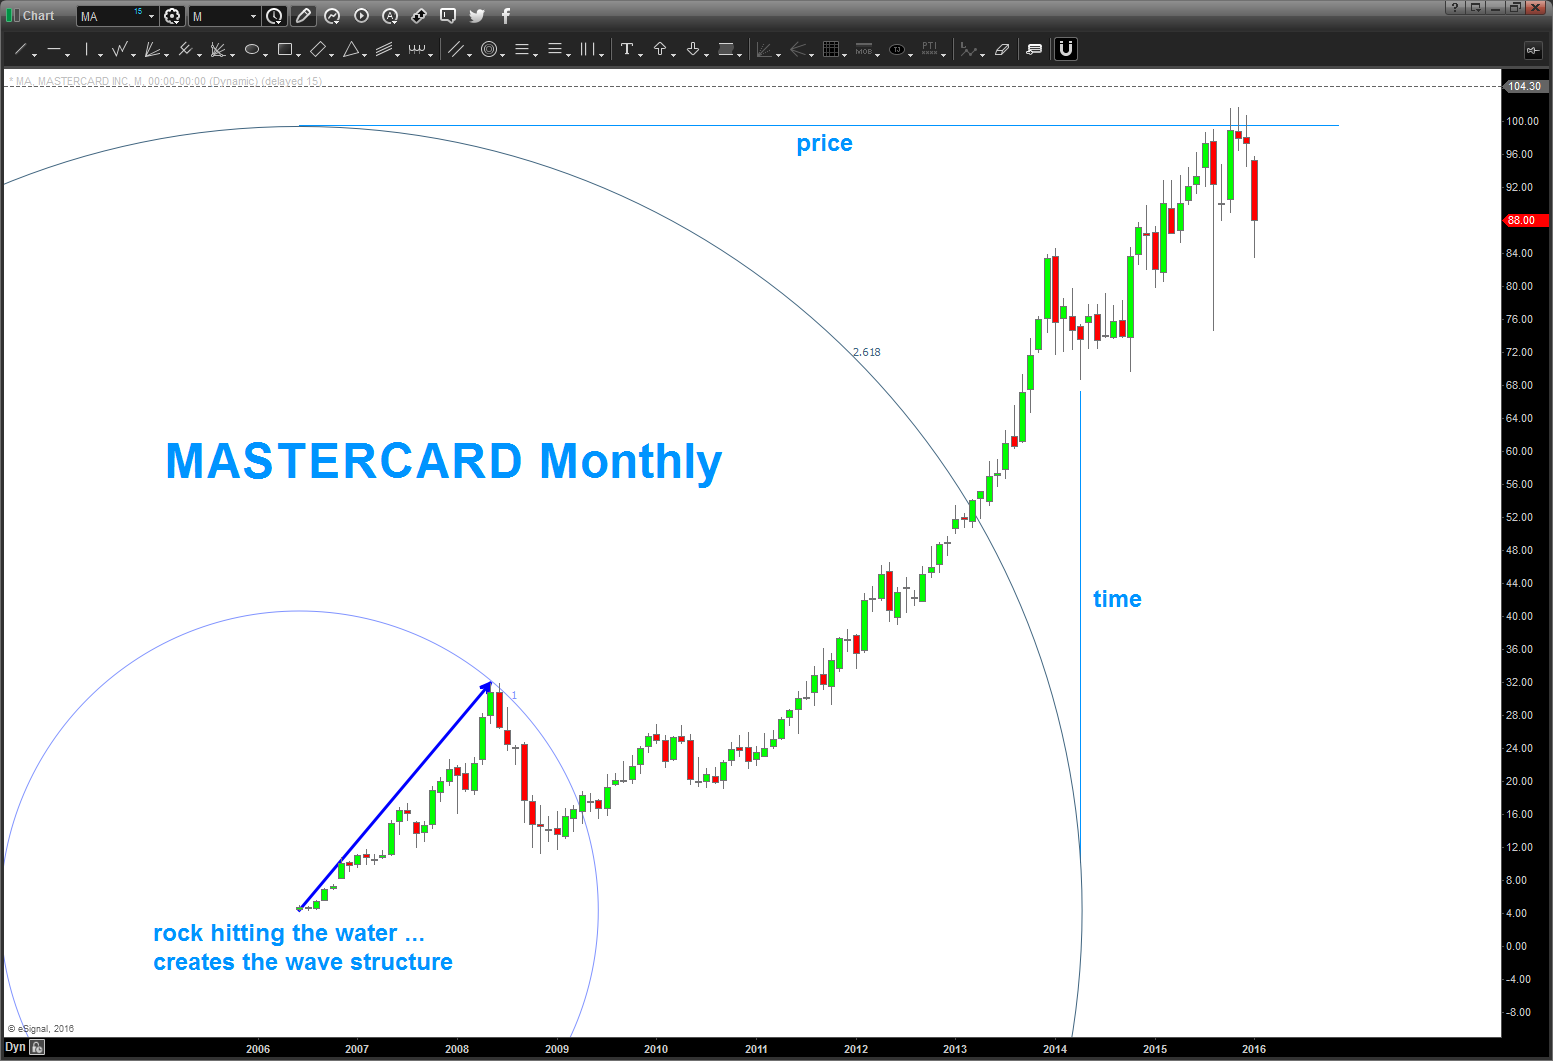
also, thru some geometry on there … when using arcs, the 3 o’clock position is a time component and the top of the circle is price. see how the “time” component nailed the low? that gives you a heads up that the price (top of the circle) should be stiff resistance.
B
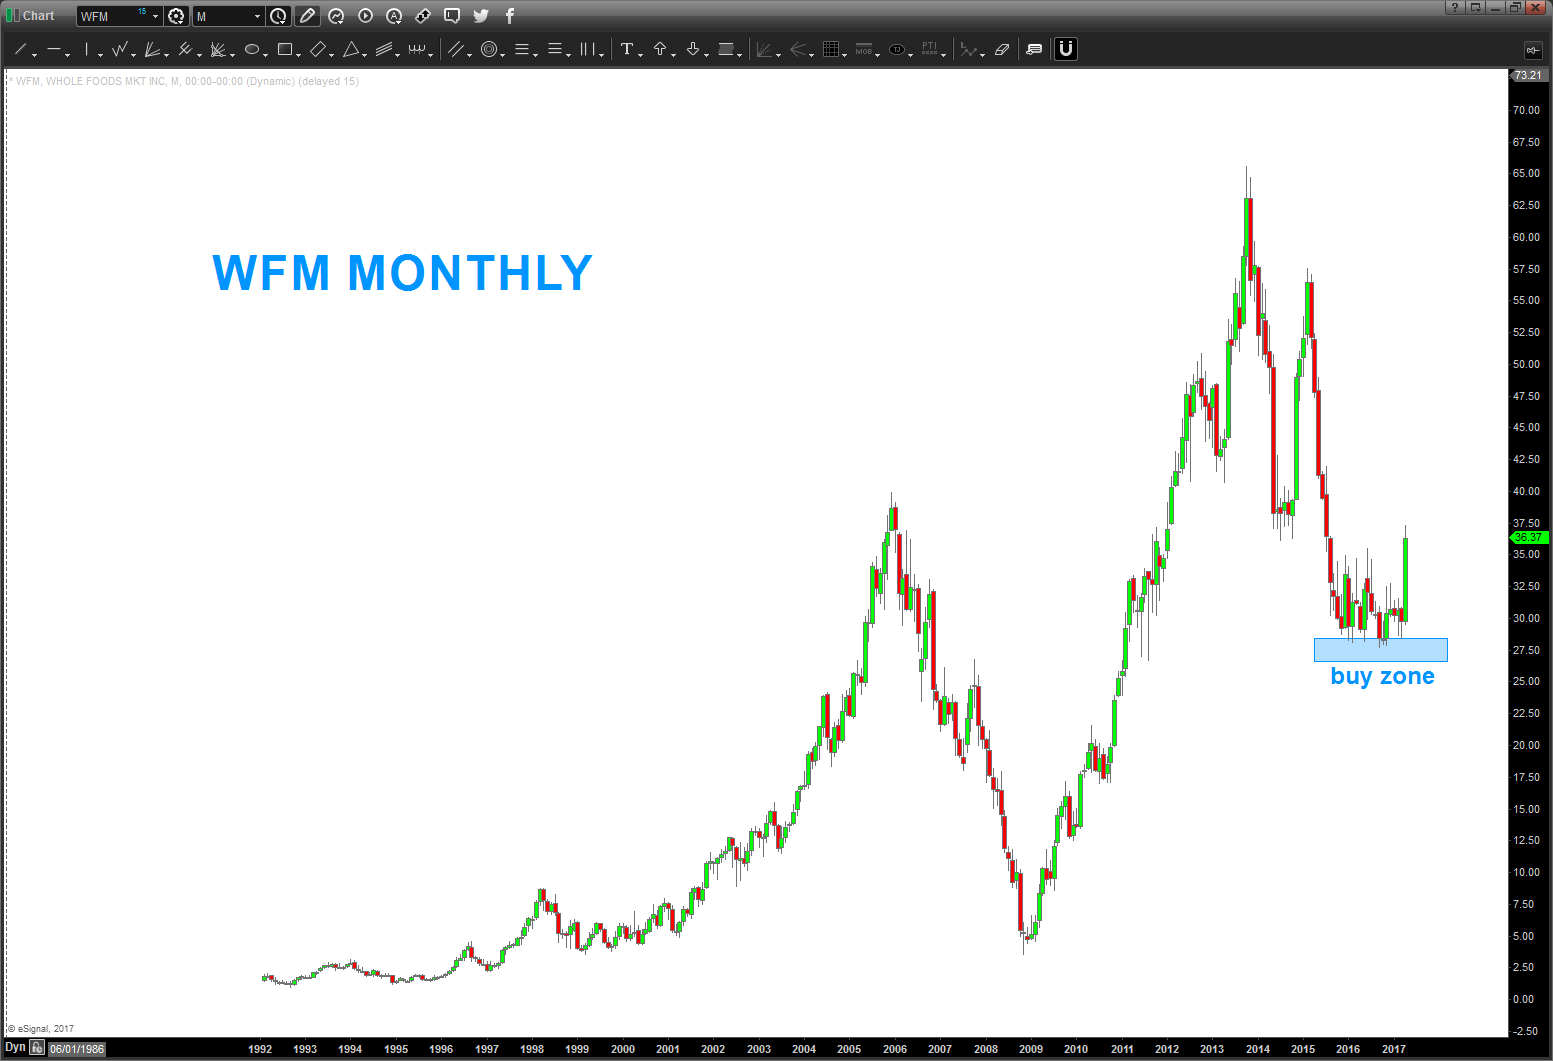
$WFM …man took a while but it popped …
Posted on April 29, 2017 Leave a Comment
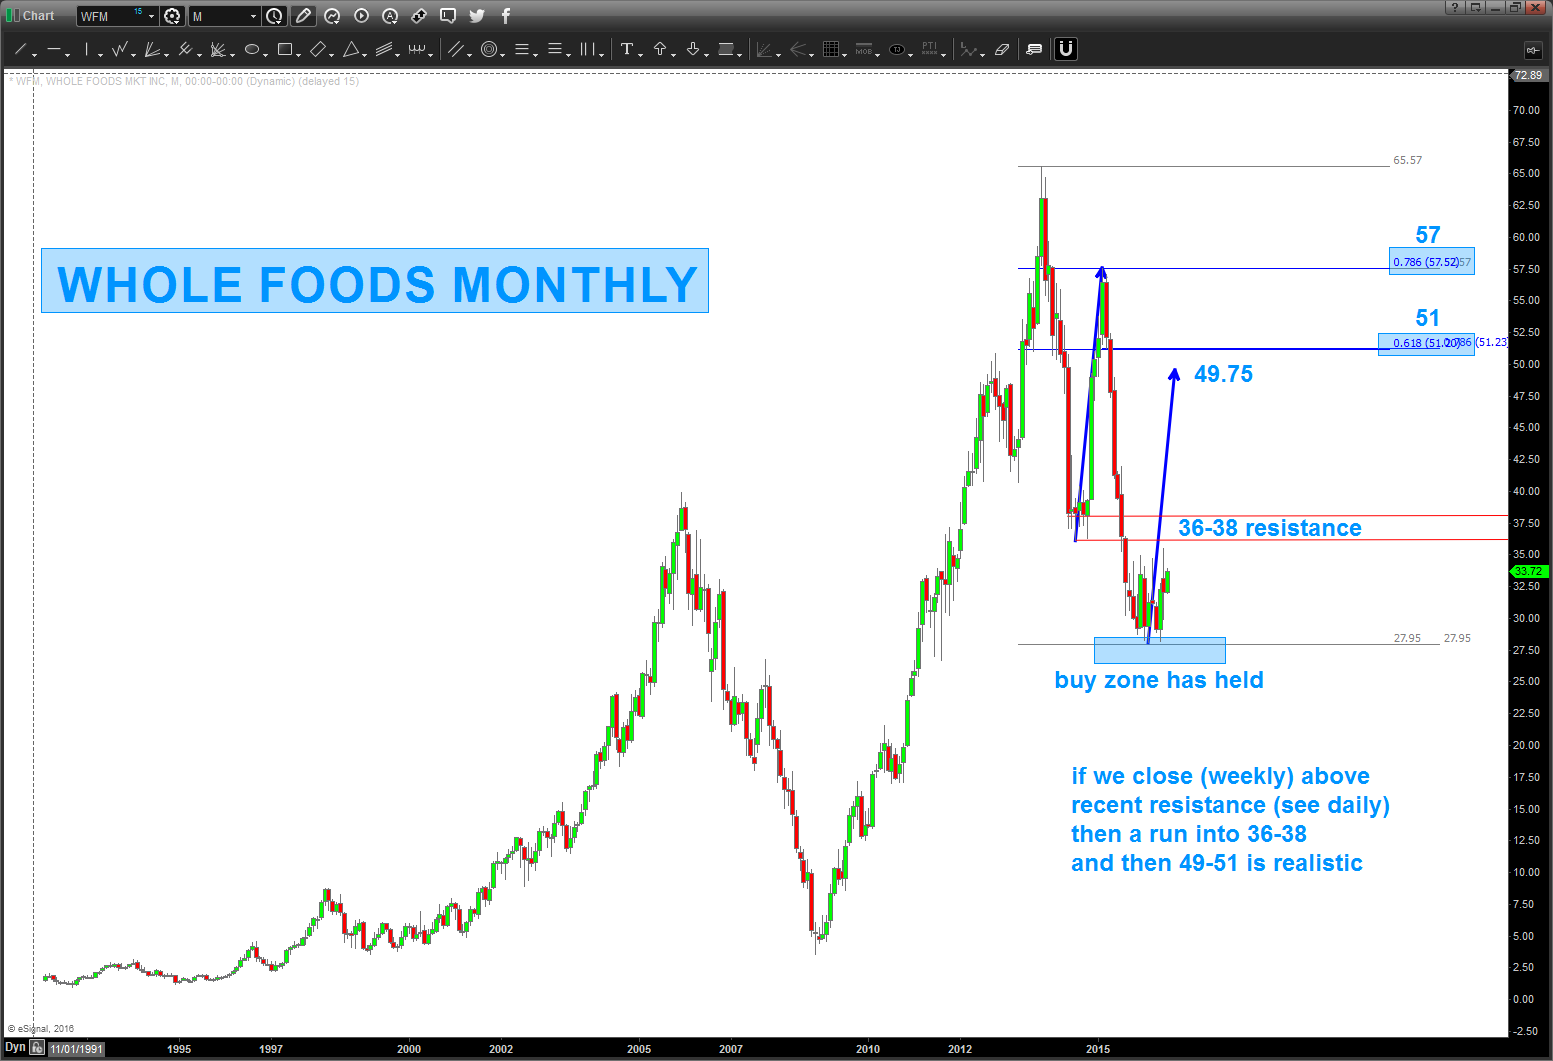
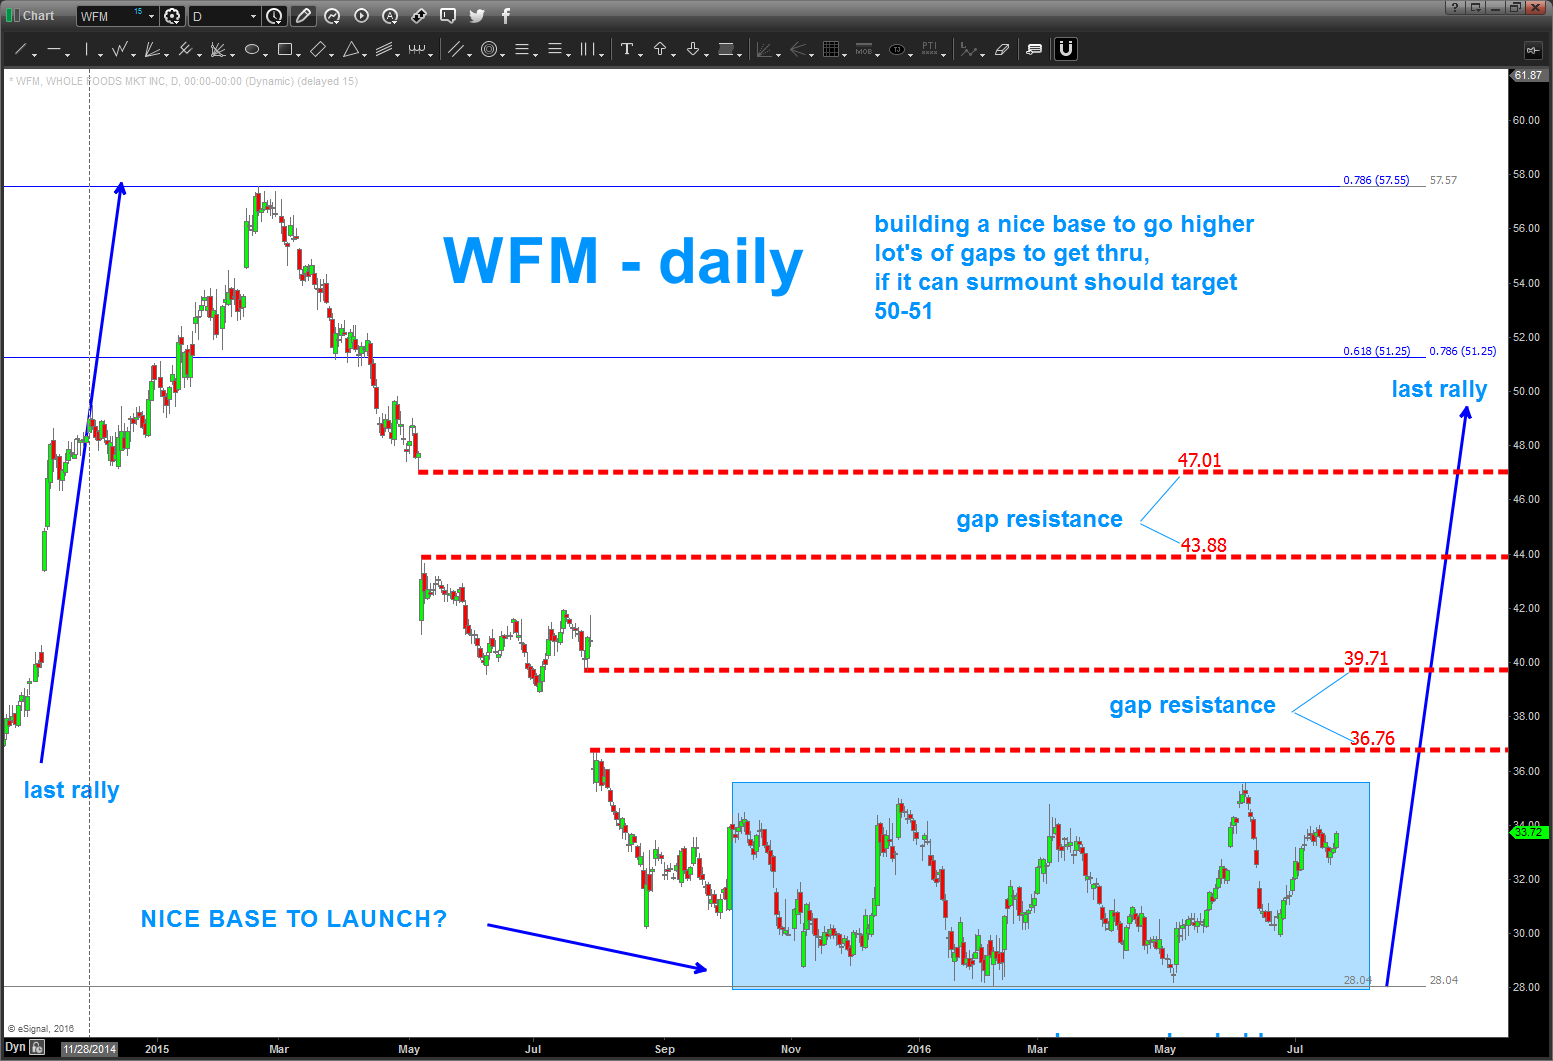
04/29/2017 – consolidated for a long time and finally popped. a MONTHLY close above the first gap top (40) should seek higher.
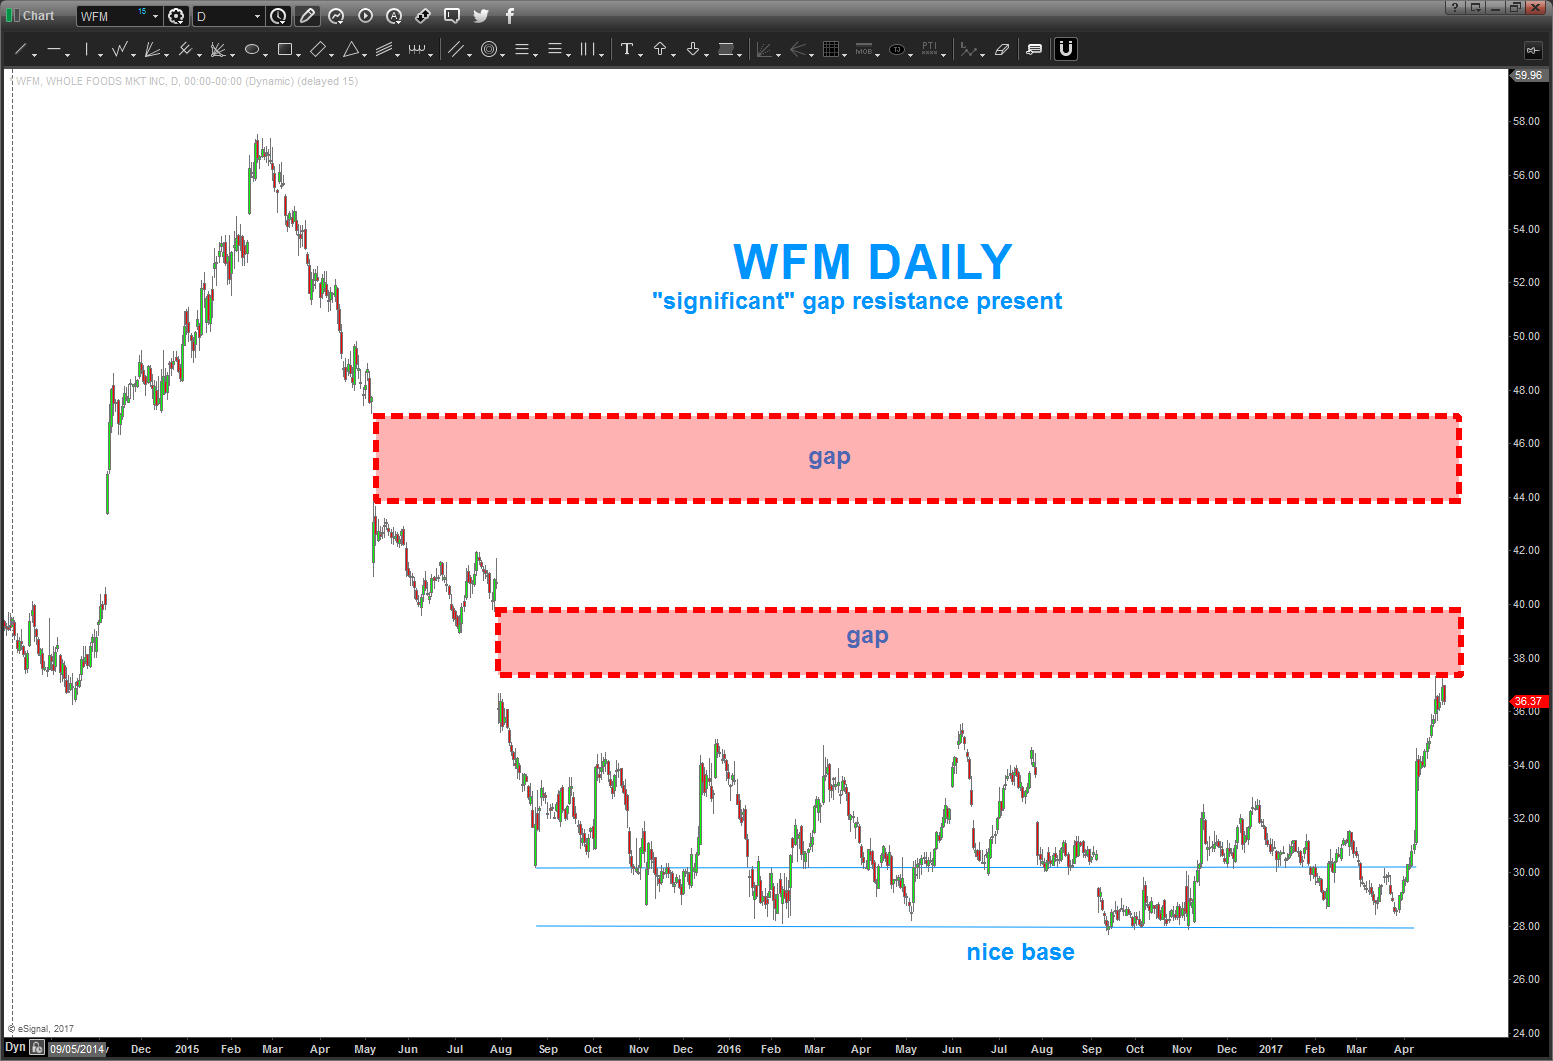
also, look at daily – lots of gaps in play …
___________________________________________________________________________________
07/24/2016 – appears to be building an ice base to attack daily gap resistance levels and perhaps roll into higher levels. a daily/weekly close back below 28 signals a failed pattern and this analysis is wrong.
here was another update: https://bartscharts.com/2015/11/04/wfm-update/
hope this helps my life long friend … see you in San Diego dude!
Bart
I enjoy listening to JC Parets (@allstarcharts) (www.allstarcharts.com ) as he’s entertaining as hell and also knows his stuff. I blame him for getting me blogging and haven’t looked back since …he’s introduced me to blogging, google hang out, twitter and now periscope. today, was doing some emails and “periscope” popped up that he was cruising the charts so I simply hit the app and was immediately logged onto his computer screen where he was pushing some charts around.
one of the charts – Whole Foods. Besides something about overhead supply, divergence, moving averages and stuff like that I called up the chart on a monthly and saw a PERFECT BUY PATTERN.
- note the blue arrows – projects into 27.94
- but more importantly, note that they are equal in PRICE and TIME right in/around here.
- note the extensions (sitting on the 1.27 extension right now)
- 1.4142 extension hits right on the .618 retrace (that’s good) at 27.16-27.21
- last, look at the dashed orange line .. it’s a measured move which represents the largest corrective move since the all times lows in the early 1990’s
So, sure looks like it “should not” go thru 27 so it presents a nice risk reward.
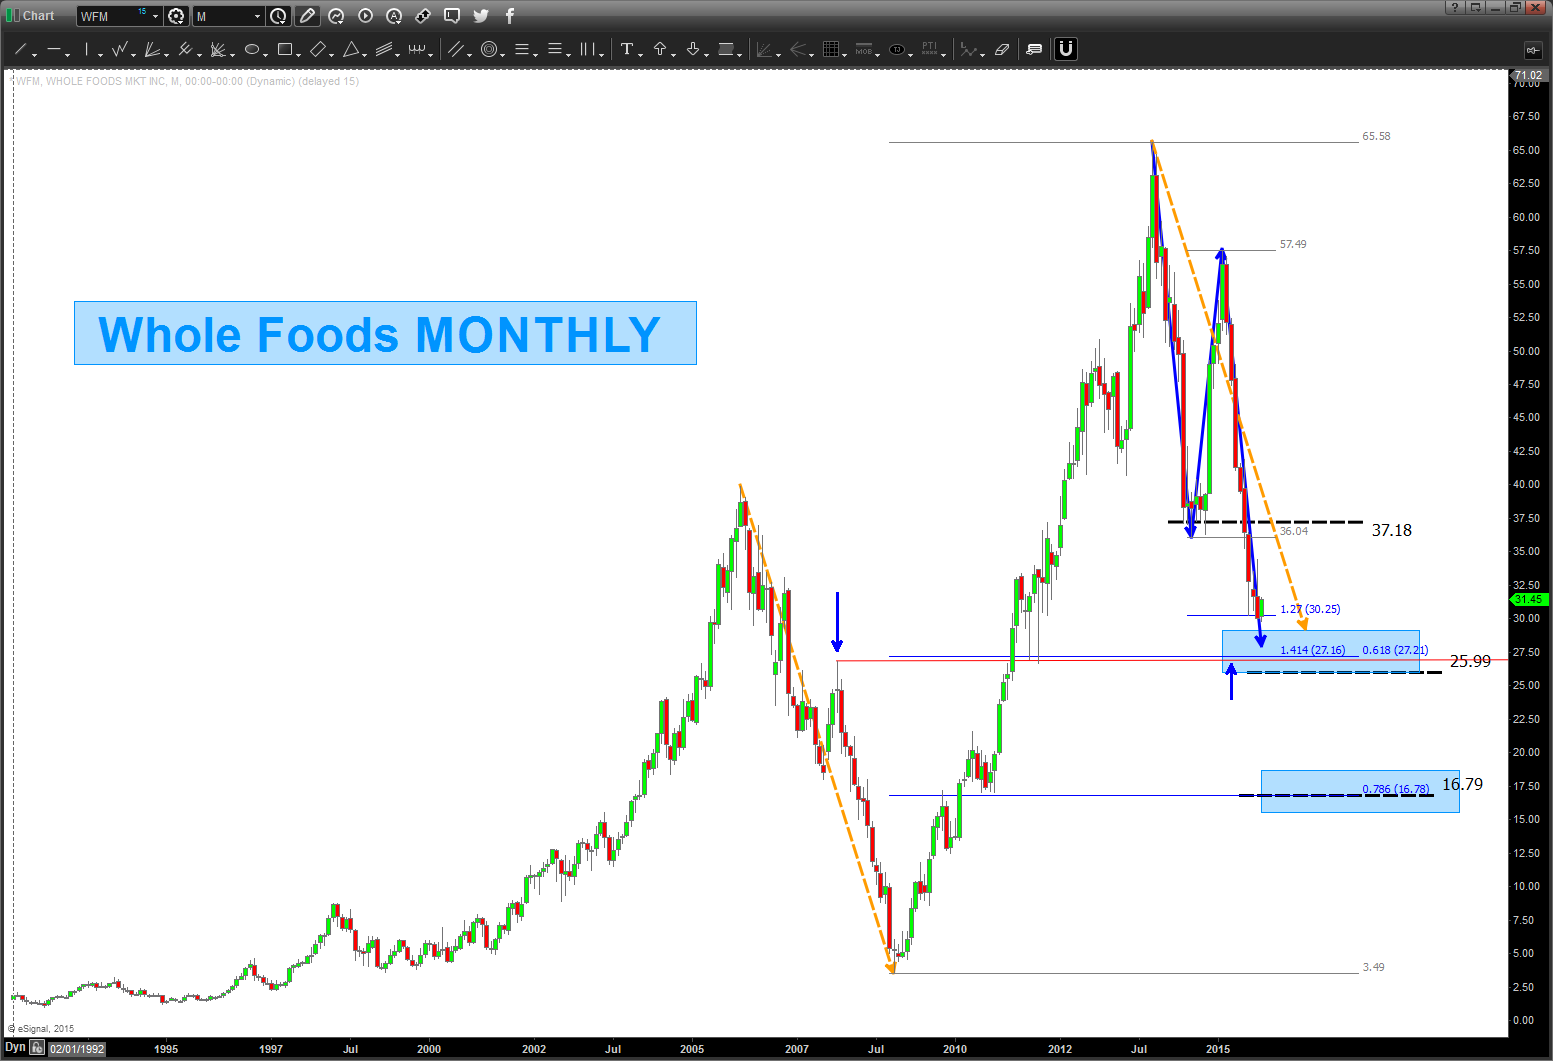
how about some math?
- (square root 65.58-2)^2 = 37.18
- (square root 65.58-4)^2 = 16.79 (right on the .786)
- (square root 65.58-3)^2 = 25.99
so, we have a LOT of thrust coming into this level but a lot of math is coming into play in/around 26-27.
thanks JC!
Bart
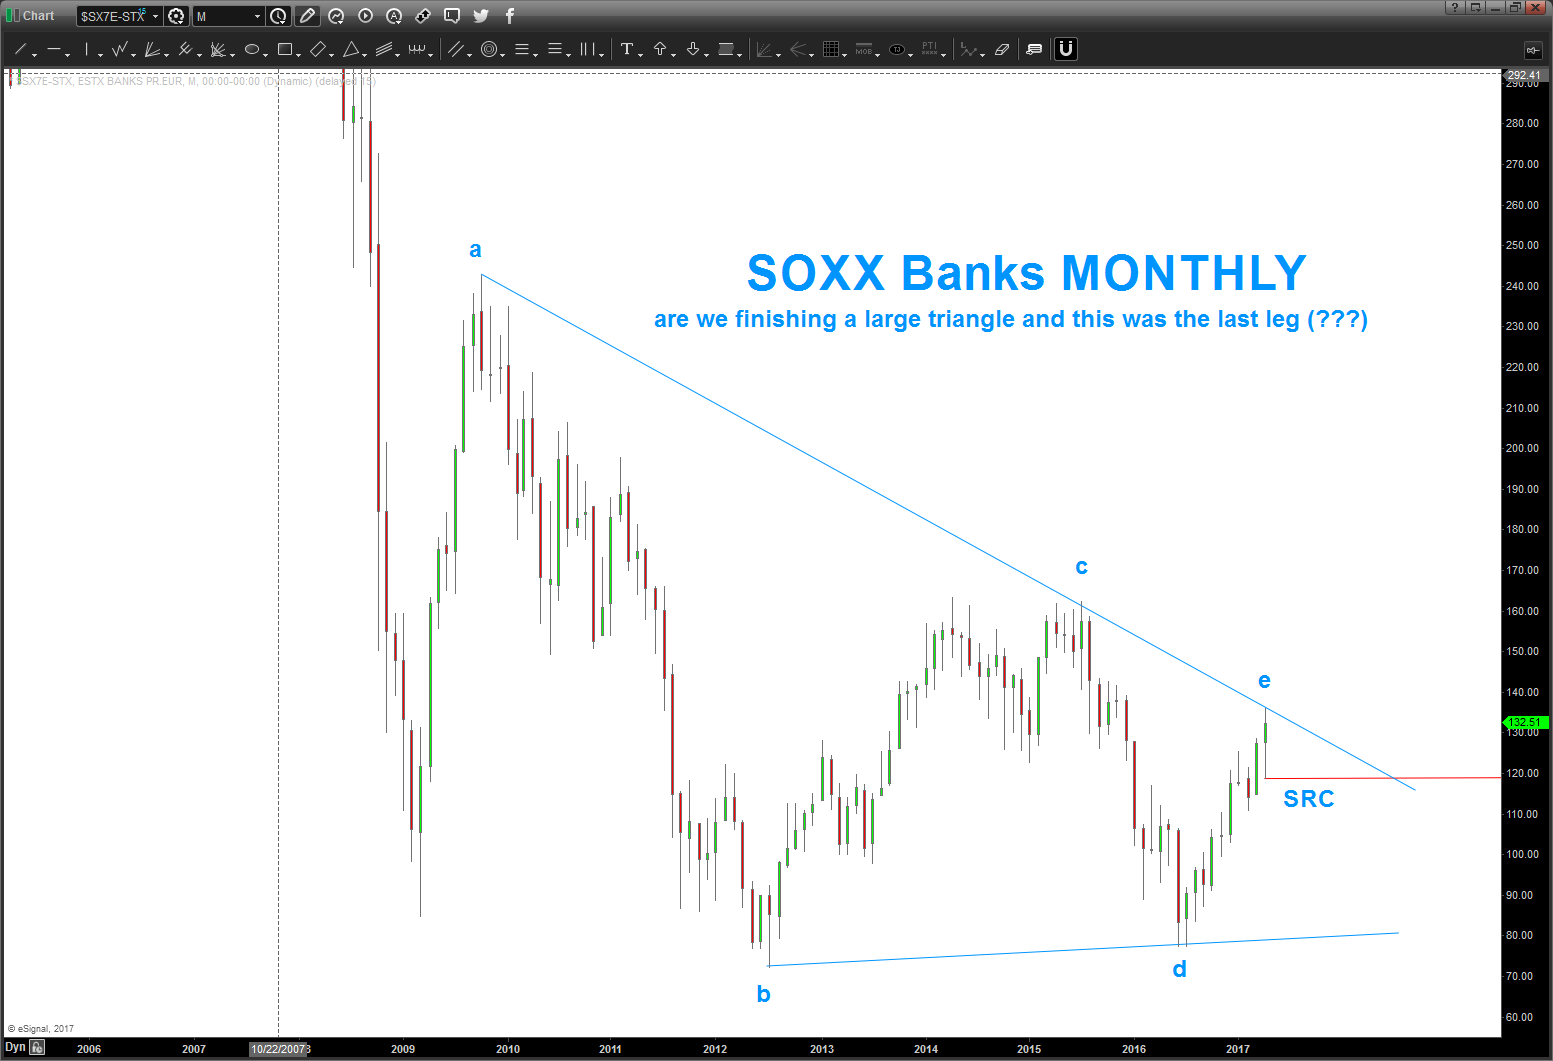
STOXX Banks for a friend overseas …
Posted on April 29, 2017 3 Comments
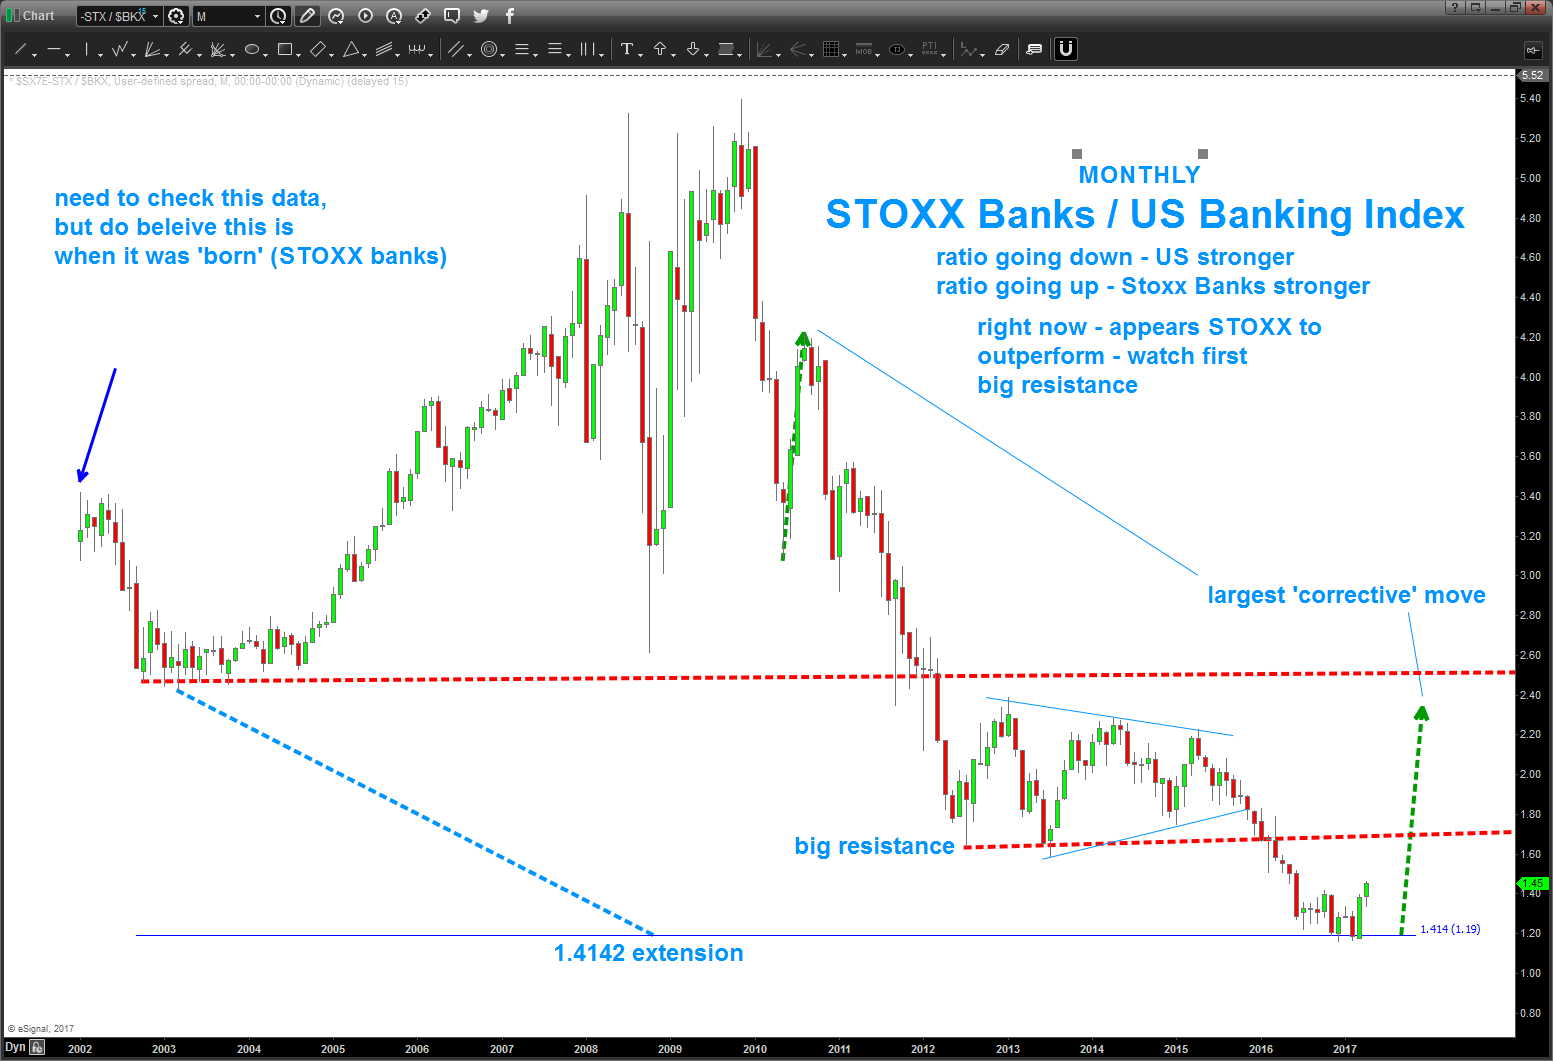
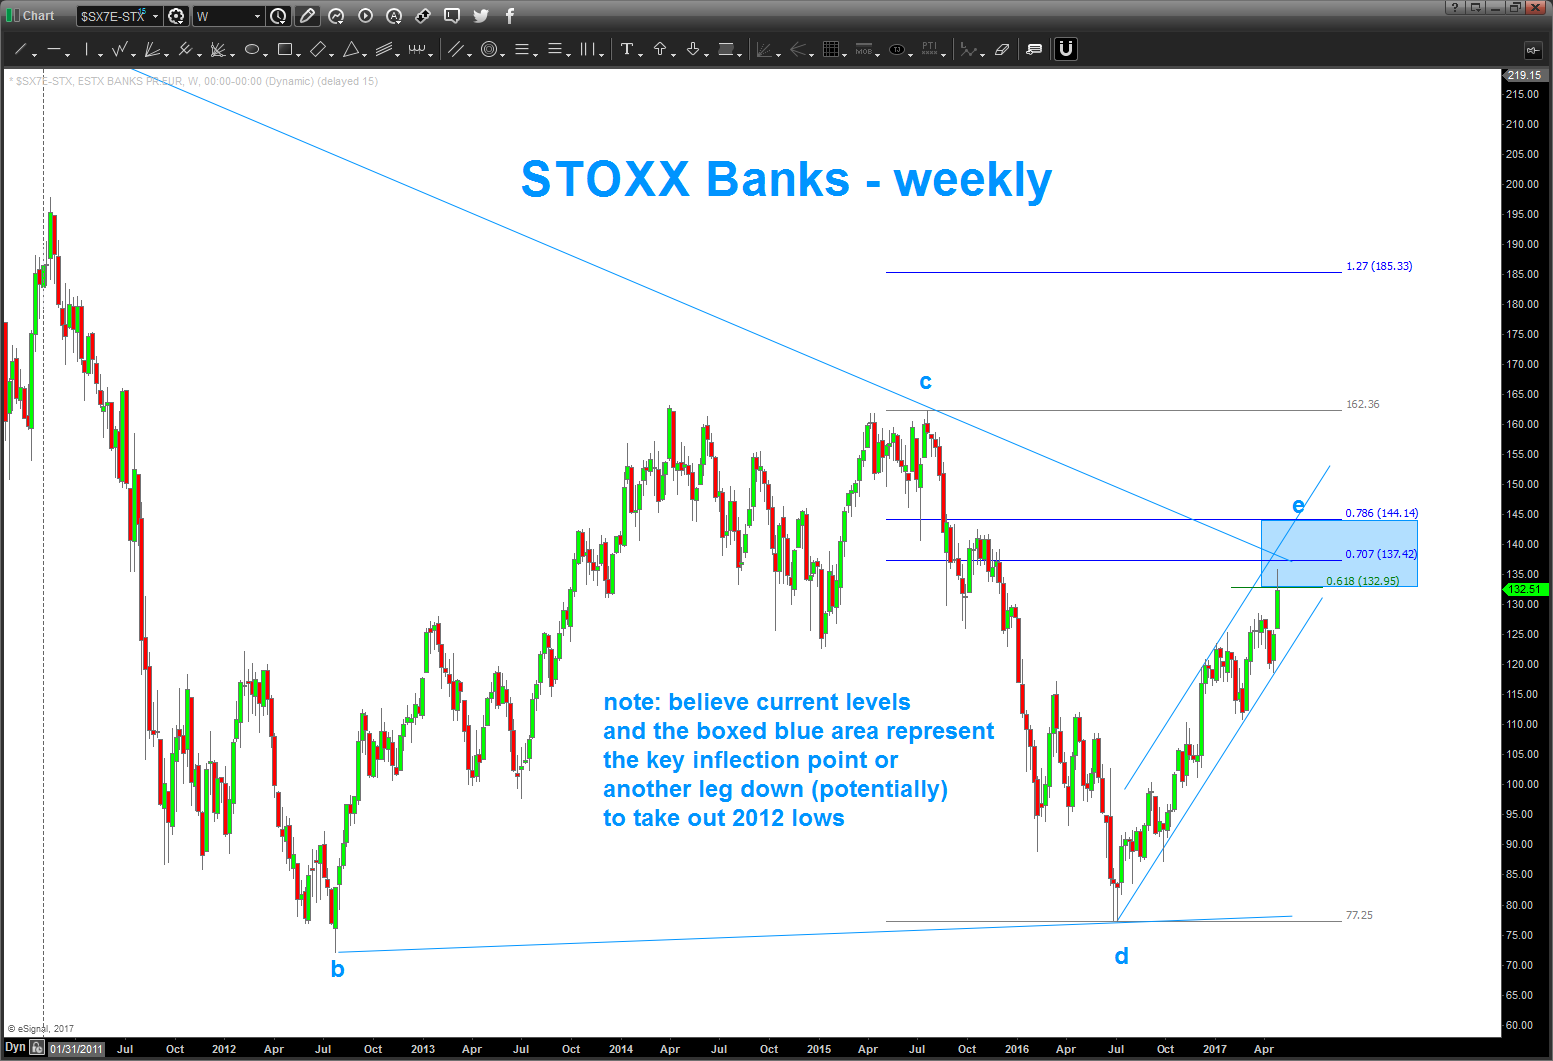
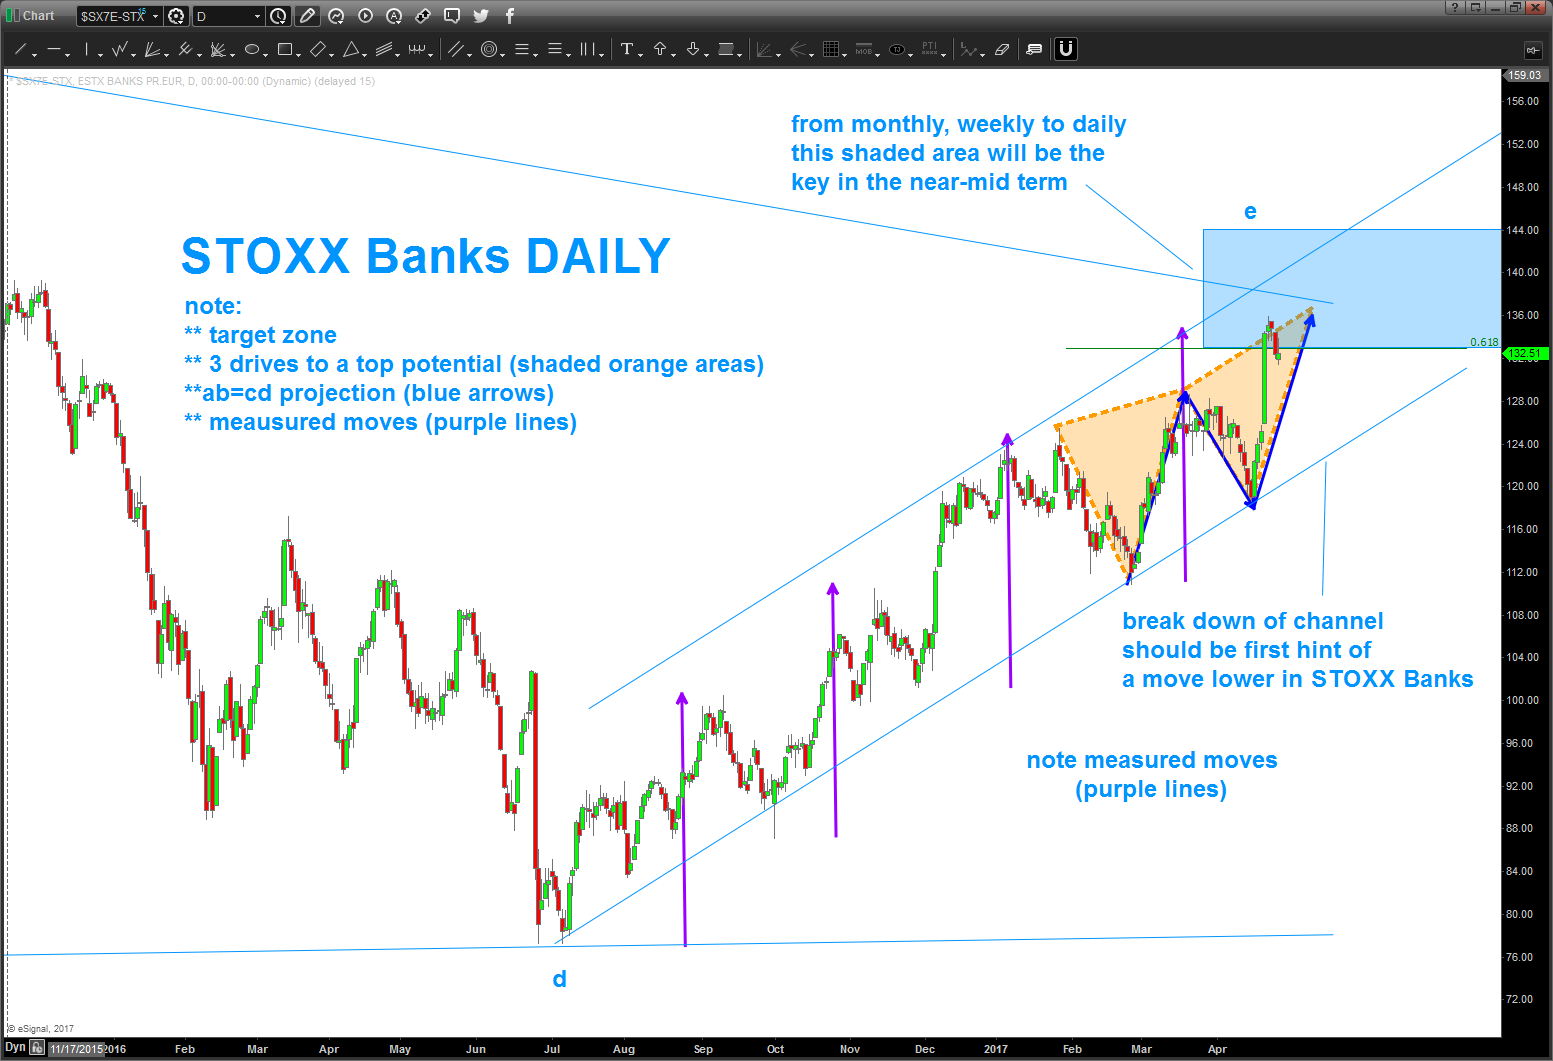
the KEY here is are we finishing a triangle and this latest leg up represents the final sequence (e) of a,b,c,d,e … the relationship that is giving me a ‘hint’ that this might be the case is the fact that the e is representing .618 of b-c (a common relationship in triangles) on the charts, that is the green line w/ .618 to the right of the green line.
also the ratio of SOXX banks / US Banks is presented. just because a sector might outperform on a relative strength basis does not mean it will go UP because it’s outperforming. in this case, it could mean it goes down slower … or, this move up is complete and US banks to outperform. however, because of the long term downtrend in STRENGTH of STOXX vs US Banks would monitor this closely. A continued increase and movement in STOXX vs US Banks ALONG with a consolidation or a breakout of the blue shaded box shown on STOXX Banks charts could mean important and noteable strength has developed. Monitor the ratio for clues ..
Hope this helps and thanks for asking and visiting the site .. let me know if you have any questions.
Bart
the march to 6200 continues … an important UPDATE 04/28/2017 @seeitmarket
Posted on April 28, 2017 2 Comments
04/28/2017 – an update w/ the gang @seeitmarket
_________________________________________________________________
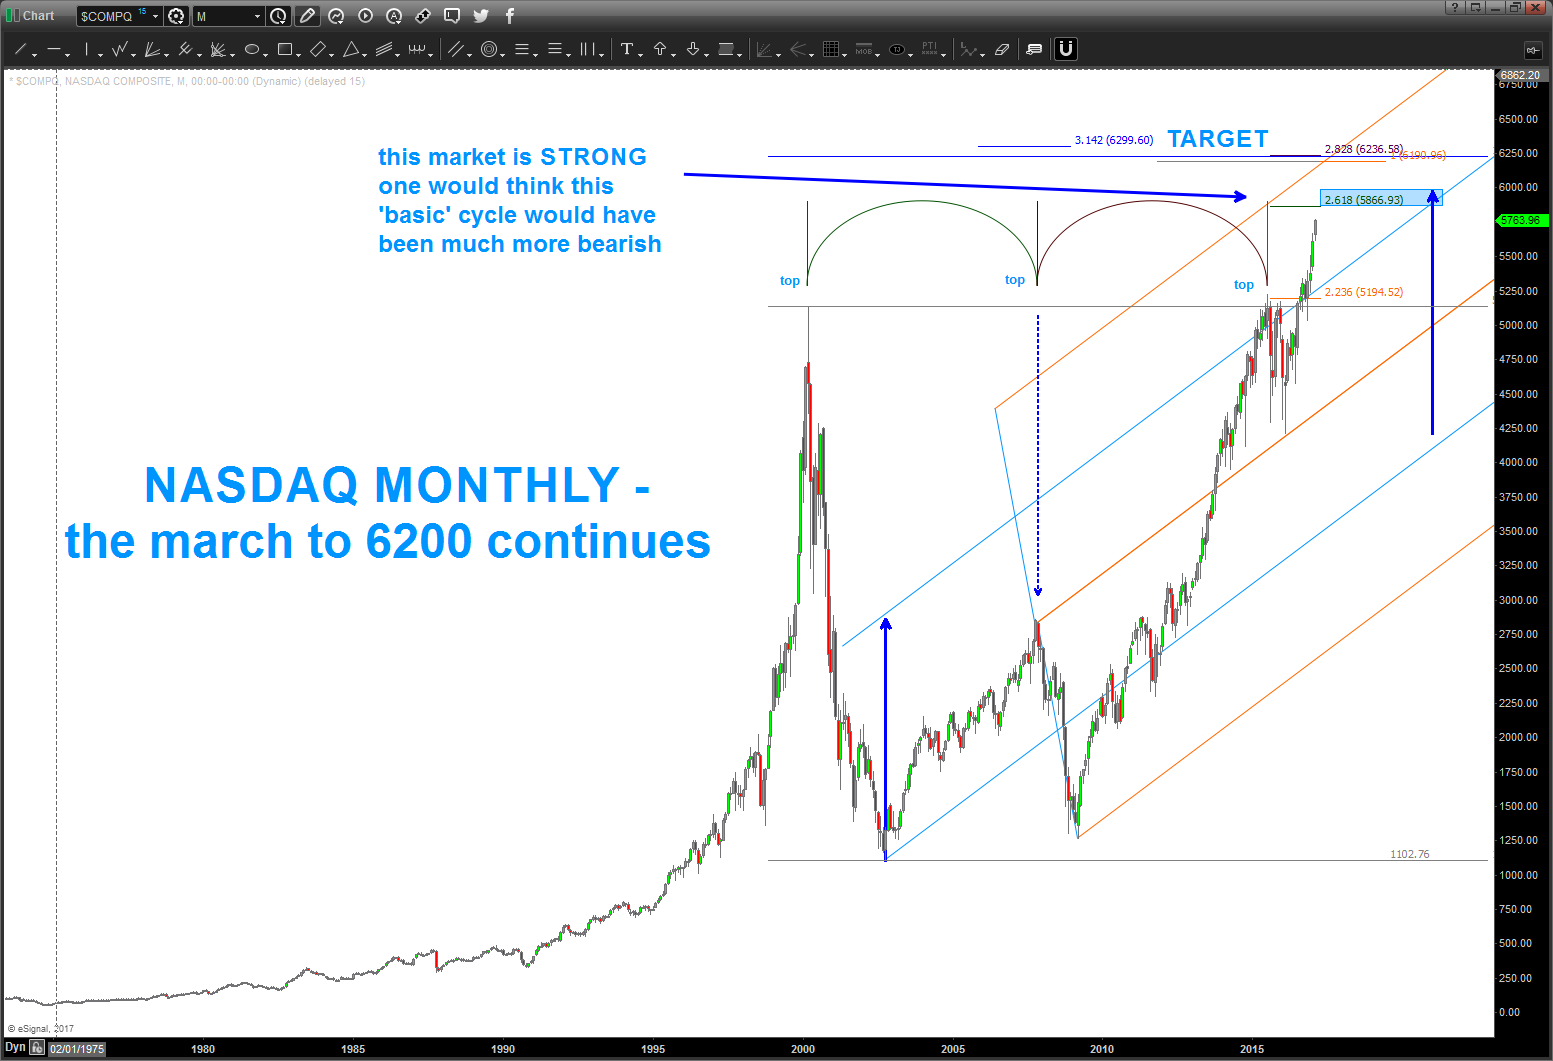
03/21/2017 – update
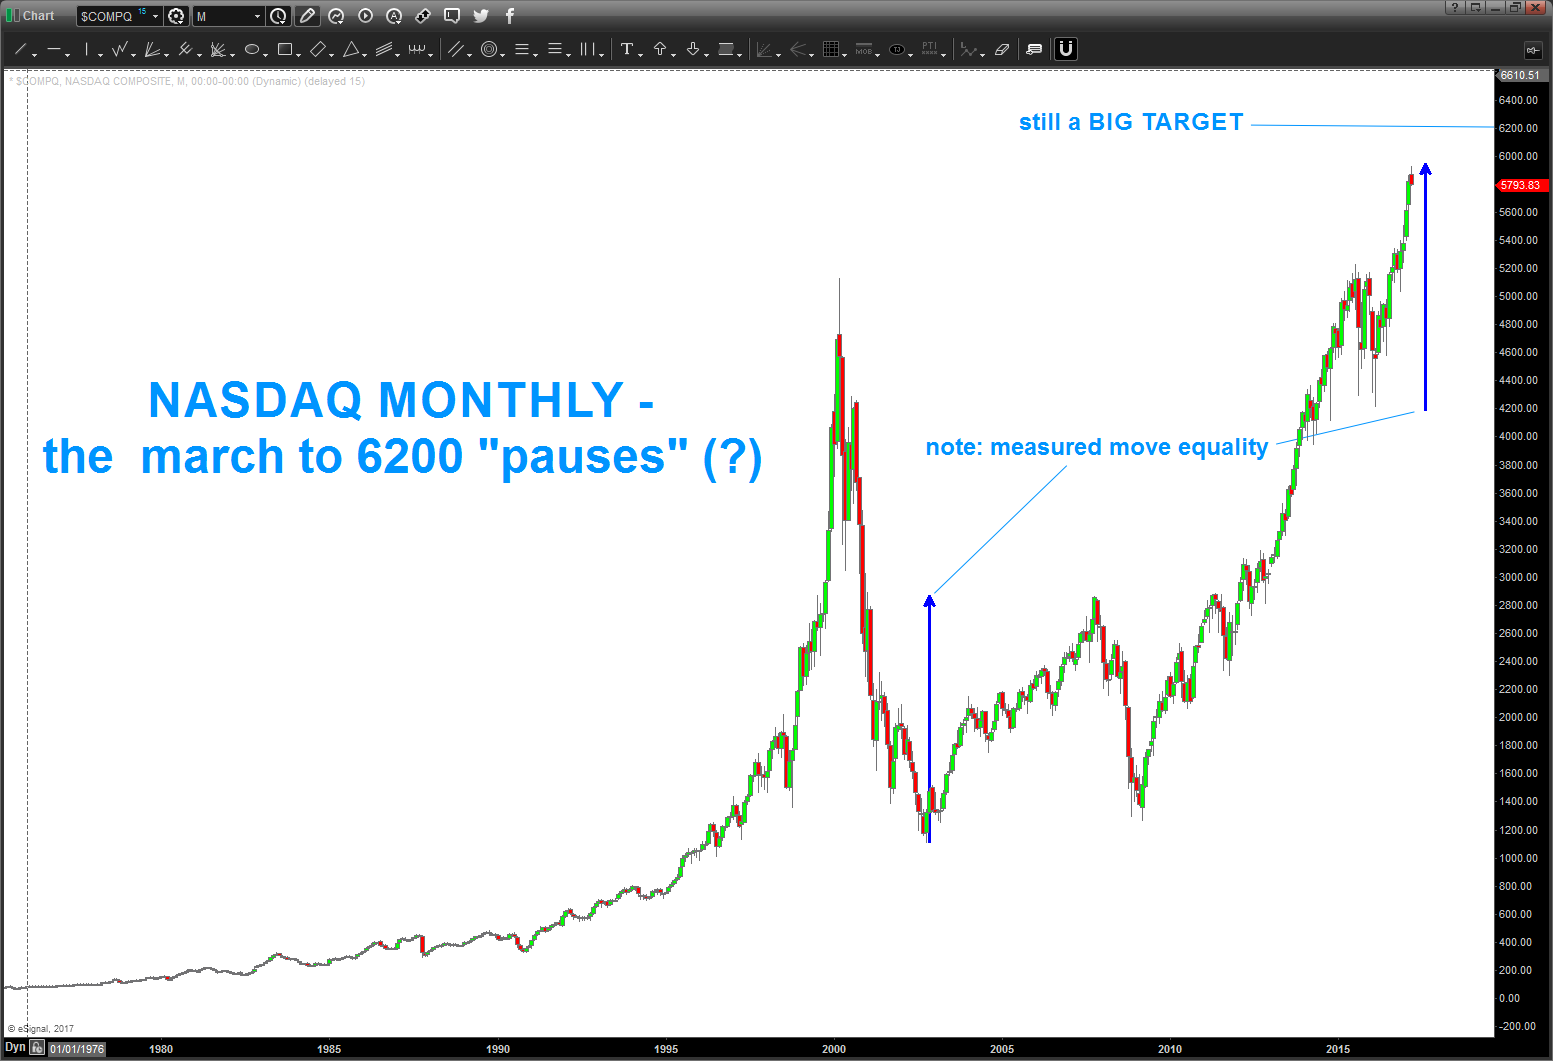
if you look at the chart below … you’ll see the blue arrow measured move from the 2002-2007 hit pretty much spot on ….
I add this to the “march” to 6200 because, well, I still think that is the target.
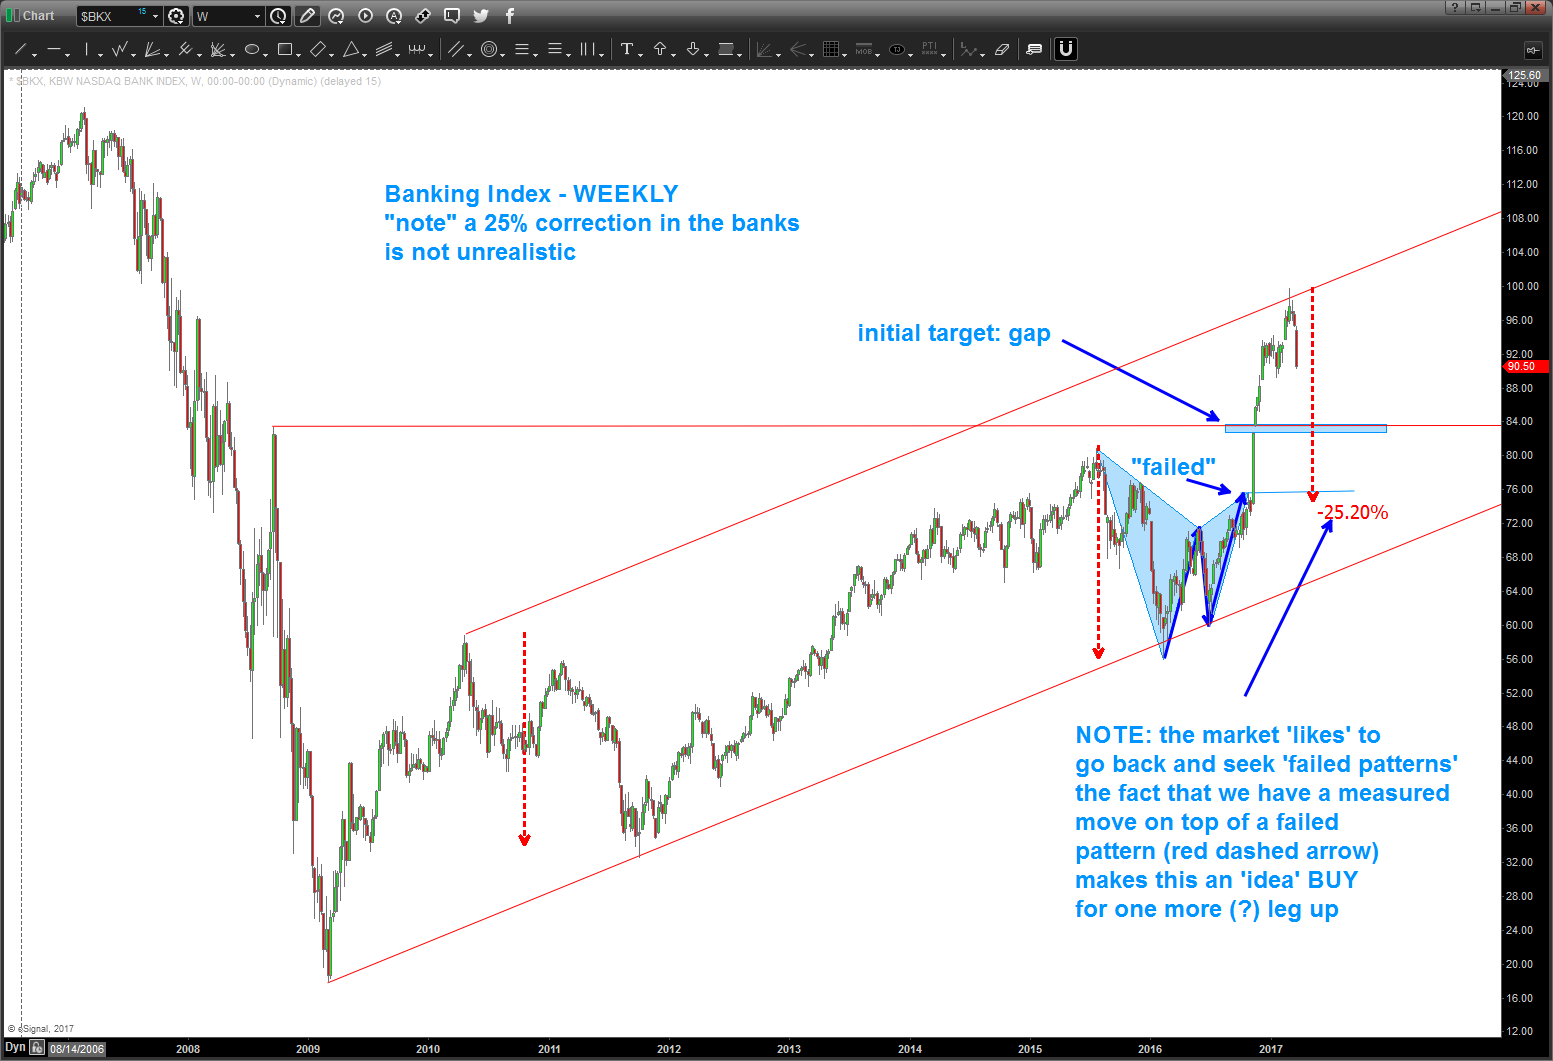
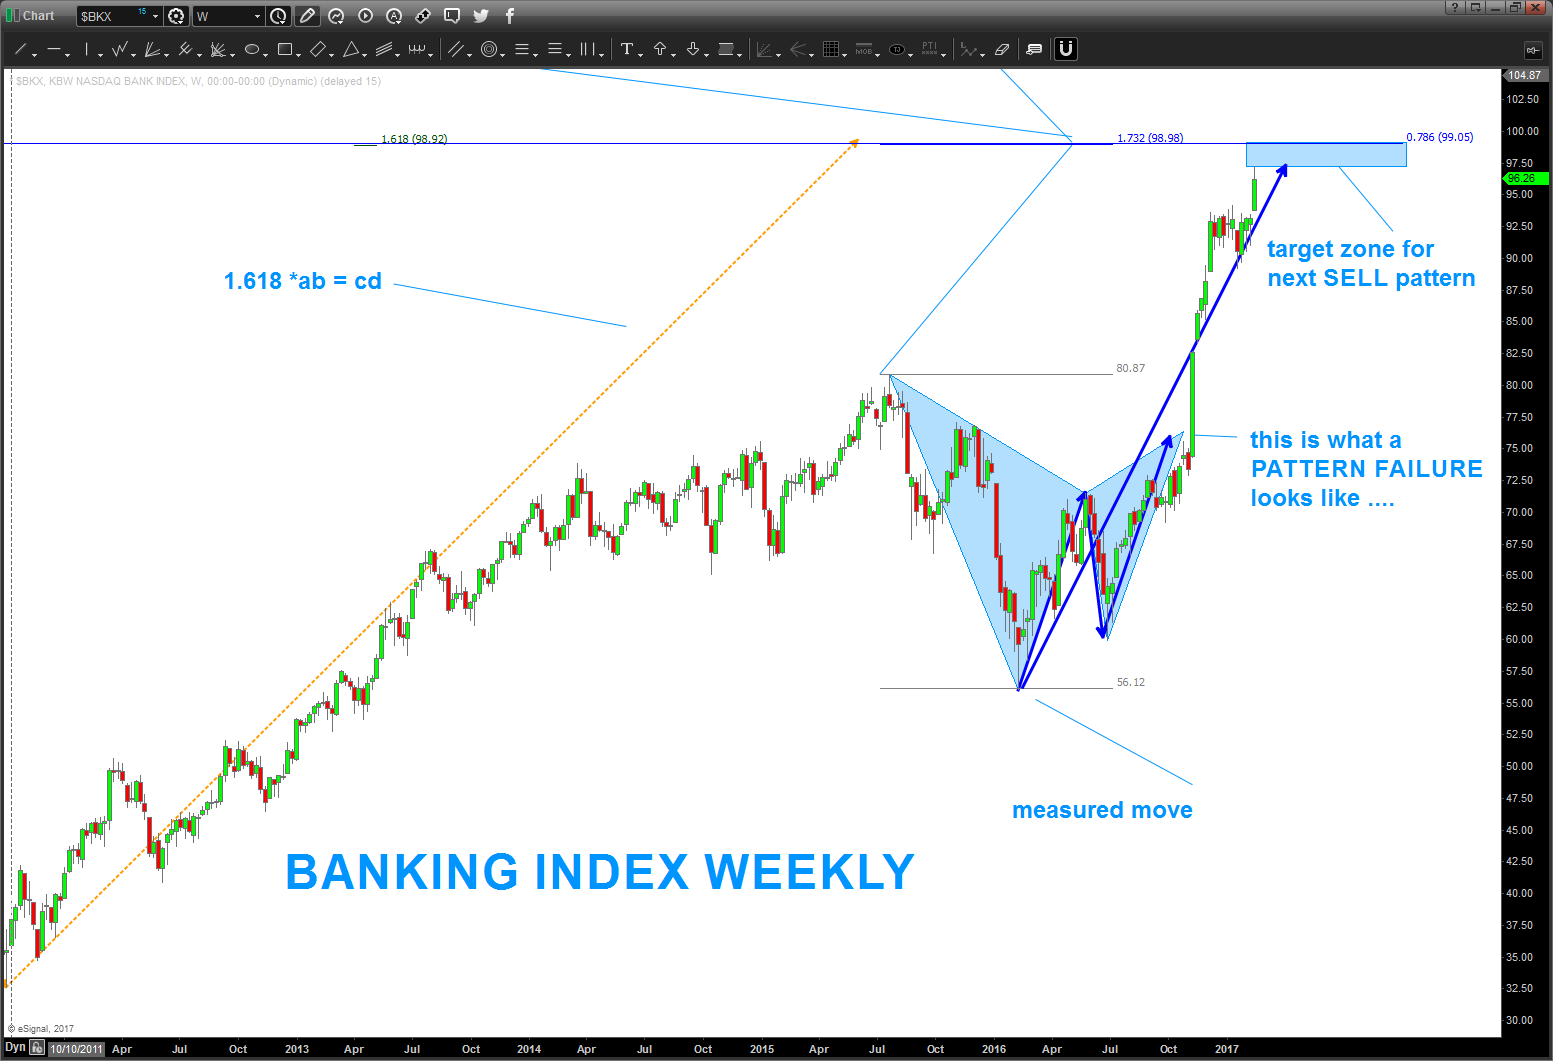
as for my followers – YOU know that I hate to give you the ‘could have’ and ‘would have’ and ‘should have’ w/ technical analysis …I have been pretty busy over the past month. So, I hastily sent this to a few friends around the banking index in a moment of free time….. the reason I’m showing this is two fold:
- PATTERNS are all PROBABILITY ….
- the BANKS lead us UP and they lead us down …
- I really really don’t want to show anyone the world of ‘could of’ and ‘would of’ and ‘should of’ … but do want to give some heads up ..
- just trying to help folks …
The “greatest gift is gold ” U2 ….
Use a stop.
Good night …
B
________________________________________________________
perhaps 5866 stops it but folks .. we have a perfect sell PATTERN at/around 6200 ish.
also, note the to cycle that got DESTROYED .. this puppy has some more juice.
short term – 3-5 pullback for a couple months then higher to tag the upper target?
anyway – here’s the picture … UP UP and AWAY.
just buy, the market will NEVER GO DOWN and IT ALWAYS GOES UP! 🙂
French Election CAC 40 and EWQ
Posted on April 22, 2017 4 Comments
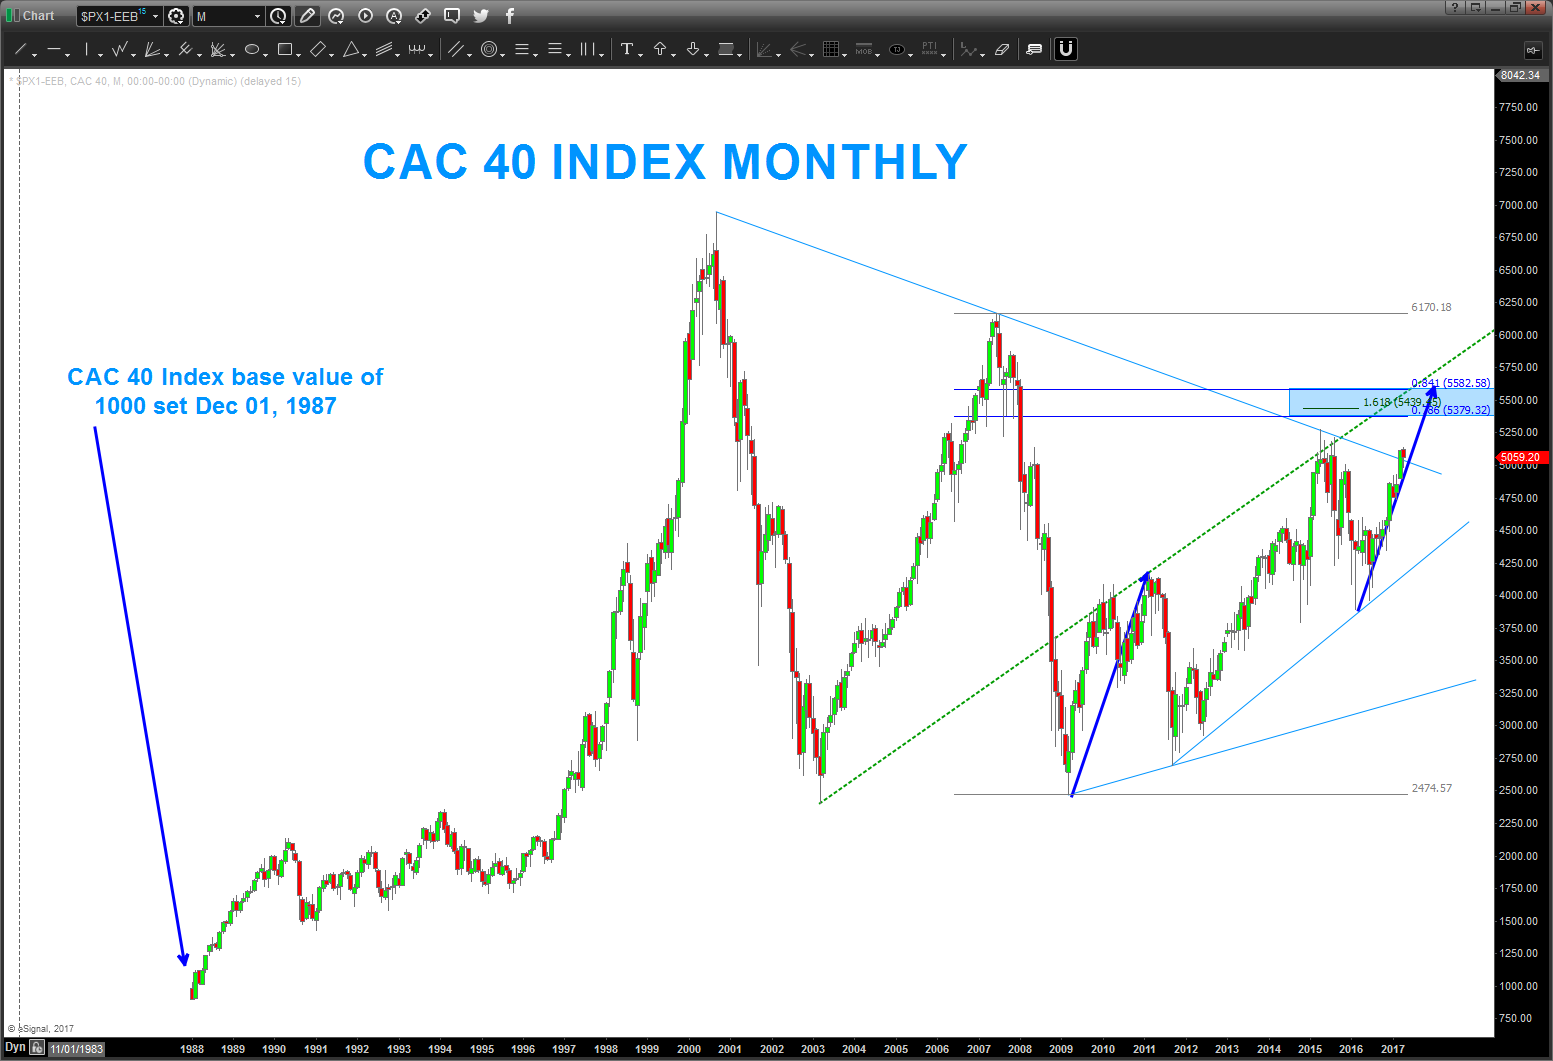
So, big election this weekend .. ZERO IDEA which way it will go or fall. However, the blue rectangle is the targets for resistance … it’s been coiling since 2000 in a monstrous triangle. A weekly close above 5582 will send this puppy higher …or smack into zone shown and fall after election?
believe these are the levels on the CAC 40 are key.
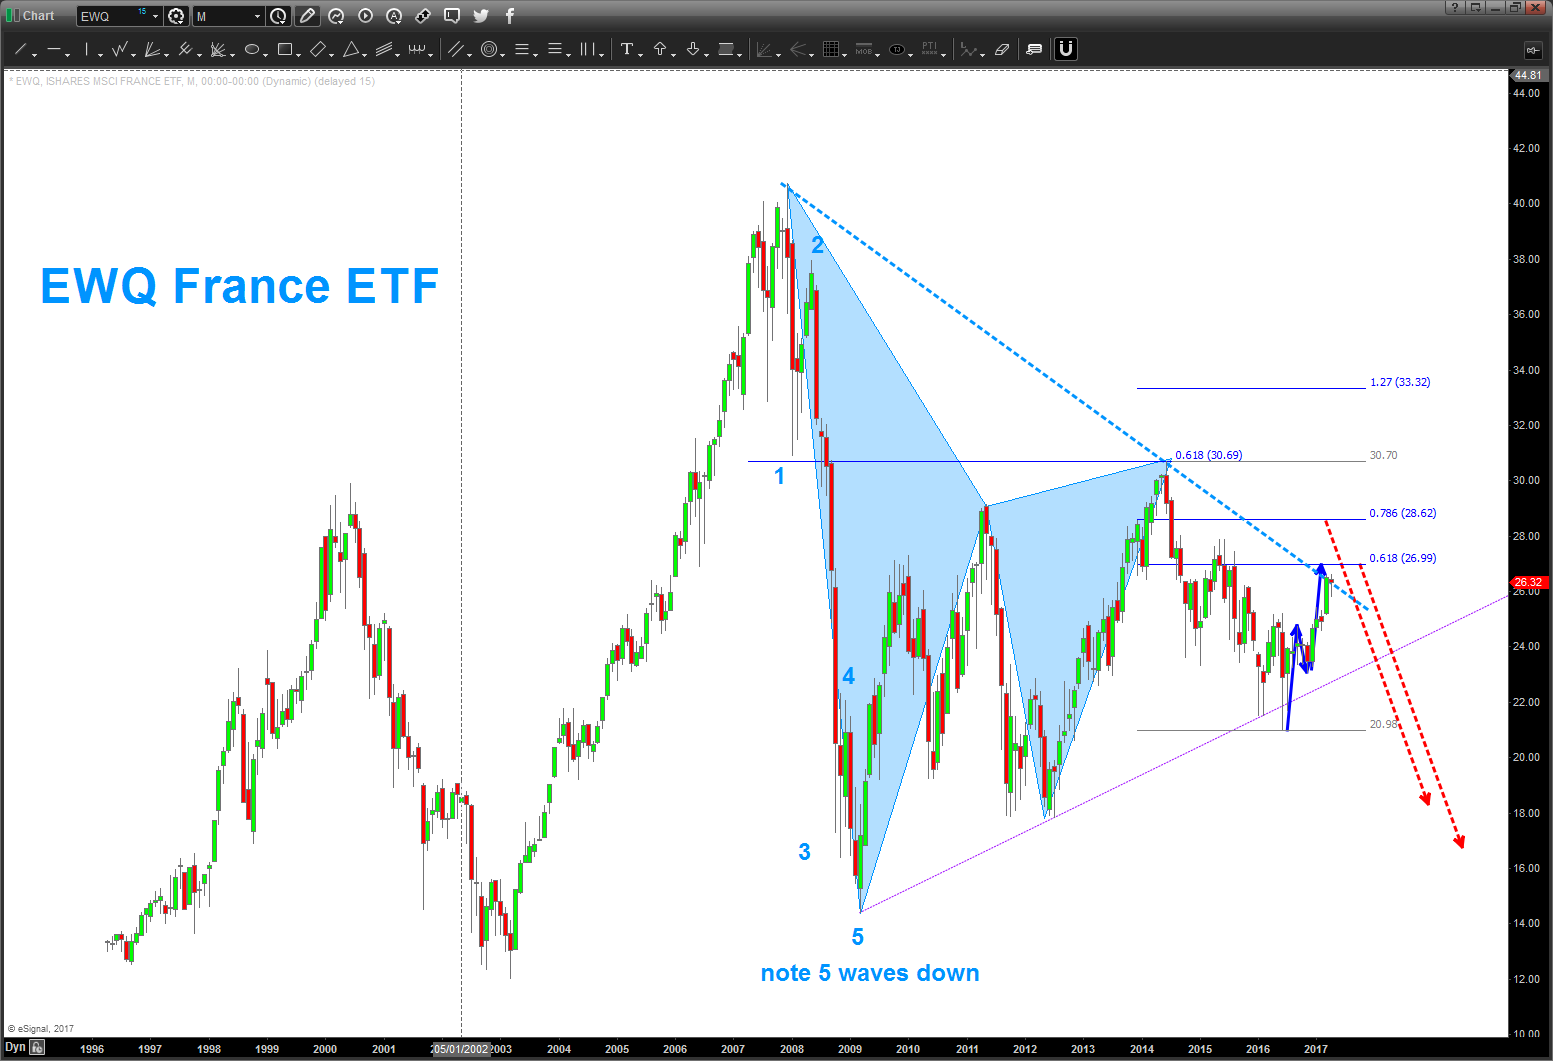
if we look at the EWQ ETF we can see a little bit more clearer picture:
- note the 5 waves down into the low of 2009. usually (the operative word) that signifies a corrective set back and then a resumption of the trend that is causing the 5 waves
- the blue triangles are showing the sell pattern on the EWQ that hit right at the .618 retracement from the high
- the dashed blue line is a basic trend line connecting the lower highs .. acting as R right now
- at the 26.99 level we are completing another sell pattern …
- so, net net, the EWQ PATTERNS are showing lower
no doubt, it will be a crazy night on Sunday .. enjoy the ride.
$NFLX another short swing at the bat? Perhaps? UPDATED 4/22/2017
Posted on April 22, 2017 Leave a Comment
04/22/2017 – trade what you see, not what you believe. NFLX has been “topping” since January 2017. shown below are the key gap areas and the looming trend line …but folks, it hasn’t moved lower. unless we get a weekly close below 133 – step aside. the ‘math’ stopped it but it sure seems strong to me, for now …

2/14/2017
- basically hit the target zone we were identifying. now it gets interesting as you can see, on the daily, we have many gaps staring from this past summer. if we can break thru the 133-137 level then the gap 100-112 seems like a reasonable target for now.
our assumption is we have completed 5 big waves per the below so … could get interesting? Or, the stock will never go down, right? the market only moves up.
Bart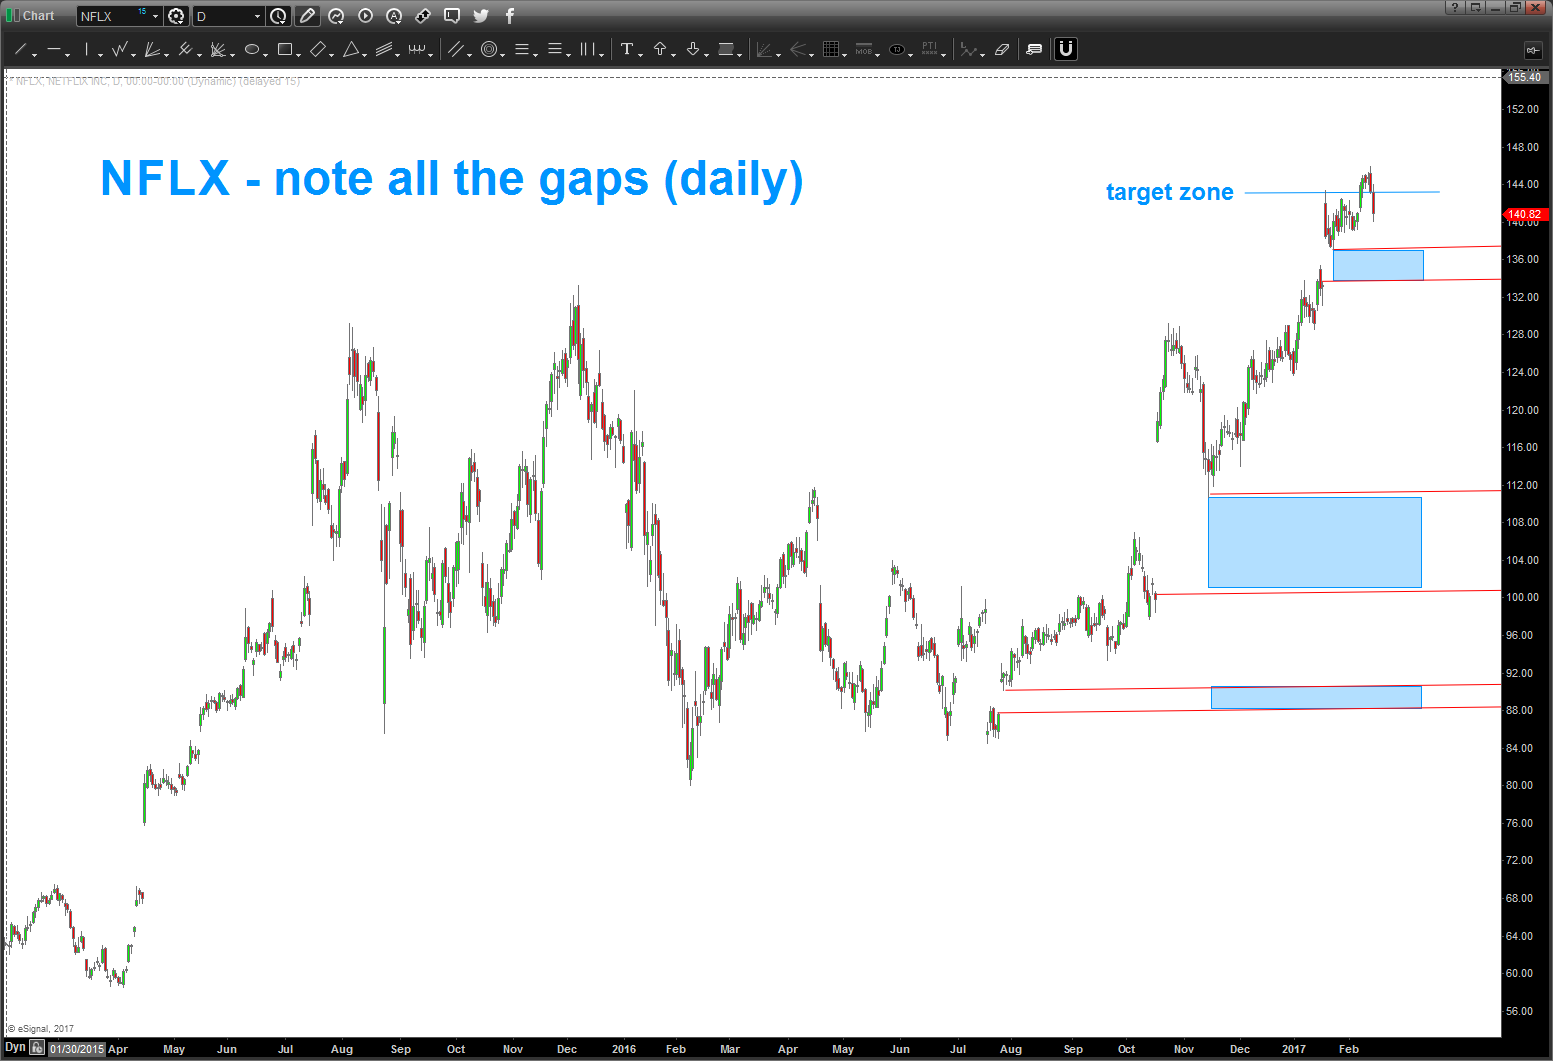
1/12/2017 – well if at first you don’t succeed, try again. doesn’t matter this its NFLX, in the world I live in, it’s just a ‘chart’ so here we are at it again …
well, the GAP from the former congestion area into new highs was powerful BUT note that we have been selling off since the gap and IF (the big if folks) we close back below the dashed orange trend line AND close the open gap (a gap down back below is ‘technically’ the island reversal THEN guess what things could get going to the downside. so use those levels noted below as your guide.
some key stuff:
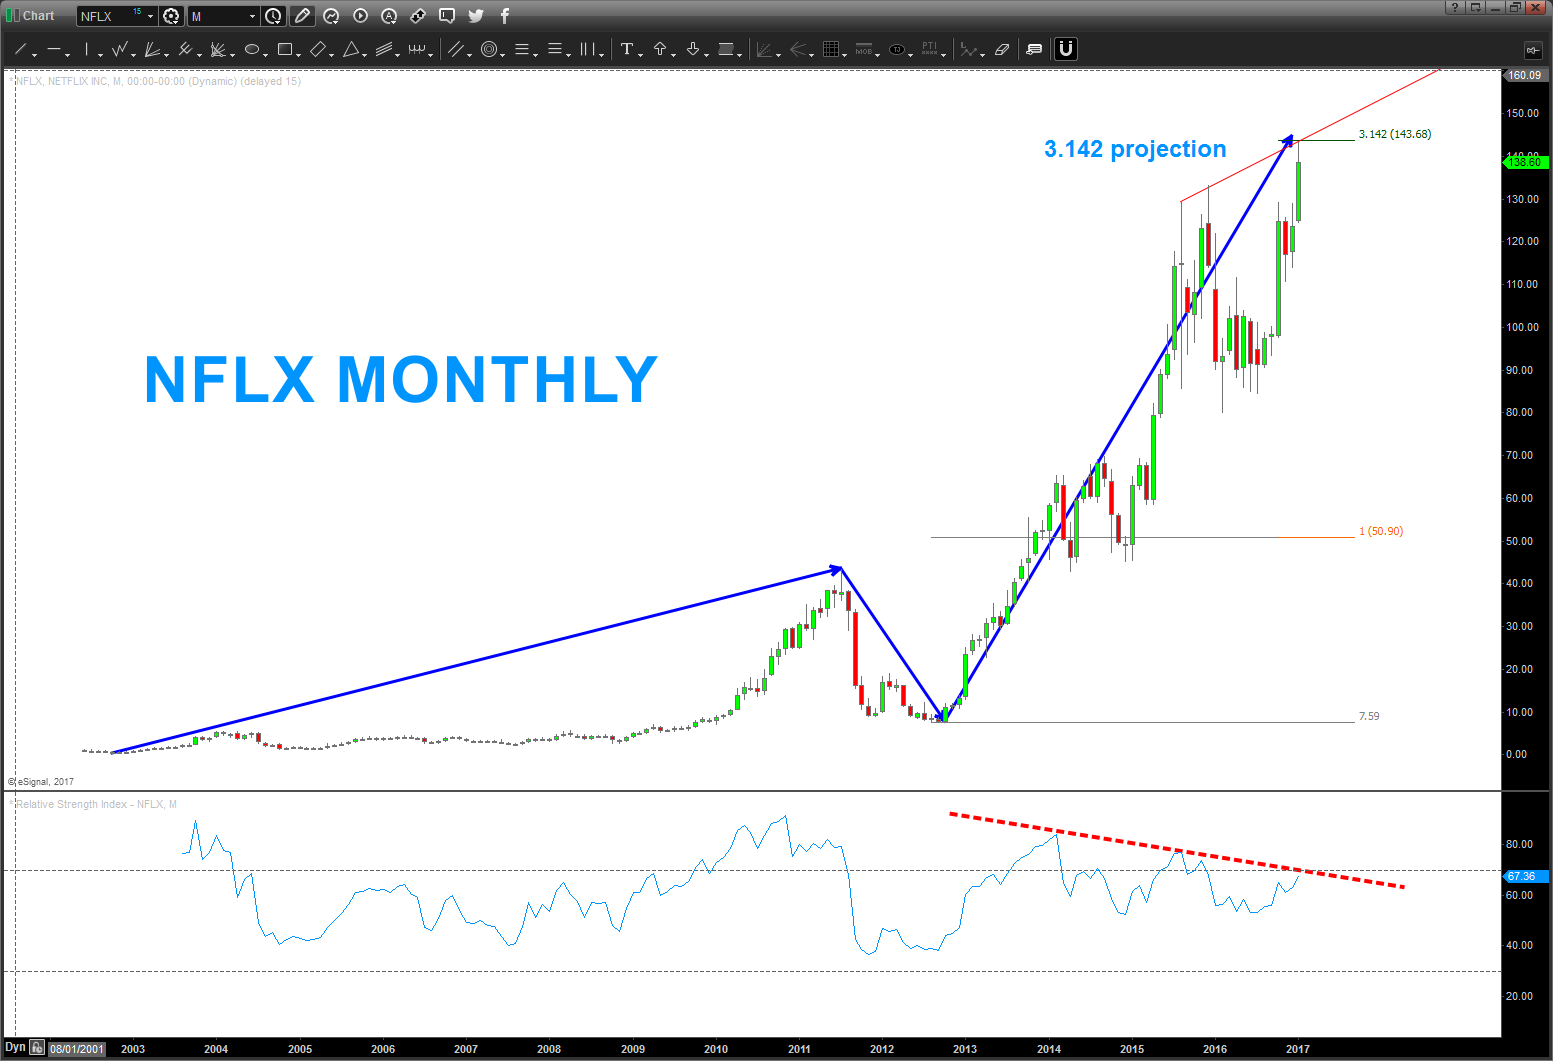
- note the monthly
- that’s some pretty large bearish divergence
- also note, from the first move up way back when it ‘perfectly’ hit the 3.142 (PI) projection
- also note the top trend line … a daily close above that is VERY bullish but right now, banged right into it as resistance
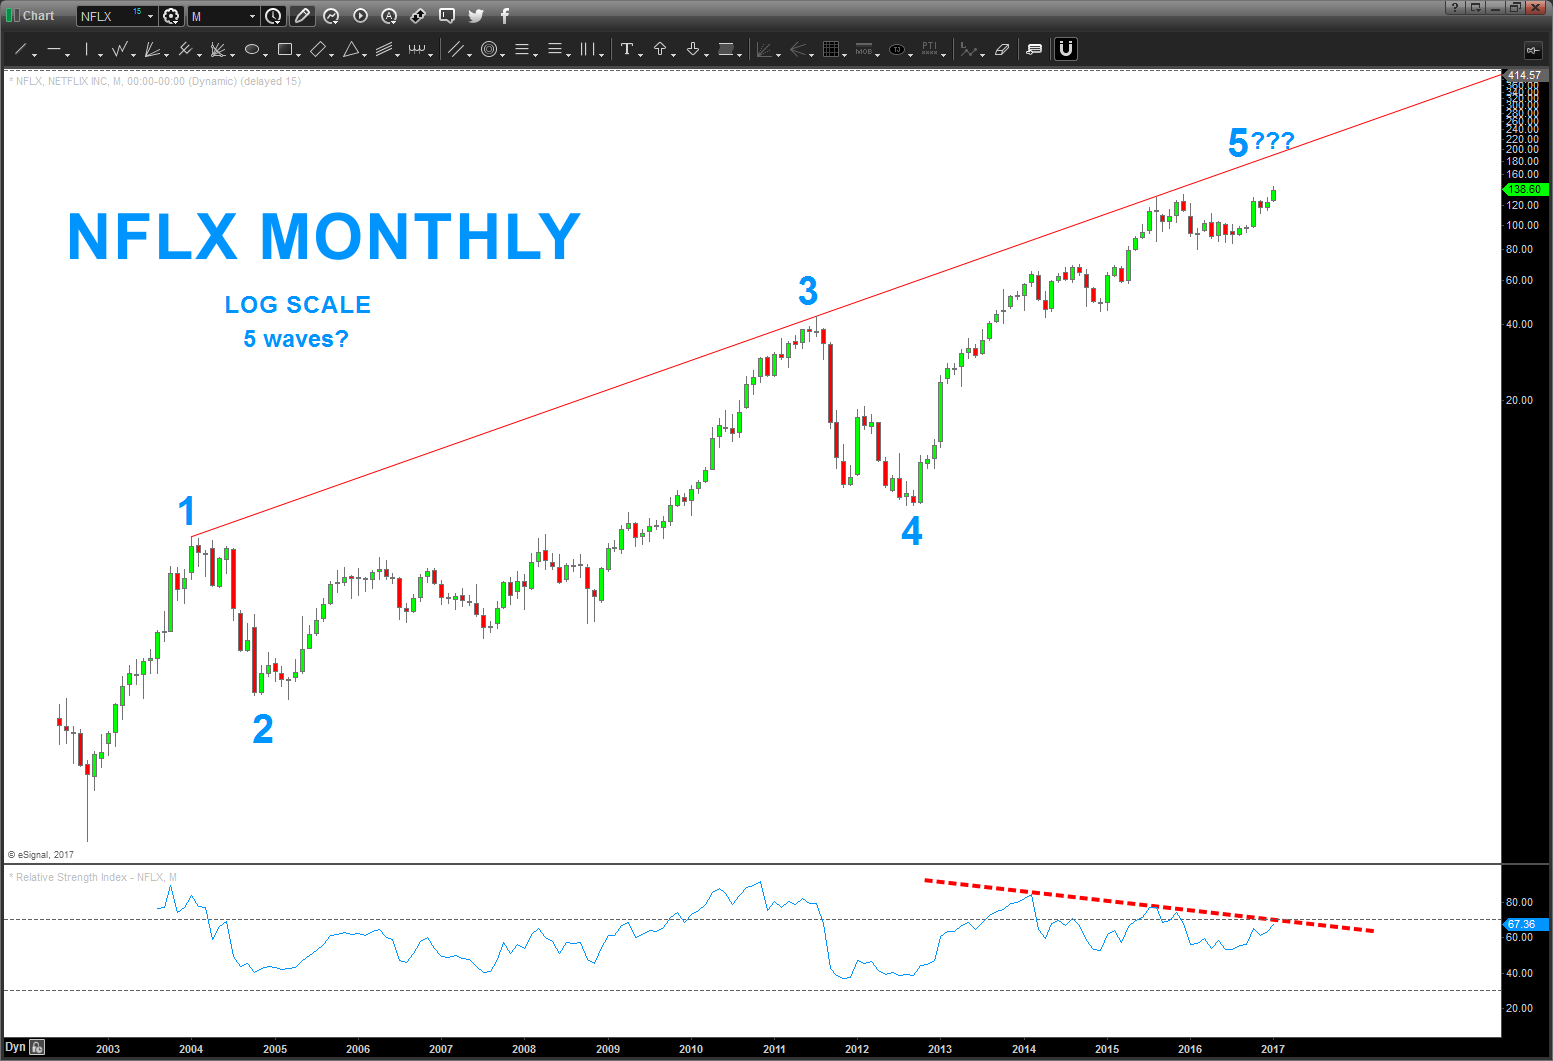
- note the monthly ‘log’ chart
- the top trend line held price at bay (that caused the consolidation IMHO) but if we keep going that top trend line would be the next logical target
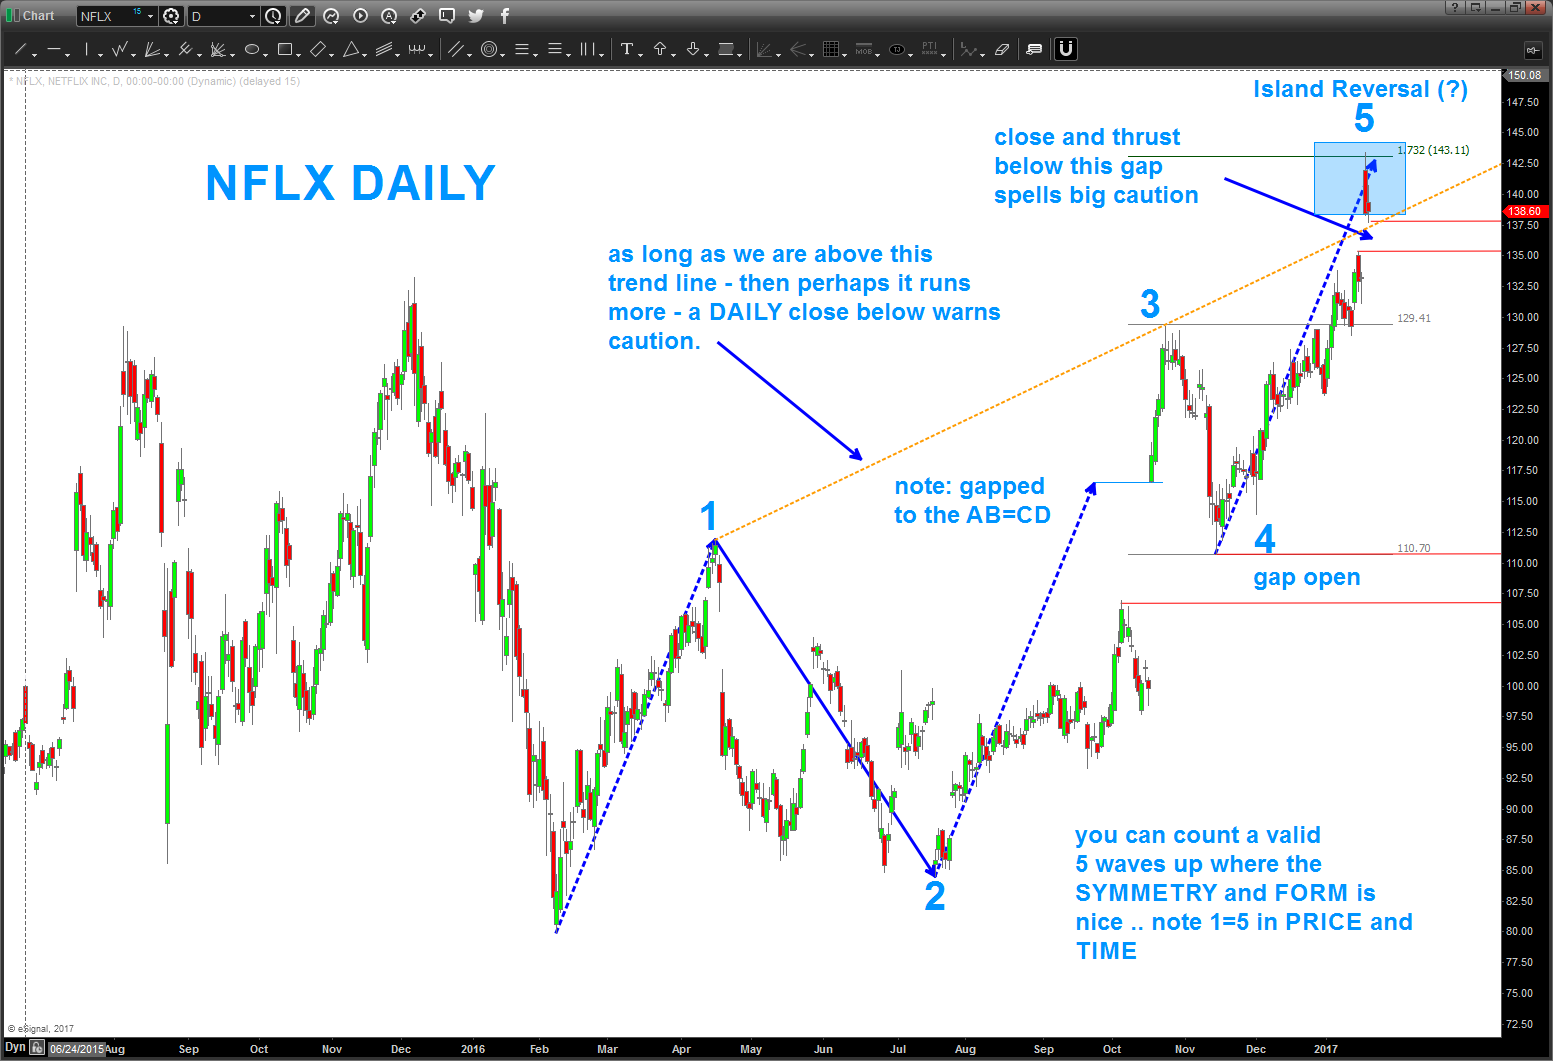
- note the daily
- see the orange dotted trendline … that’s the one to really watch for now
- I REALLY like that wave 1 up and wave 5 up are equal in PRICE and TIME
- note how wave 3 gapped rigth up to the AB=CD where wave 1=3 and then ran ….
- REALLY pay attention to the gap that was left a couple days ago – that’s the one which, if gapped down below will cause the island reversal
perhaps NFLX will kick my butt again … we’ll see.
cheers!
B
if you look thru or have been reading my blog you’ll realize that the patterns do fail .. invariably when this occurs I’ll go back to the drawing board and come up w/ another PATTERN. check out WYNN … you never know what’s going to happen and the PATTERNS do fail. manage the risk …
$NFLX has beaten me – alot. Uncle ….
https://bartscharts.com//?s=NFLX
that being said, I hit erase all on $NFLX chart and took a fresh look at it … I still see 5 waves up w/ no RULES broken so the count is valid and there’s monthly bearish divergence and we are about to tag the upper long term trend line that is roughly 10 years old. I still say be careful up here but .. again … UNCLE.
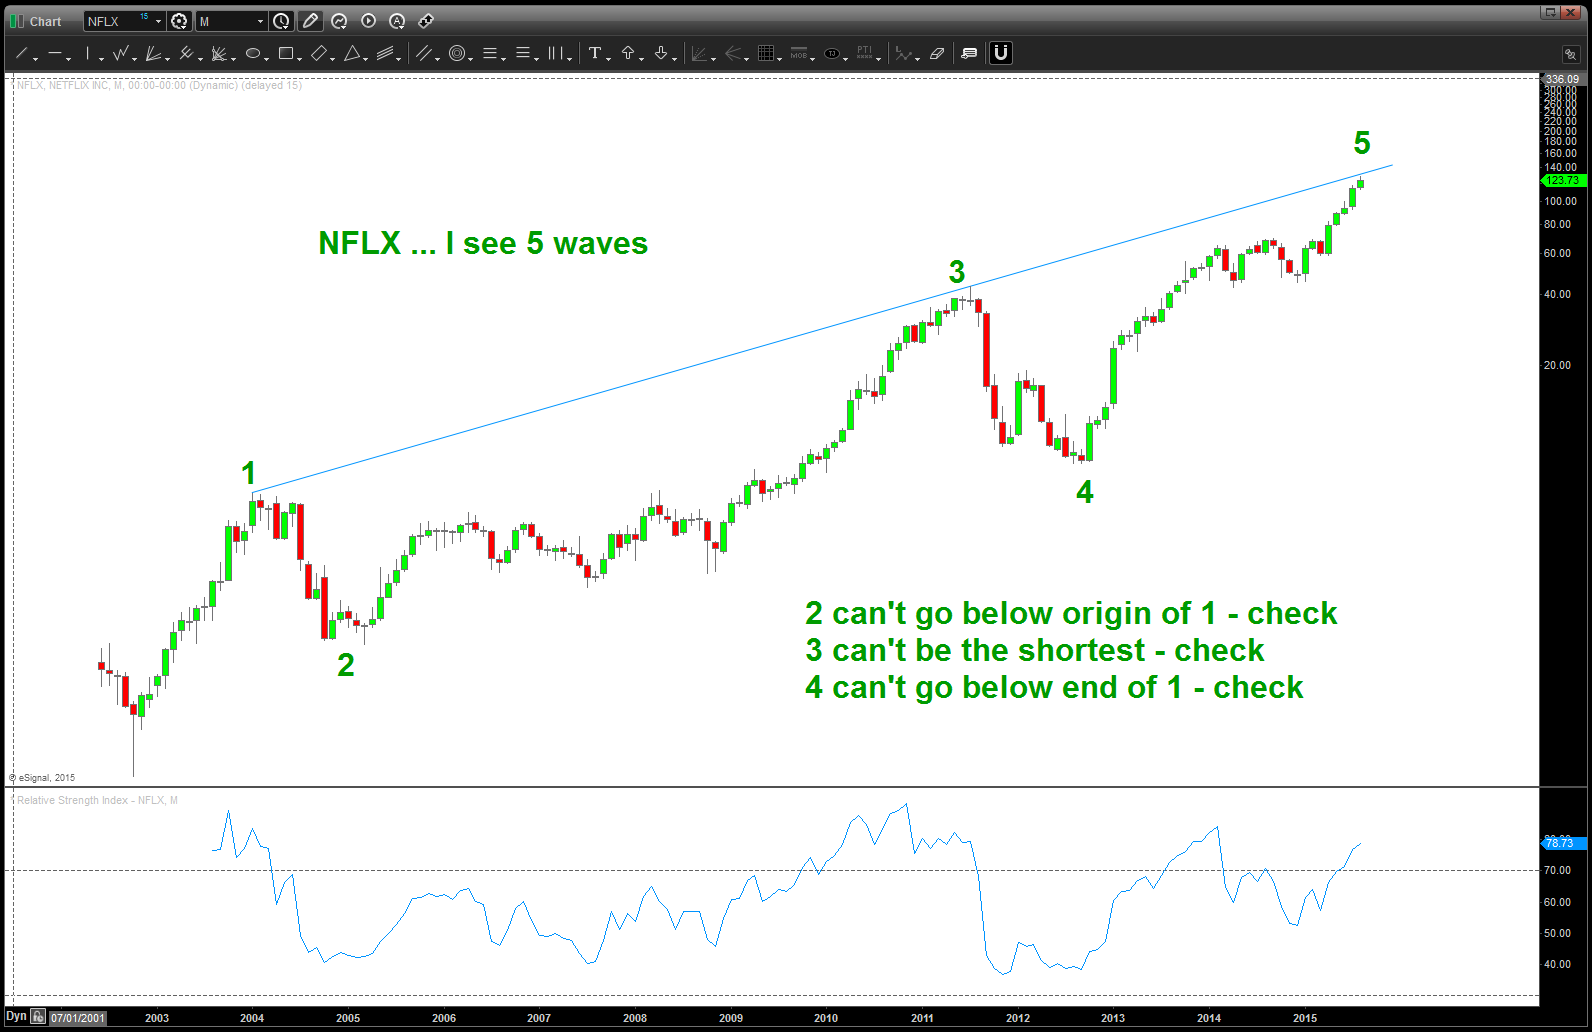
NFLX Monthly
but what’s the next pattern or set of target areas? No flipping idea …nope, not going to do it.
“f’it dude, let’s go bowling”

Super Size Me … $MCD update …
Posted on April 22, 2017 Leave a Comment
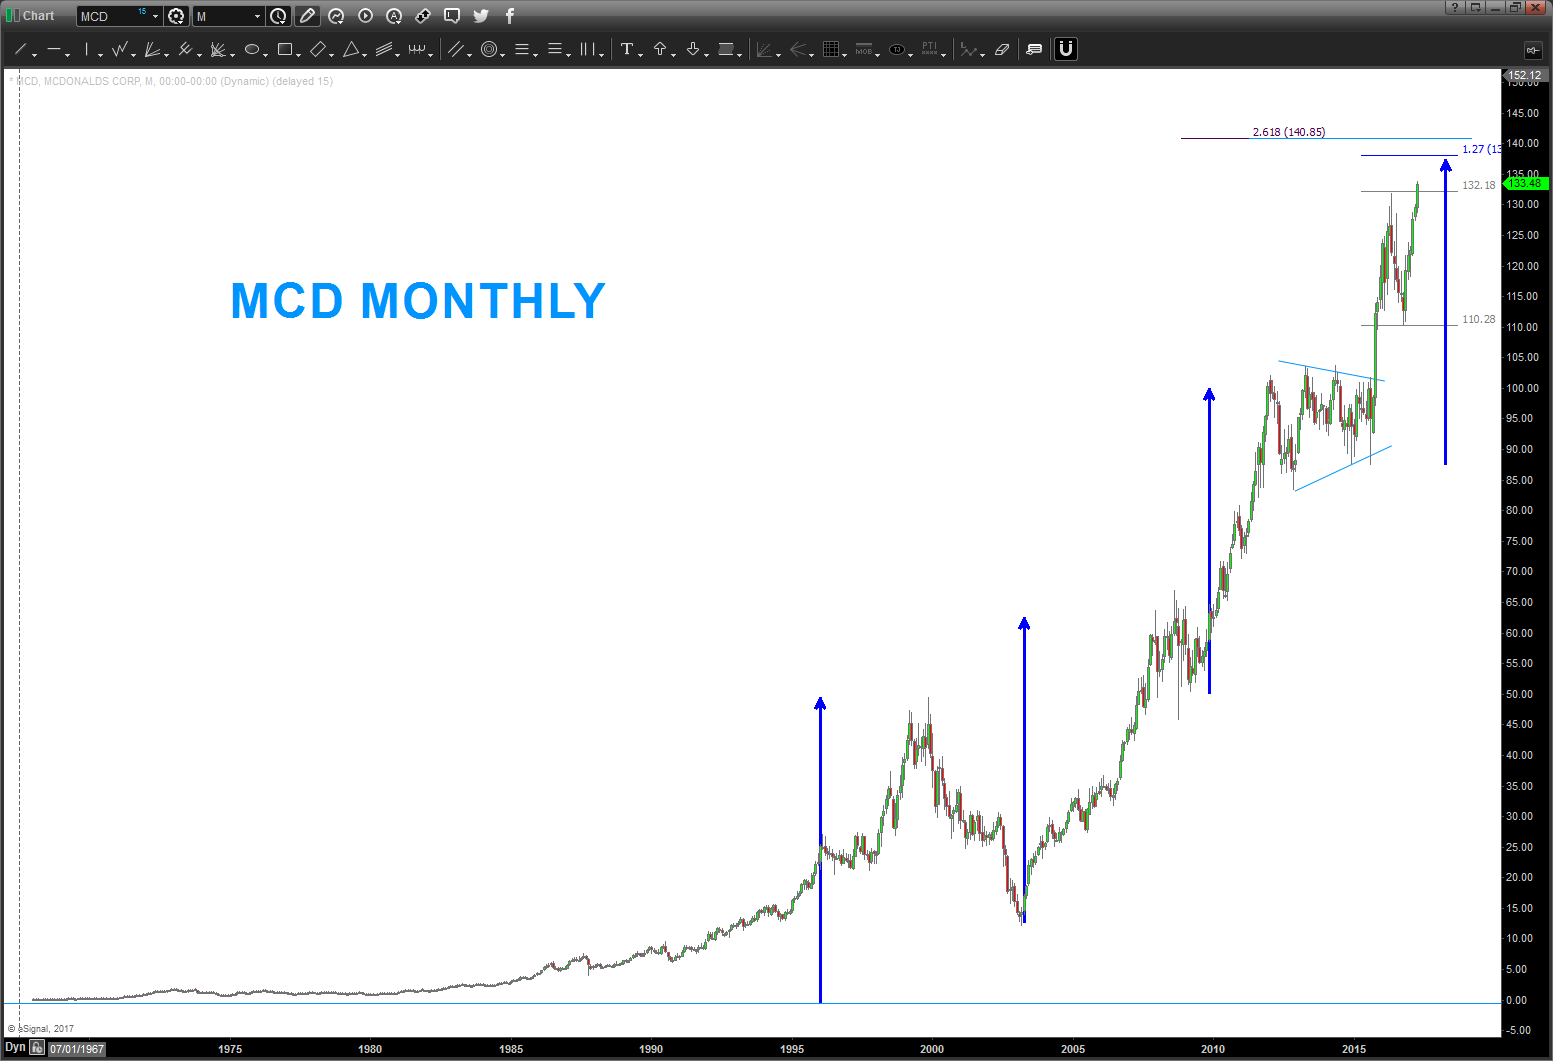
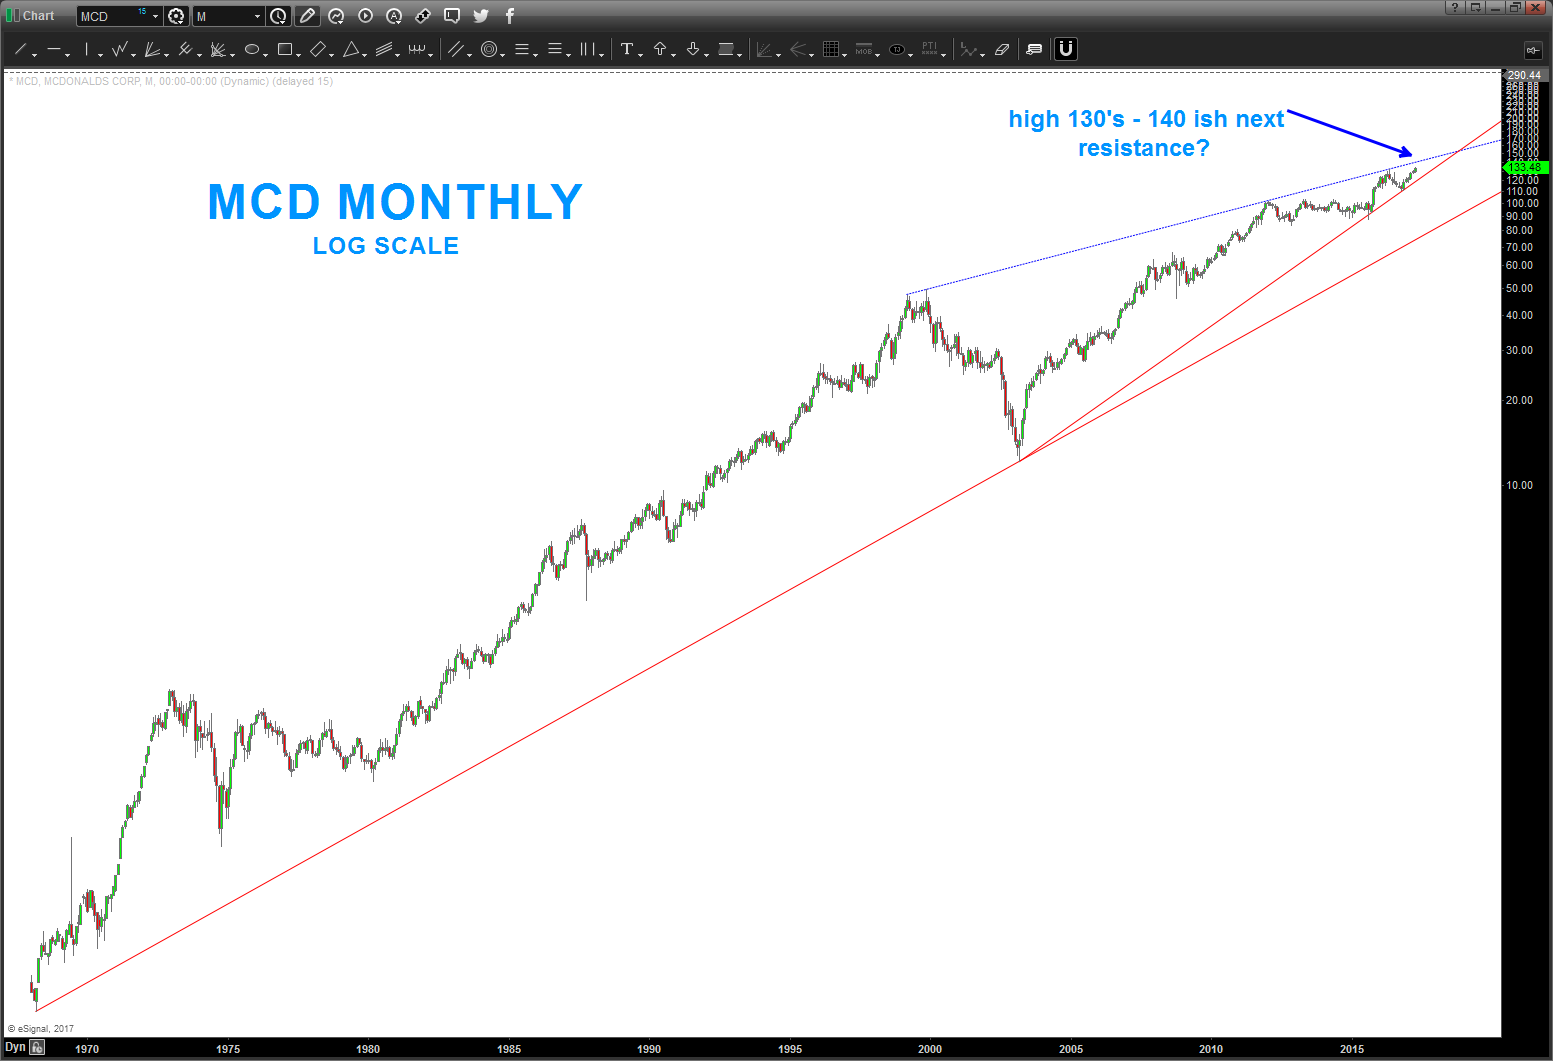
04/22/2017 – update to MCD. Log trend line coming in around the high 130’s to low 140’s “should” stop this advance. hope this helps.
note the measured moves (blue arrows) and note the blue dashed ‘log’ trend line ..
have a good weekend
___________________________________________________
So, here’s another AMAZING run by a company that really has it down. Let’s face it – everybody has gone to $MCD every once in a while – hugh? People buy Burgers man ….
But when I look at this chart I see the “Sir Isaac Newton” parabolic takeoff. So, starting from scratch were going to have some fun w/ geometry.
Exhibit 1: chart of $MCD
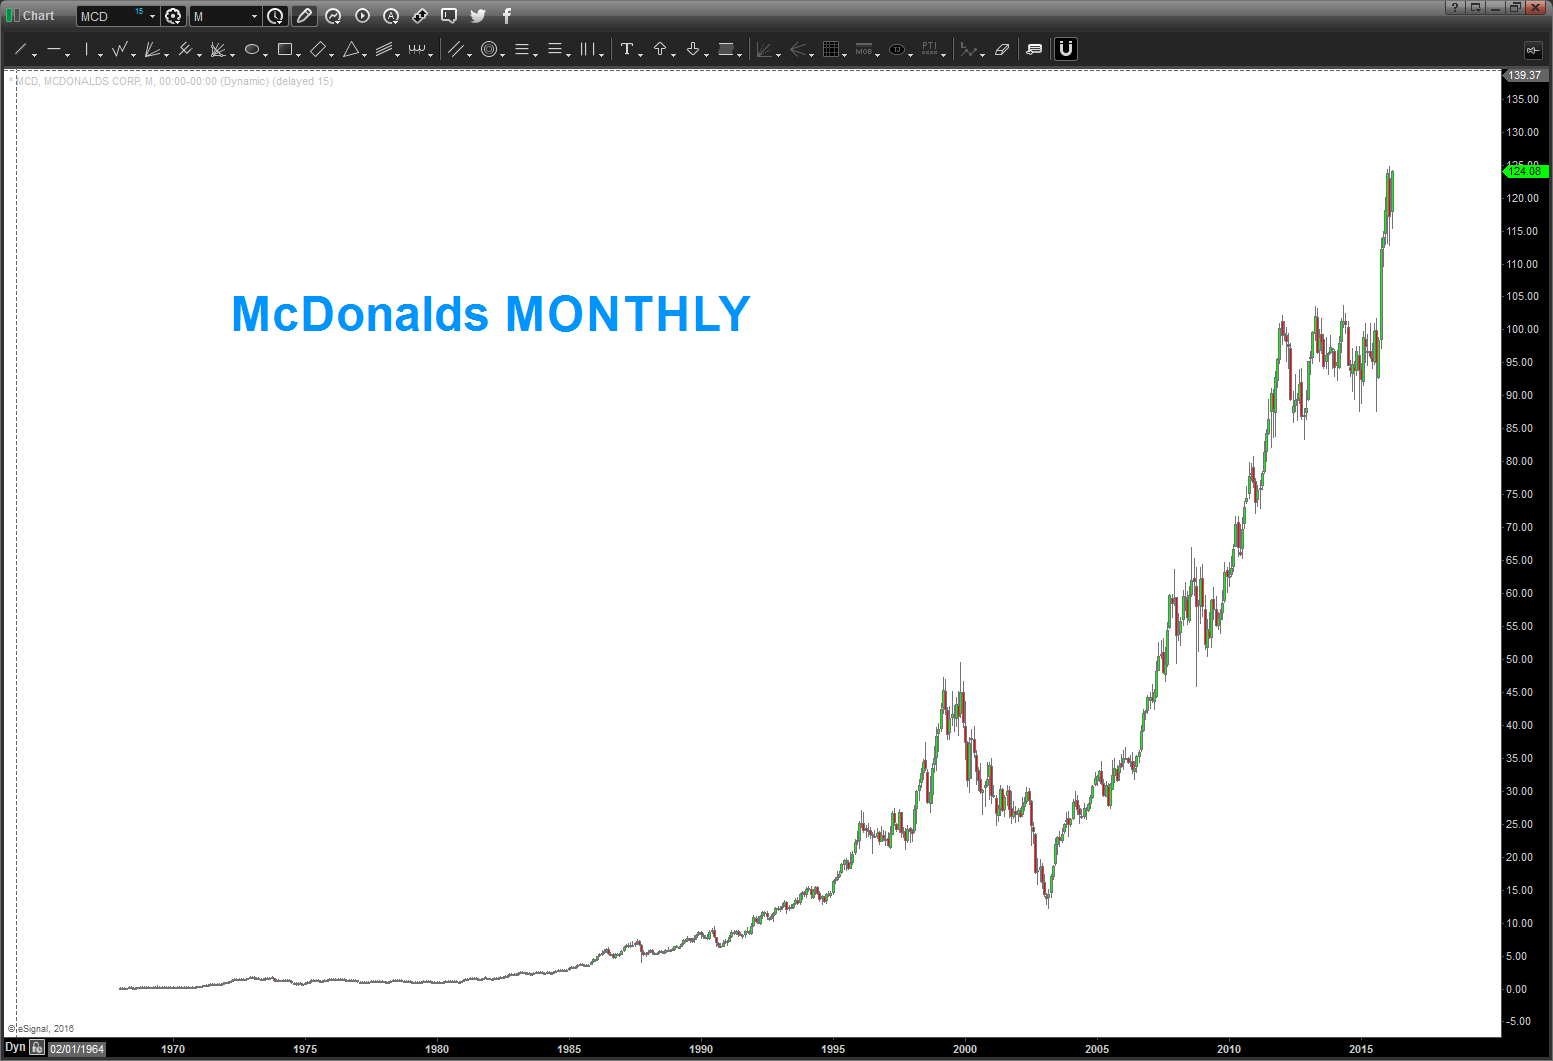
Exhibit 2: what does the LOG scale and RSI look like?
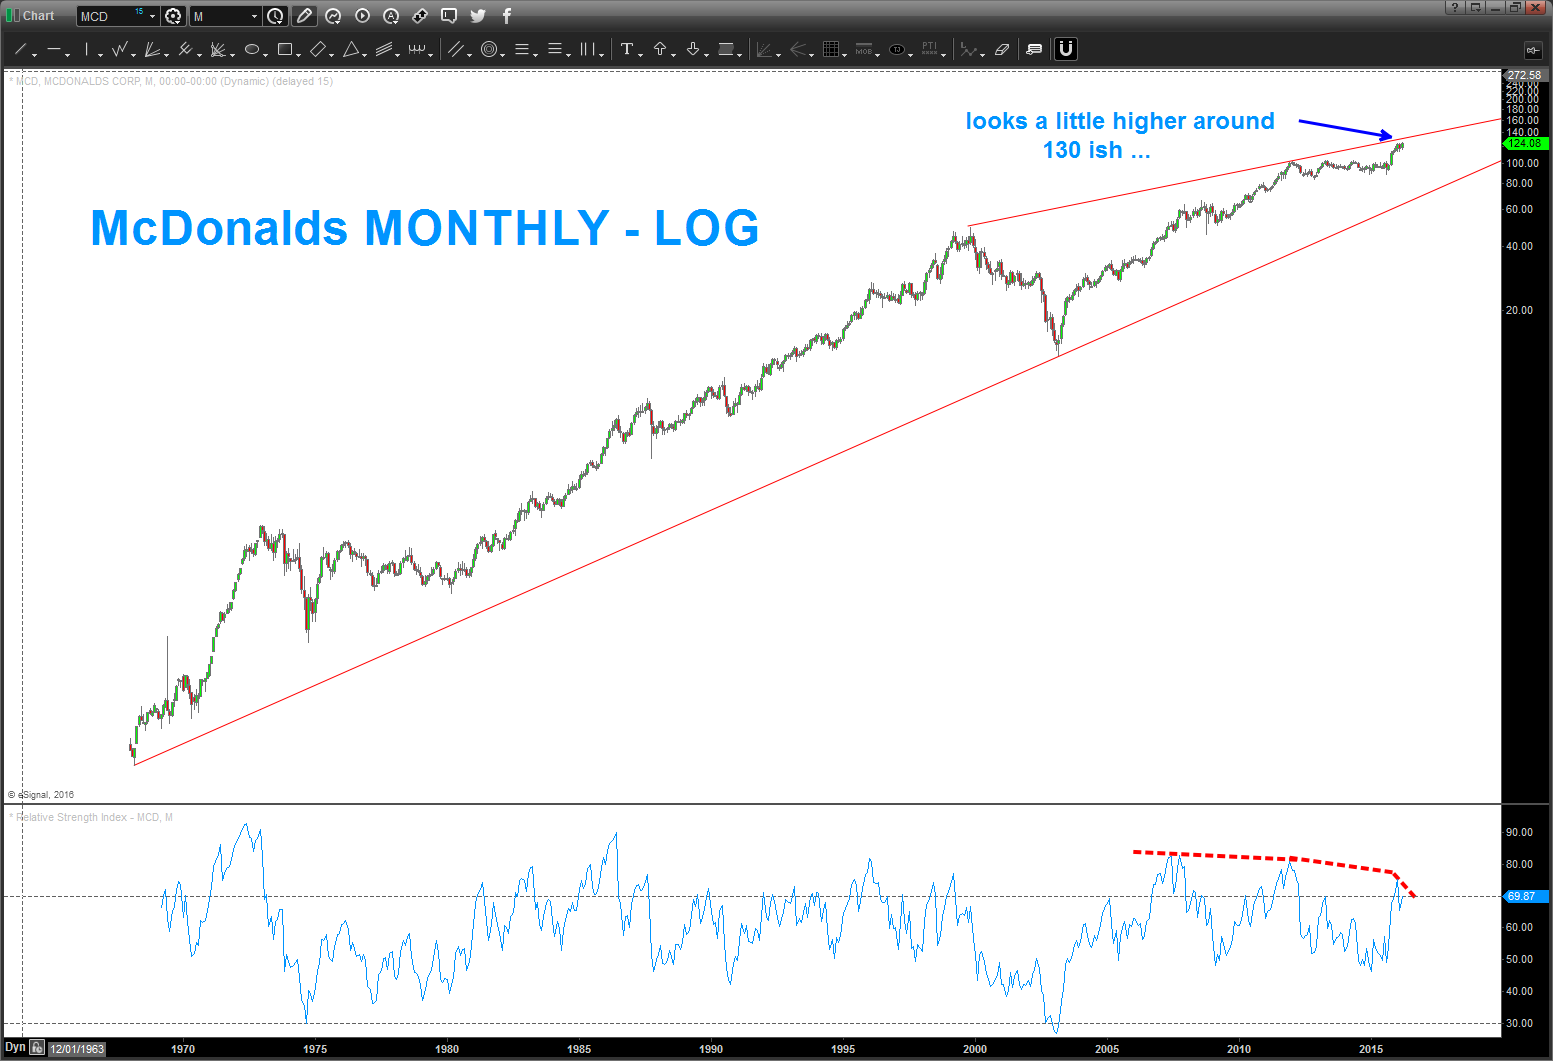
- the “top to top” trend line looks like it wants to go a little higher – 130 ish?
- note the “bearish divergence” in that $MCD makes new highs BUT the RSI doesn’t …important.
What about Volume? (are people buying it up here?)
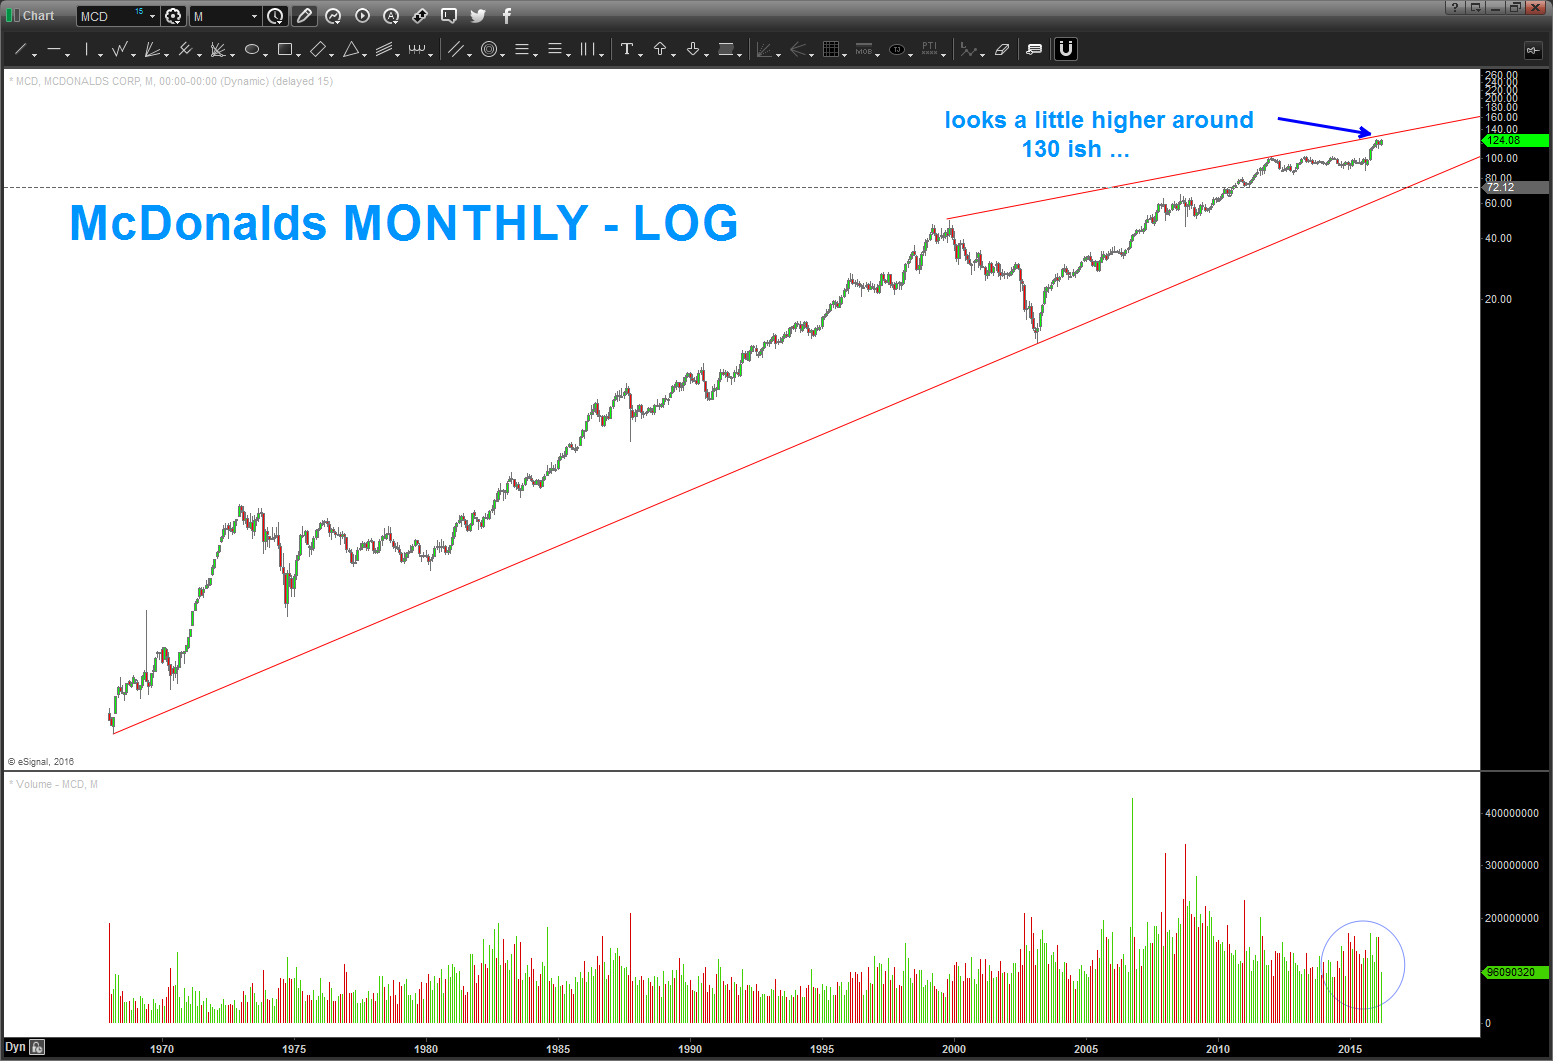
I’m going to chalk it up to …nothing too crazy. Volume is “good”
Now, EVERYTHING, I “Really Need to Know I learned in Kindergarten” (I actually mentioned this during my CMT talk at the convention a couple years ago). But, seriously, I want to make mention that what you see below is 1) real time (I didn’t do it and then publish it – it just looks parabolic) and 2) simply based on geometry we learned back in Elementary School.

Let’s take 3 points and figure out how to make a circle ….? OK?
http://www.mathopenref.com/const3pointcircle.html
Here’s the end result for $MCD:
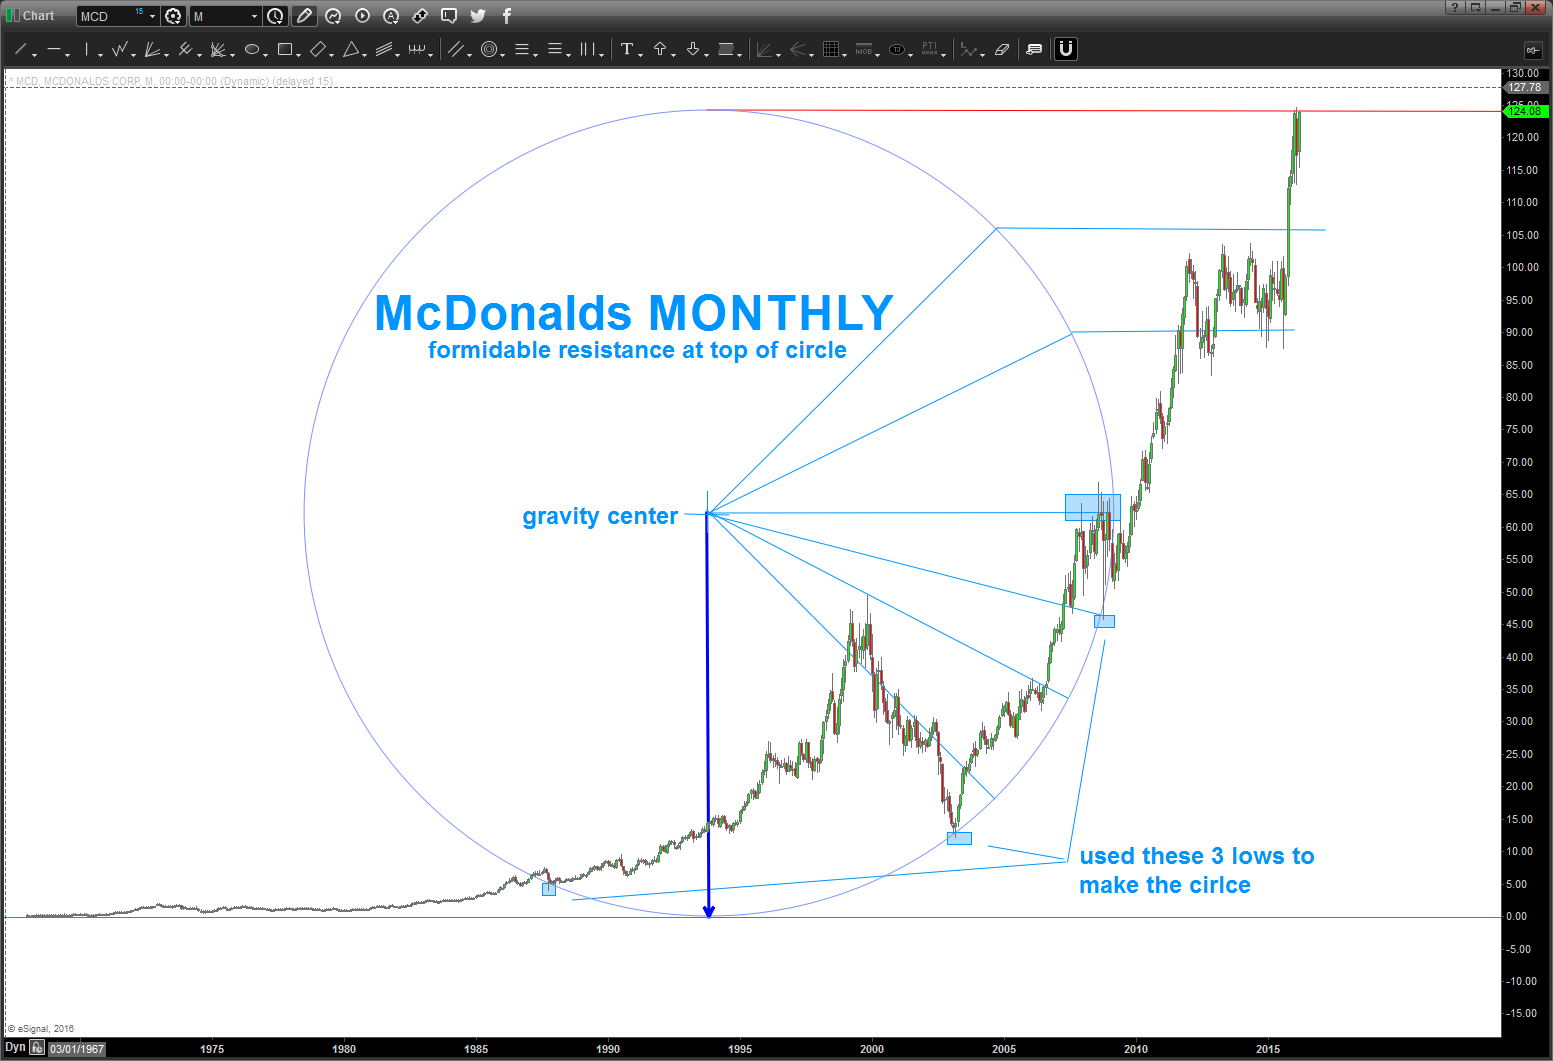
Again, if your a first time or new reader of the blog you’ll think “I curved fit this” or “did it first and then published it”. For those of you who know me – you know I wouldn’t do that. So, I didn’t …
What is going on here? Well, do you think, for one moment, that all the circles, squares, triangles, pyramids, etc. were built and created for the heck of it? OR, possibly, they were using these angles and natural order to convey higher, powerful but very simple truths?
If you study this chart, you’ll see that I drew “Gann Angles” (musical angles) from the gravity center and where the lines intersected the circle we had horizontal prices support or resistance and vertical time components.
Anyway, were tapping against the top of THE circle and w/ the bearish divergence present believe it might be time to have “one last” super size and step aside. WOULD NOT SHORT THIS STOCK UNTIL WE HAVE A MONTHLY/WEEKLY SIGNAL REVERSAL CANDLE. (the low of the high candle is taken out by a daily, weekly or monthly CLOSE below)
B
Housing … just keep your head in the sand OR are the clouds forming? 3rd update
Posted on April 16, 2017 Leave a Comment
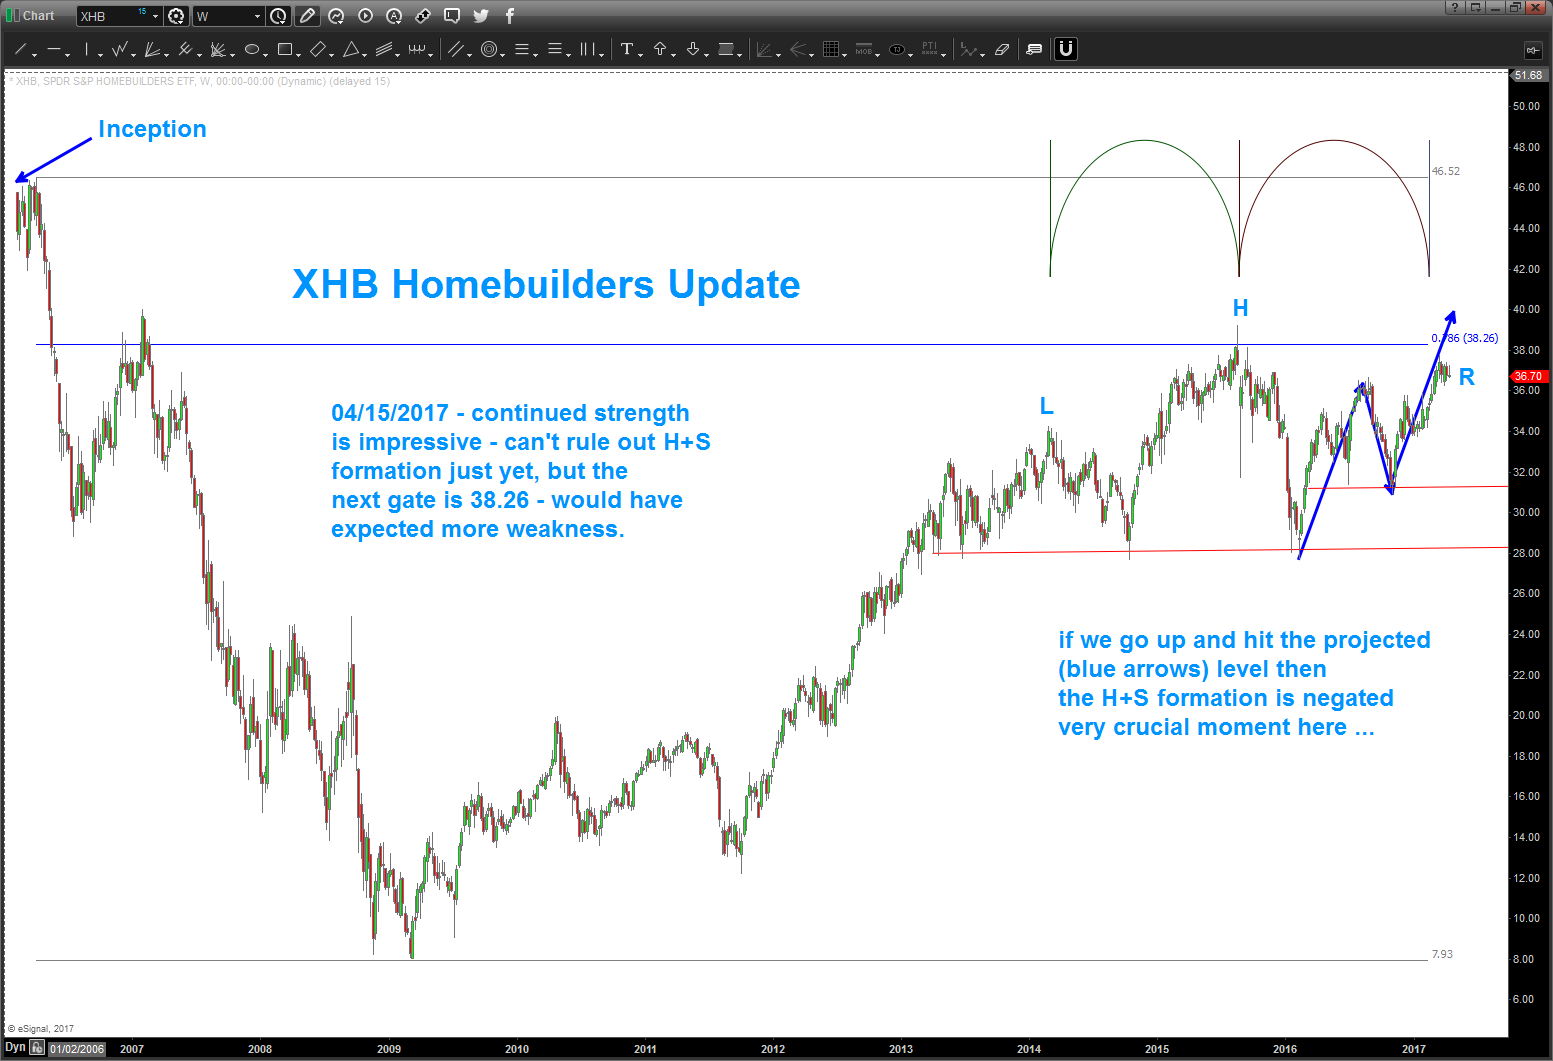
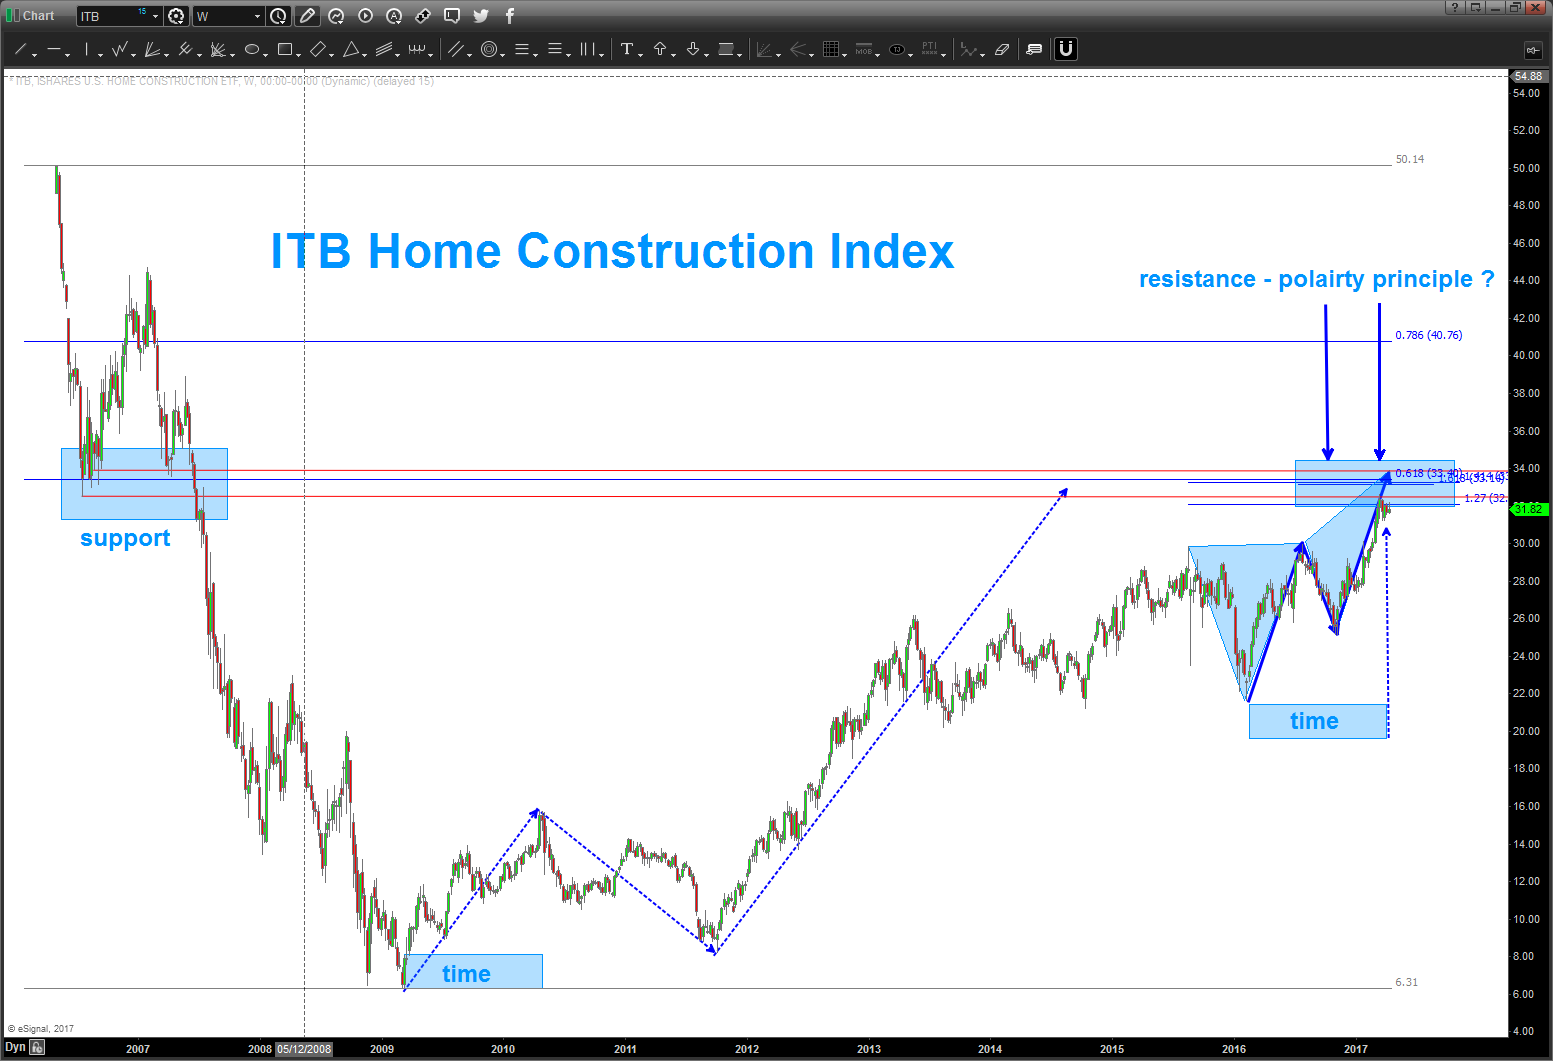
04/15/2017 – XHB has continued higher. It hasn’t made new highs but it sure isn’t showing the weakness that the rest of the overall market is showing right now …I’ve also updated ITB. Note, I didn’t have all the data (not sure why) the last time I posted on this one … the high is in/around 50.
I see strong resistance for XHB and ITB in the coming days/weeks .. I also see 900,000 – 1MM dollar houses in San Diego that are standing inventory all over the place… something will figure itself out, I do know that.
_______________________________________________________________________________________________
1/30/2017 – TON of standing inventory in the 900,000 range for .00004 acres and <2000 sq ft w/ rates rising. (I know that’s fundamental ‘stuff’ but it helps cast a picture)
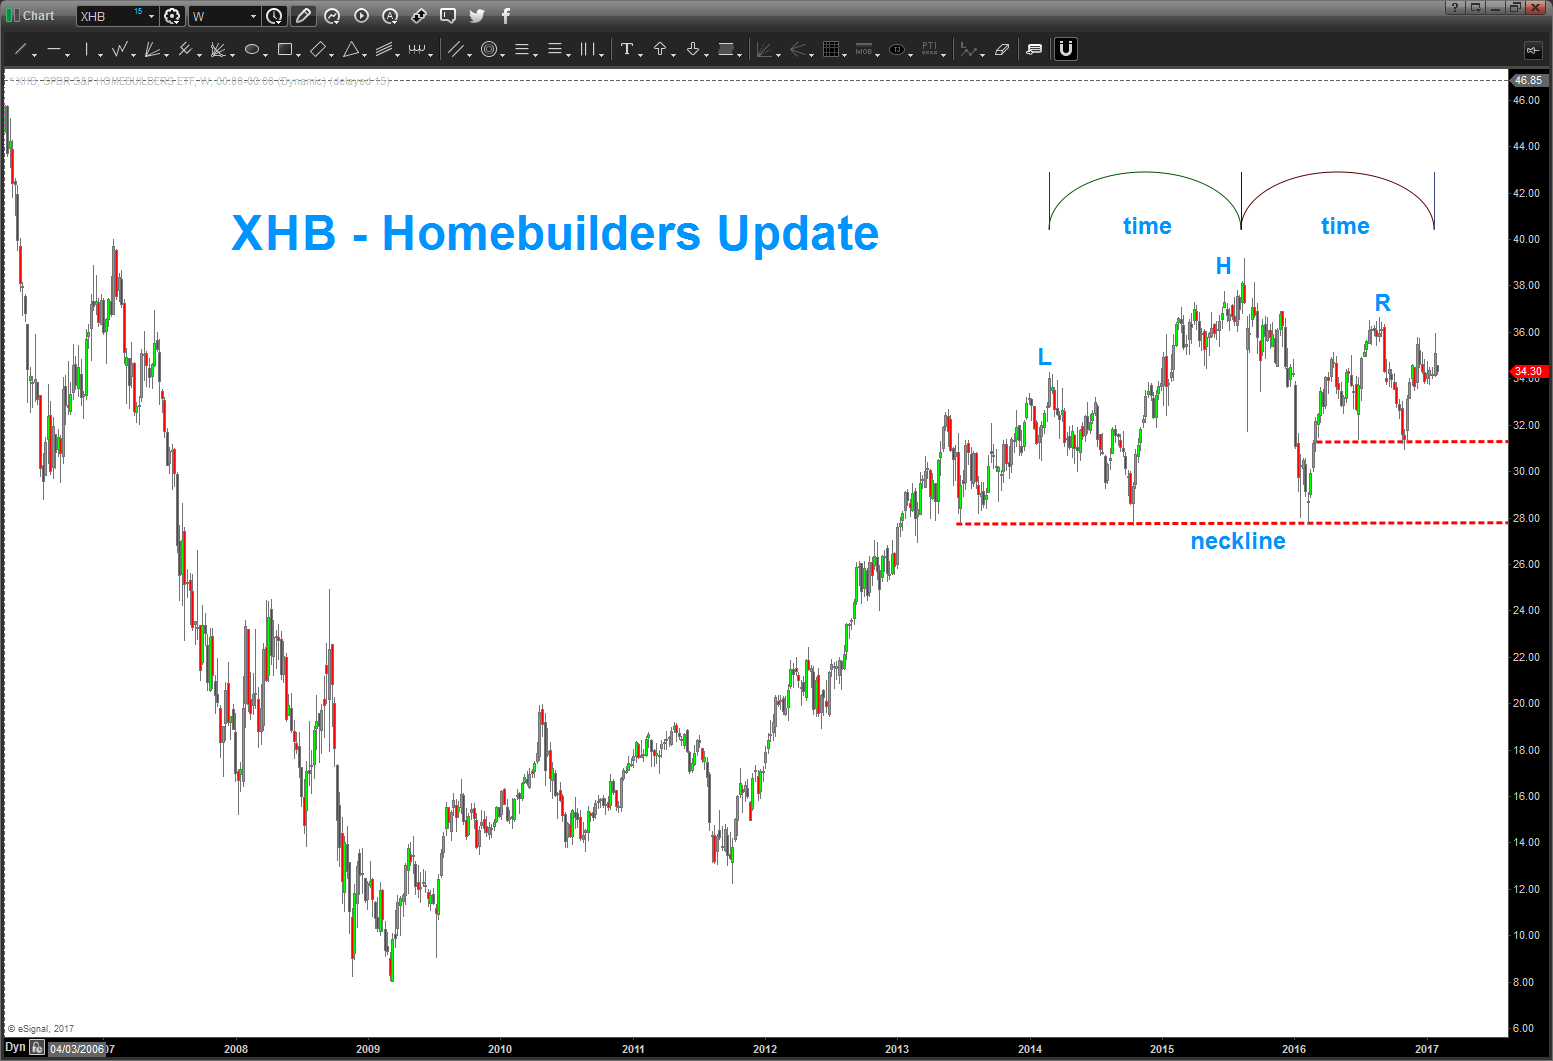
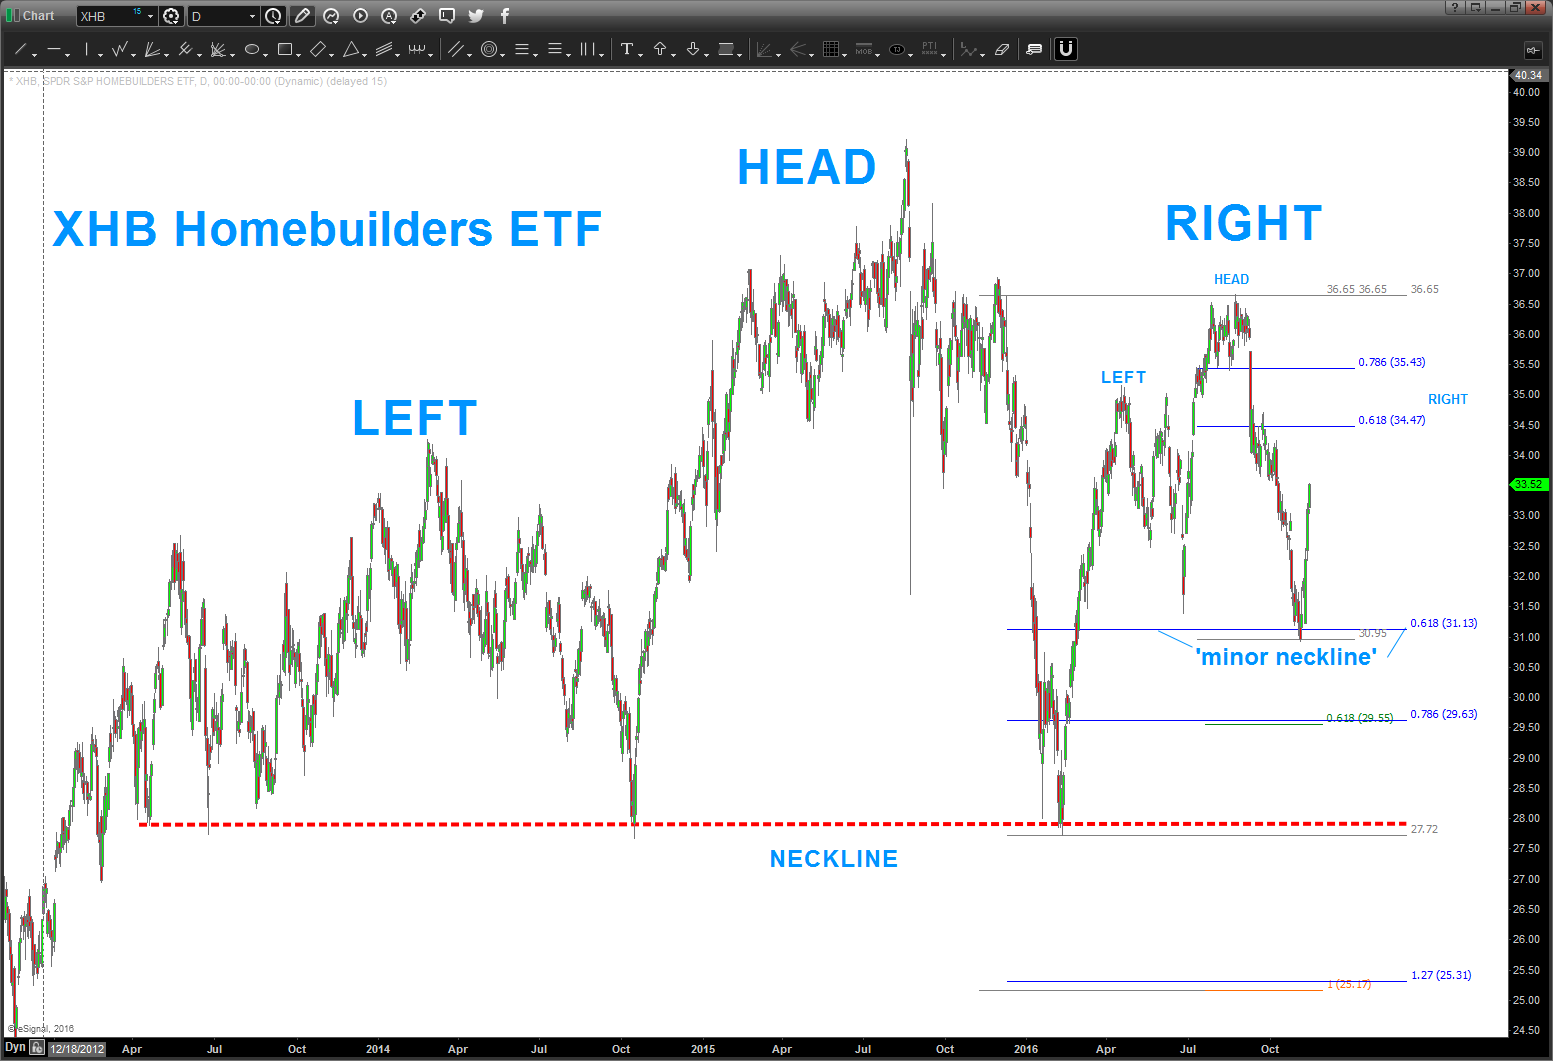
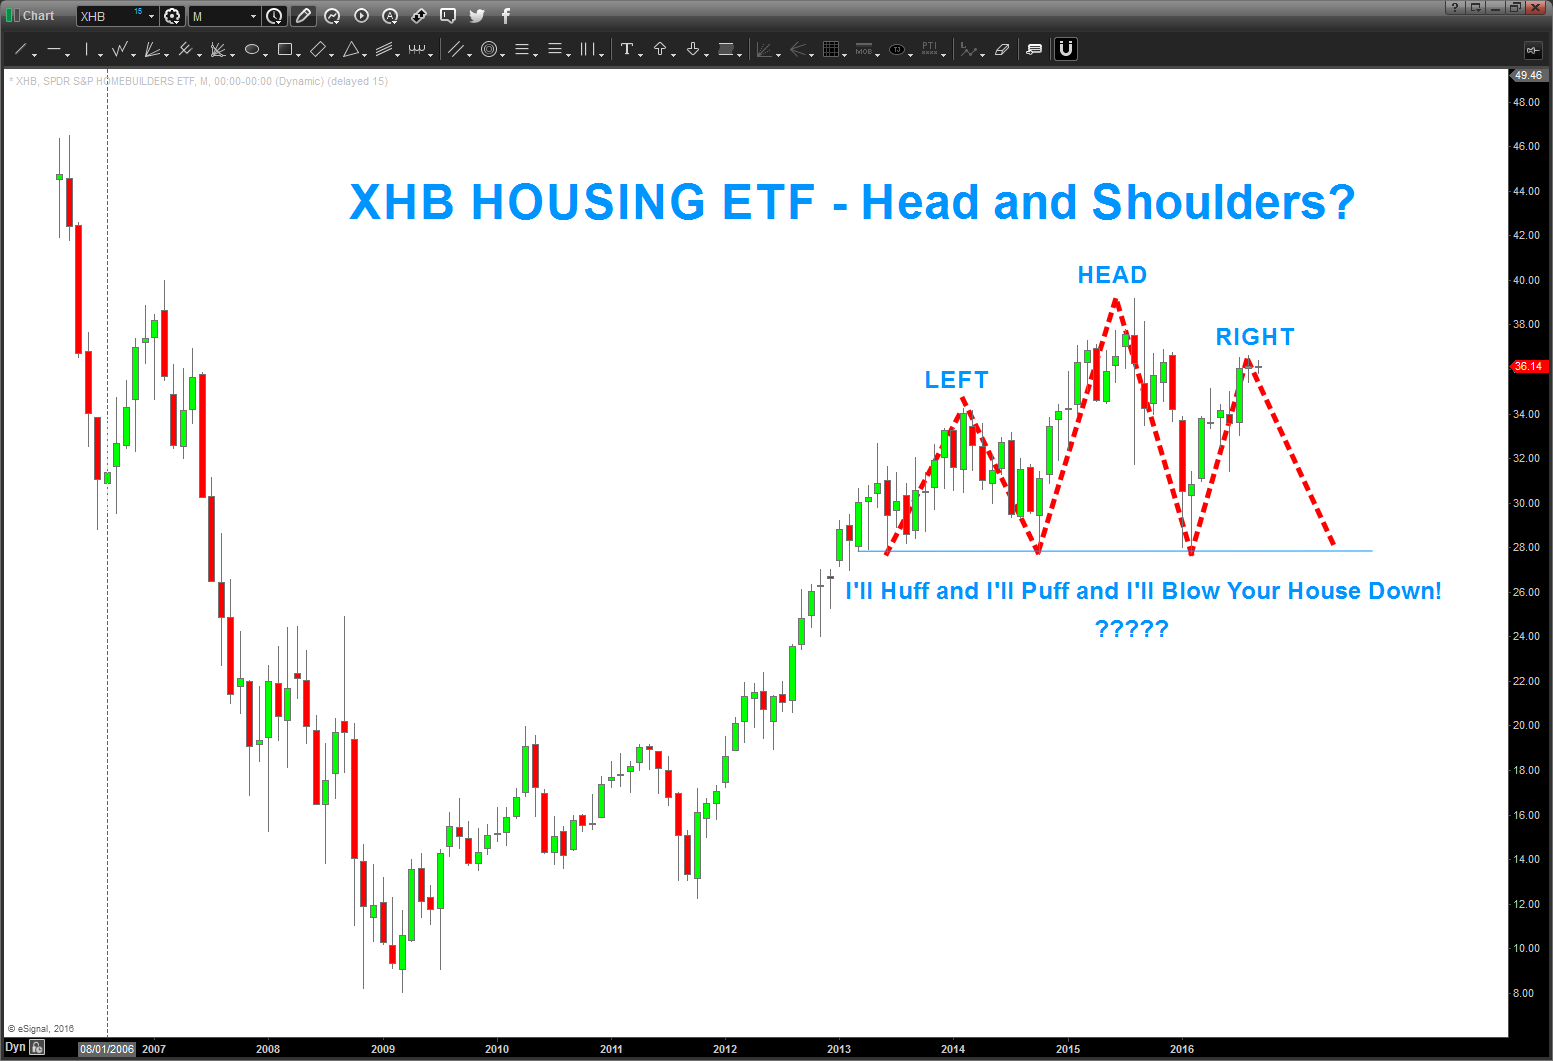
a ‘basic’ H+S on the Home-builders sure seems to be building … only ‘TIME’ will tell. note the ‘time’ symmetry between the L and R shoulders. Kind of cool.
be well, do good.
Bart
11/14/2016 – since the Election, the XHB ETF has taken off like a rocket ship. You can see below that it hit the .618 retracement from the Spring low of 16′. Upper targets are being shown in around 34-35.
were still working w/ the thesis that the 39 level was the completion of a major sell signal for the homebuilders. This straight up action of late is something to watch closely for this thesis to hold.
of note, a friend of mine sent me this headline:
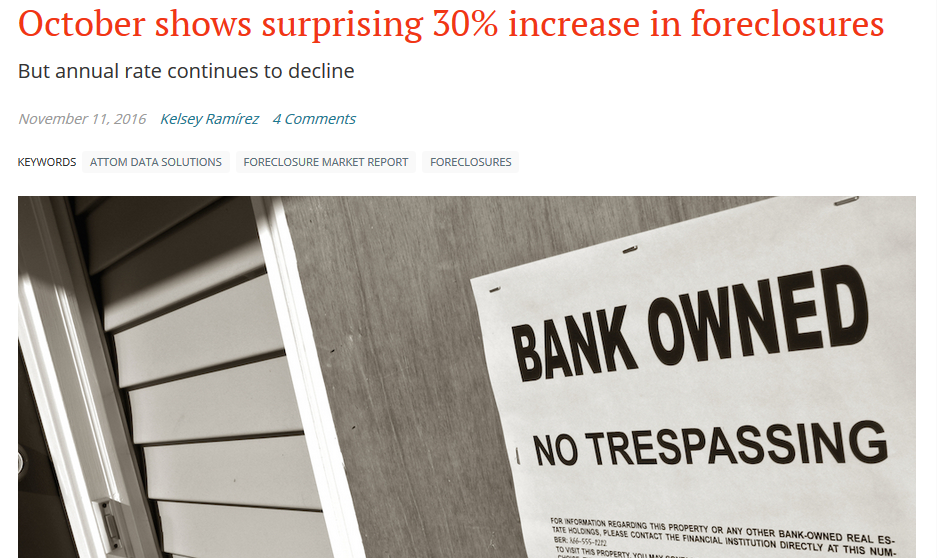
the rise in foreclosures last month was the highest since the big crash. Something to note .. however, the annual rate is still declining. Is this a divergence forming and a potential inflection point? I don’t know … but price/time will tell us.
Bonds are getting smoked of late causing rates to rise …
For those who have followed me you know that I’m usually ‘first to the party’ and ‘see’ things months if not a year in advance. that’s what patterns tell you … i’m not trying to put any spin on this folks. We are at ZIRP, I have houses all over the place going into standing inventory status, rates are rising and we just had a ‘big’ increase in foreclosures last month. Remember – almost a year before anyone paid attention to the Chinese Yuan I saw the BIG JUMP and said … this is something to notice. (https://bartscharts.com/2014/12/06/most-important-chart-to-end-2014/)
So, that’s all I’m doing again ….
Also, take notice of the big time SELL PATTERN FAILURE on the Banking Index. Multi-level chess game going on right now … trust the patterns and they will all line up. That I know …
Do well, be good and rock on, always.
Bart

I sold my house in VA and moved out to SoCal to rent .. did it for a number of reasons. The NUMBER 1 reason was to learn how to Stand Up Paddle-board Surf and enjoy the weather. YES, I understand it’s financial suicide out here .. the taxes are crazy, the cost of living is crazy but the surf is good man …
I was SO HAPPY to unload the house … why? Well, I think we are on the verge of another big old smack down in housing. Of note, my post from March 2013 (yes, 3+ years ago that the home builders had topped in/around 32 did not come to fruition. In essence the pattern failed .. so, it went up to the .786 and also completed the 1/8th signal reversal candle. Now, we’ve rallied right back up to the .786 level and are at the demarcation point.
Study:
- this ETF doesn’t want to go below 27. Big support …
- also, note the AB-CD projection down to 25.40 – if we crack from here expect support there and if BULLISH this will hold and bring it to new highs. If it fails … watch out below.
- THOSE are the levels to watch …
- sure looks like a MONTHLY H&S pattern for this ETF … doesn’t it?
To finish the story about San Diego … I was driving around the other day and noticed TONS of standing inventory …plus the houses were selling for 850K to 1.0 + MM. Folks, that dog don’t hunt man …
Also, the PATTERNS suggest a MAJOR top in bonds which means higher rates … so, it’s been 3+ years since my last post on home builders. It’s moved, a little, perhaps it will move more, but man this sure looks like a BIG top is coming in housing ….

Here’s the Home Construction and Home Builders ETF (ITB and EHF)
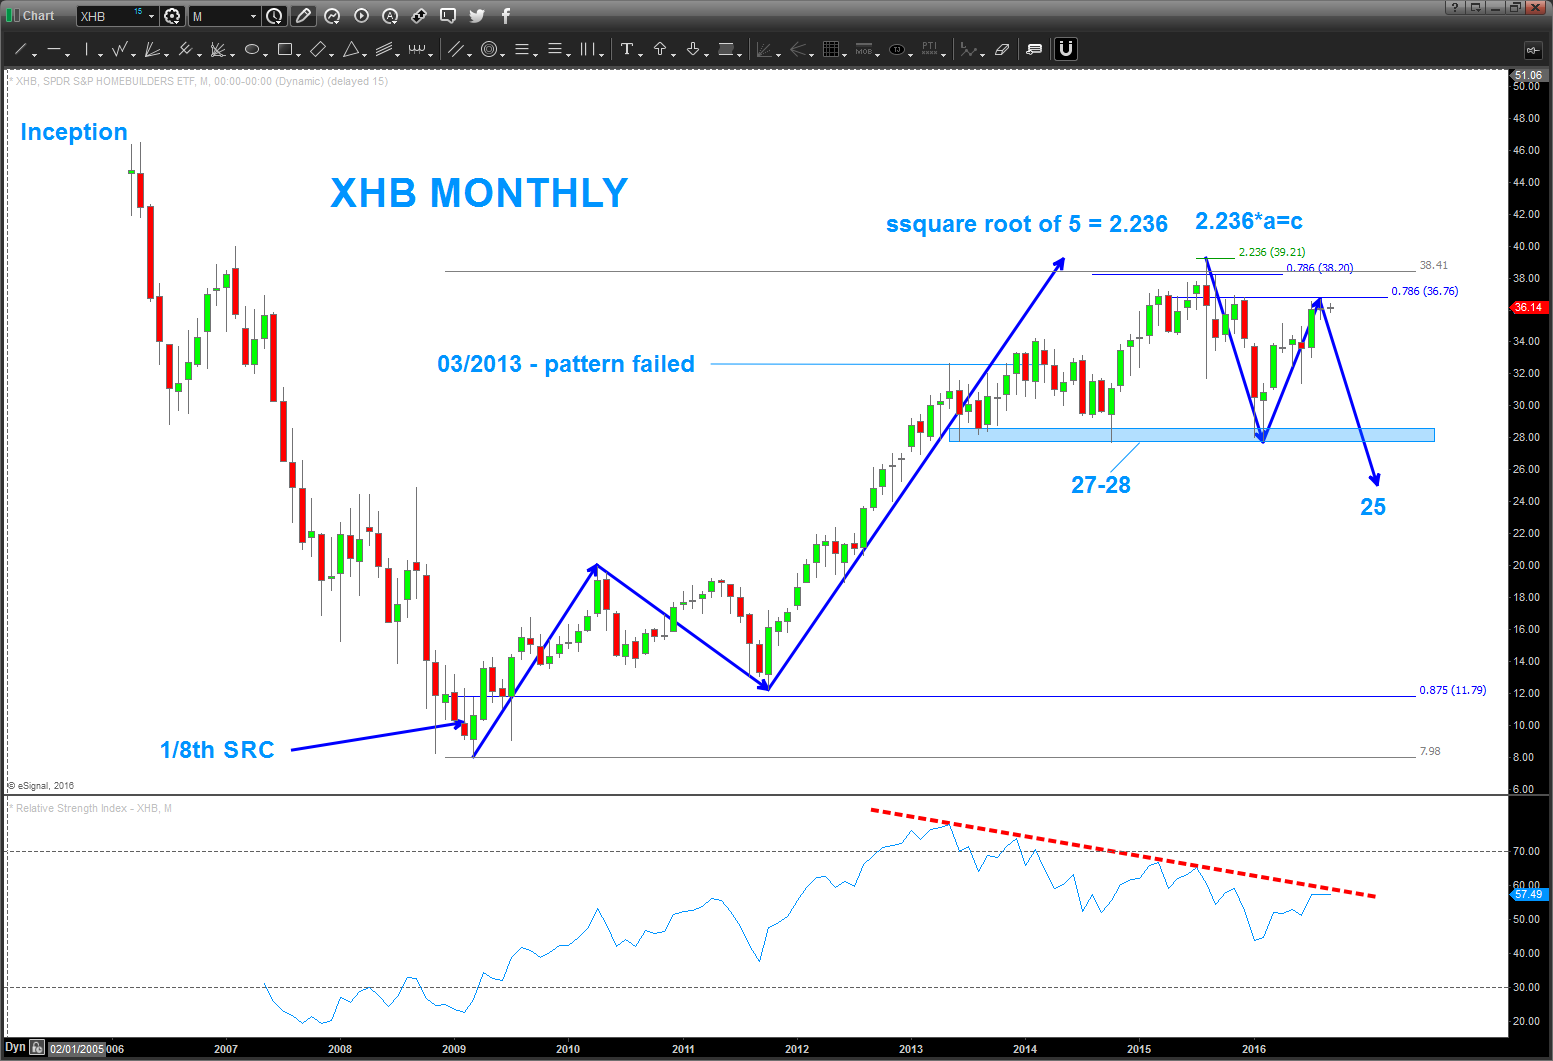
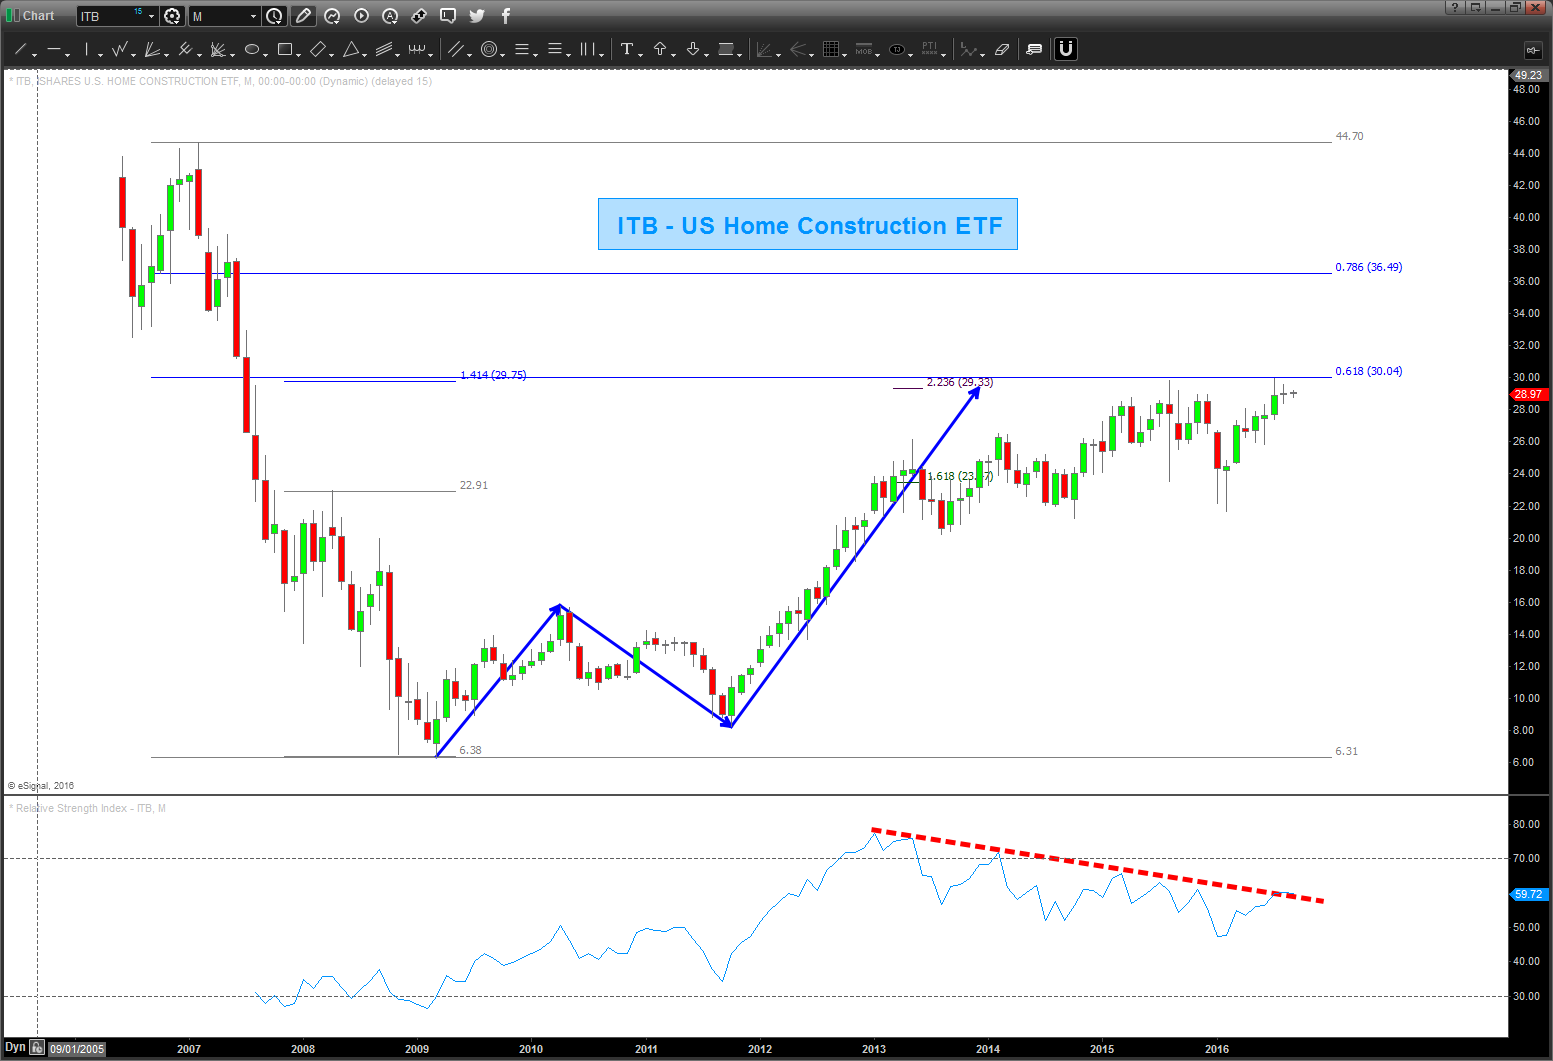
Again, folks, it’s just PATTERNS. Sometimes they work, sometimes they don’t … but at least we have some guides to support what could (could being the operative word) a BIG OLD THUMP in housing …
Bart
had some fun w/ $AMZN over @seeitmarket an Update
Posted on April 14, 2017 Leave a Comment
04/14/2017 – just a quick update that we are really close or need a little bit more for the SRC to be invoked on AMZN. also, note the shooting star candle present and also the doji like candles that started most corrective moves.
probability lends itself to be cautious and sit on ones hands to assess the next couple weeks of AMZN price action.
as you can see by the chart below a “normal” correction has been around -30 percent ….
have a GREAT weekend w/ family and friends.
B

_________________________________________________________________________________________________
04/06/2017 – its been a while but did do an update for Andy and the gang @seeitmarket:
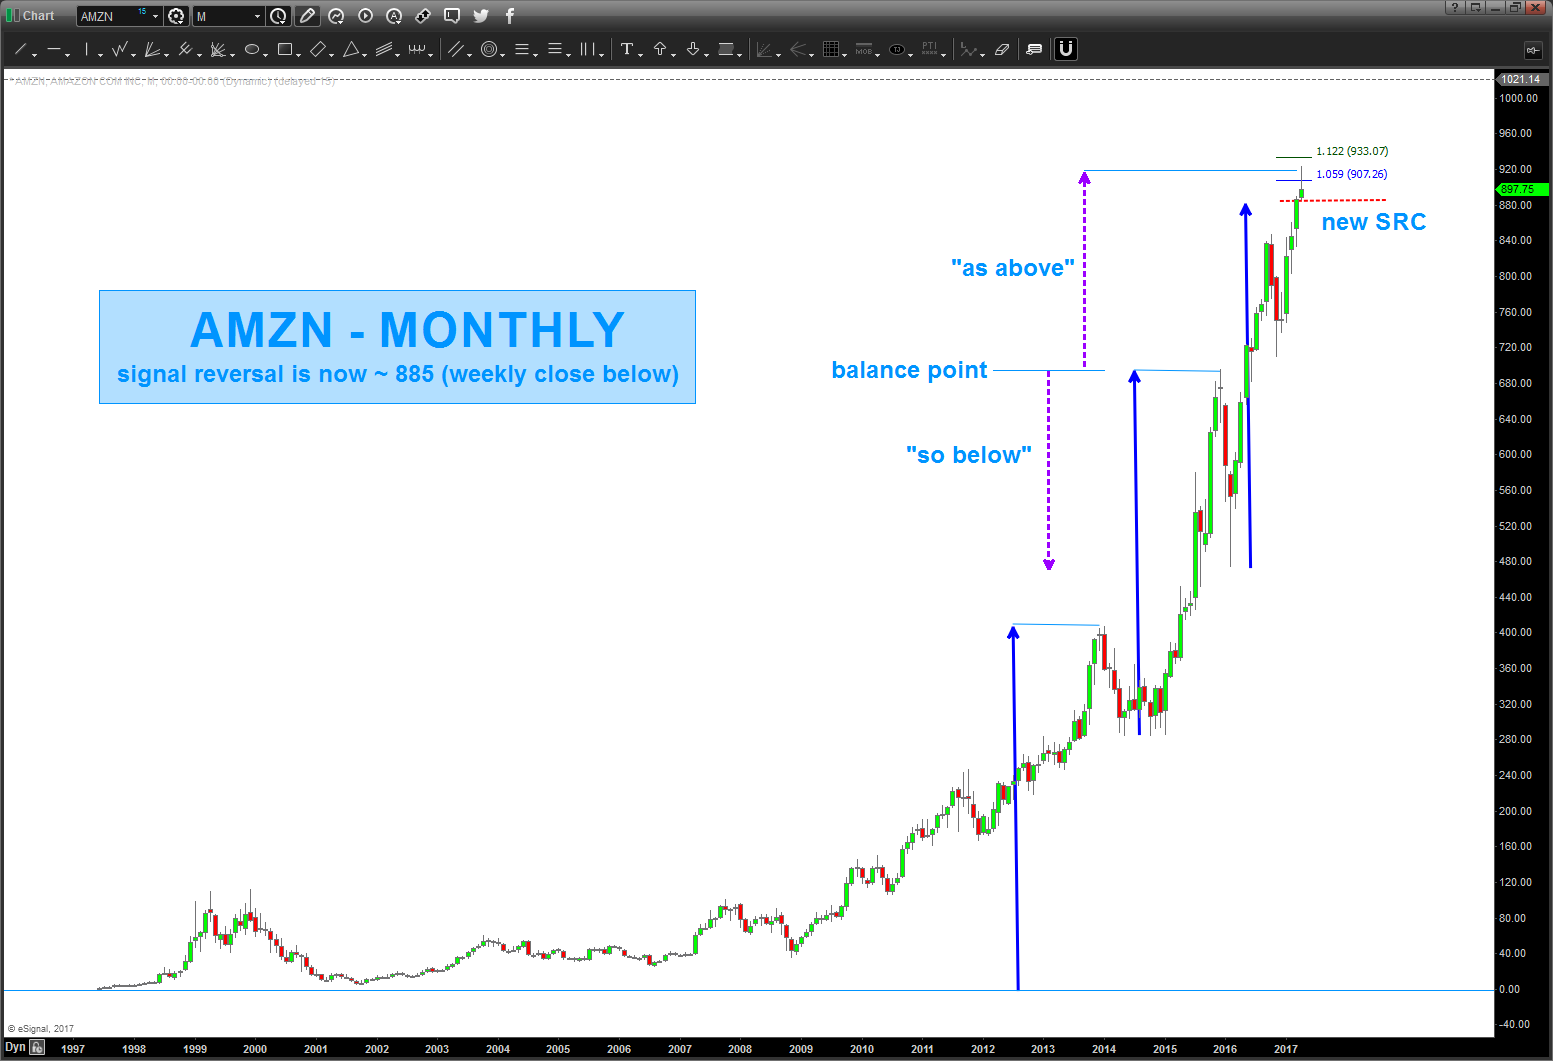
After this post, went and did a peak at the measured moves and compared the last one to musical notes. basically, the measured move extended base on the 12th root of 2 or 1.05946. the other method I used, taught to me by Michael Jenkins was a simple, yet powerful, projection technique using the “move down” to balance w/ the same move up (the purple arrows).
As one can see, it moved roughly 2 percent past the measured move target and we still do not have a SRC. Since the high candle started this week, we use the LOW of the high monthly candle as the “new” SRC base. That “new” SRC if looking for the short is 885.
Until we get a monthly or weekly close below 885 I would stay away from the short side. I relative terms, we are close to 1000 and in this euphoric and unrelenting bull market how cool would it be to hit 1000 / share for AMZN.
___________________________________________________________________________________________
