Super Size Me … $MCD update …
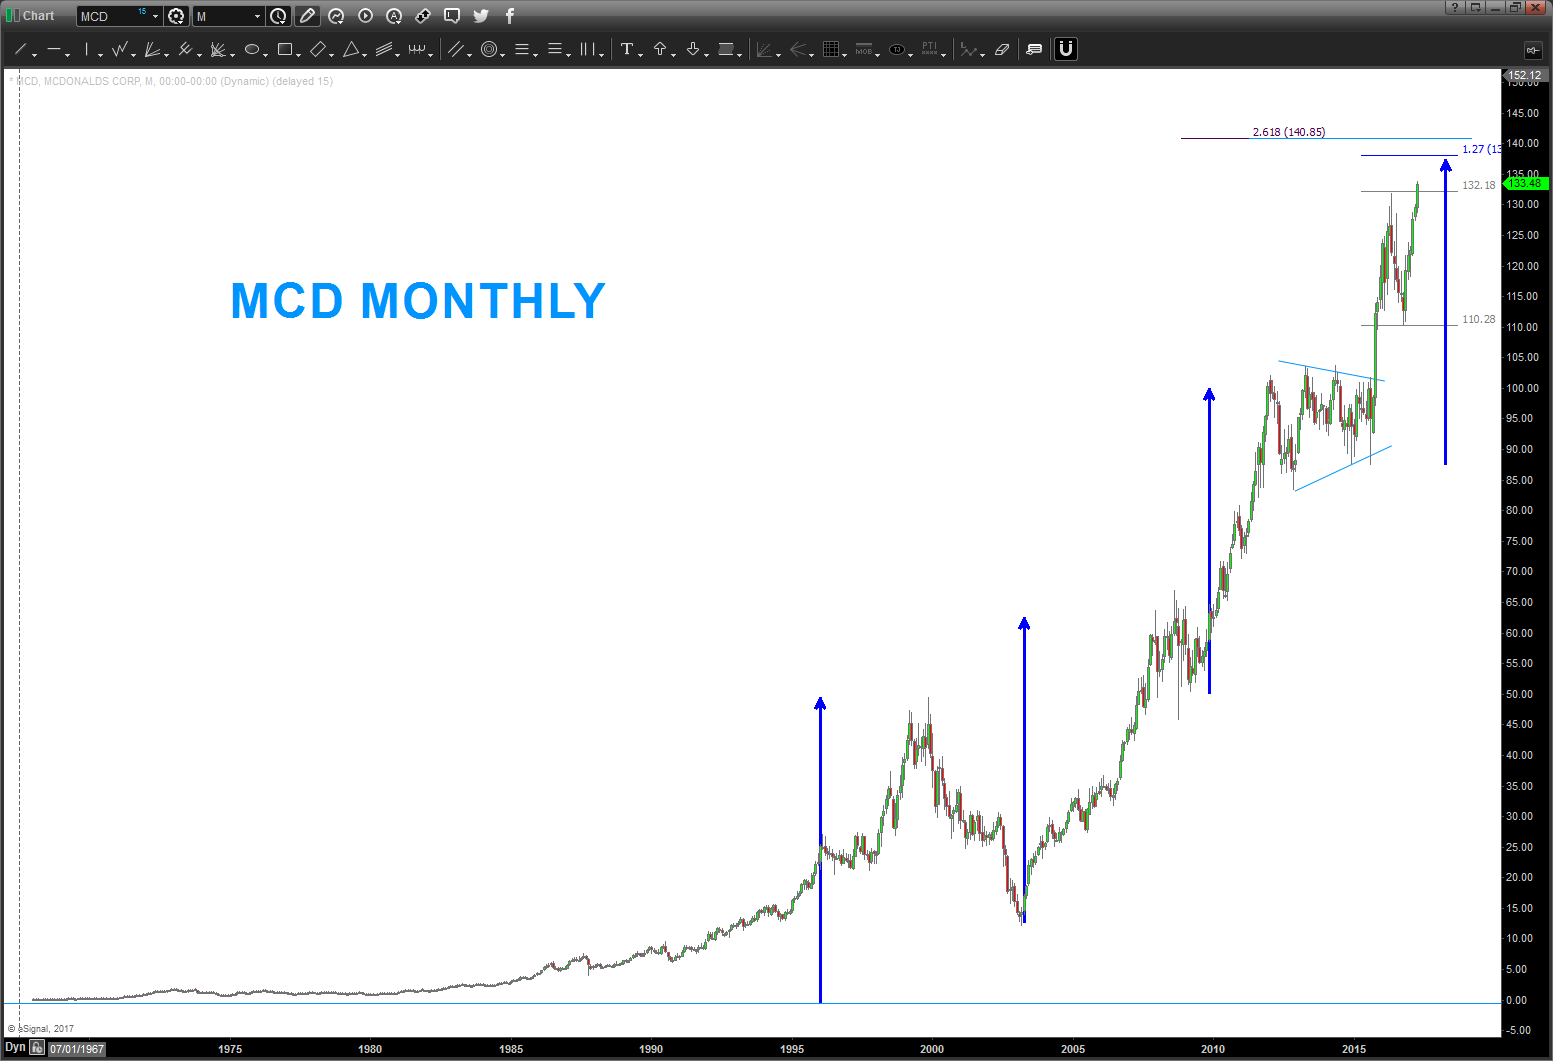
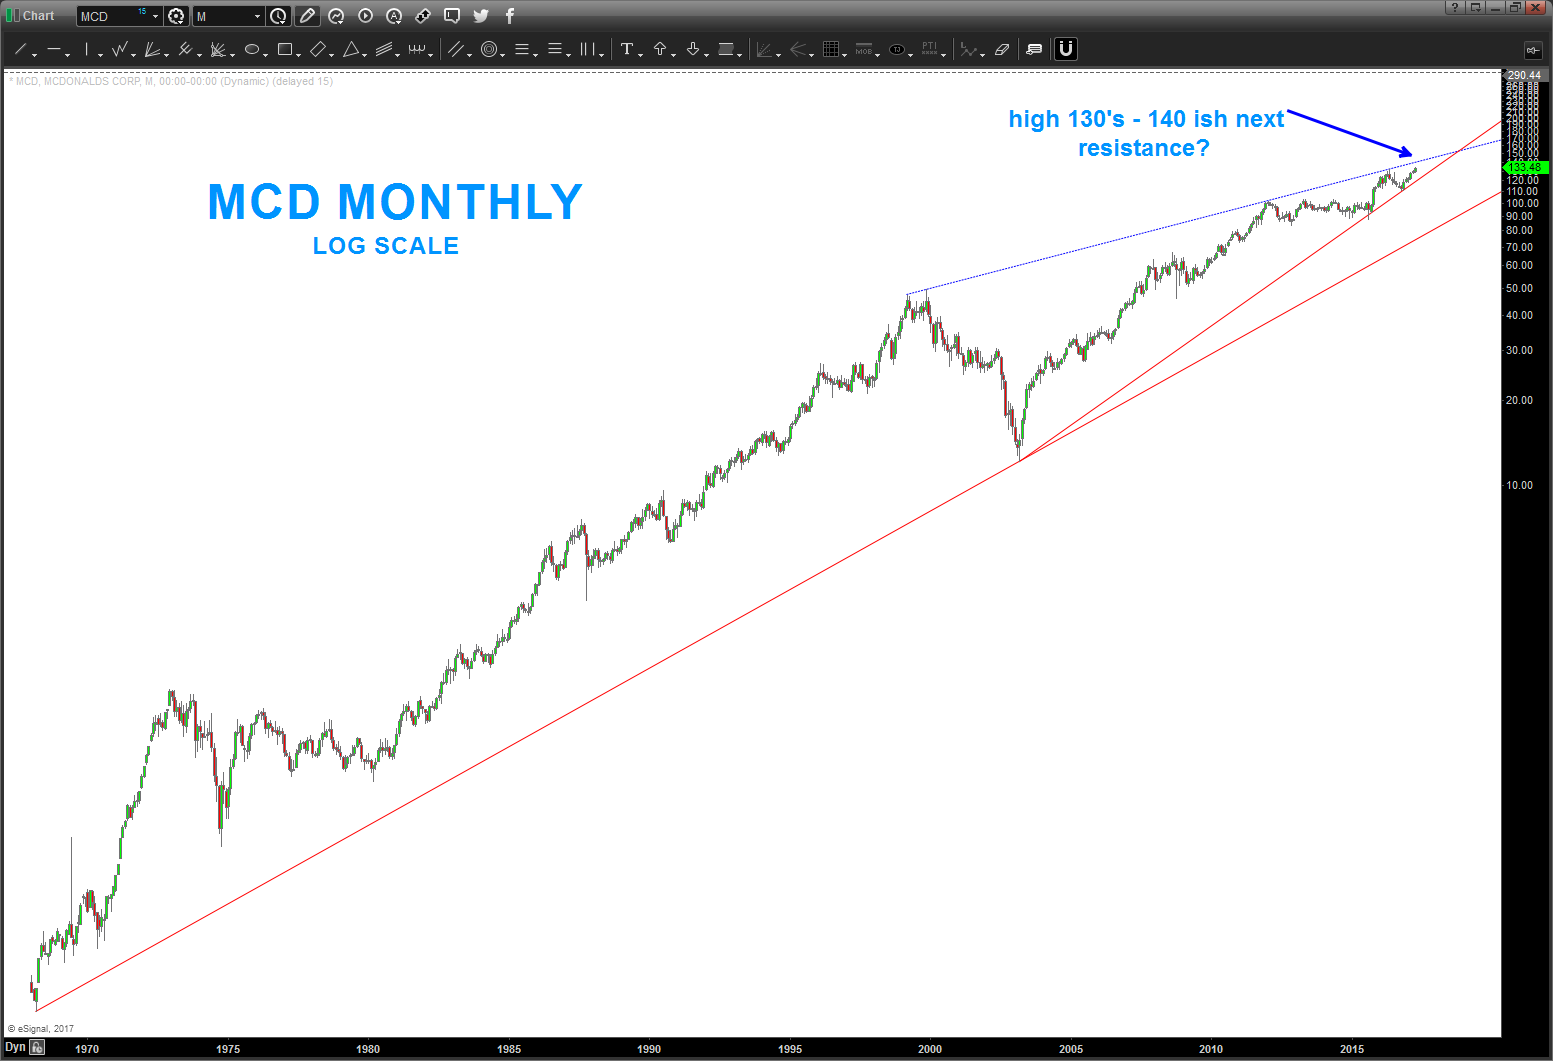
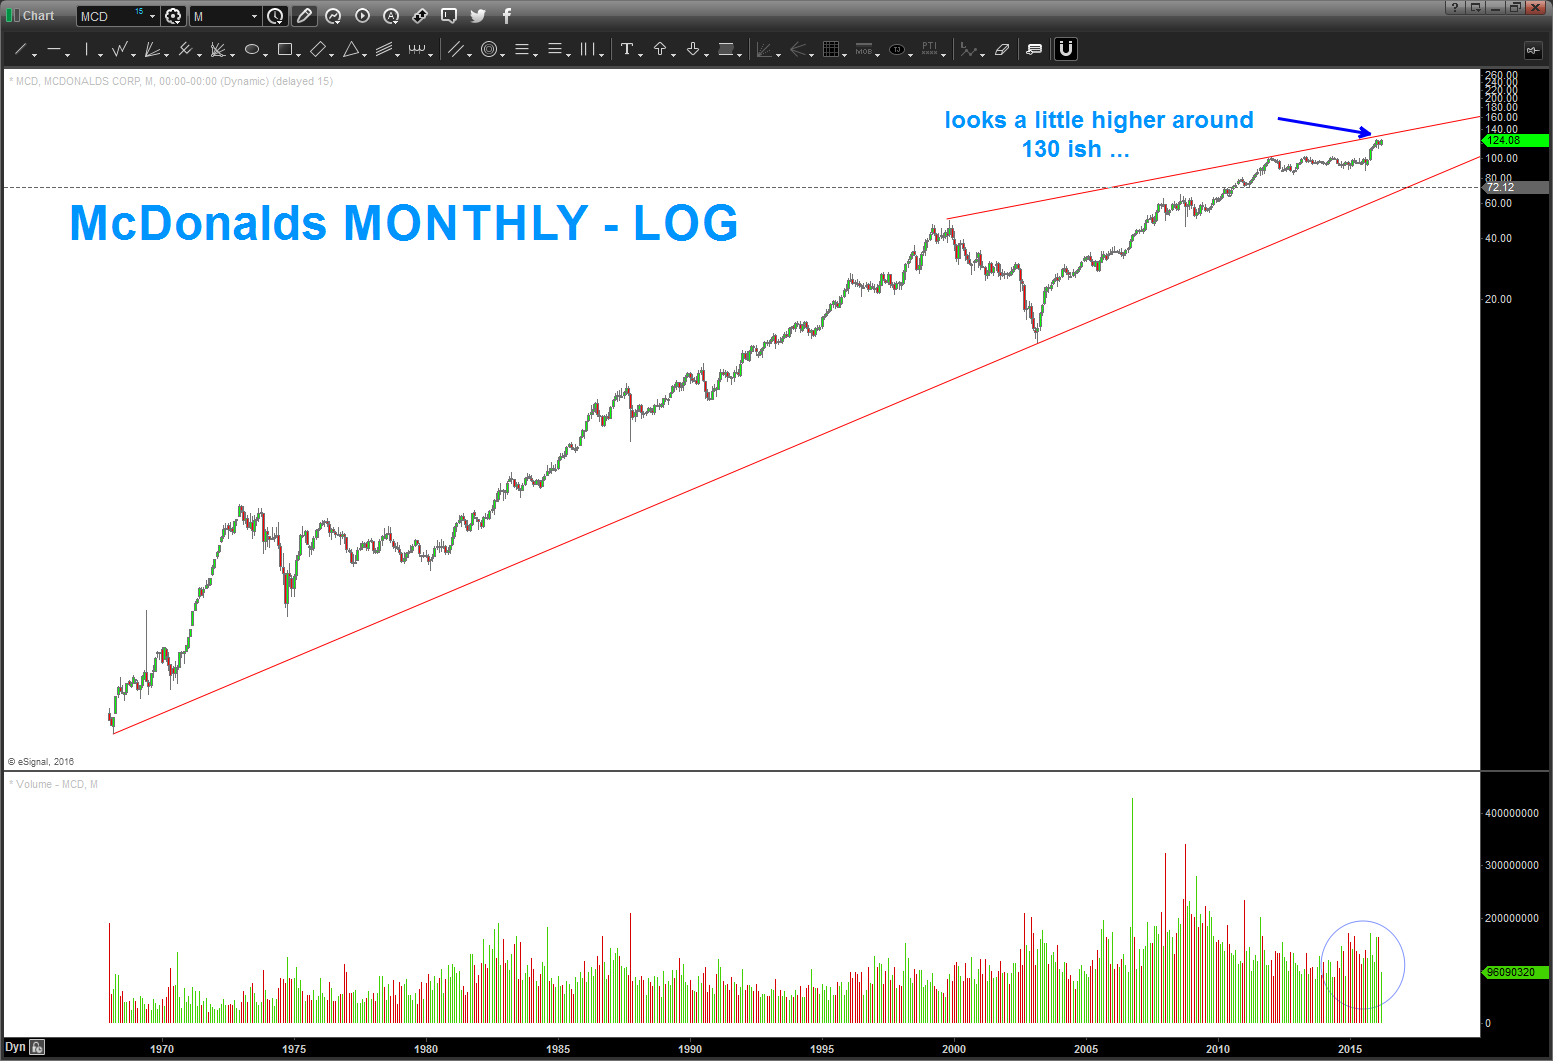
04/22/2017 – update to MCD. Log trend line coming in around the high 130’s to low 140’s “should” stop this advance. hope this helps.
note the measured moves (blue arrows) and note the blue dashed ‘log’ trend line ..
have a good weekend
___________________________________________________
So, here’s another AMAZING run by a company that really has it down. Let’s face it – everybody has gone to $MCD every once in a while – hugh? People buy Burgers man ….
But when I look at this chart I see the “Sir Isaac Newton” parabolic takeoff. So, starting from scratch were going to have some fun w/ geometry.
Exhibit 1: chart of $MCD
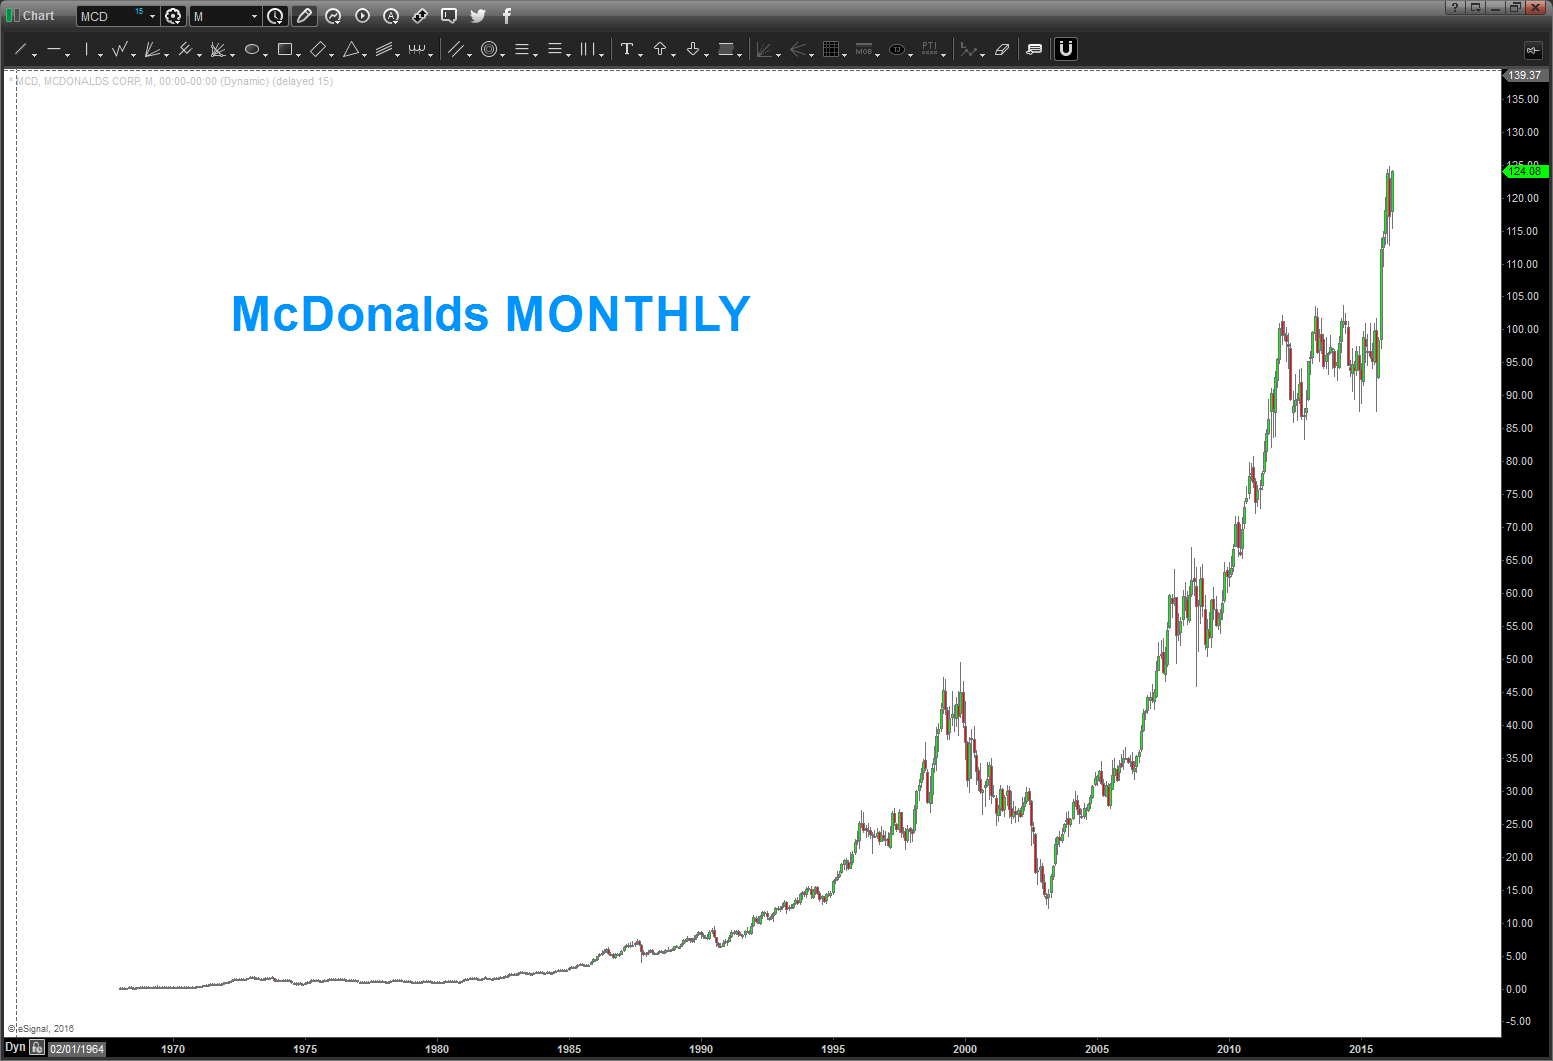
Exhibit 2: what does the LOG scale and RSI look like?
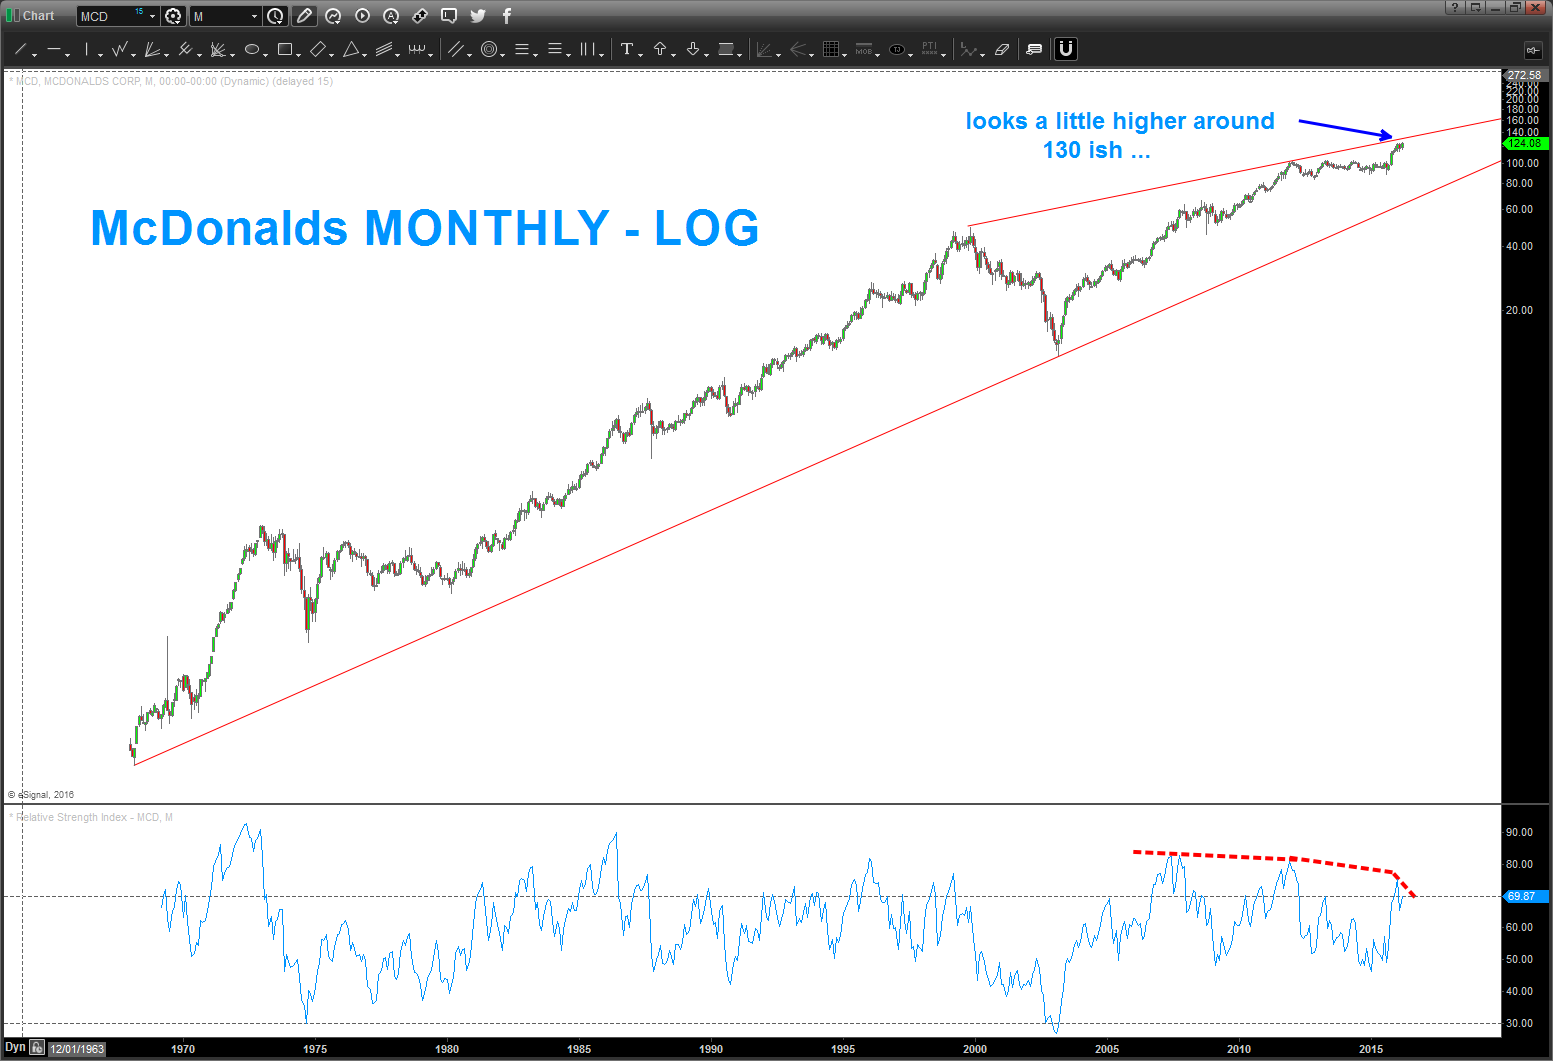
- the “top to top” trend line looks like it wants to go a little higher – 130 ish?
- note the “bearish divergence” in that $MCD makes new highs BUT the RSI doesn’t …important.
What about Volume? (are people buying it up here?)
I’m going to chalk it up to …nothing too crazy. Volume is “good”
Now, EVERYTHING, I “Really Need to Know I learned in Kindergarten” (I actually mentioned this during my CMT talk at the convention a couple years ago). But, seriously, I want to make mention that what you see below is 1) real time (I didn’t do it and then publish it – it just looks parabolic) and 2) simply based on geometry we learned back in Elementary School.

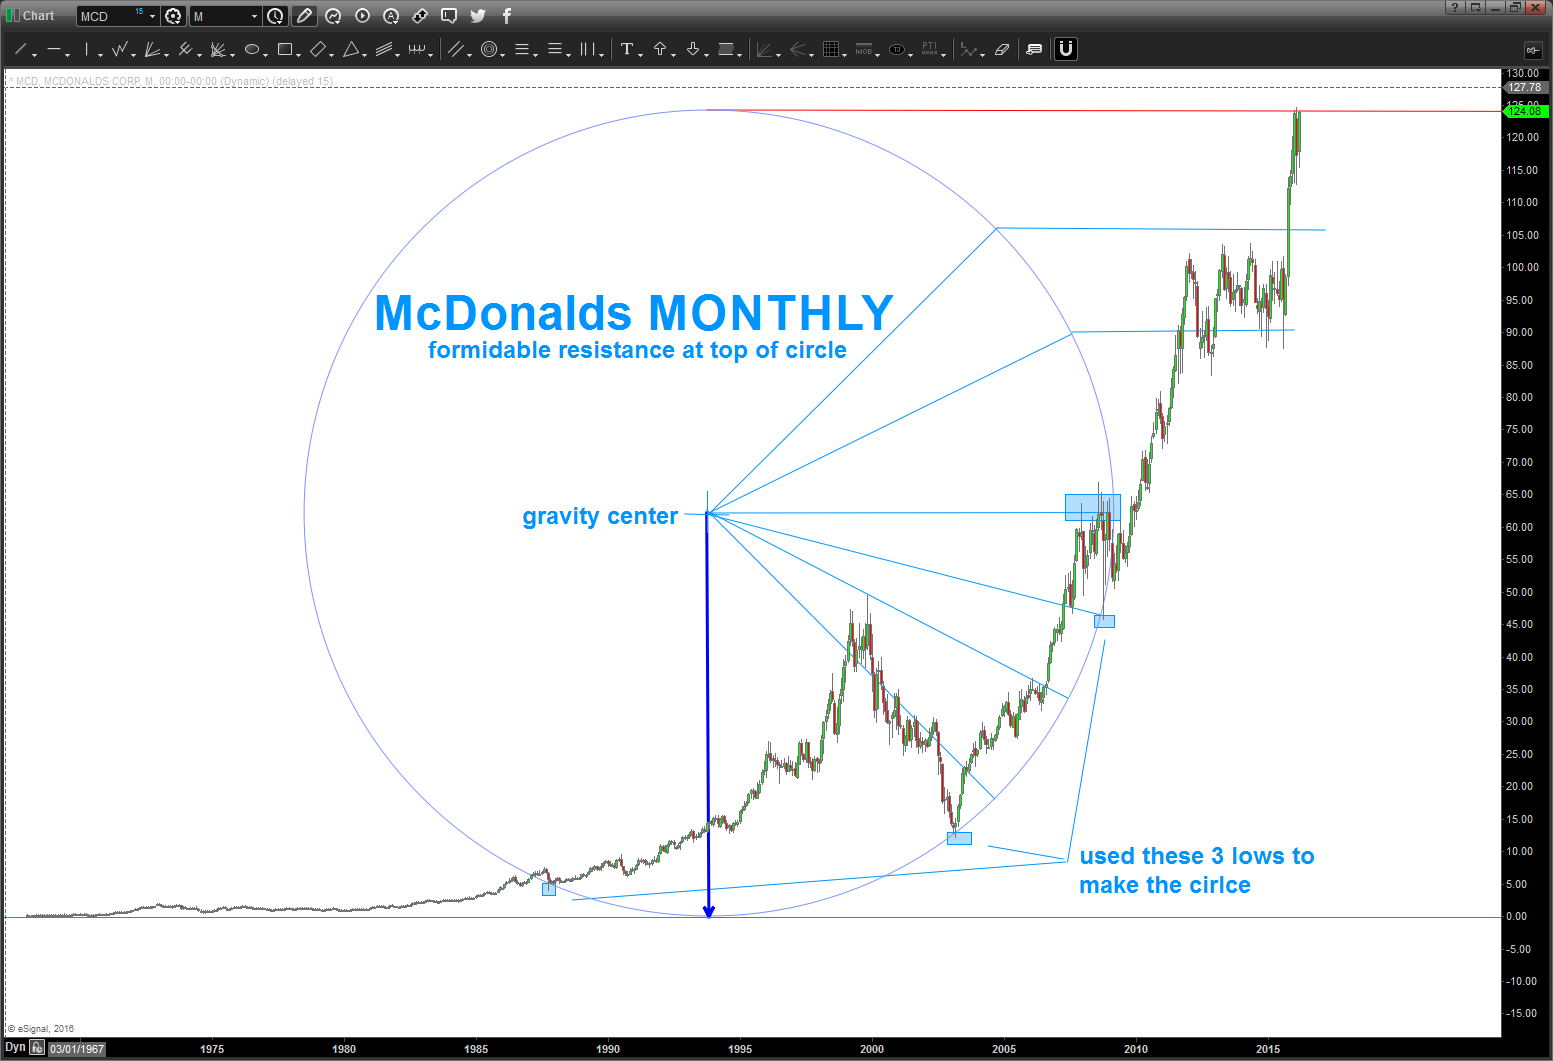
Let’s take 3 points and figure out how to make a circle ….? OK?
http://www.mathopenref.com/const3pointcircle.html
Here’s the end result for $MCD:
Again, if your a first time or new reader of the blog you’ll think “I curved fit this” or “did it first and then published it”. For those of you who know me – you know I wouldn’t do that. So, I didn’t …
What is going on here? Well, do you think, for one moment, that all the circles, squares, triangles, pyramids, etc. were built and created for the heck of it? OR, possibly, they were using these angles and natural order to convey higher, powerful but very simple truths?
If you study this chart, you’ll see that I drew “Gann Angles” (musical angles) from the gravity center and where the lines intersected the circle we had horizontal prices support or resistance and vertical time components.
Anyway, were tapping against the top of THE circle and w/ the bearish divergence present believe it might be time to have “one last” super size and step aside. WOULD NOT SHORT THIS STOCK UNTIL WE HAVE A MONTHLY/WEEKLY SIGNAL REVERSAL CANDLE. (the low of the high candle is taken out by a daily, weekly or monthly CLOSE below)
B
