I STILL think this is a big deal … Utilities… an update
Posted on August 24, 2017 1 Comment
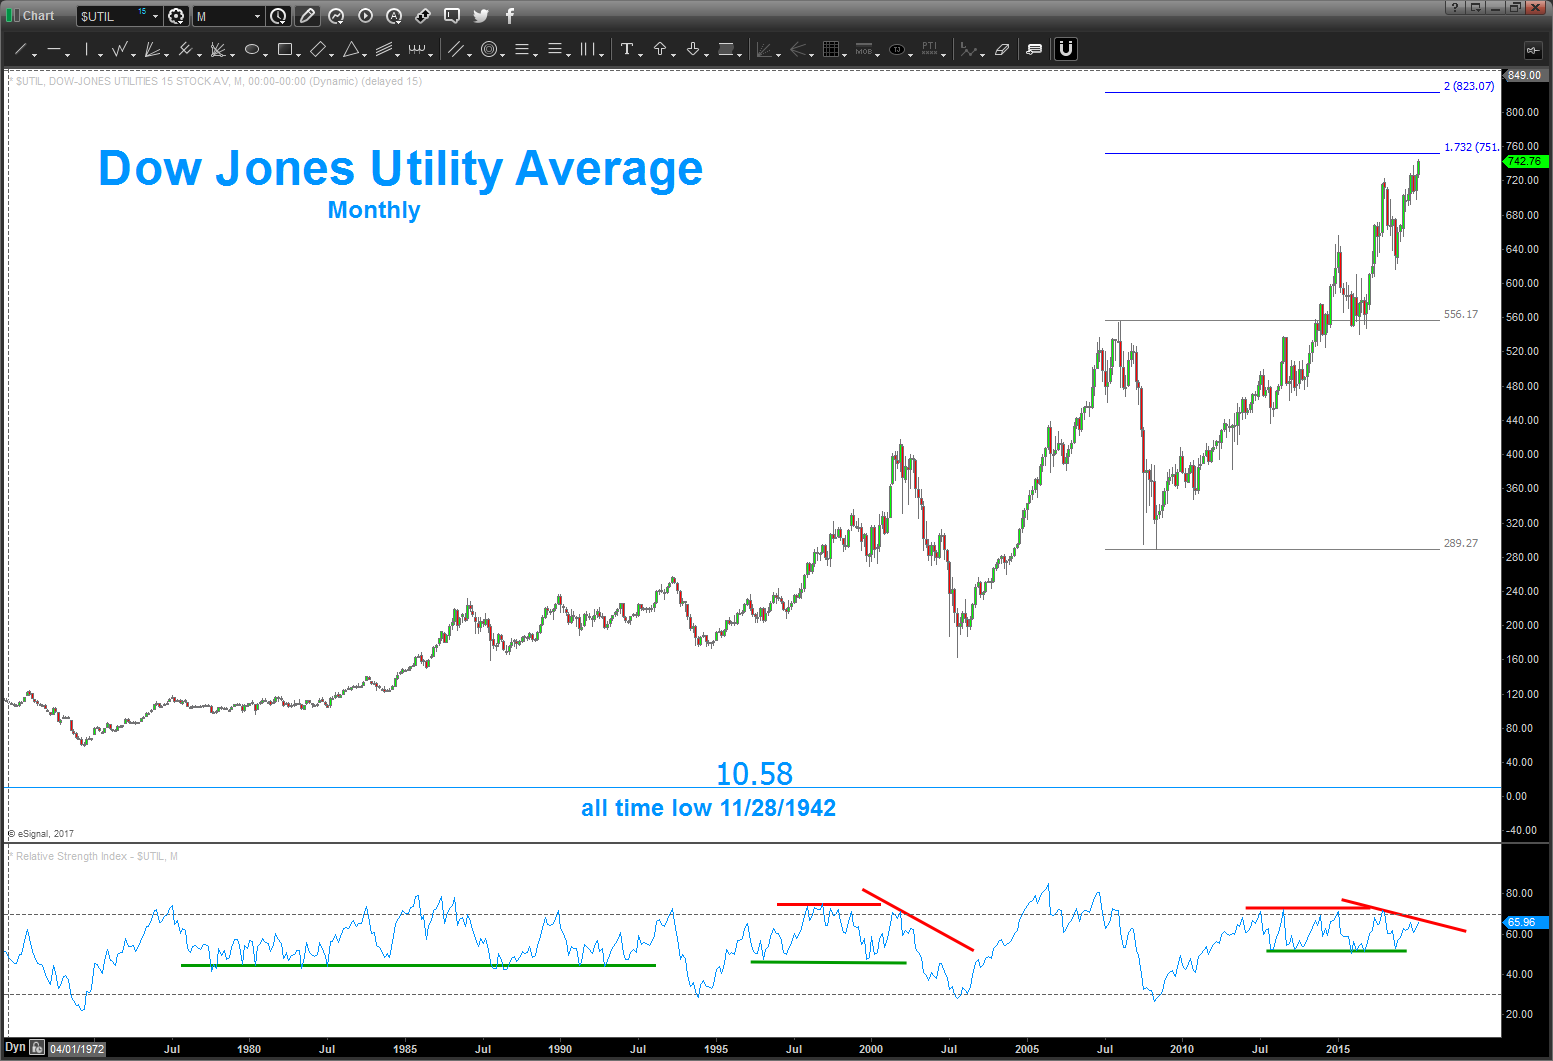
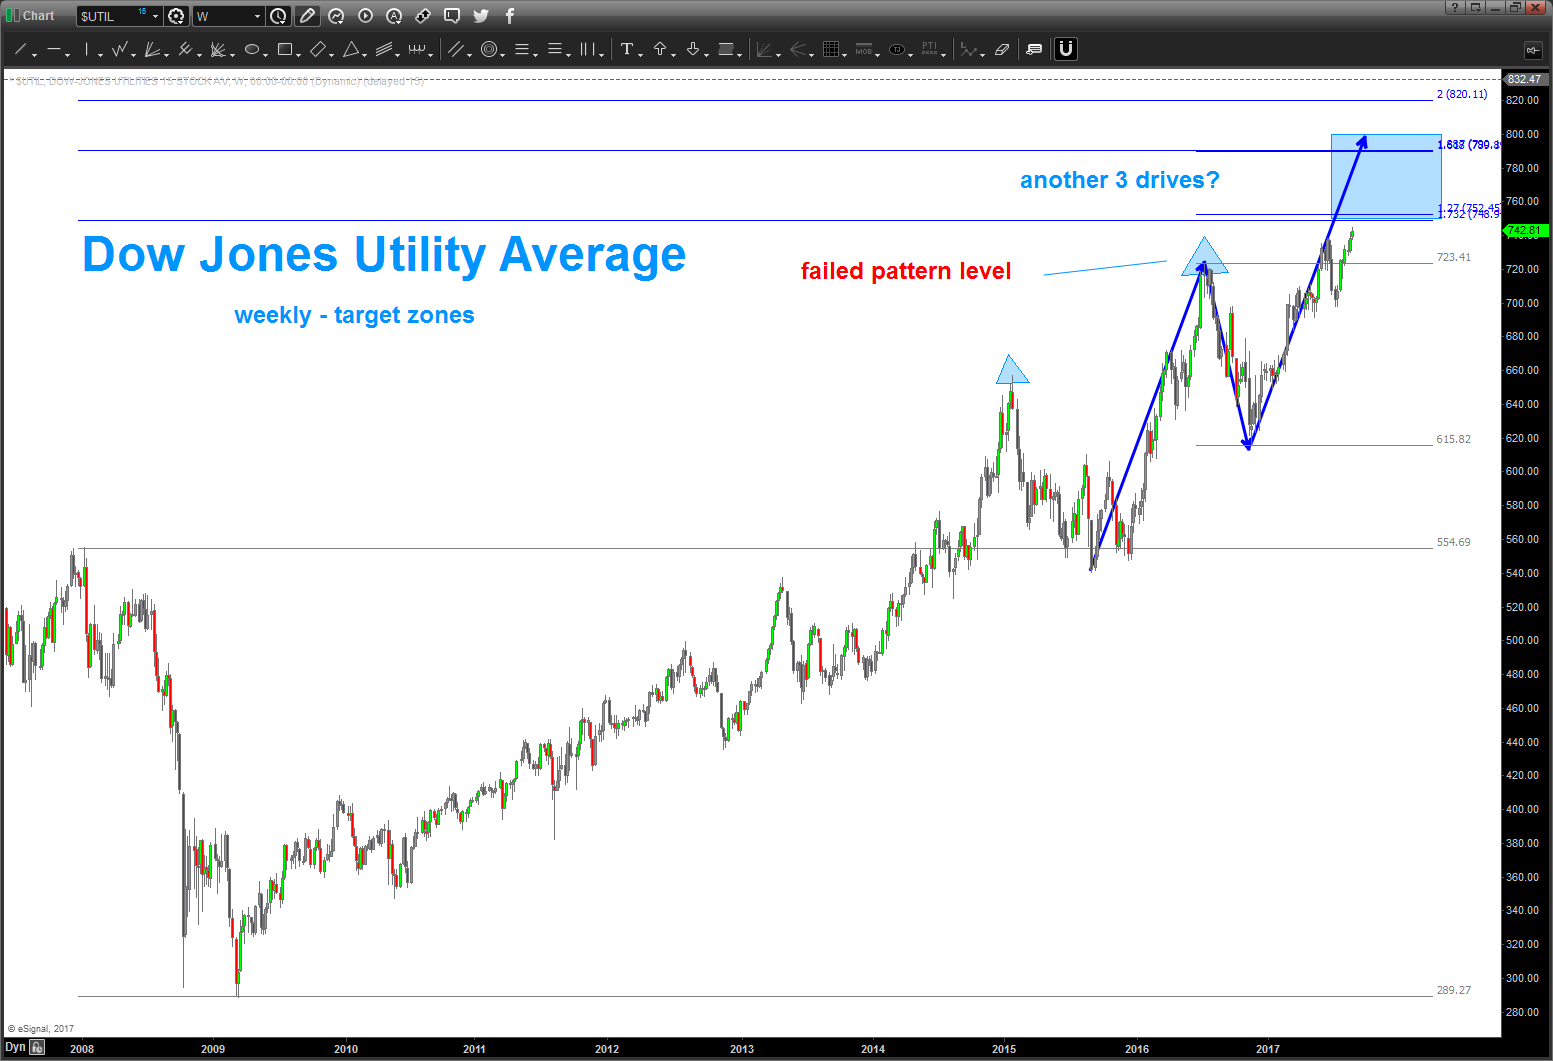
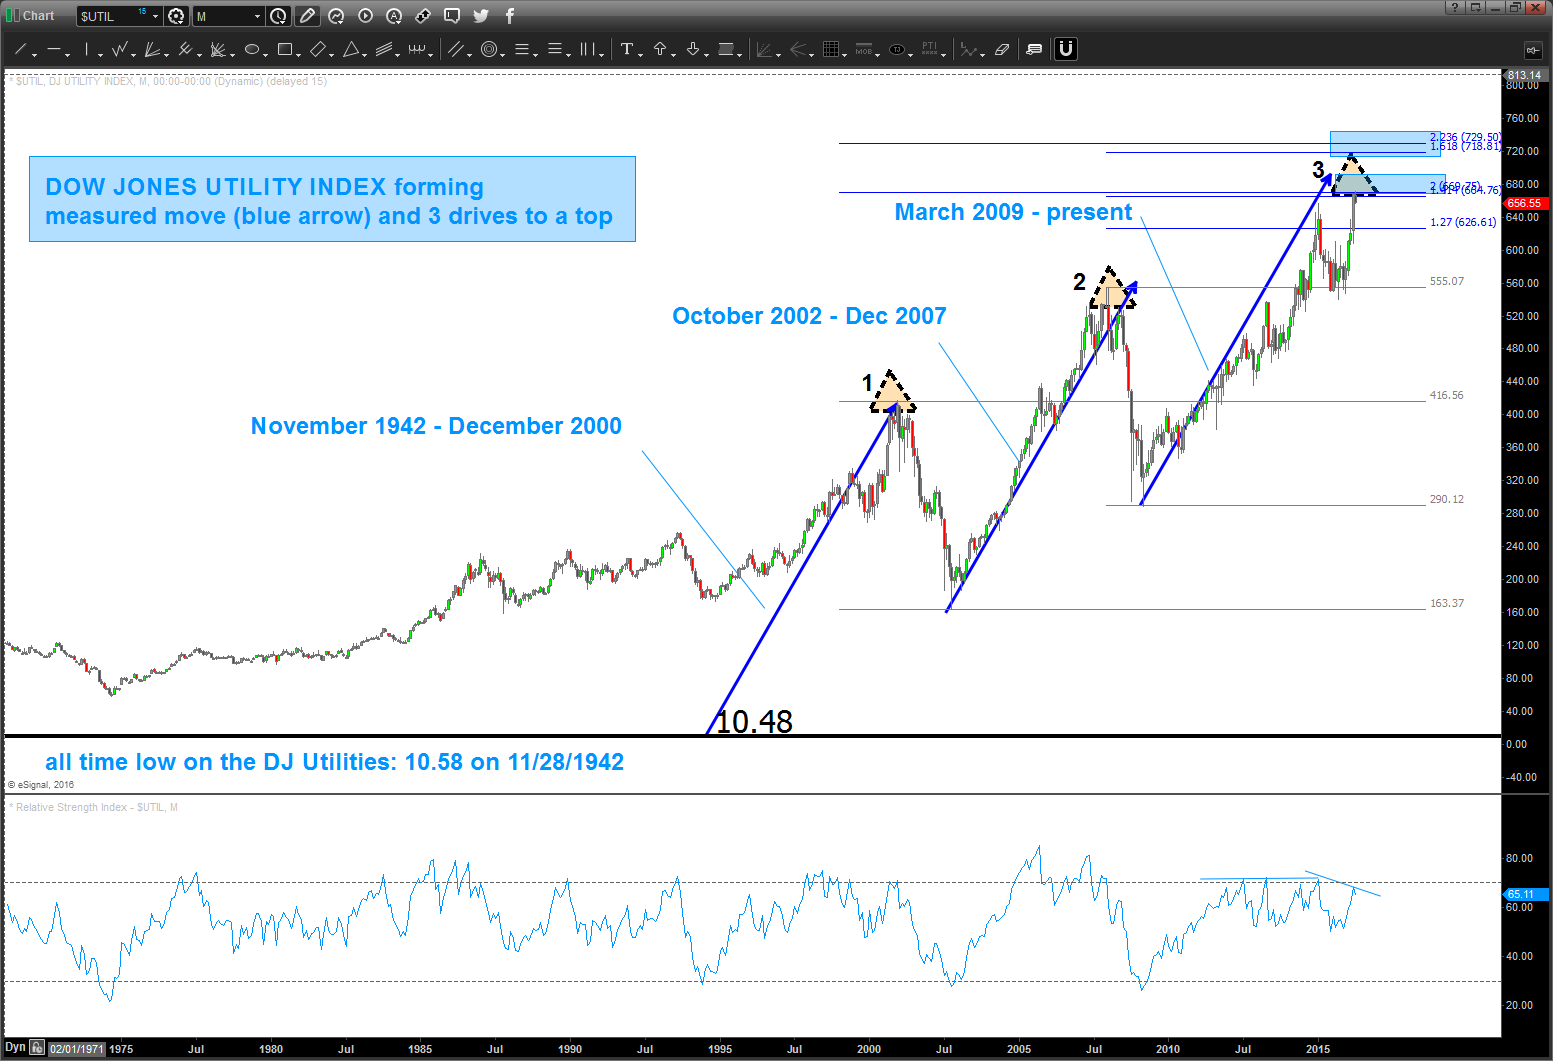
08/24/2017 – hard to believe it’s been a YEAR since I last posted on the Utilities … at the time, as you can see below, the DJ Utilities Average was about to equal it’s measured move (the blue arrows) along w/ hitting a 3 drive monthly pattern at the 2nd drives 1.618 expansion target. The market DID REACT but not in the manner expected. While this number did stop the market in it’s tracks, we have ultimately blown thru this pattern and it has now failed. Folks, that is a big deal … monthly patterns like this are USUALLY (the operative word) walls of china for support or resistance.
So, as long as the Utilities are continuing higher … rates ain’t budging in my mind.
You can also see below some ‘future’ targets to consider.
Wow, that was an epic failure of a monthly pattern …
Bart
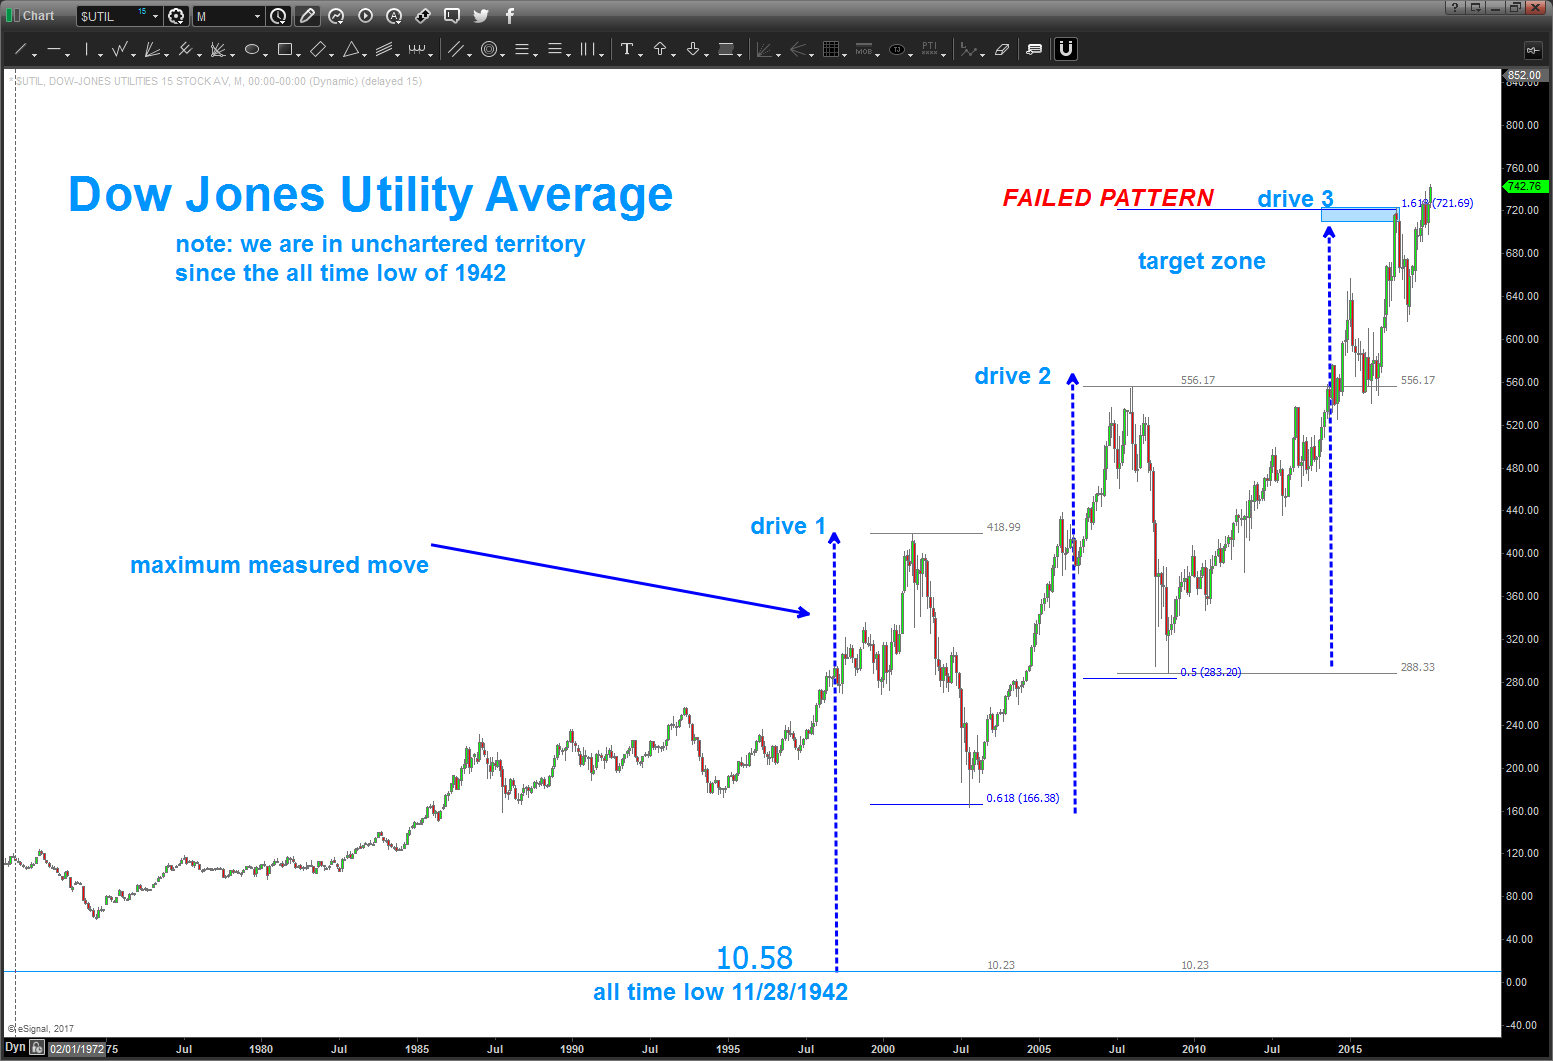
August 7, 2016 – are the Utilities cracking? Historically, they have NEVER gone farther than the measured moves shown from the post 6/6/2016. Stay tuned. the point we are trying to make here is that when these blue measured moves are present AND a perfect 1.618 extension is present THEN the Utes have correct either 46 or 60 percent. here’s the question – are you ready for THAT? watch the close on Friday for more weakness coming confirmation.
Bart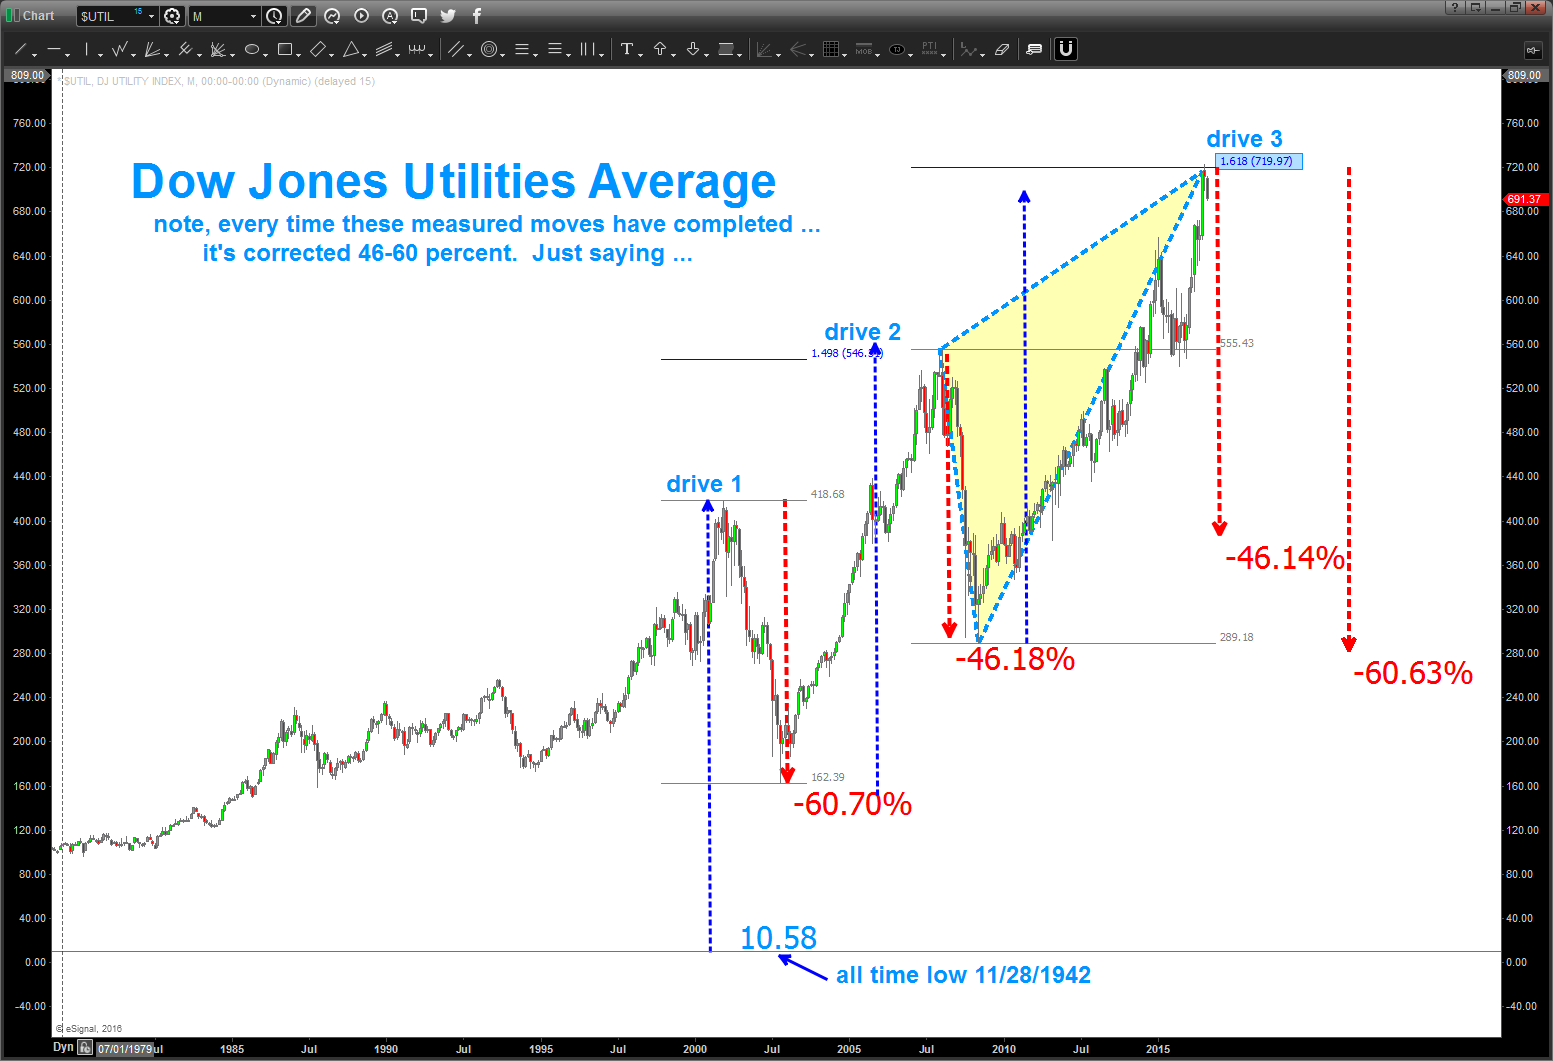
6/06/2016 – were rolling right up into the target zone w/ monthly bearish divergence. yes, I still think this is a big deal and begs of caution … in 26,854 days Utilities have never gone farther w/out a major correction. Questions?
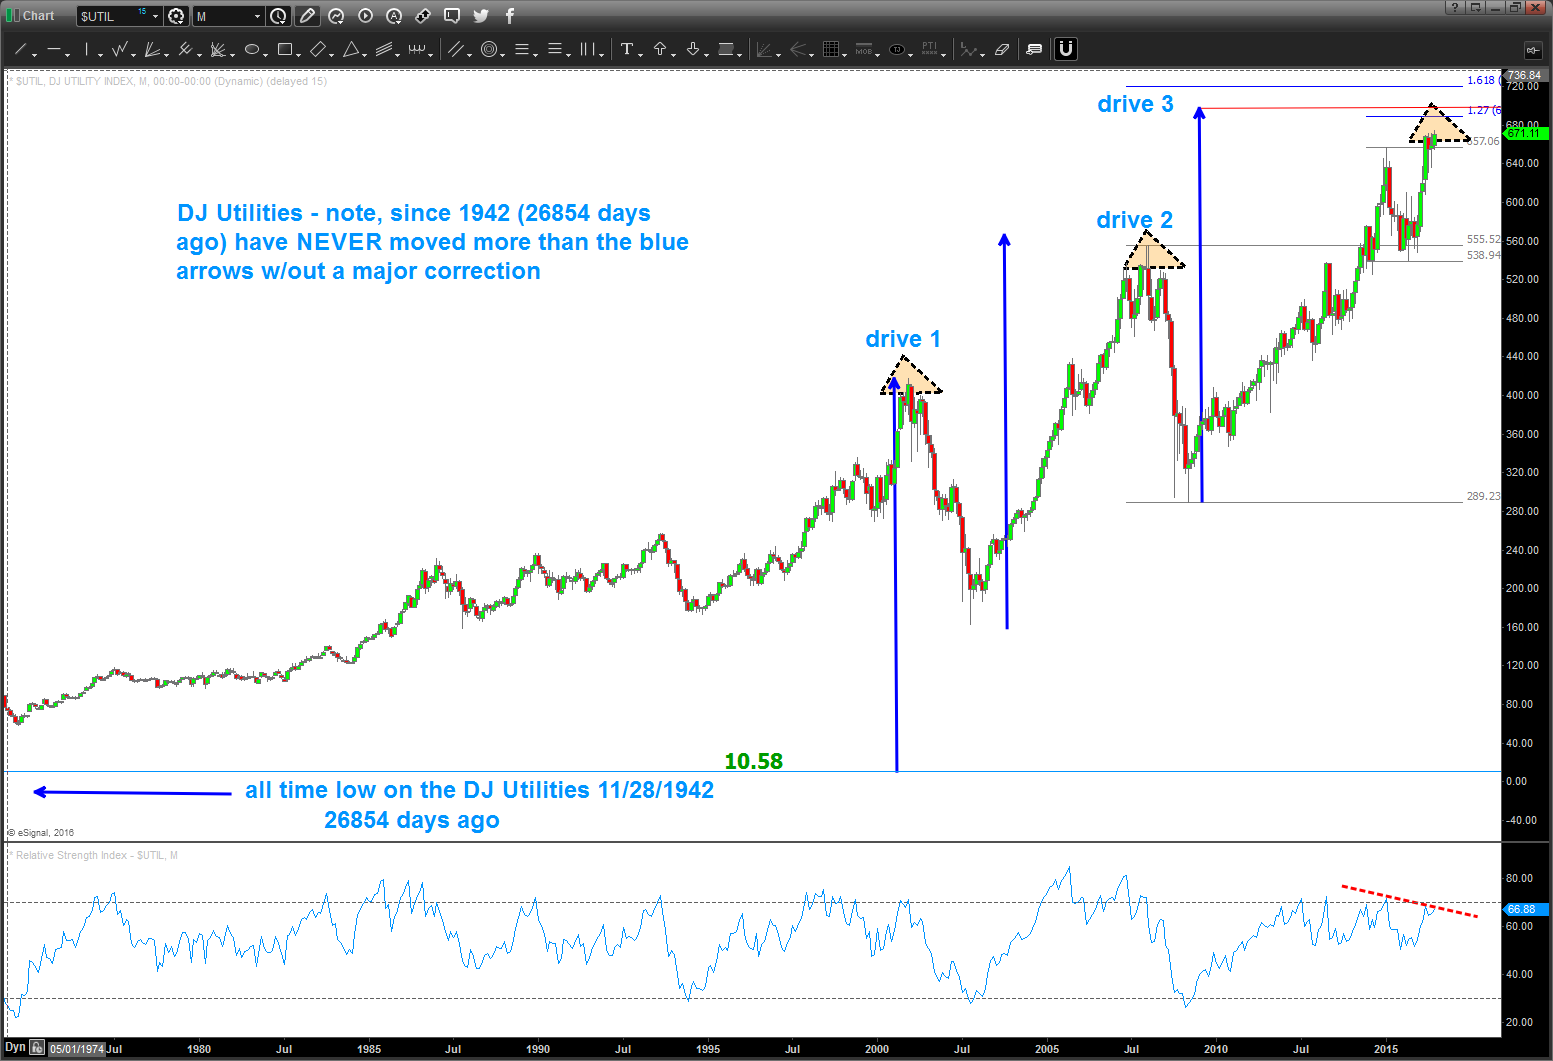
going to show this chart again of the Utilities … watch closely, the upper target is pretty darn close. Since the low in the 1940’s the Utilities have never gone farther than this (or close to this – still some upper targets) w/out a major pullback.
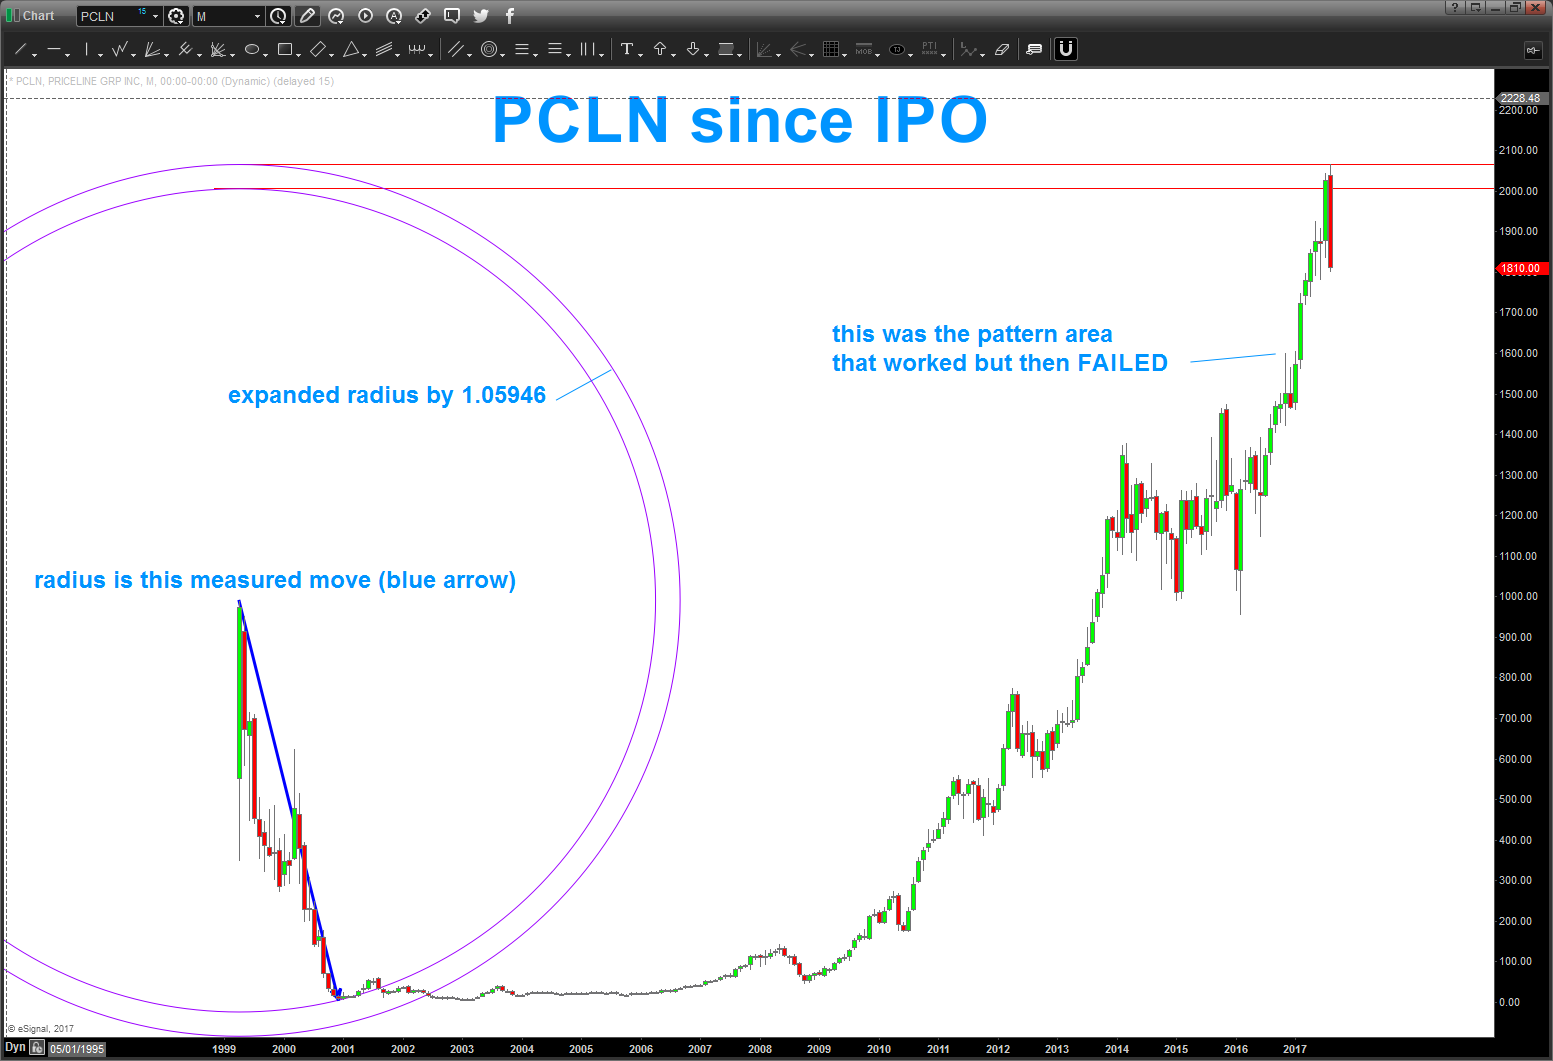
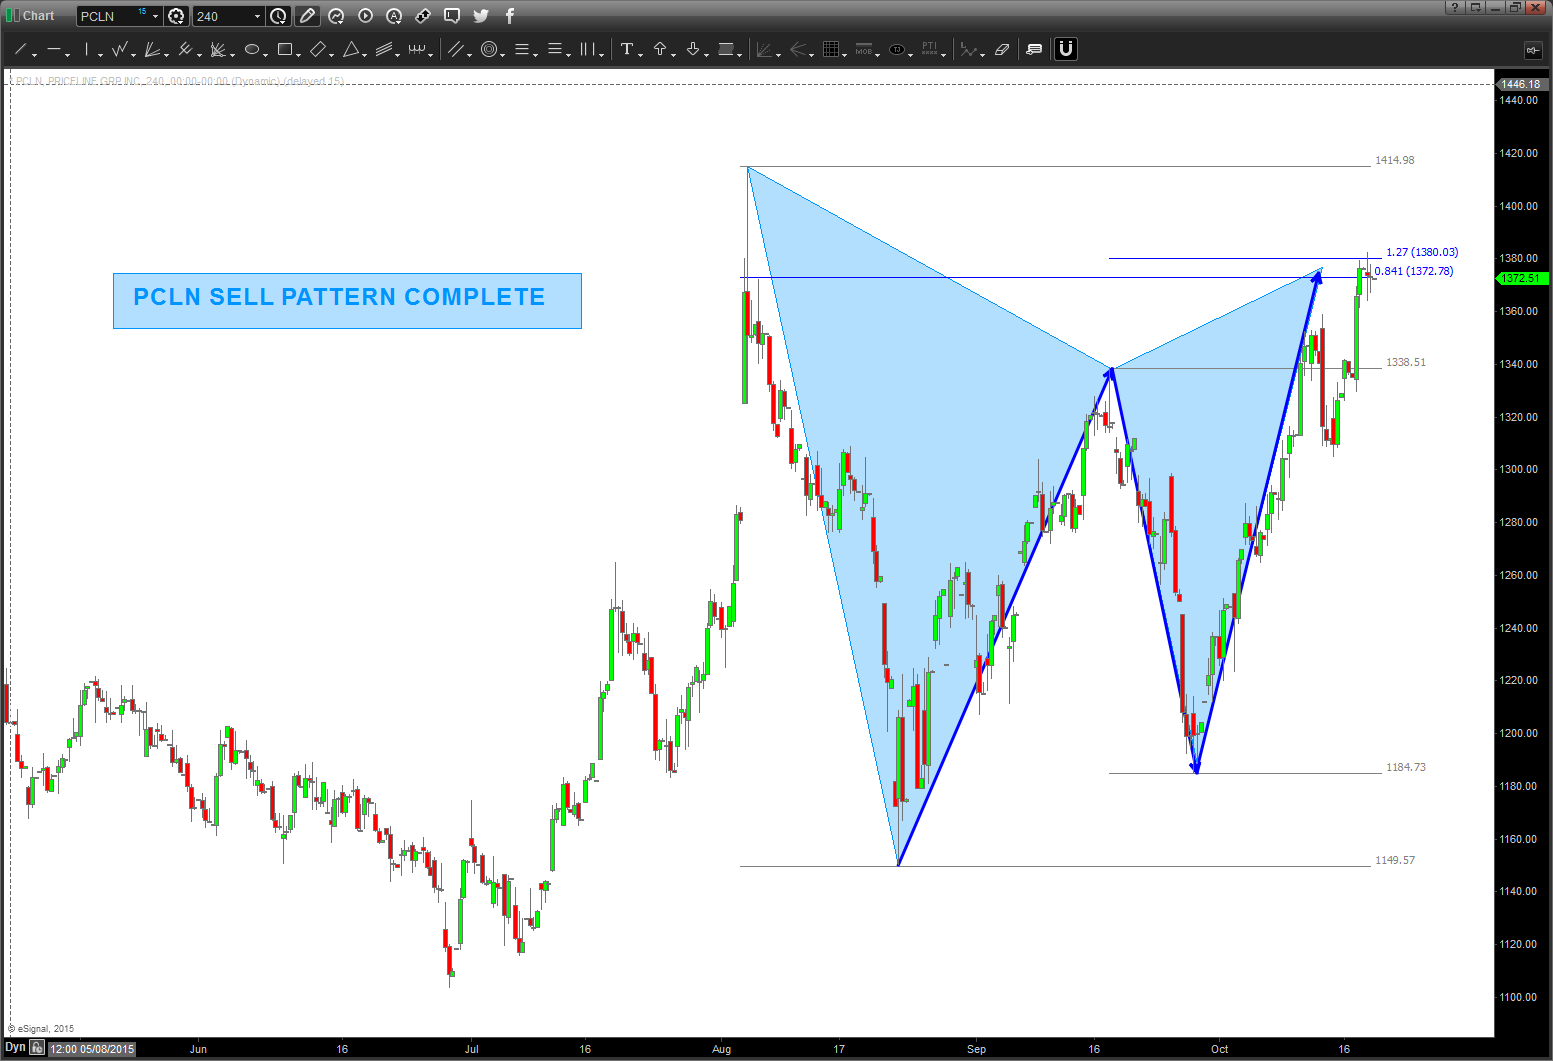
PCLN continuing to monitor and update as an FYI it hit the top of the circle!
Posted on August 18, 2017 Leave a Comment
08/18/2017 – been a long time since we looked at PCLN. Frankly, when a pattern like the one at 1600 fails, it’s just time to step aside. so, today, I took a peak at the first big move down and the eye was drawn to the radius.
so, in the world I live … it appears that it the top of the circle. That’s the reason for the sell off occurring now.
🙂
Bart
PS – will try to update for the next opportunity.
————————————————–
1/21/2016 – continuing to update. note, didn’t go down and complete the pattern. Support held at 1459.
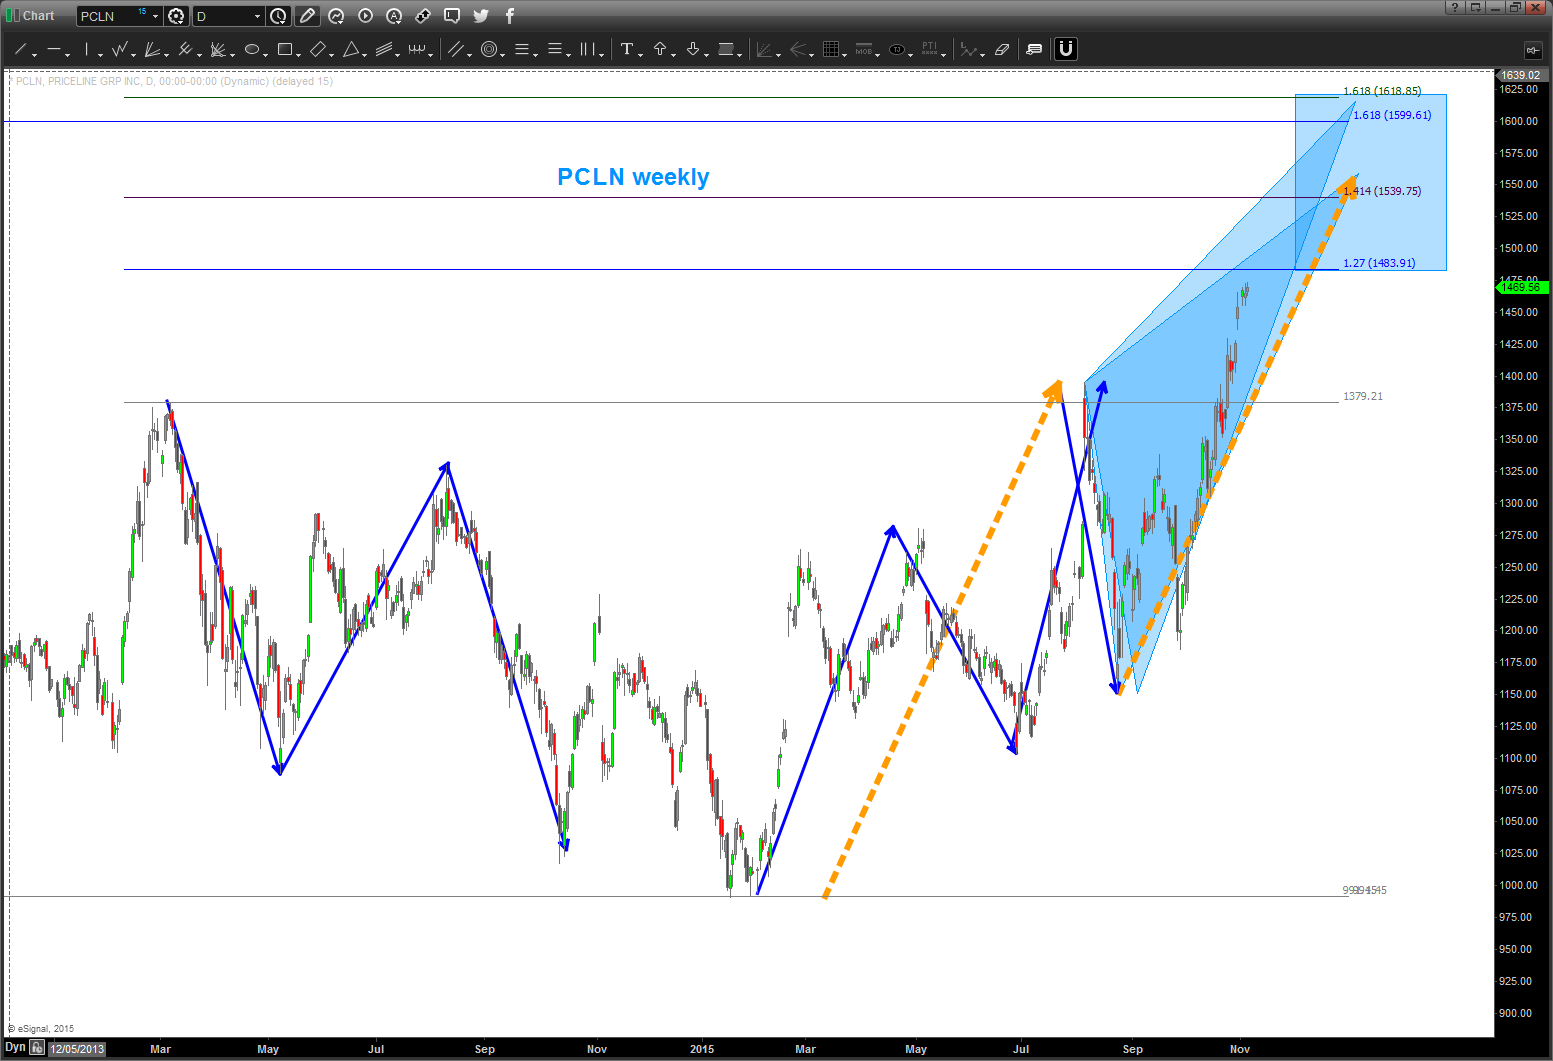
where are we now … we have 3 ratio’s coming together at current levels but could go up to 1560 or 1570… monitor the 1528 and 1515 level closely as DAILY closes below those levels could spell trouble.
again, read down below when everything came together at 1600. that is why I still favor the downside.

12/30/2016 – PCLN seeking to fill gaps? note the first target is the ‘basic’ ab=cd at 1431. also, read below … the 1600 level was the convergence of 5 major patterns.
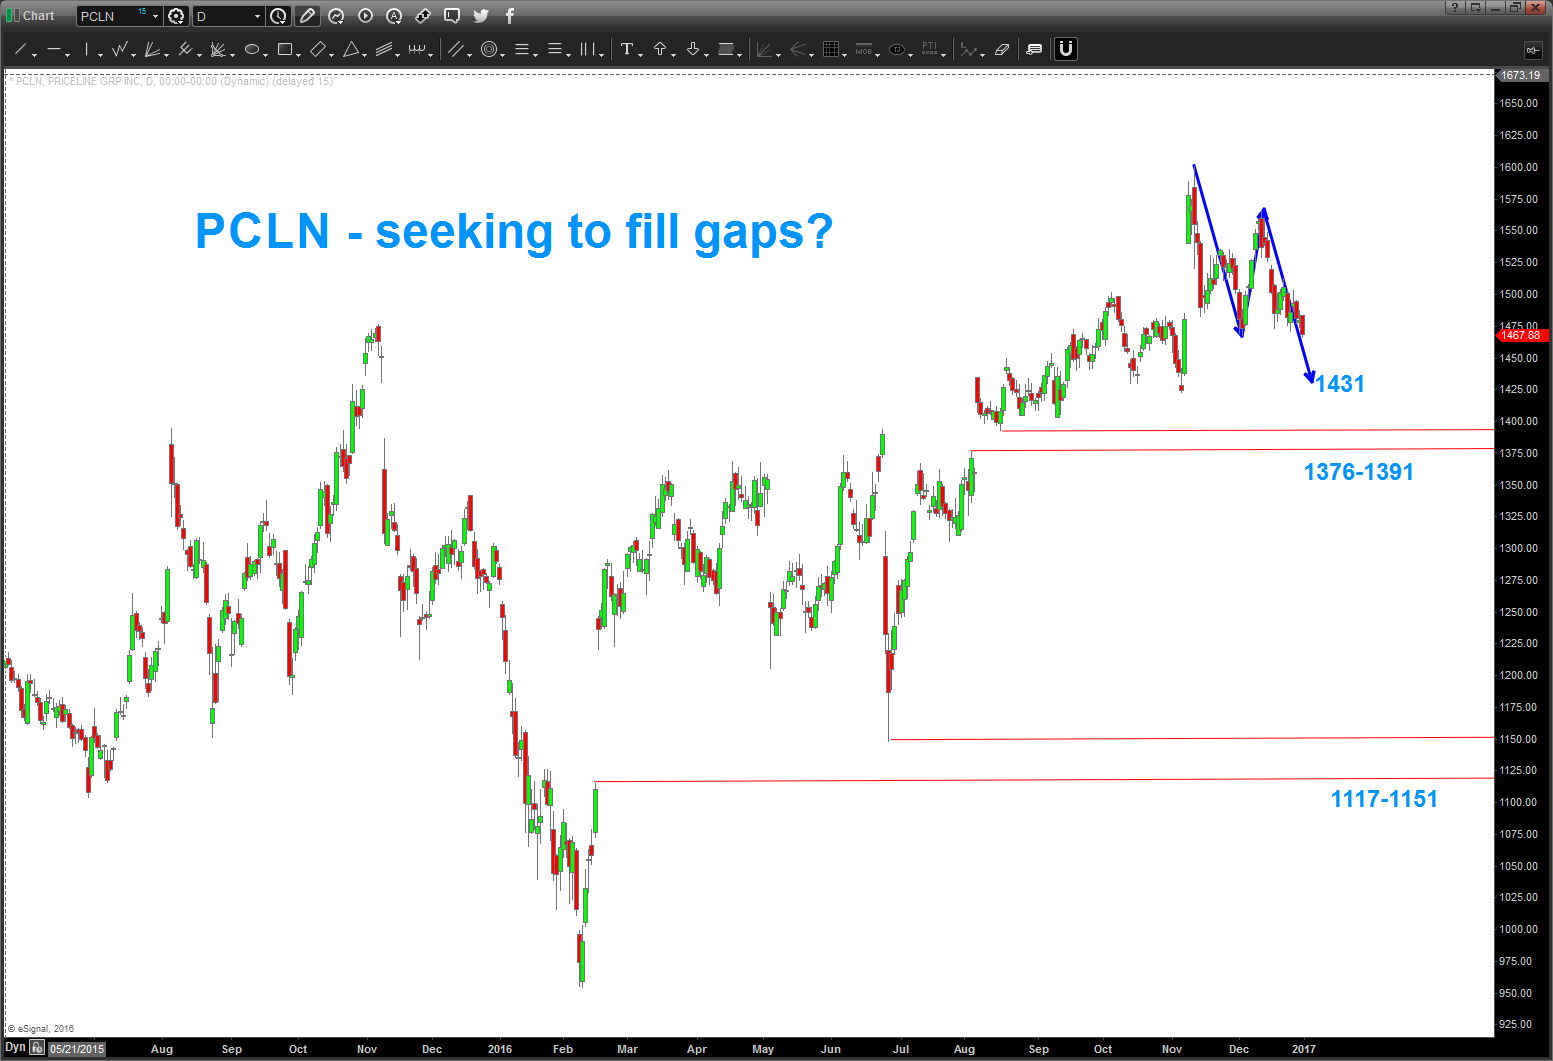
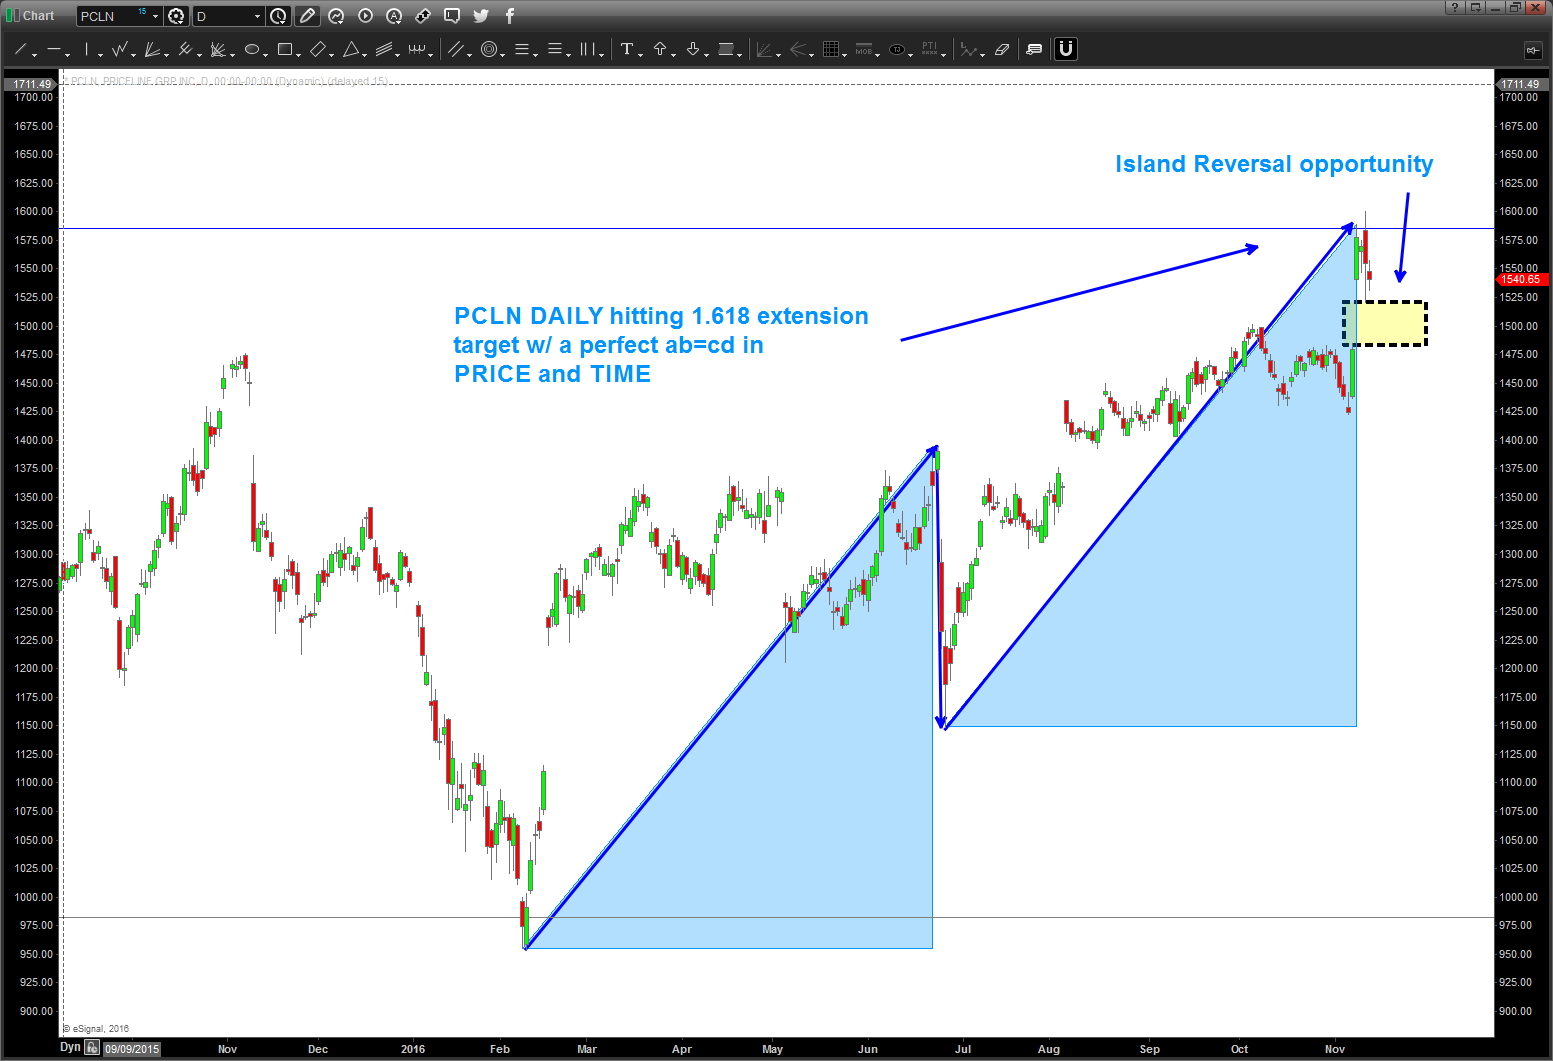
11/12/2016 – well PLCN went up and hit the level shown below. Folks that’s 5 monthly patterns on PCLN. IT SHOULD BE MONSTEROUS RESISTANCE for PCLN to go higher. As always, patterns do fail and they do work so it’s all probability. Also, when we go down to the daily time frame NOTE the perfect AB-CD in price and time. This completed the butterfly sell pattern and it’s extremely helpful when TIME of the last leg of the butterfly balances itself …also, note the ‘classic island reversal opportunity” where all we need to complete is a gap down below the shaded yellow box and this puppy could get rolling.
last thing – there are targets a little higher so any strategy should take that into account ..but, for now, we have 5 MONTHLY PATTERNS COMPLETING ON PCLN.
TAKE NOTE!
Bart
10/9/2016
PCLN found support on the “polarity” from the IPO and, essentially, negated the mirror image foldback pattern discussed below. What now?
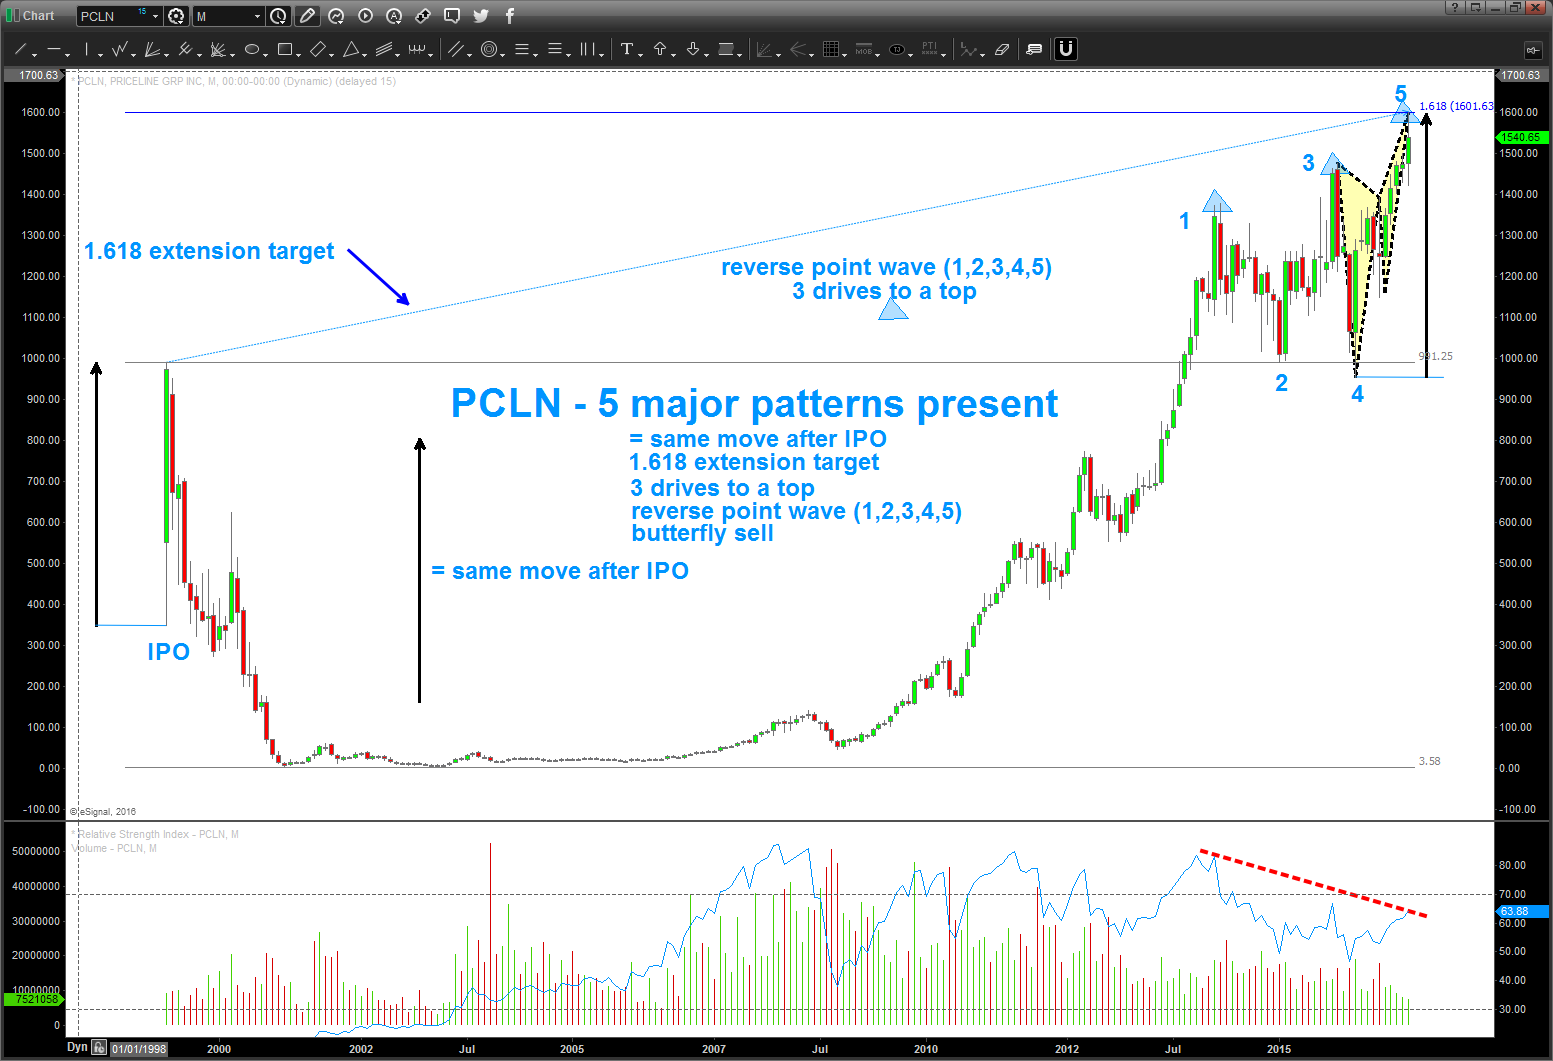
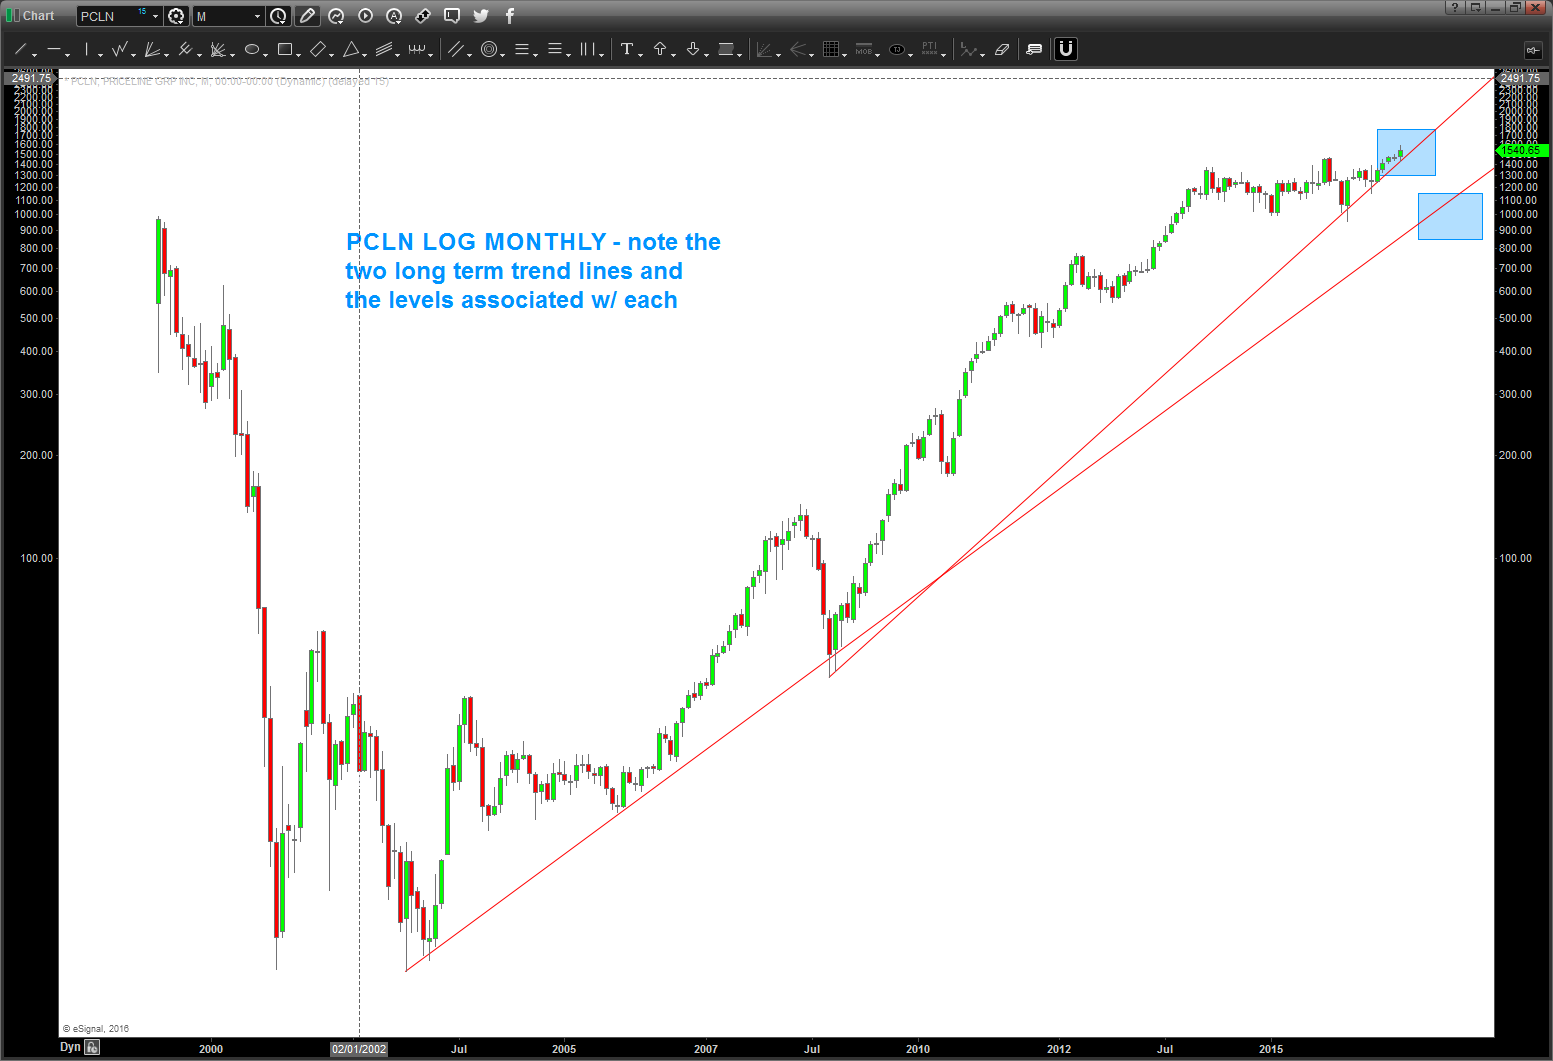
If you take a look at the long term chart, again, you’ll see some powerful sell patterns all coming together. as for right now, appears we are in no mans land w/ no pattern (buy or sell) present.
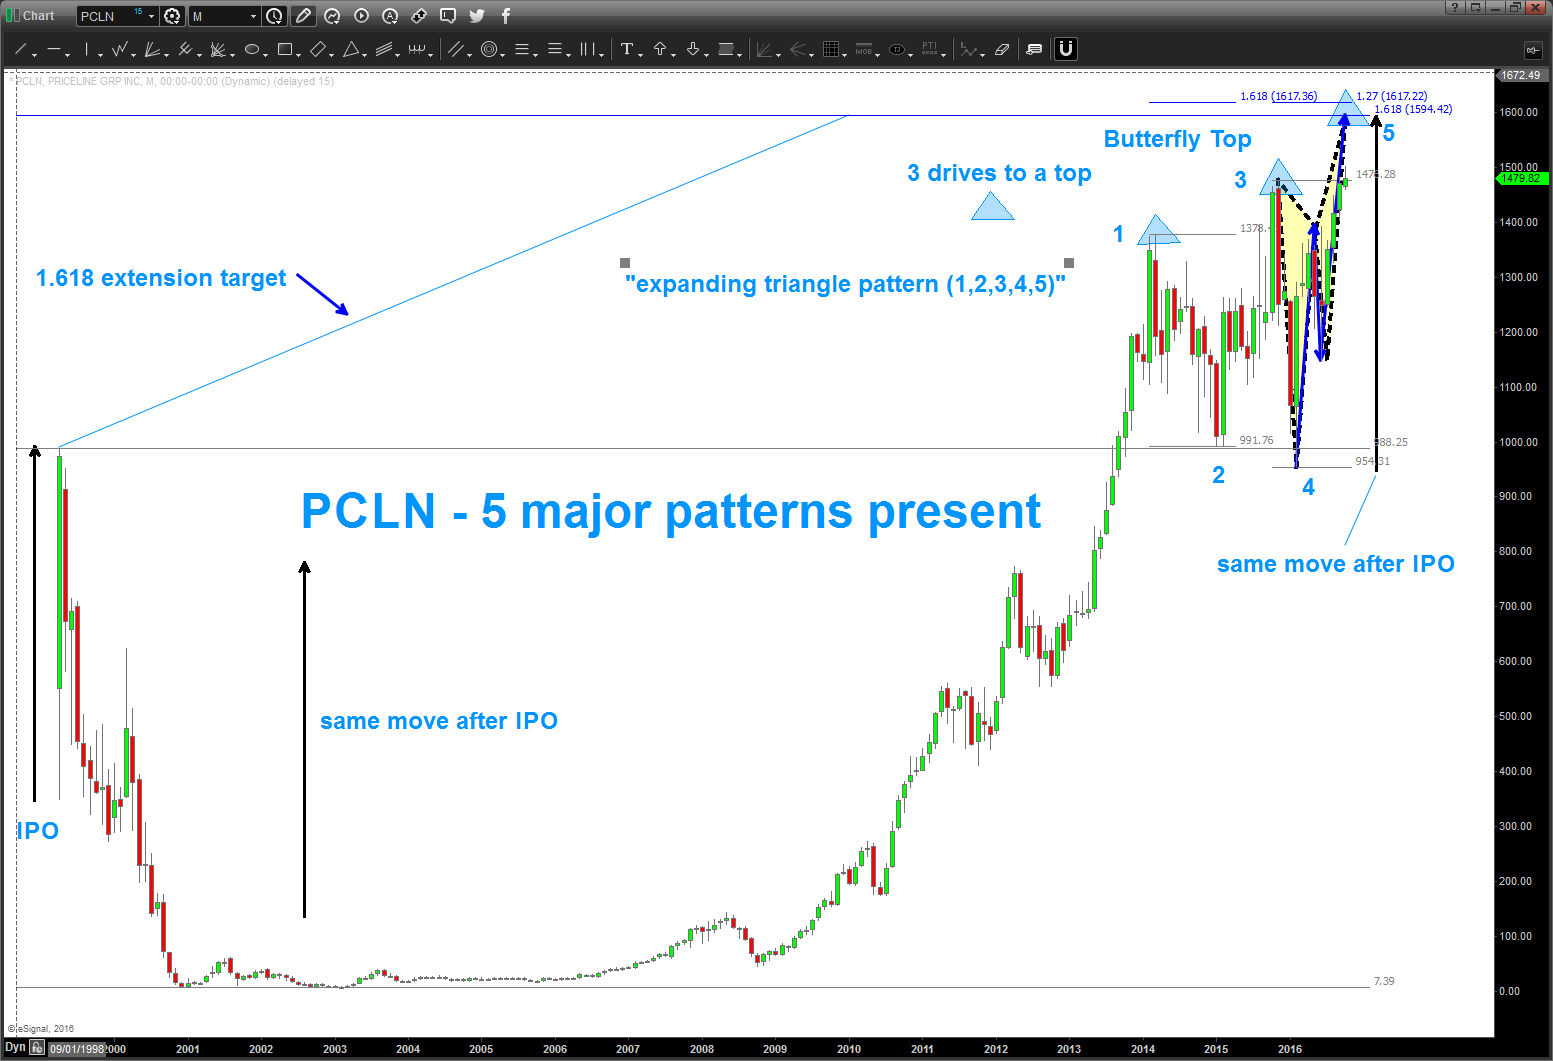
here’s the patterns present:
- 1.1618 extension from the IPO high
- note the black arrow going up from the post IPO low to the IPO high. That same “move” is present into the target area. the black arrow is “copy” and “pasted” from the IPO to current market prices.
- 3 drive to a top – the blue triangles
- 1,2,3,4,5 reverse point wave
- a “perfect” Butterfly Sell pattern – (it has an AB=CD present in the last leg of the Butterfly)
who knows if it will get that high right now .. but certainly realize that 1600-1625 has a TON of resistance.
B
02/01/2016
as you can see below, the light blue trend line below was taken out. now we are approaching major support as shown by the polarity principle. some bid thrust/candles going into this level so this will be a key test in the coming days/weeks. if we lose this level, then expect 1.27 level to be attacked in the high 800’s.

12/20/2015: update to PCLN.
one can see that this has been an amazing rocket ship.
one can also see below that I was “seeing” a top coming in and tried the mirror image foldback, which from a price perspective DID NOT work. then, you can see that I was “seeing” a butterfly pattern and that missed the target area by a few bucks.
so, in summary, let’s watch the key low to high trend line shown in the chart below. also note the TIME symmetry around the foldback points. I missed that below, but that actually lends some credence to a potential big top.
this one has been tough .. but, then again, when you go from 3 dollars to 1450+ it’s going to take some time to digest.
anyway, for those who asked me, hope this helps w/ the gameplan for $PCLN.
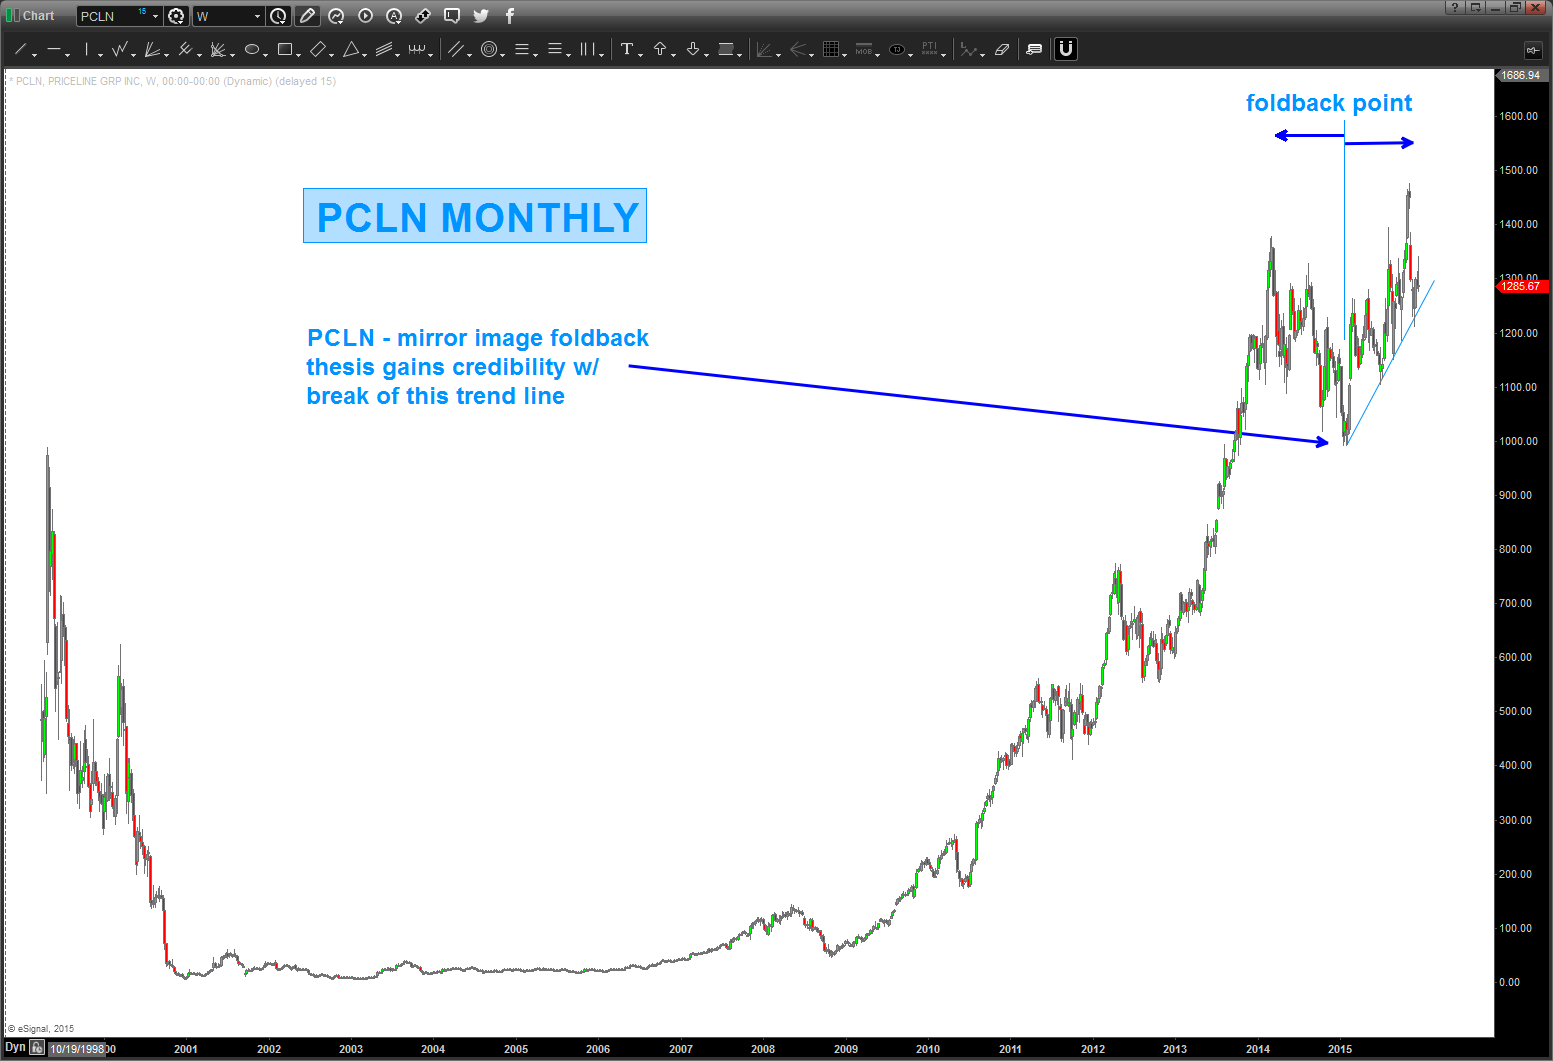
Folks, this mirror image got smoked. Much like the mirror image for Natural Gas … the mirror images fail at the inflection points and $PCLN has rolled thru the pattern. ERASE … ERASE…ERASE.
Where are we now?
Well, if we look at the candles you’ll see the 2nd largest monthly candle since the IPO occurred last month (OCT) So, we have 1484 coming in but it sure looks like momentum and thrust will carry it to the 1600 level. I’m going to spend some time on this one over the next couple days …
here’s the MONTHLY picture …
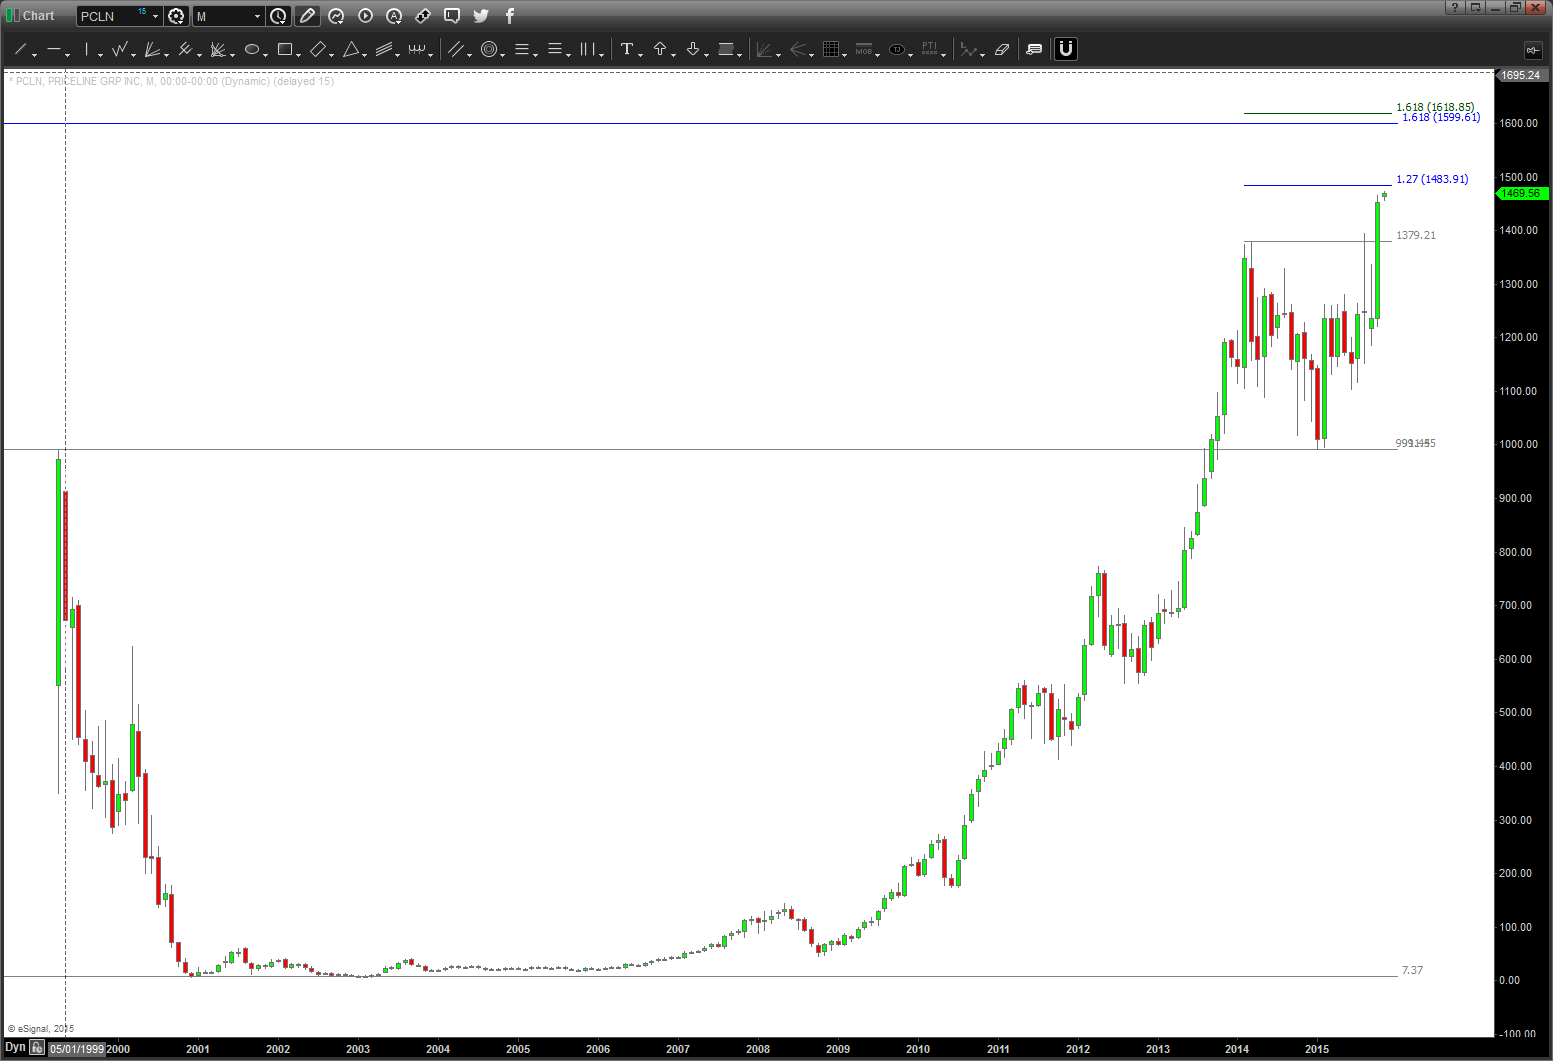
IF the mirror image foldback is in play THEN this pattern needs to hold and start down. a move below 1360 would bolster conviction that the mirror image mentioned earlier is in play.
keep an eye out on Solar … ratio analysis
Posted on August 7, 2017 Leave a Comment
my fellow CMT’r David Keller did an excellent post around solar stocks.
frankly, I never even looked at them before … so after reading the post I thought ‘why not do a TAN (solar ETF) / XLE (energy) ratio and see what it tells us …
certainly looks like we are coming close to the moment of truth where a ‘trend change’ in a long term log trend line breakout it possible.
put the solar world on your radar and watch this ratio closely …
Bart

STOXX Banks for a friend overseas …UPDATE to the UPDATE
Posted on August 5, 2017 6 Comments
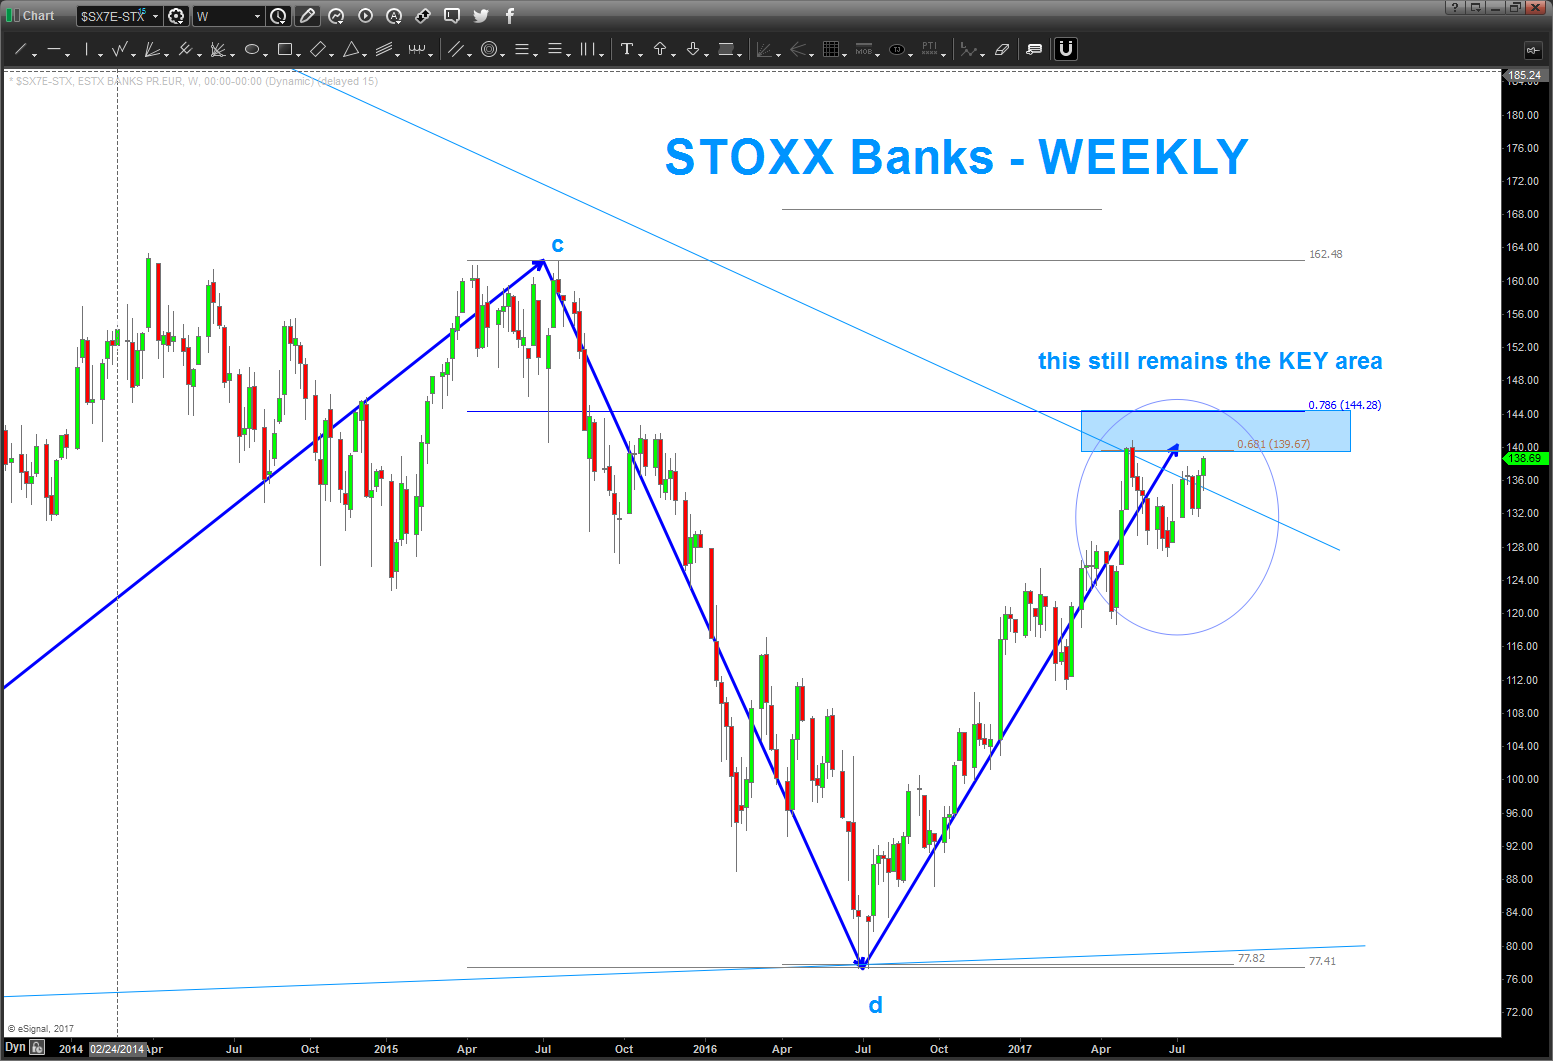
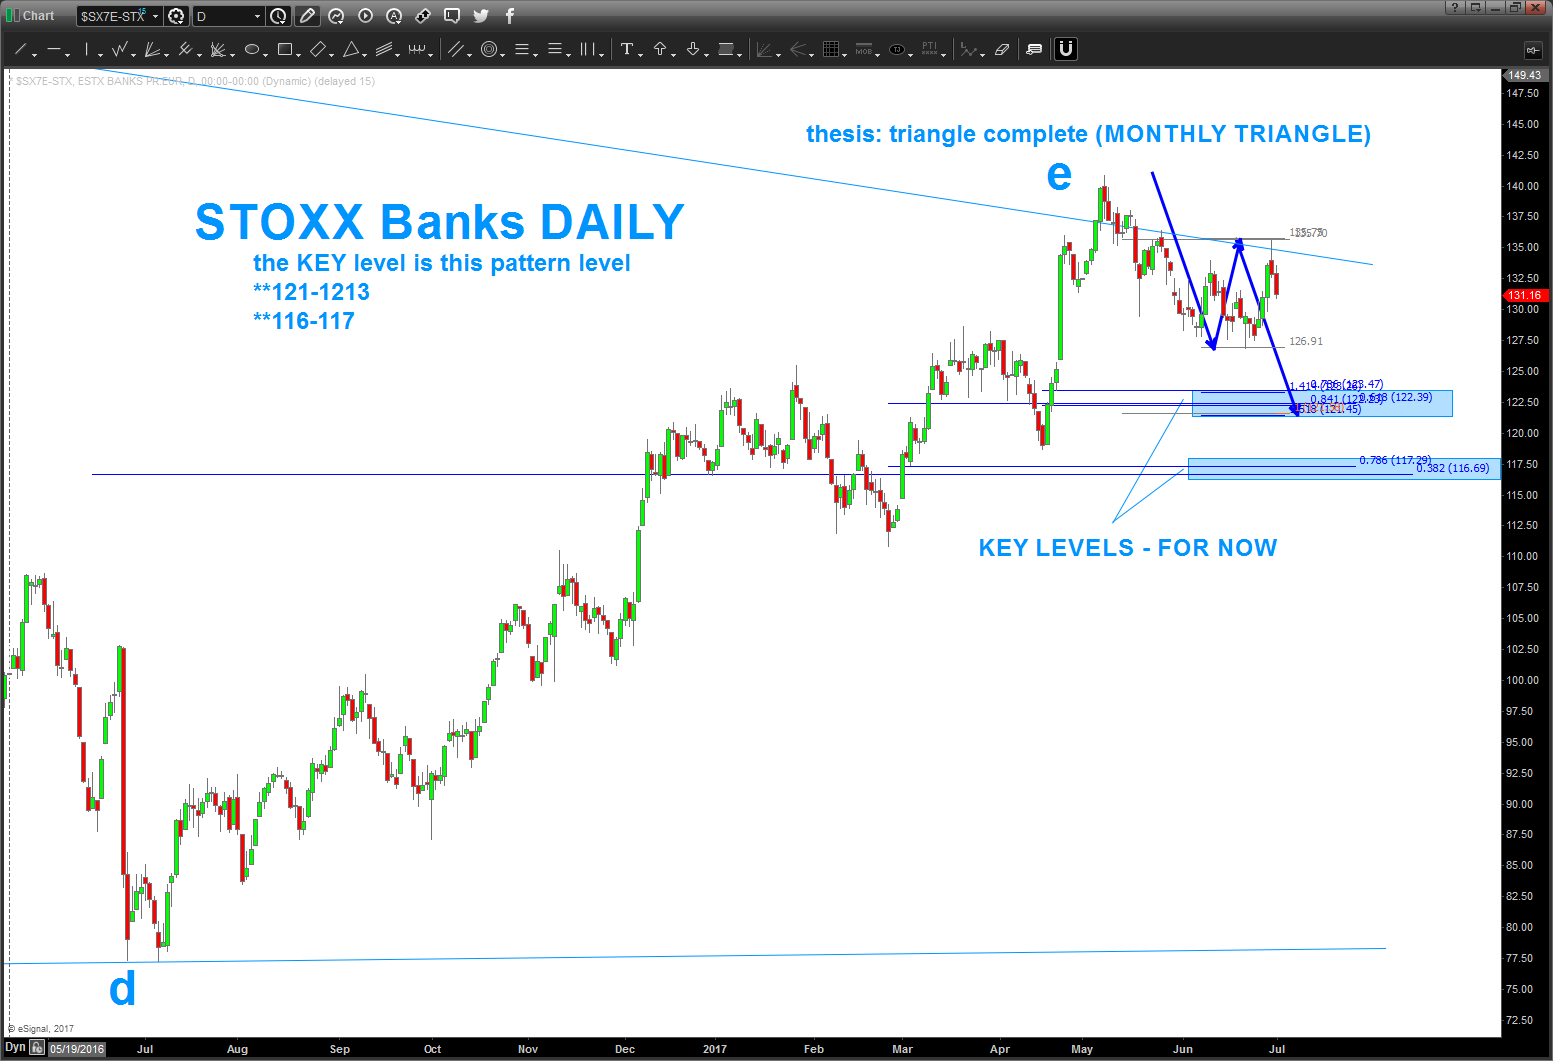
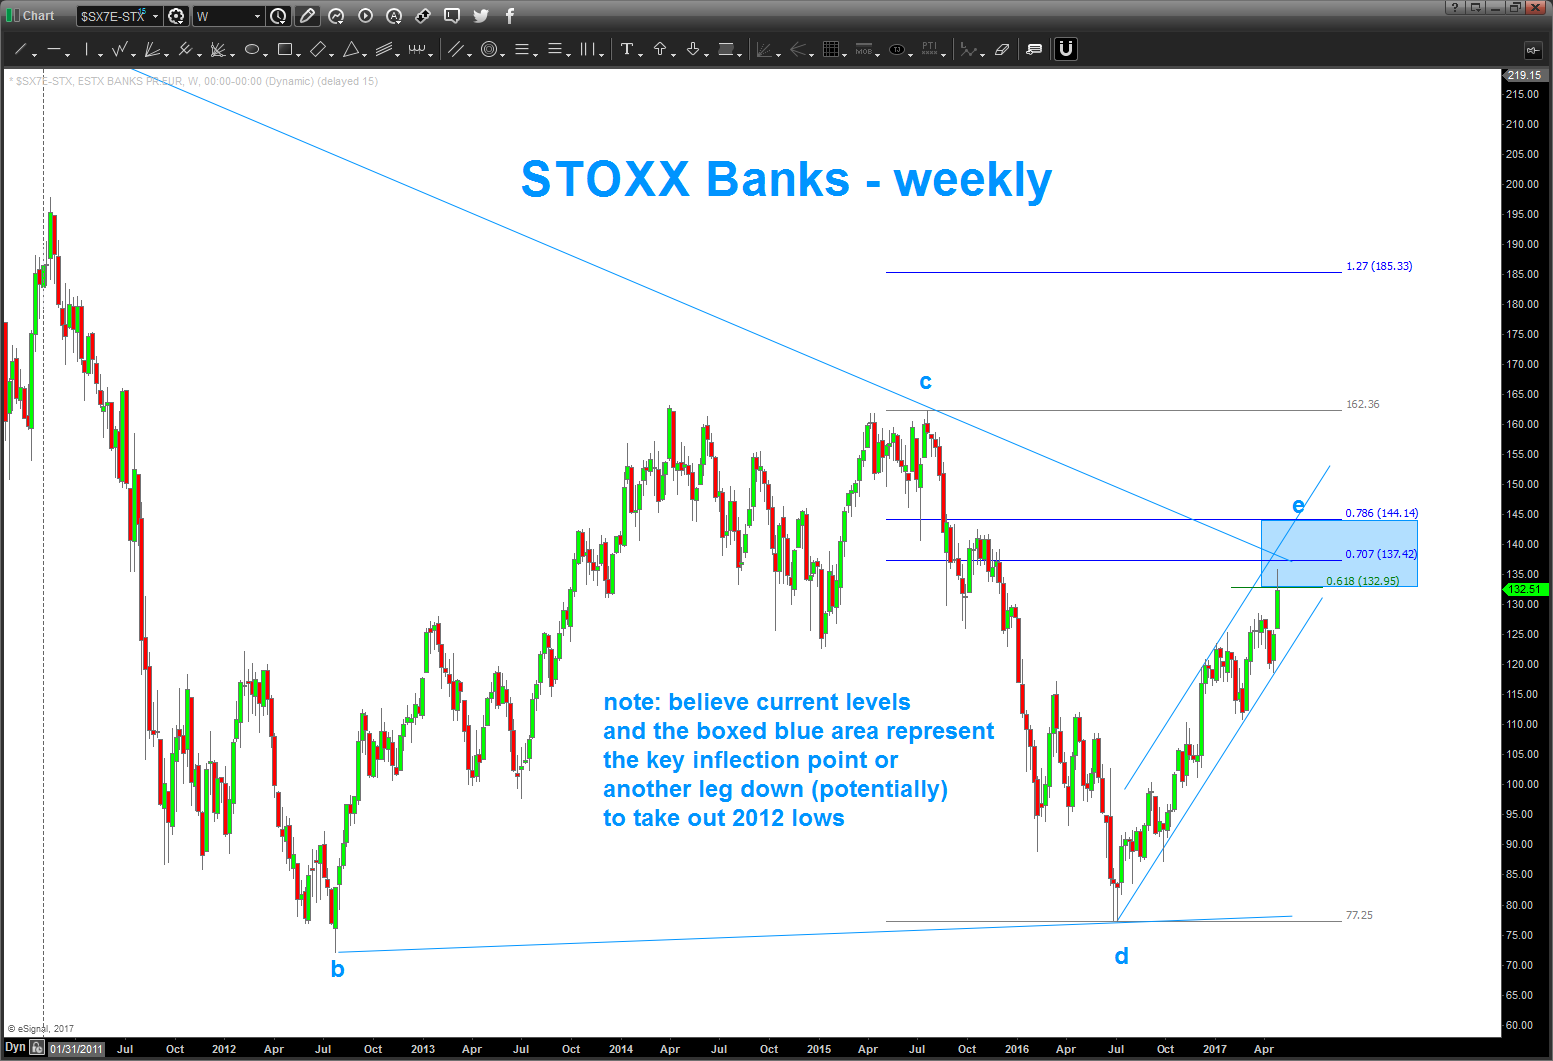
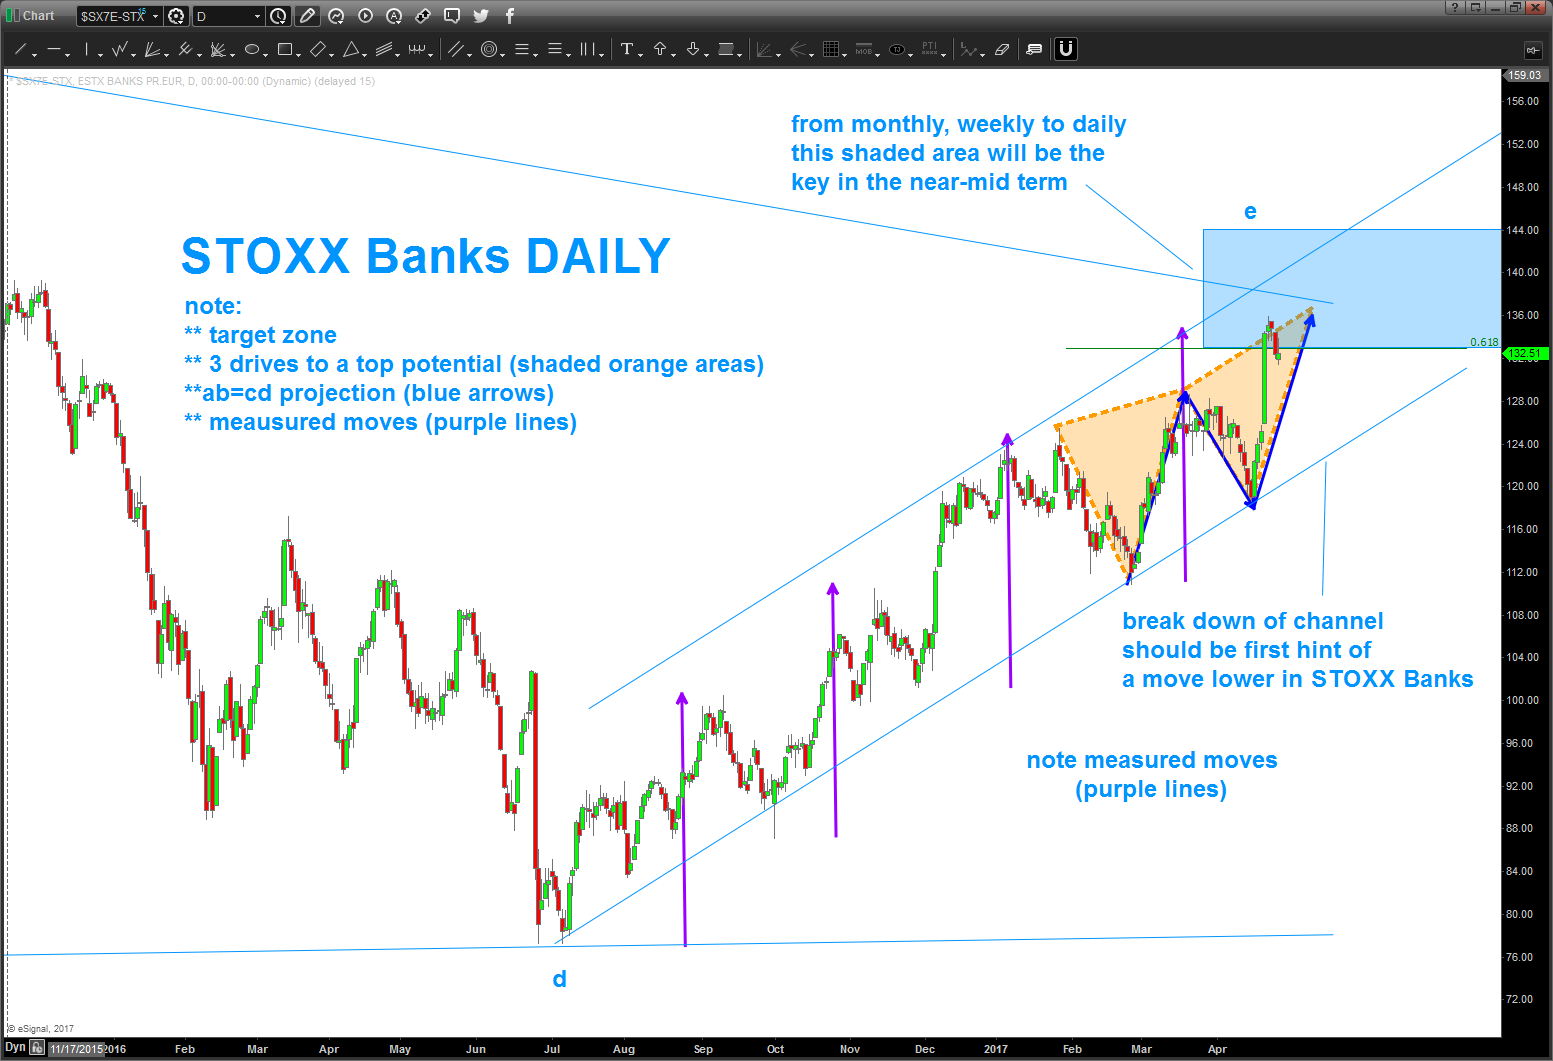
08/05/2017 – recent strength appears to want to take out the 139.67 high. However, the key levels still remain as shown below. A DAILY CLOSE above 144.28 will make me rethink scenario below. Hope this helps …
Bart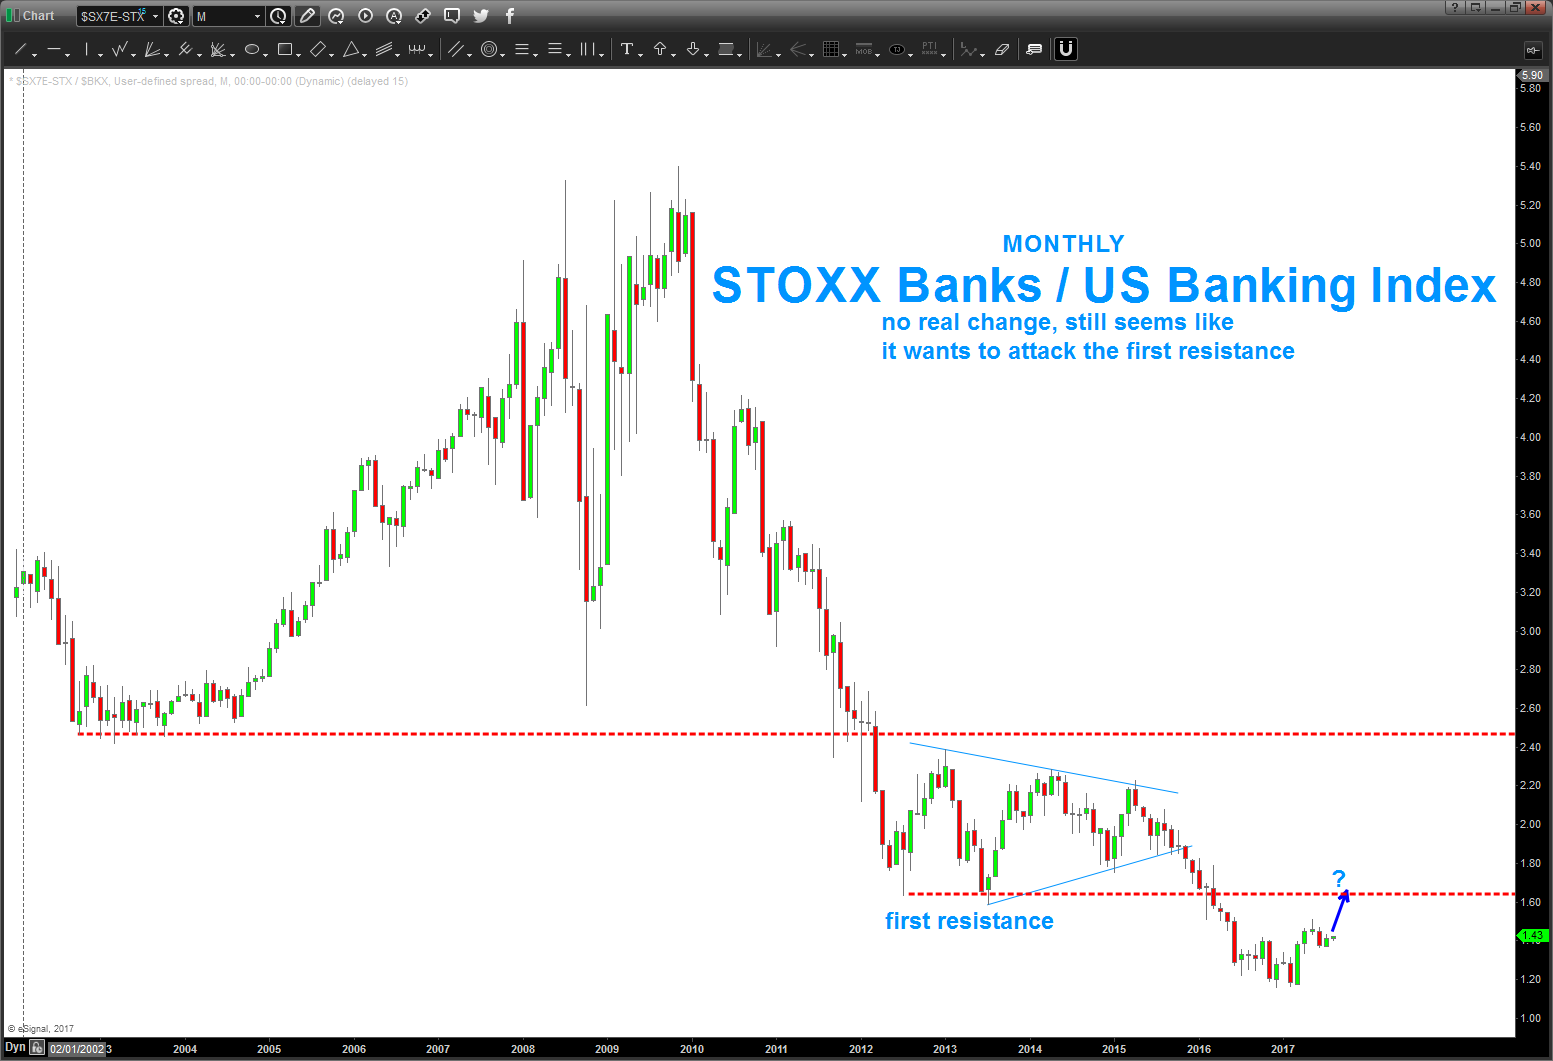
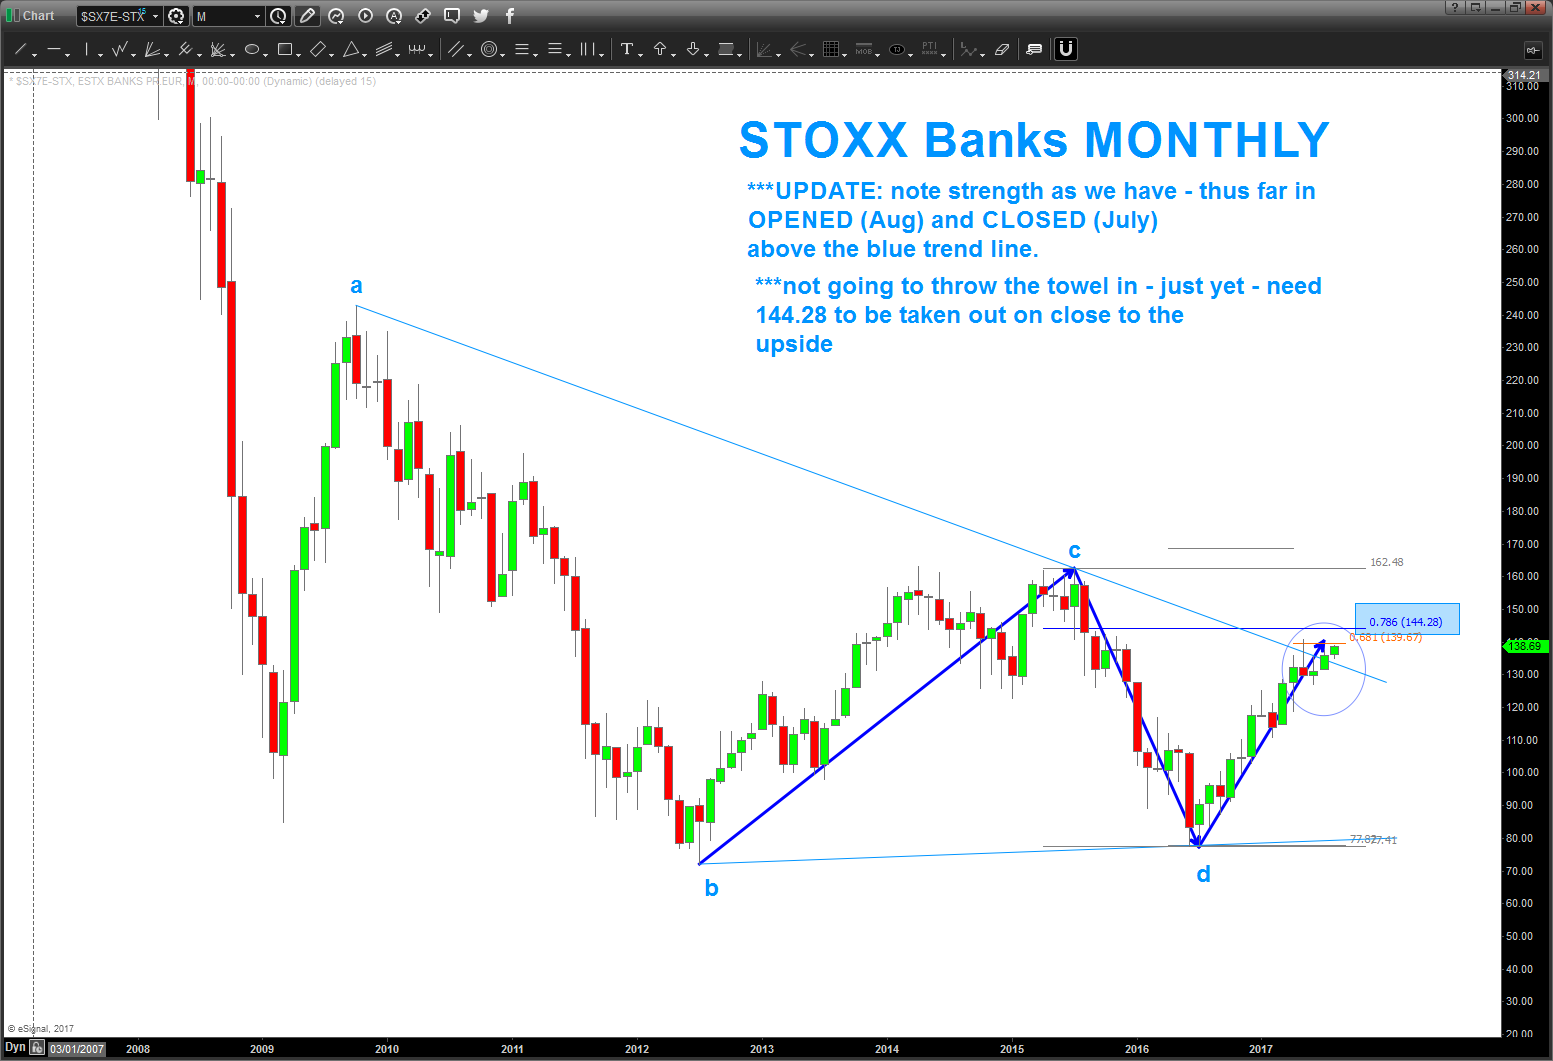
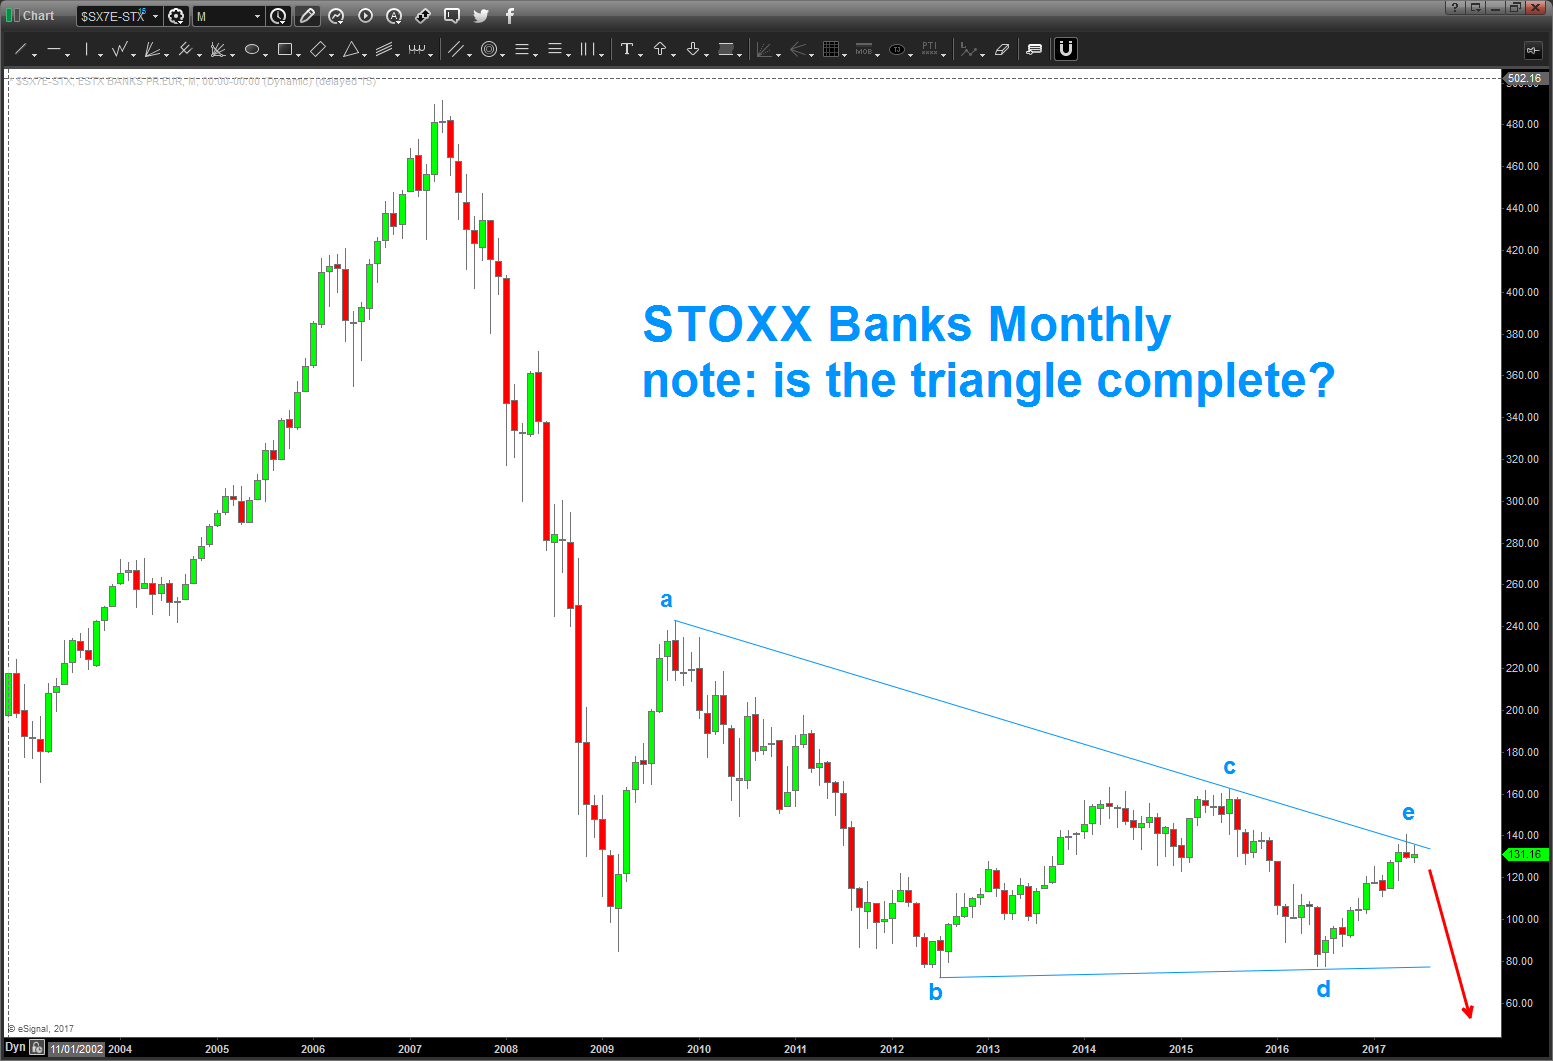
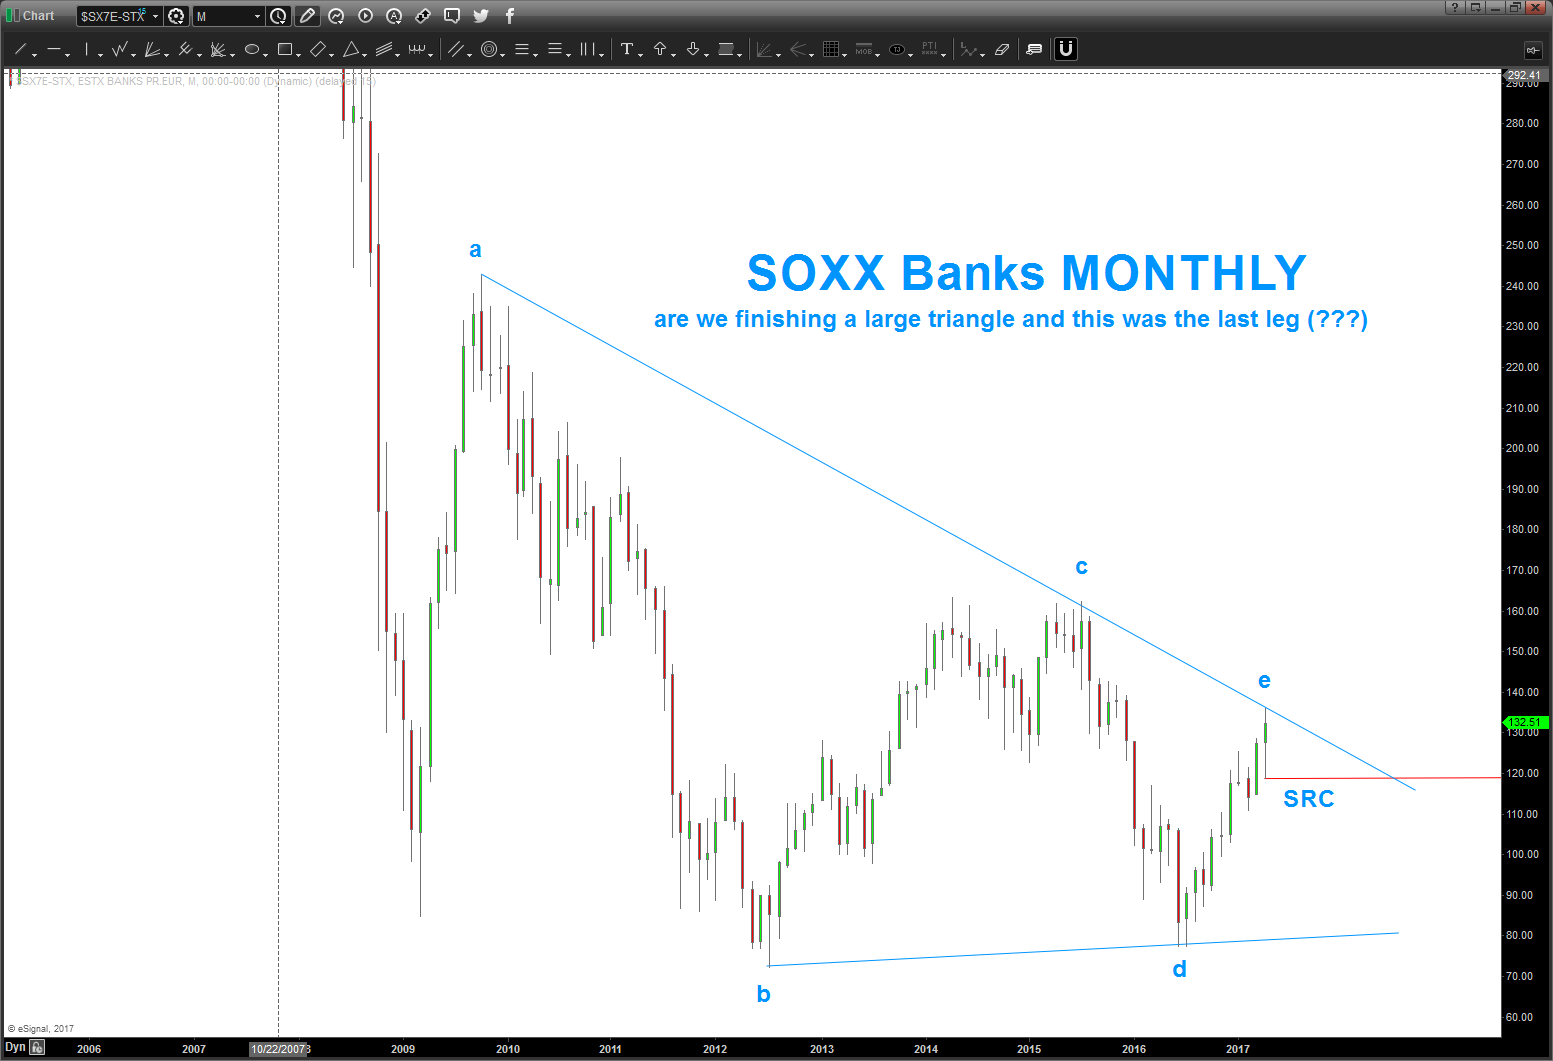
07/01/2017 – STOXX banks rallied into the target zone to keep the triangle (monthly) thesis alive. key levels indicated below on STOXX Banks and also the STOXX / US Banking Index. Hawk these levels for strength or weakness.
Be well my friends … Bart
—————————————————————————————————————————————————–
the KEY here is are we finishing a triangle and this latest leg up represents the final sequence (e) of a,b,c,d,e … the relationship that is giving me a ‘hint’ that this might be the case is the fact that the e is representing .618 of b-c (a common relationship in triangles) on the charts, that is the green line w/ .618 to the right of the green line.
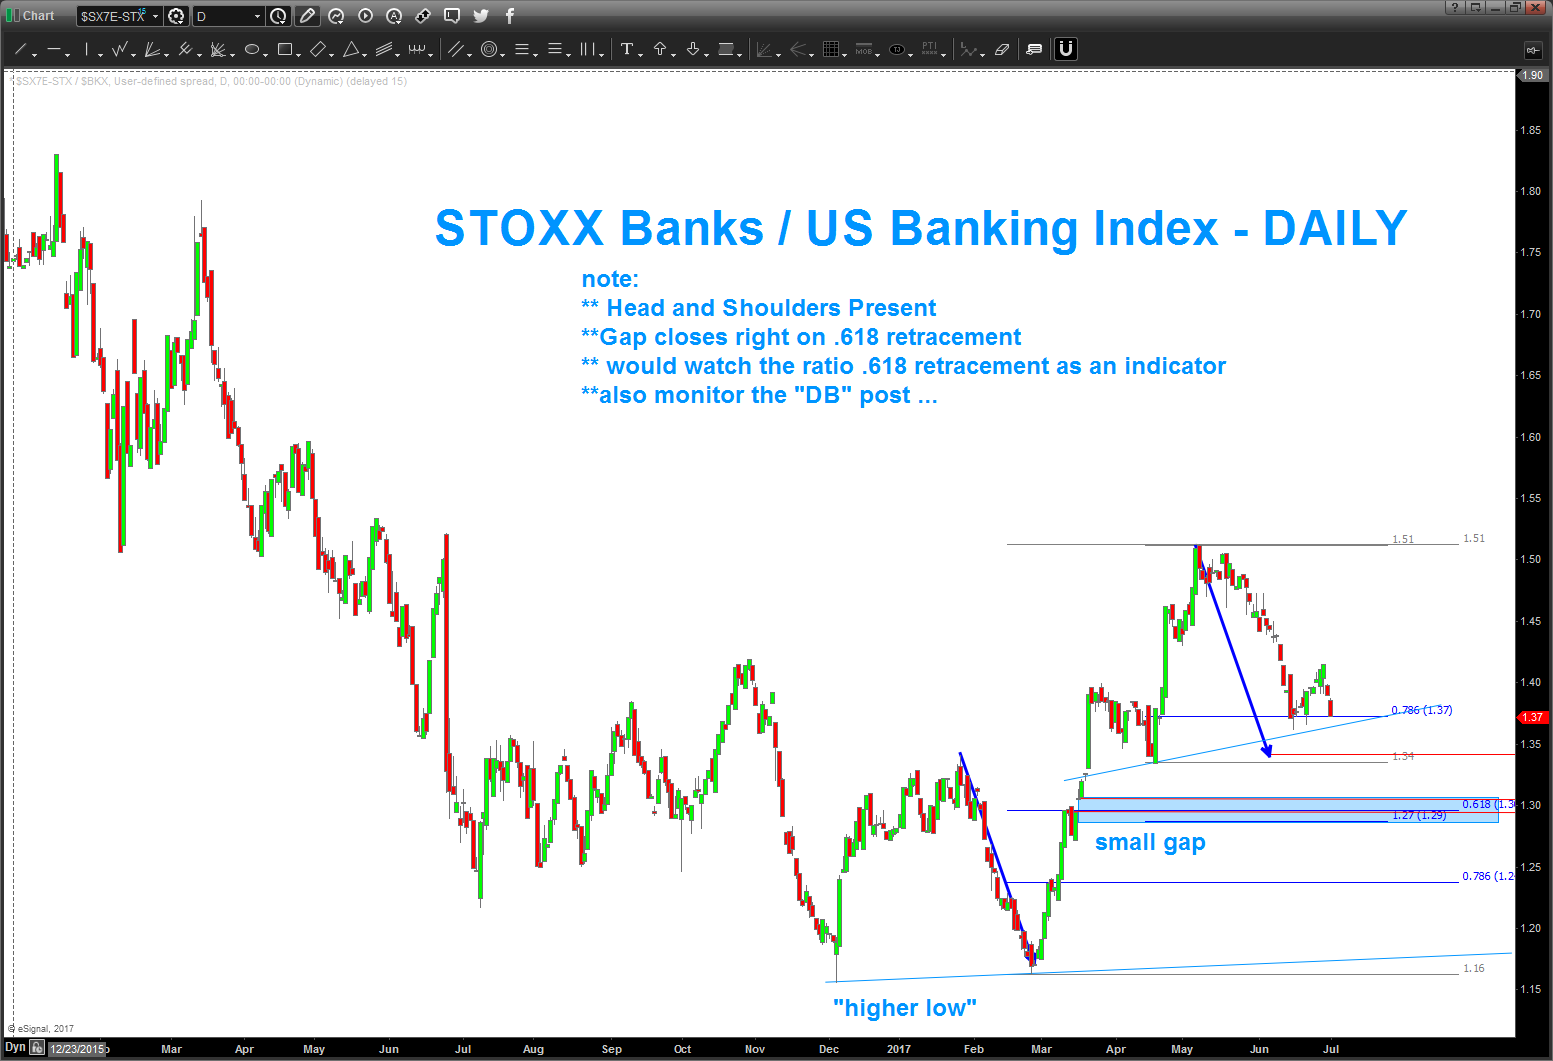
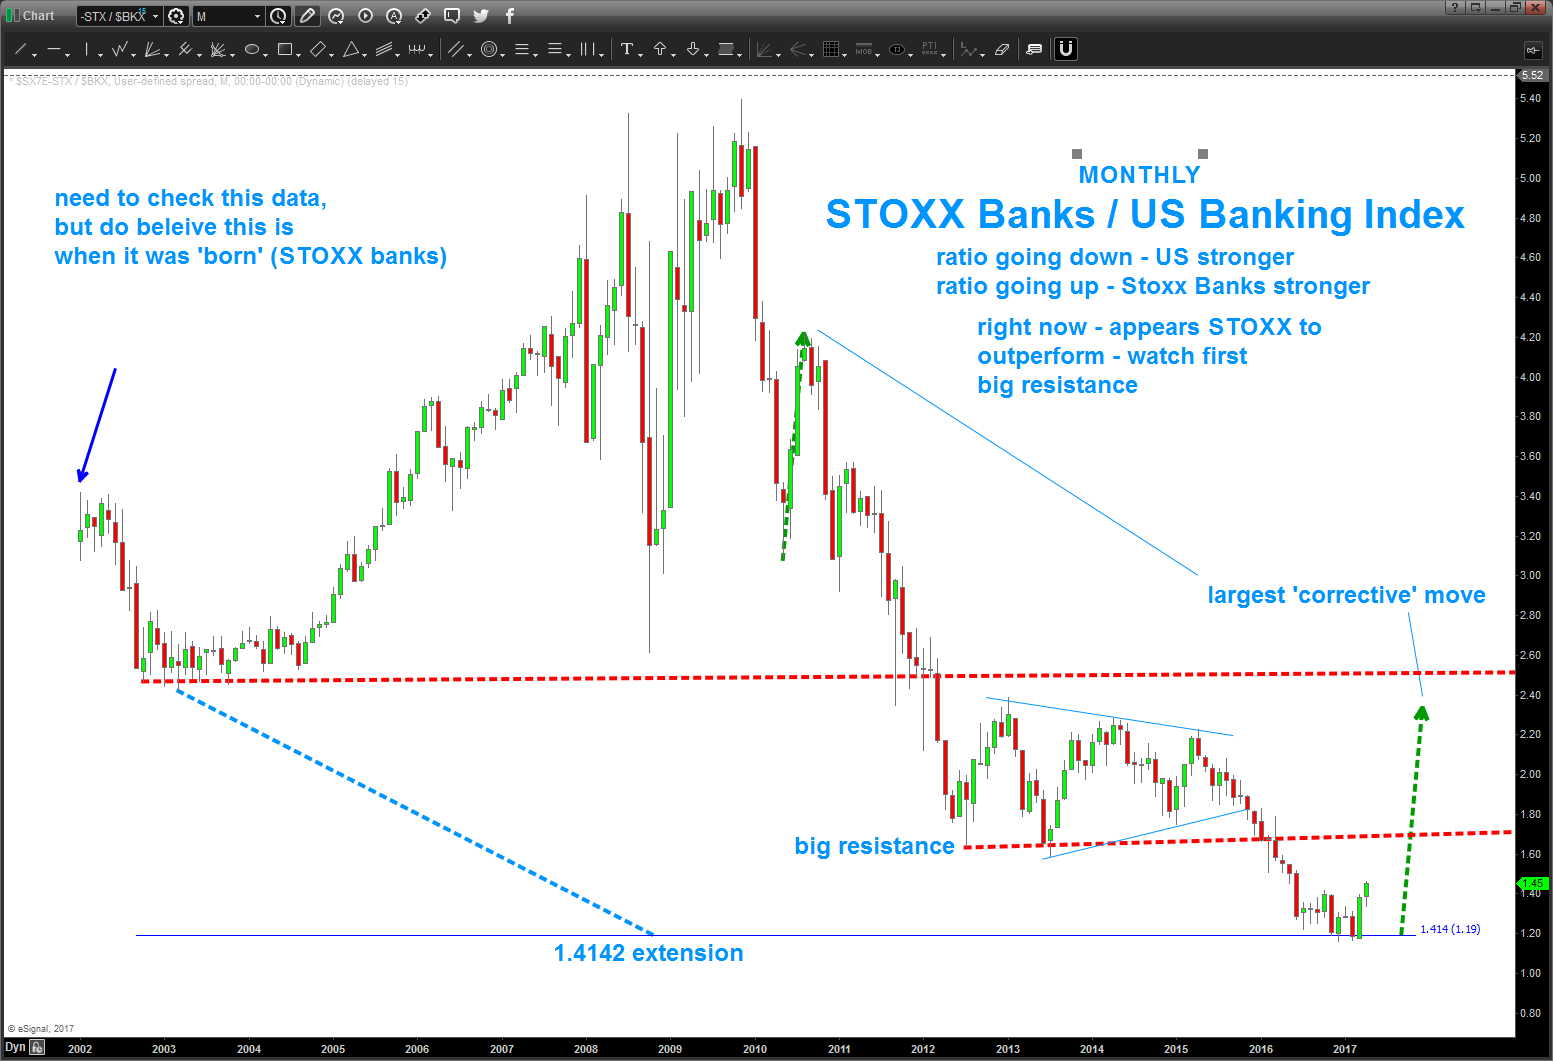
also the ratio of SOXX banks / US Banks is presented. just because a sector might outperform on a relative strength basis does not mean it will go UP because it’s outperforming. in this case, it could mean it goes down slower … or, this move up is complete and US banks to outperform. however, because of the long term downtrend in STRENGTH of STOXX vs US Banks would monitor this closely. A continued increase and movement in STOXX vs US Banks ALONG with a consolidation or a breakout of the blue shaded box shown on STOXX Banks charts could mean important and notable strength has developed. Monitor the ratio for clues ..
Hope this helps and thanks for asking and visiting the site .. let me know if you have any questions.
Bart
Natural Gas carving out a low?
Posted on August 5, 2017 Leave a Comment
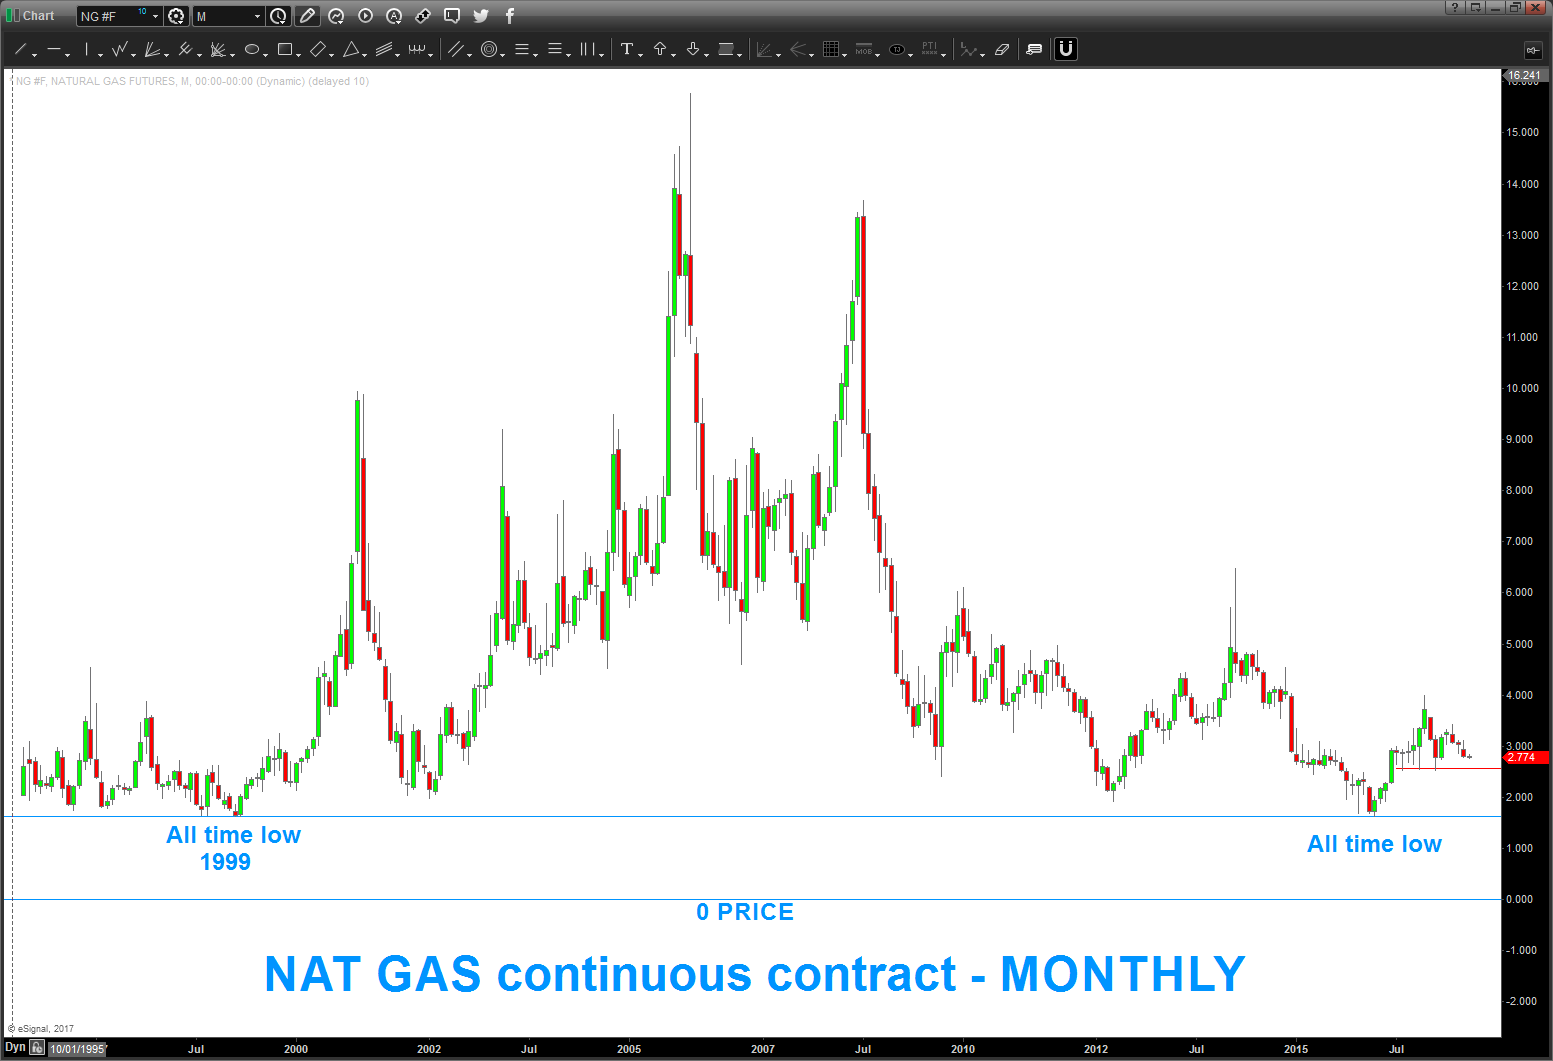
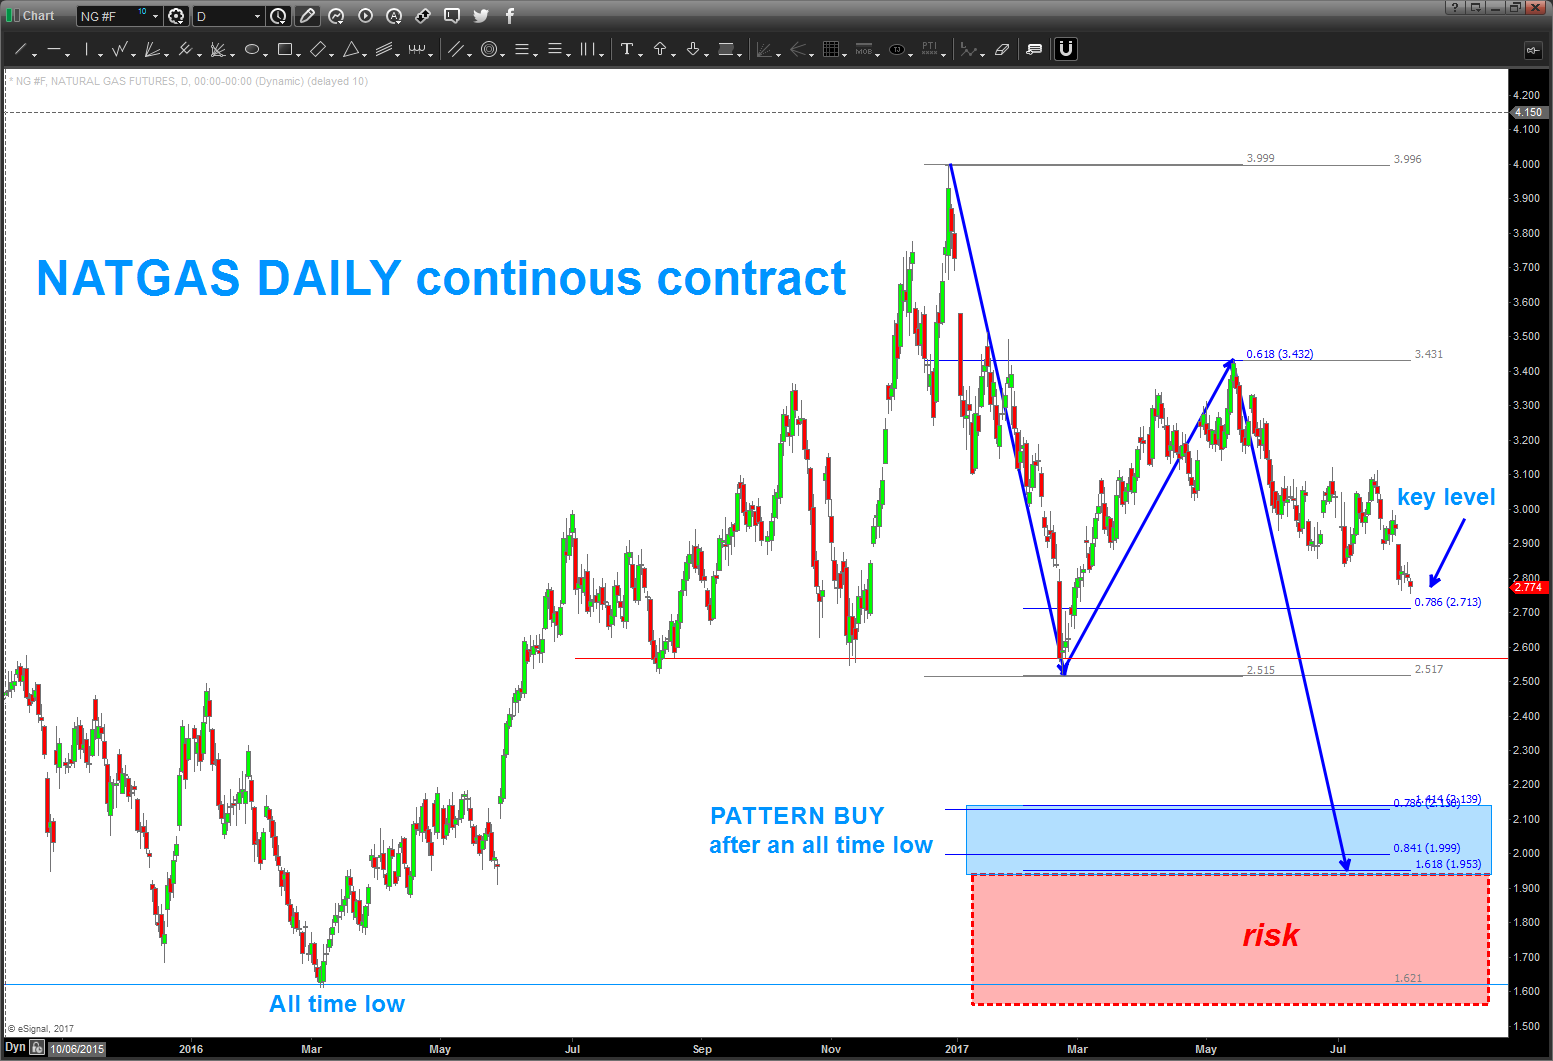
08/05/2017 – was asked to take a look at NATGAS again … I still feel we are in a consolidative or bottoming period. and the “we are here” from my last post is still valid.
- note we have a head and shoulders forming .. key support is the .786 at 2.713 and then the neckline around 2.51-2.57
- we have a buy pattern in/around 1.953-2.139.
- note, the apex to neckline projection takes us below the all time low in/around 1.621.
- roll /w the buy pattern and then use the all time low as the shaded red box defining risk? Perhaps …?
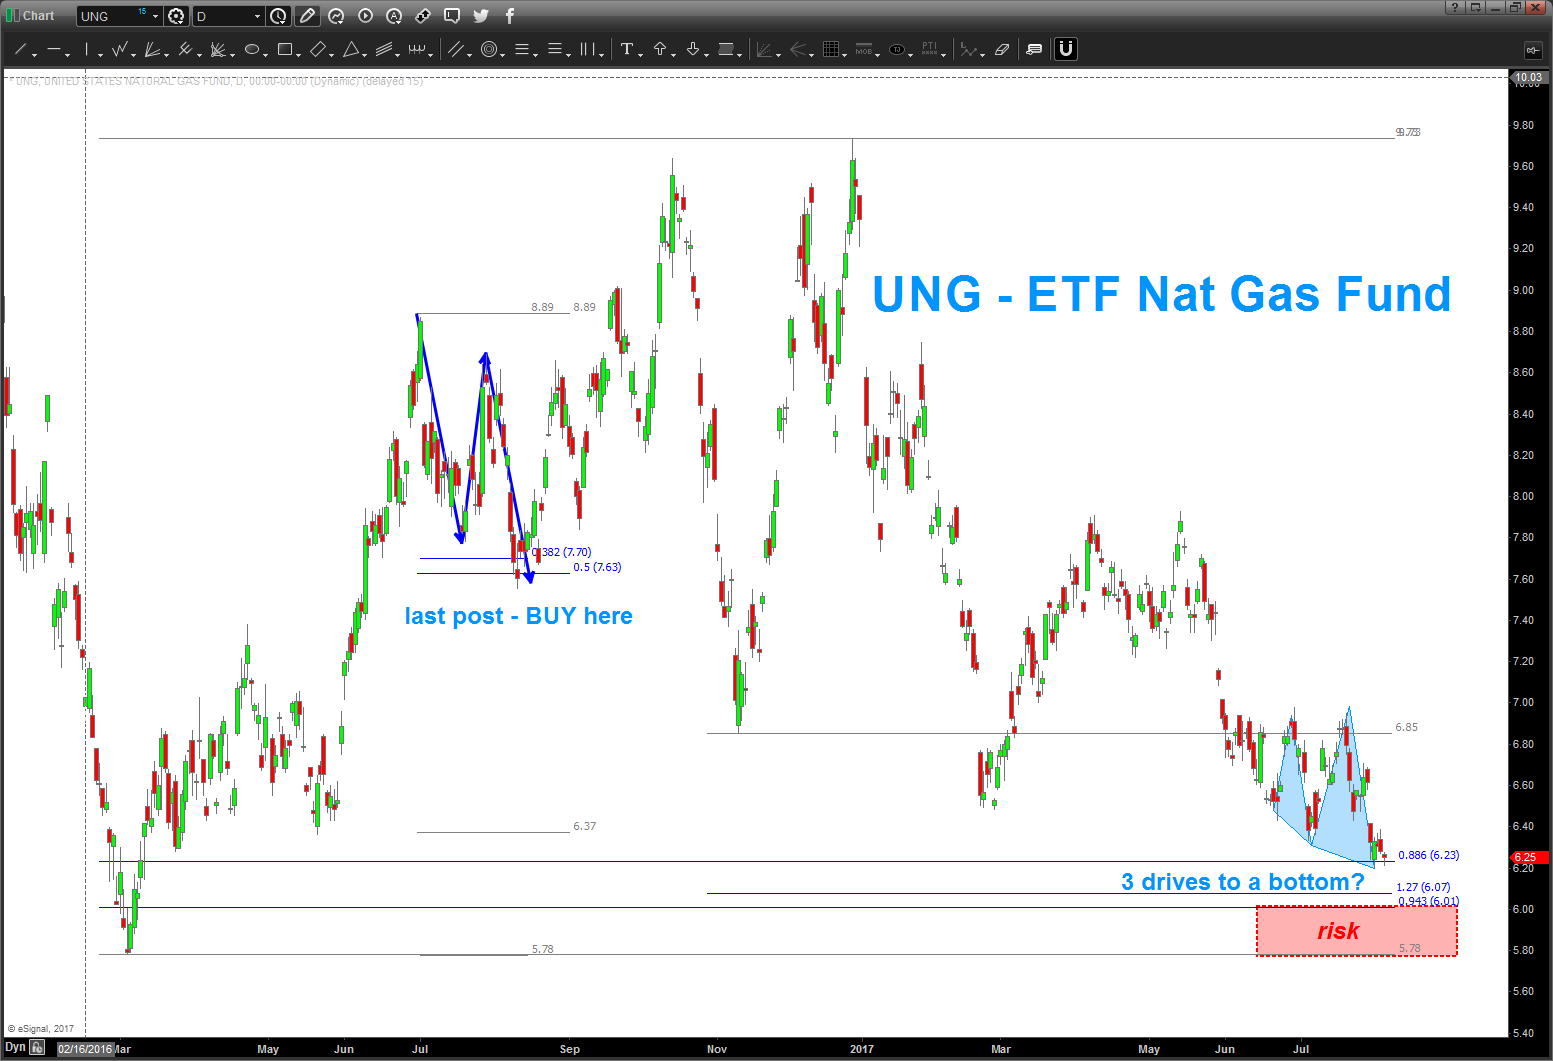
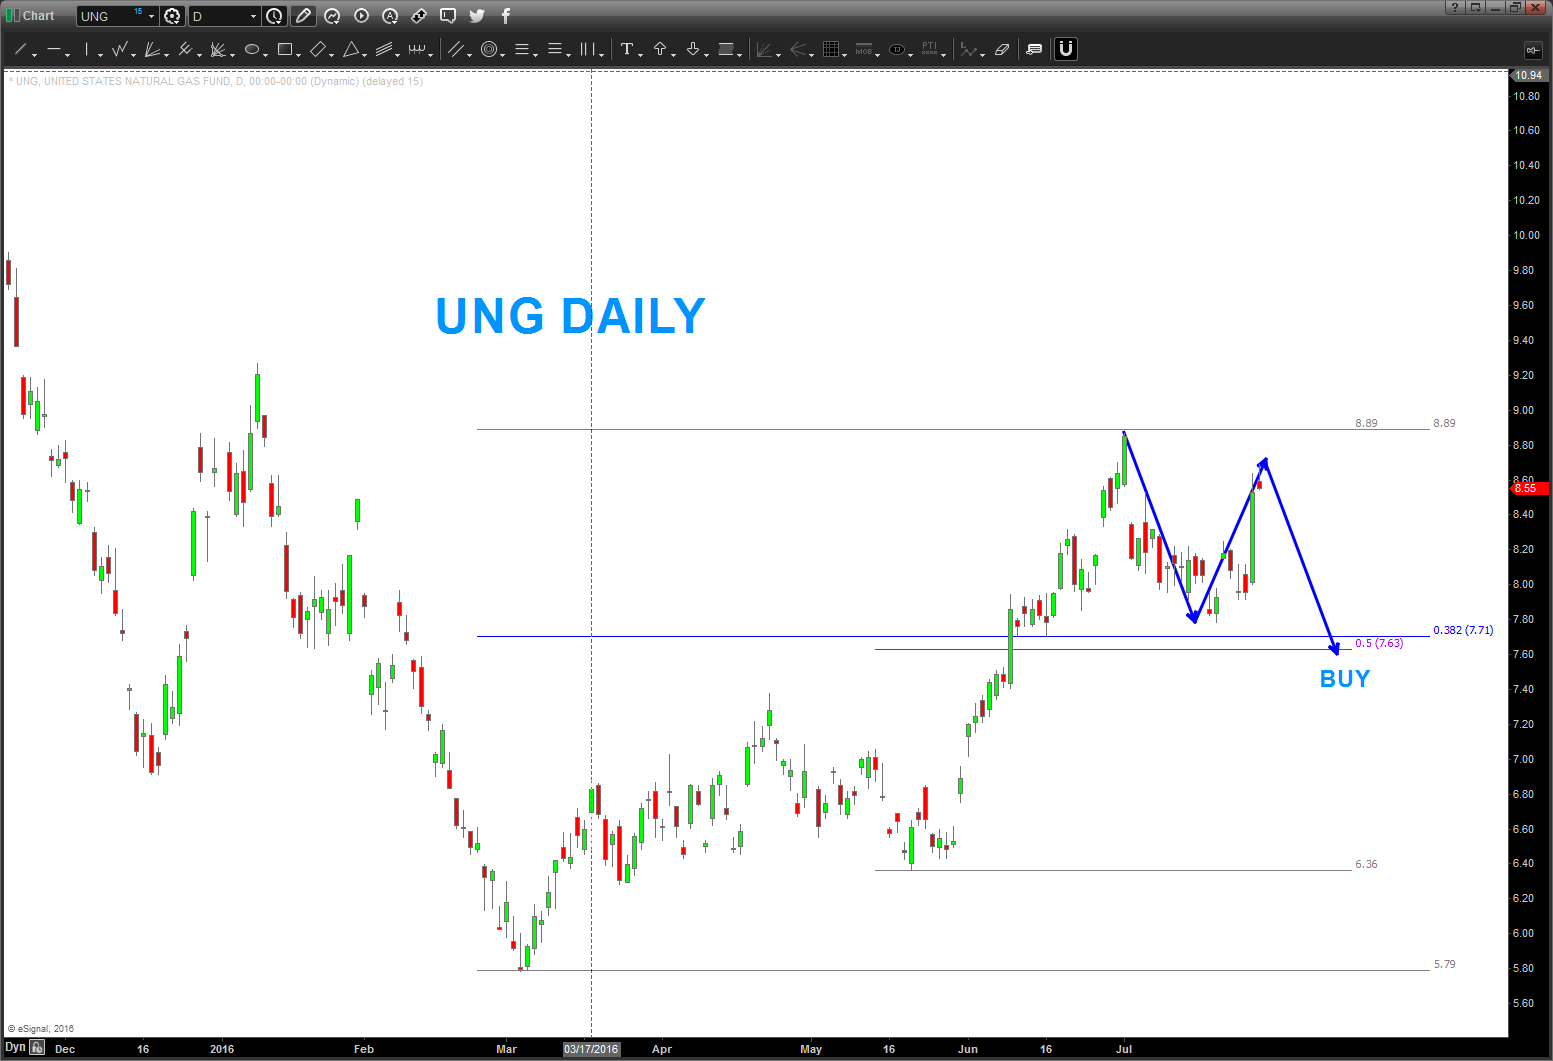
as for UNG – note the last post had a pretty nice BUY pattern and it hit then tallied up to the 9.45 area. sure looks like a BUY in/around here w/ a stop out below 5.75 could be a play IF this is going to rally.
hope this helps ..
folks, for those of you have been following me for a while you know that sometimes you eat the bar and sometimes the bar eats you. (man I love that movie … the Big Labowski)
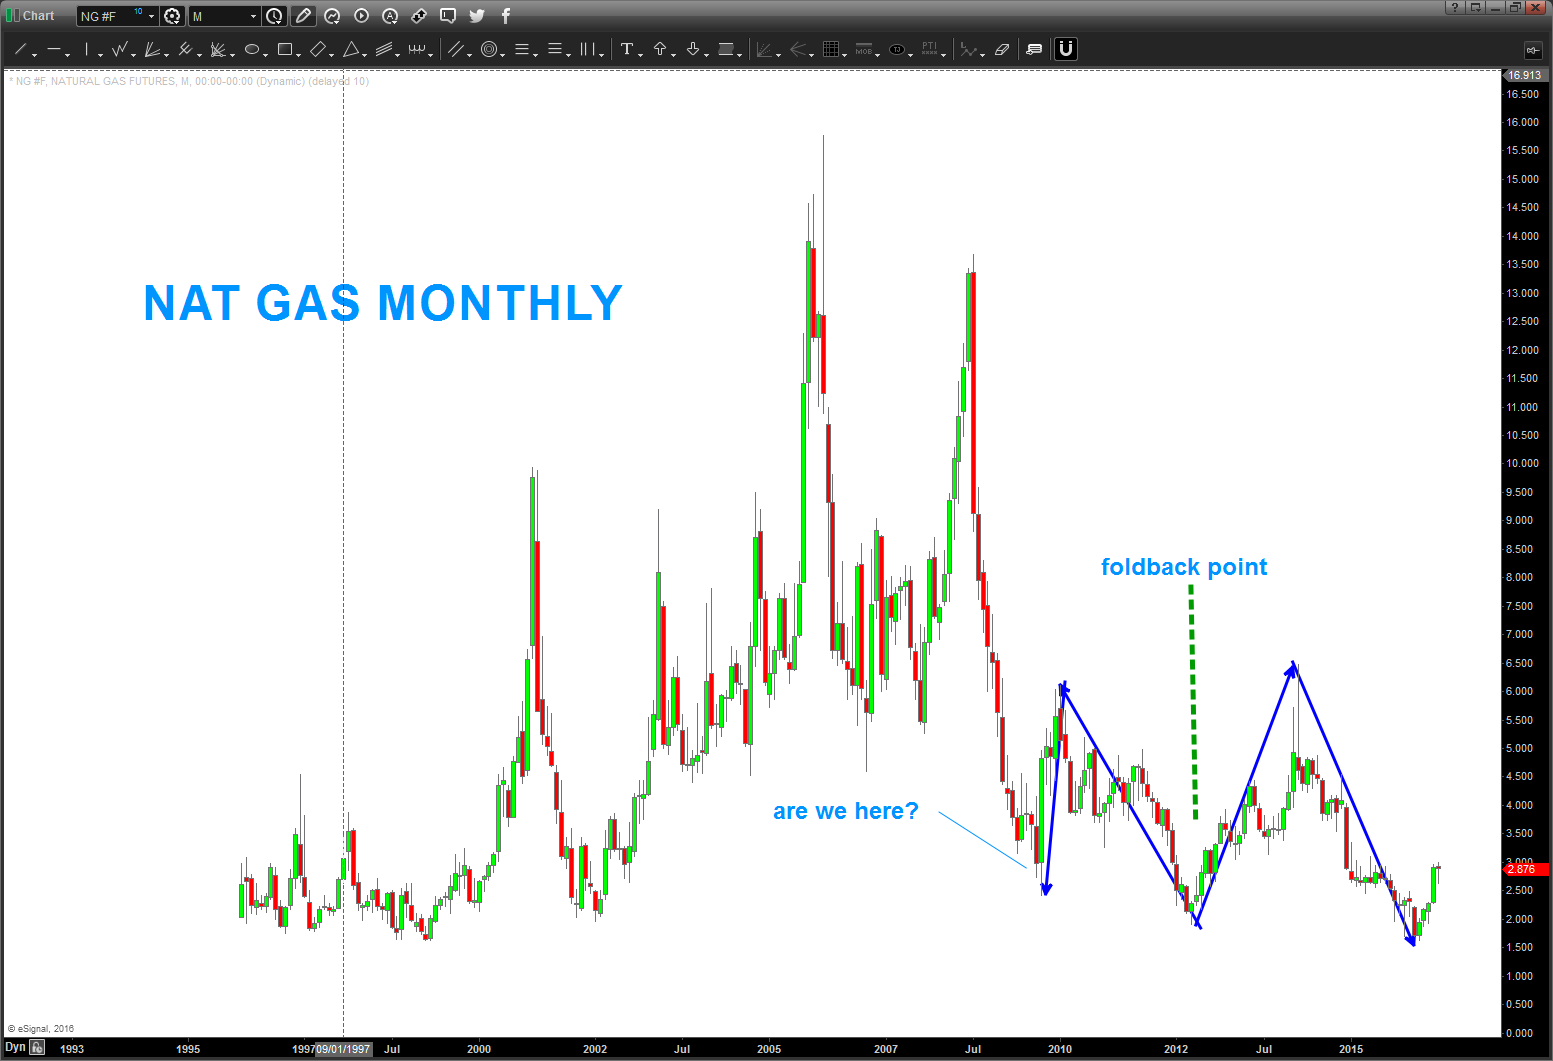
anyway, the “bar has eaten me” on Natural Gas. I played w/ a foldback pattern that REALLY looked nice and it basically failed below the levels – BUT the PATTERN still appears to be working …perhaps?
either way, I think we have a big low in place on Natural Gas and I haven’t looked at it for a WHILE after it kicked my butt. looking at it today – I see another potential foldback potential.
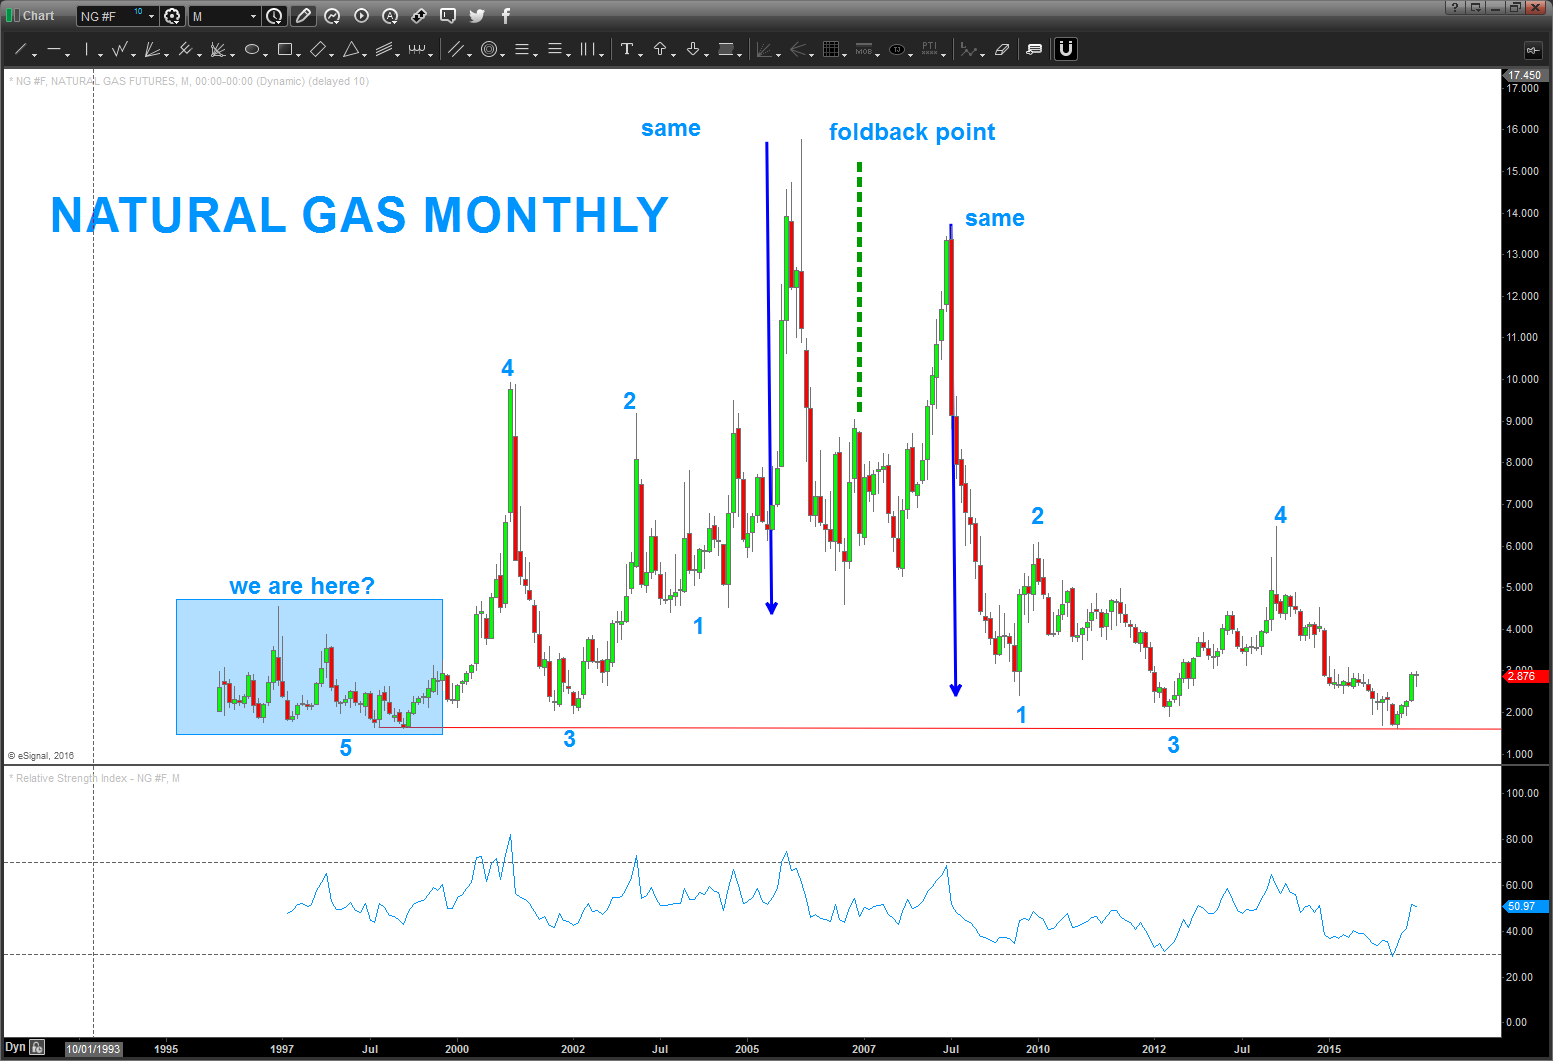
man, I wish I had more data on Natural Gas prices …
here’s the “other” foldback that kicked my ass …the form and symmetry sure look nice, don’t they? If right, natgas is about to rip higher ..
here’s a look at $UNG
the finishing of the Octave .. just a little higher UPDATED
Posted on August 5, 2017 2 Comments
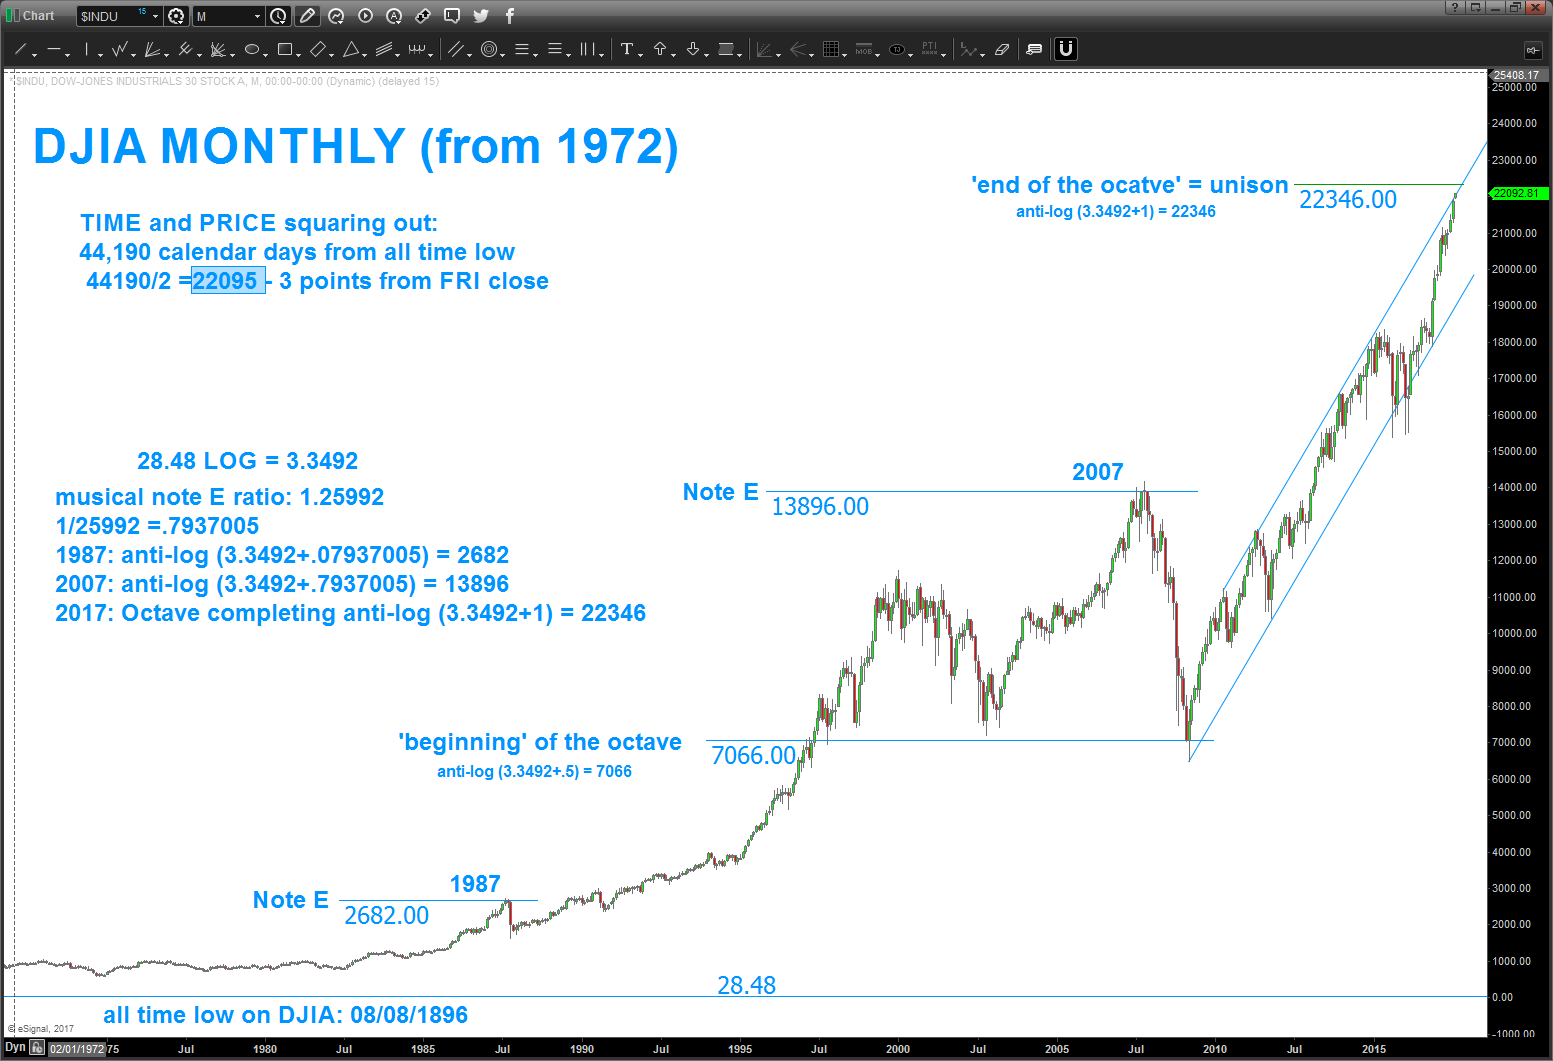
08/05/2017 – continuing to follow our target for the DJIA in/around the 22,346 area. I believe that the market is harmonic and vibratory. Over the course of the years I hope to have shown people how to use patterns to manage risk. sometimes they are right and sometimes they aren’t …
so, here’s an updated monthly chart showing the approaching Octave target. does the market have to respect it – OF COURSE NOT – but the math doesn’t lie so I’ve been waiting to see what happens for a while. come on you DJIA – just a little higher and let’s see what happens!
also, note the square out in TIME and PRICE that occurred (pretty much) on Friday.
44190 calendar days since the all time low in 1896. 44190/2 = 22094 about 2-3 points from the close. close enough?
It’s all probability folks …
have a great weekend.
Bart
———————————————————————————————————————————————————————–
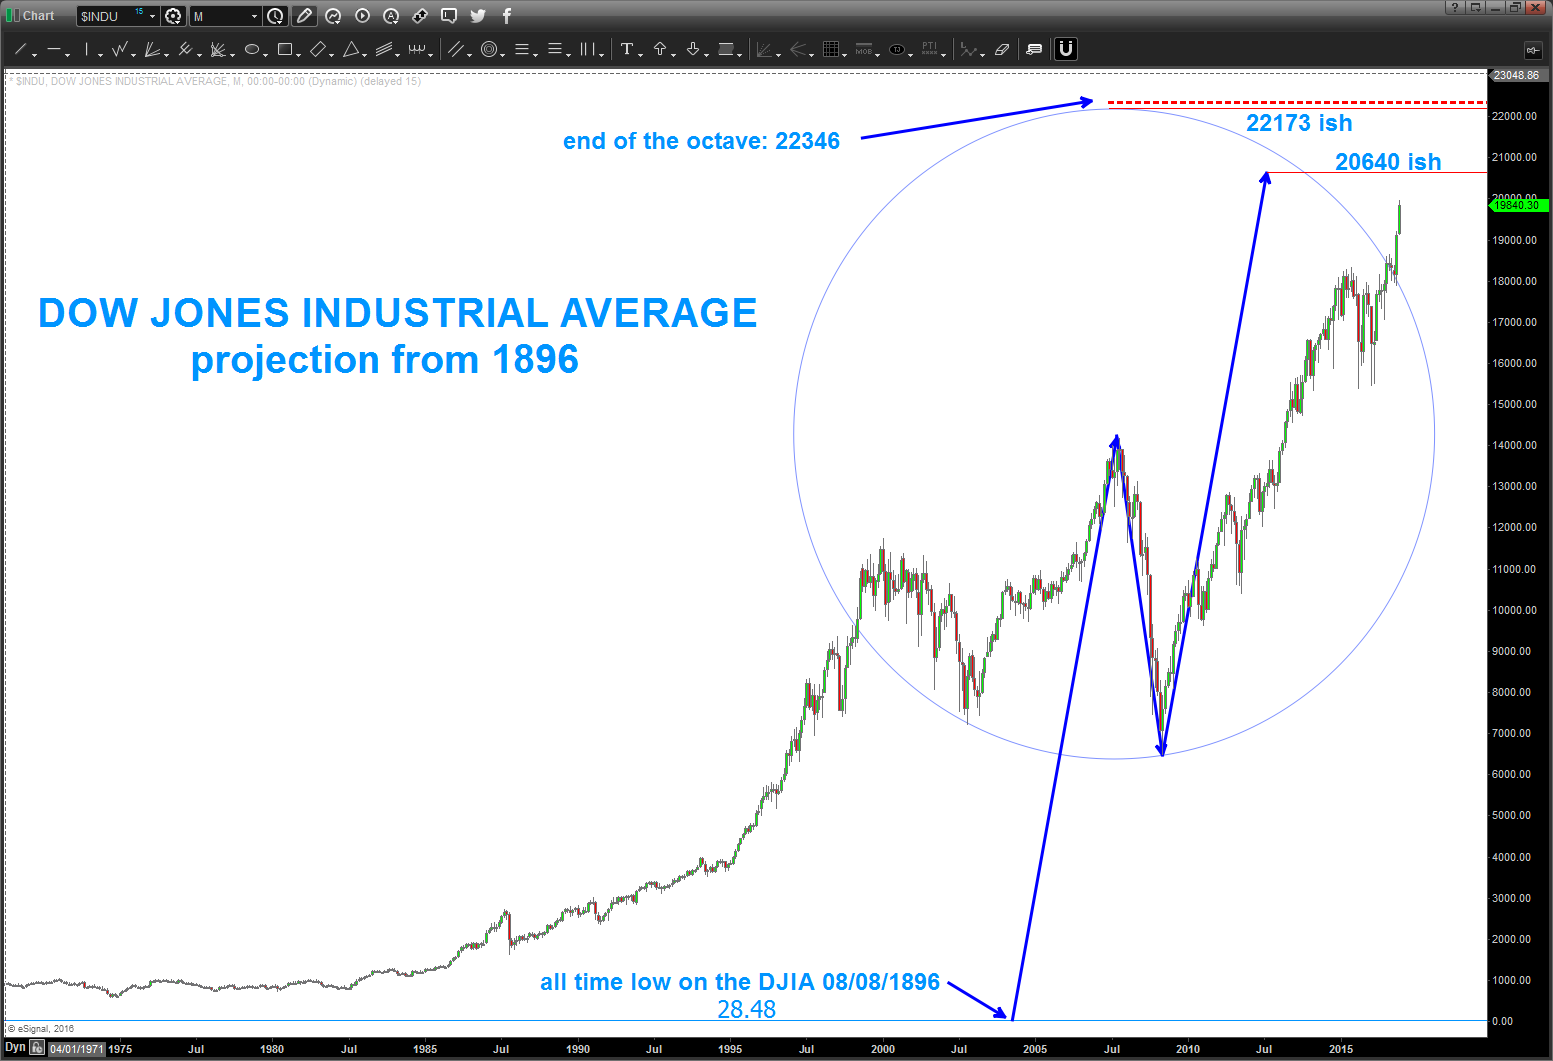
12/16/2016 – just updating this chart to show some potential targets I’ve been watching on the Dow Jones. I don’t know how high it’s going folks but I feel very confident that 2009-now is a BIG 5. Like a big 5 since the 1800’s five …
if you are REALLY into this stuff like I am … take some time to read the blog below. here’s the targets for now and as always let me know if you have any questions.
basically, over the coming months is another 10 percent move that out of the question?
shown is the ‘basic’ AB=CD from the all time low in the late 1800’s up into the 2007-2008 top and then projecting … AB=CD, then some octave stuff and geometry stuff. Hang on … it’s going to be a wild ride.
I want to see if the music is math and what happens when we complete the OCTAVE …
Bart
What a great day yesterday … was working thru what my wife calls the “man flu,” it was pouring rain and nothing but great college football and logs. I know, that was geeky but during half-time of the Navy vs AF game I just sat down in front of my computer and said “self, let’s see if music is really involved in the market.” I think it is …
- I have never done this before, what you see is the result of starting from the all time low of 28.48 on 08/08/1896 some 43,250 calendar days ago as of this posting and simply “did the math.”
- Background:
- the frequency of a string is:
- inversely proportional to the square root of its length and
- directly proportional to square root of it’s tension
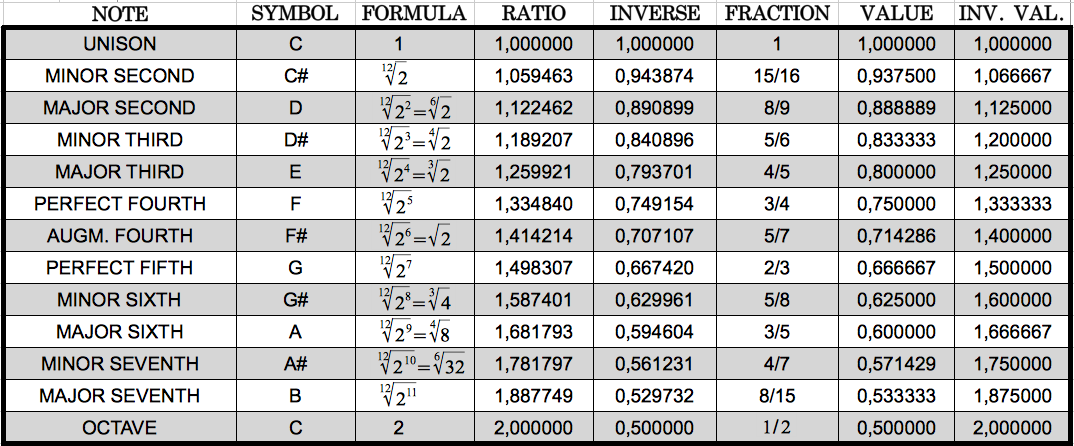
- here is a chart of the notes and the ratio’s and their inverses
- the frequency of a string is:
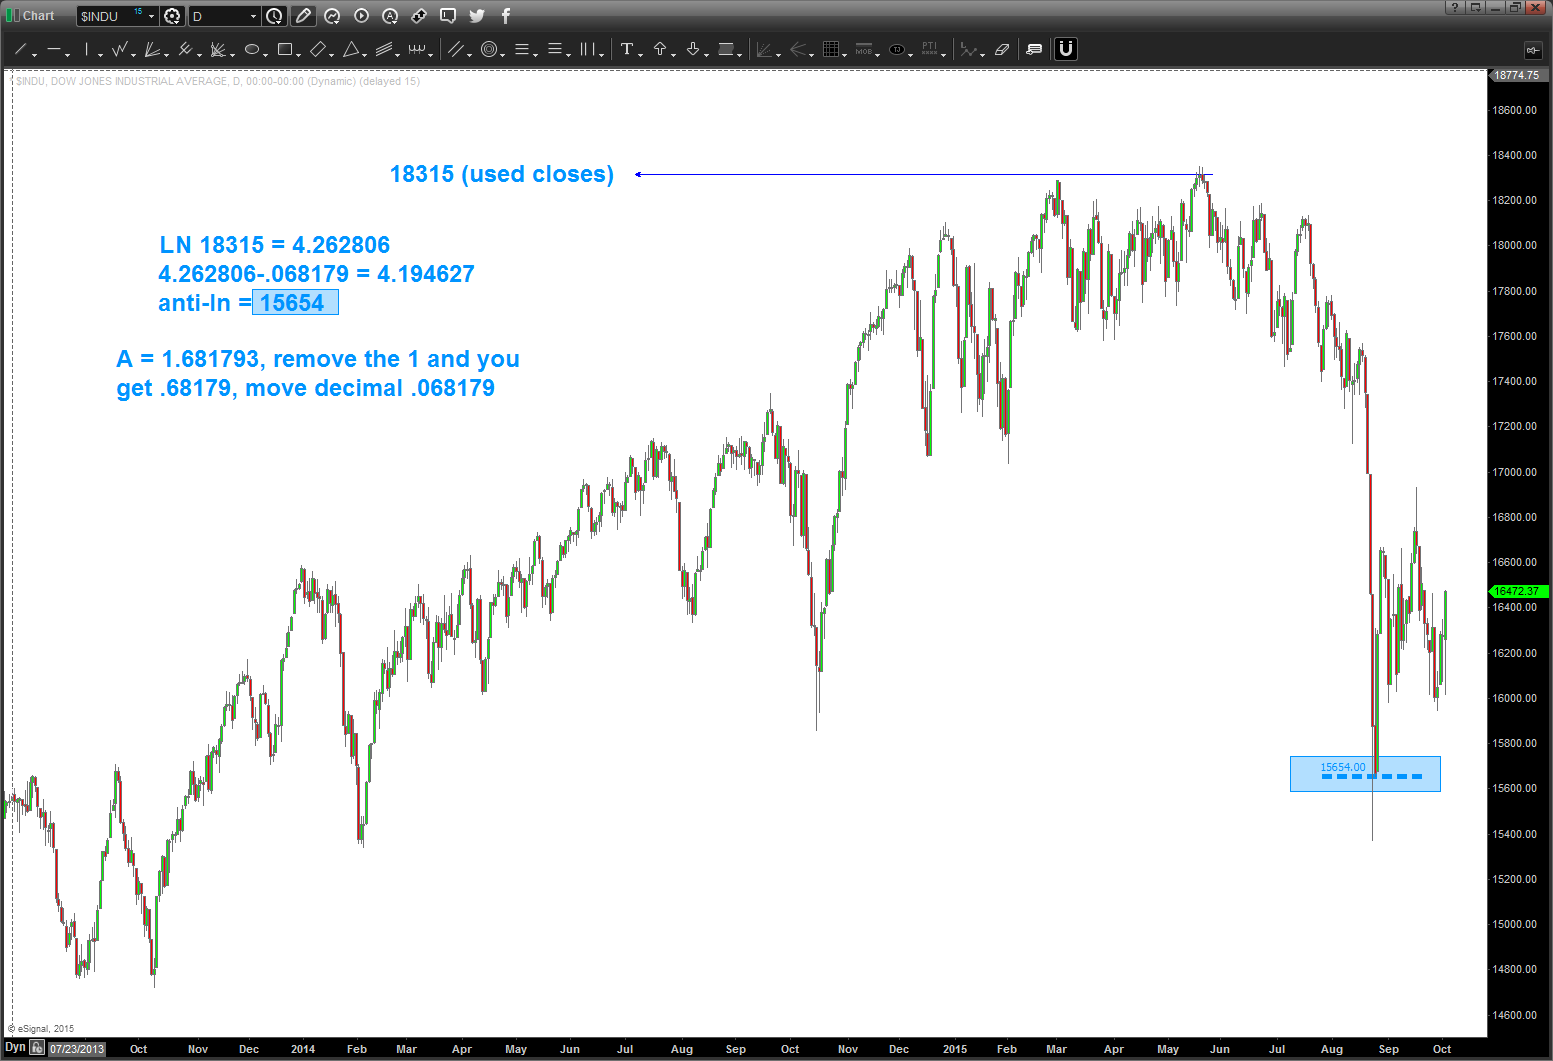
- Here is the math:
- 28.48 LN = 3.3492
- 3.34492 + ratio of equal octave scale = XXX
- anti-log of XXX = YYY
- plot YYY on long term monthly of DJIA
- For example:
- NOTE E: ratio 1.259921 and the inverse 1/1.259921 = .7937005
- 3.3492+.7937005 = 4.1429005
- 4.1386205 anti-log = 13896
- interesting to note how close that was to the top in 2007
- some 20 years prior the same “E” was wreaking havoc – here’s the math
- 3.3492+.07937005 (note the number stays the same – JUST SHIFT THE DECIMAL POINT) = 3.42857005
- anti-log of 3.42857005 =2683
is it any coincidence that the musical note E was found in 1987 and 2007 from the all time low in 1896?
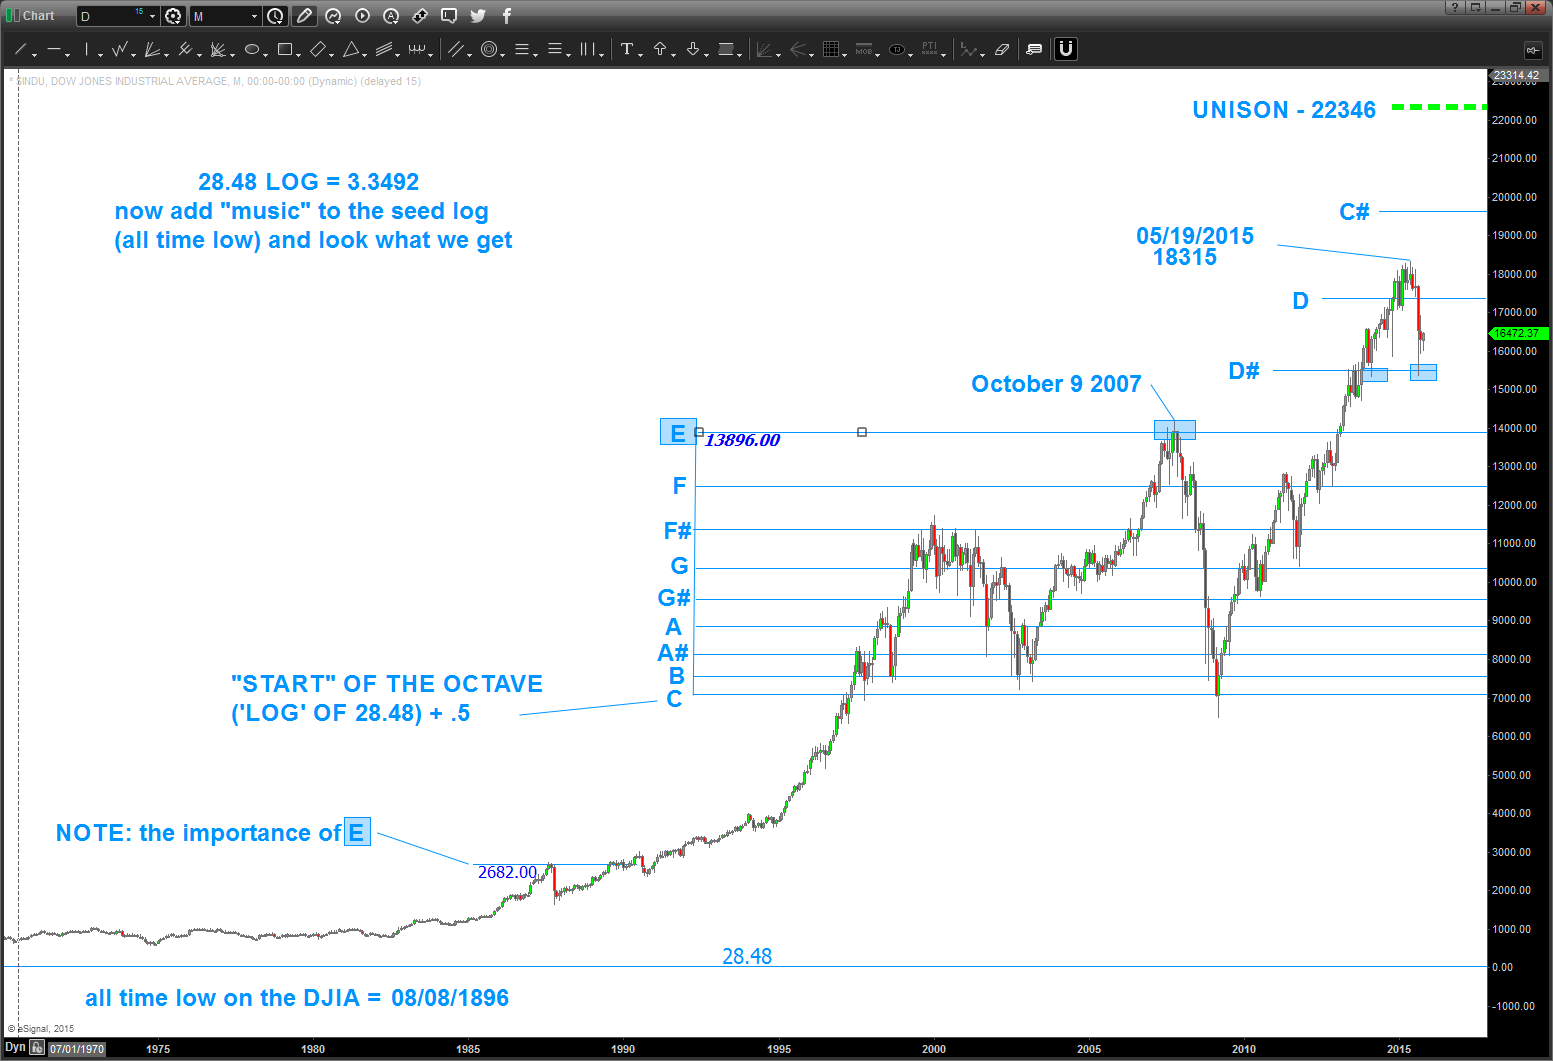
So what does this mean? Well, take a look at the chart … in 1997 the market came up and started another octave and has been banging in/around C-E for the past 20+ years. Note, the market did not CLOSE below the start of the octave “C” in 2009 … if I was in charge (and trust me I’m not) I sure think this market naturally wants to finish it’s symphony, so to speak, so is 22K out of the question? Who knows but I’m certainly going to be aware of these long term targets from 1896 as a guide.
Here’s a look on the way down …
Happy Hunting and study up …
Bart
Interesting chart … XIV (inverse VIX) UPDATED and UPDATED again
Posted on July 30, 2017 Leave a Comment
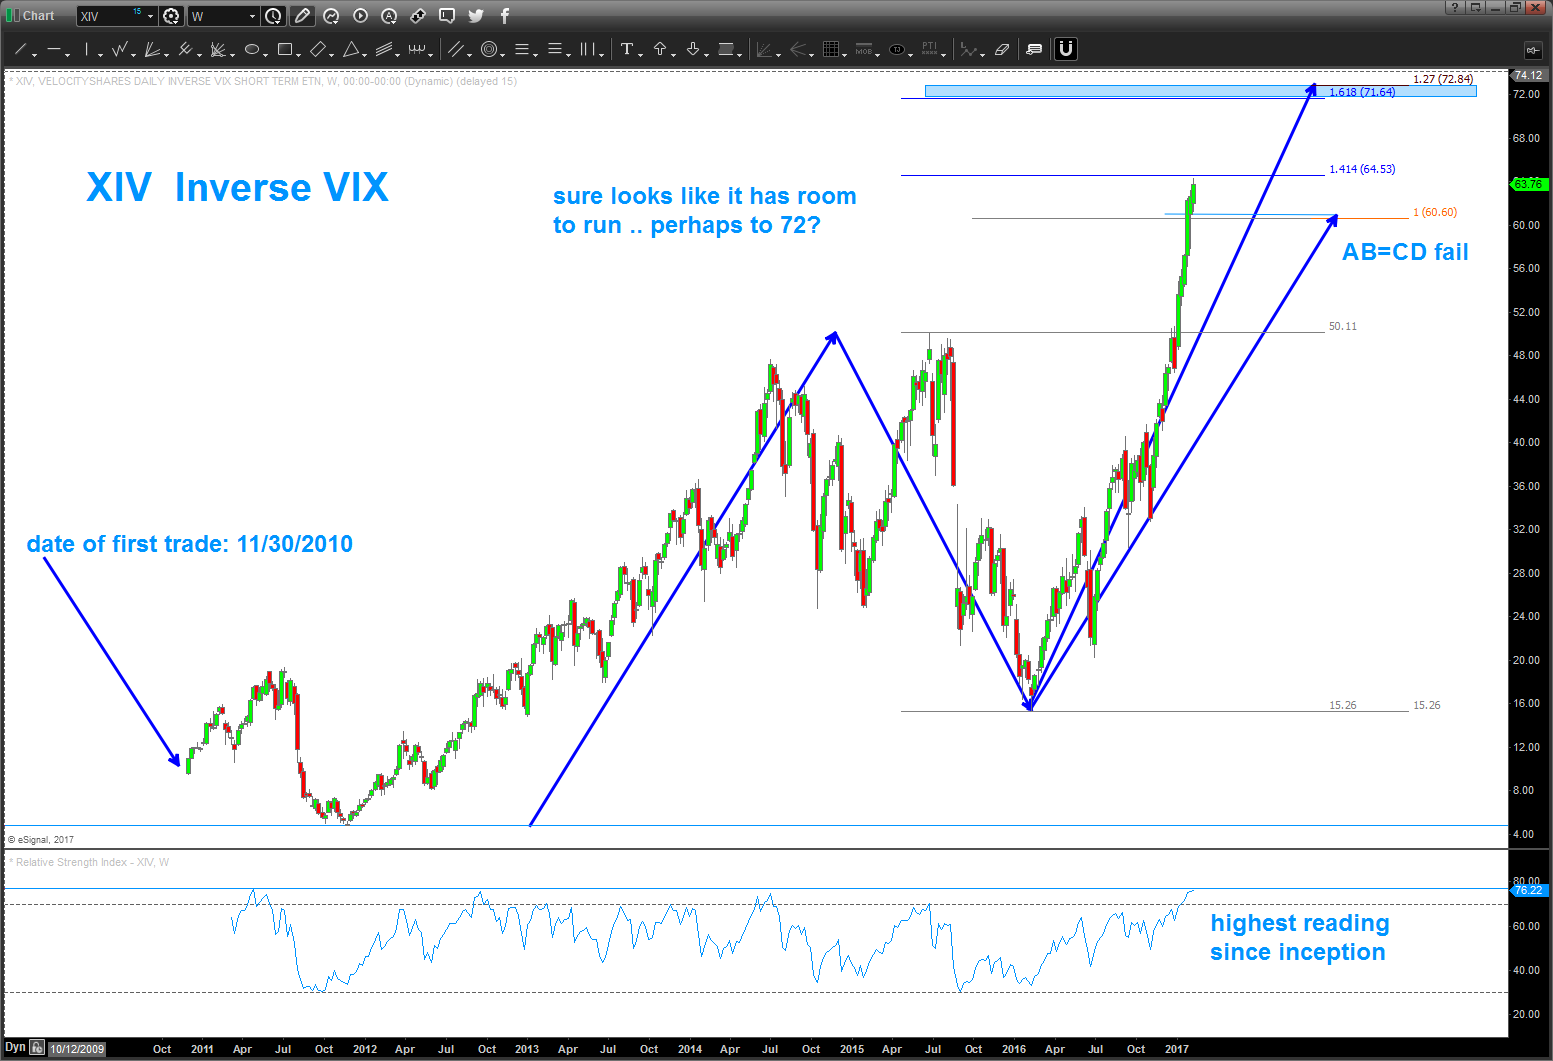
07/30/2017 – we are entering August w/ volatility AT THE ALL TIME low – ever. We also have some pretty cool eclipses coming into play. No kidding, this eclipse is going to be the first one since the inception of the United States that it only goes all the way across our country. Some serious energy is going to be hitting the continental US.
that being said, you can see we were looking at 88-90 ish as potential targets for the XIV but also noted the ‘big candle’ warranted caution for a top/resistance.
we plowed thru those two targets and now have a weekly doji sitting around 93. why did it stop there?
when going to targets I always like to go long term log and also use percentage projections. as you can see if we do a .618ab=cd on the percentage distance it hit the high exactly.
additionally we are also hitting some long term log resistance lines – NOTE I bracketed the gap to come up w/ a zone of resistance.
we have some negative divergence but I really want to keep an eye on that rising dashed green trend line on the RSI …that’s pretty much been running the show…
So, I’m still in the mindset that a correction is coming … mindful to wait for an SRC before jumping in on the LONG VIX or short XIV opportunity.

07/16/2017 – NEWS FLASH Volatility is historically low (insert sarcasm here) .. as you can below on the first chart the XIV (inverse VIX) has simply CRUSHED any semblance of patterns as it screams to new highs. Sheesh! But, the more parabolic it becomes the more likely it will parabolically collapse. I’m not saying the market is going to crash all I’m saying is PARABOLIC take off’s NEVER end well. So, ride it while you can …
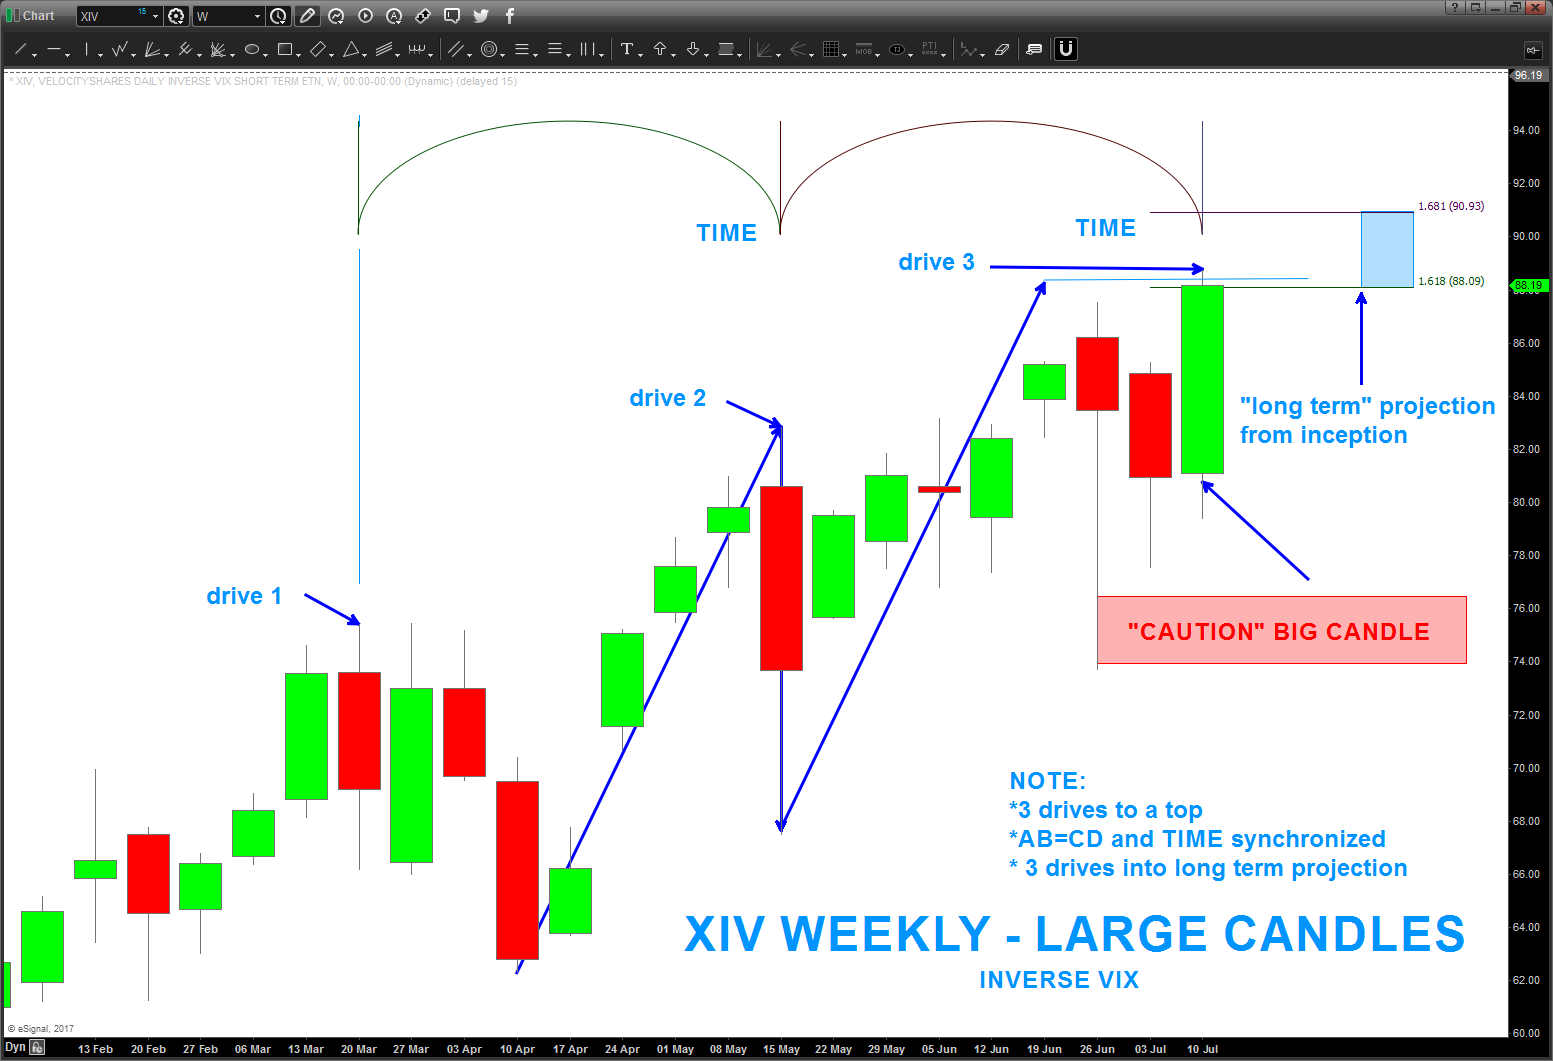
Below, calling out a very nice 3 drive to a top w/ price and time symmetry and, additionally, the XIV is smacking into 1.618/1.68179 projections from the date of inception. Man, if it smacks into this level and keeps rolling it’s going to be Space-X rocket.
NOTE: if your thinking the VIX is going to spike (XIV to go down) watch out – the candle going into this level is pretty large and bullish …
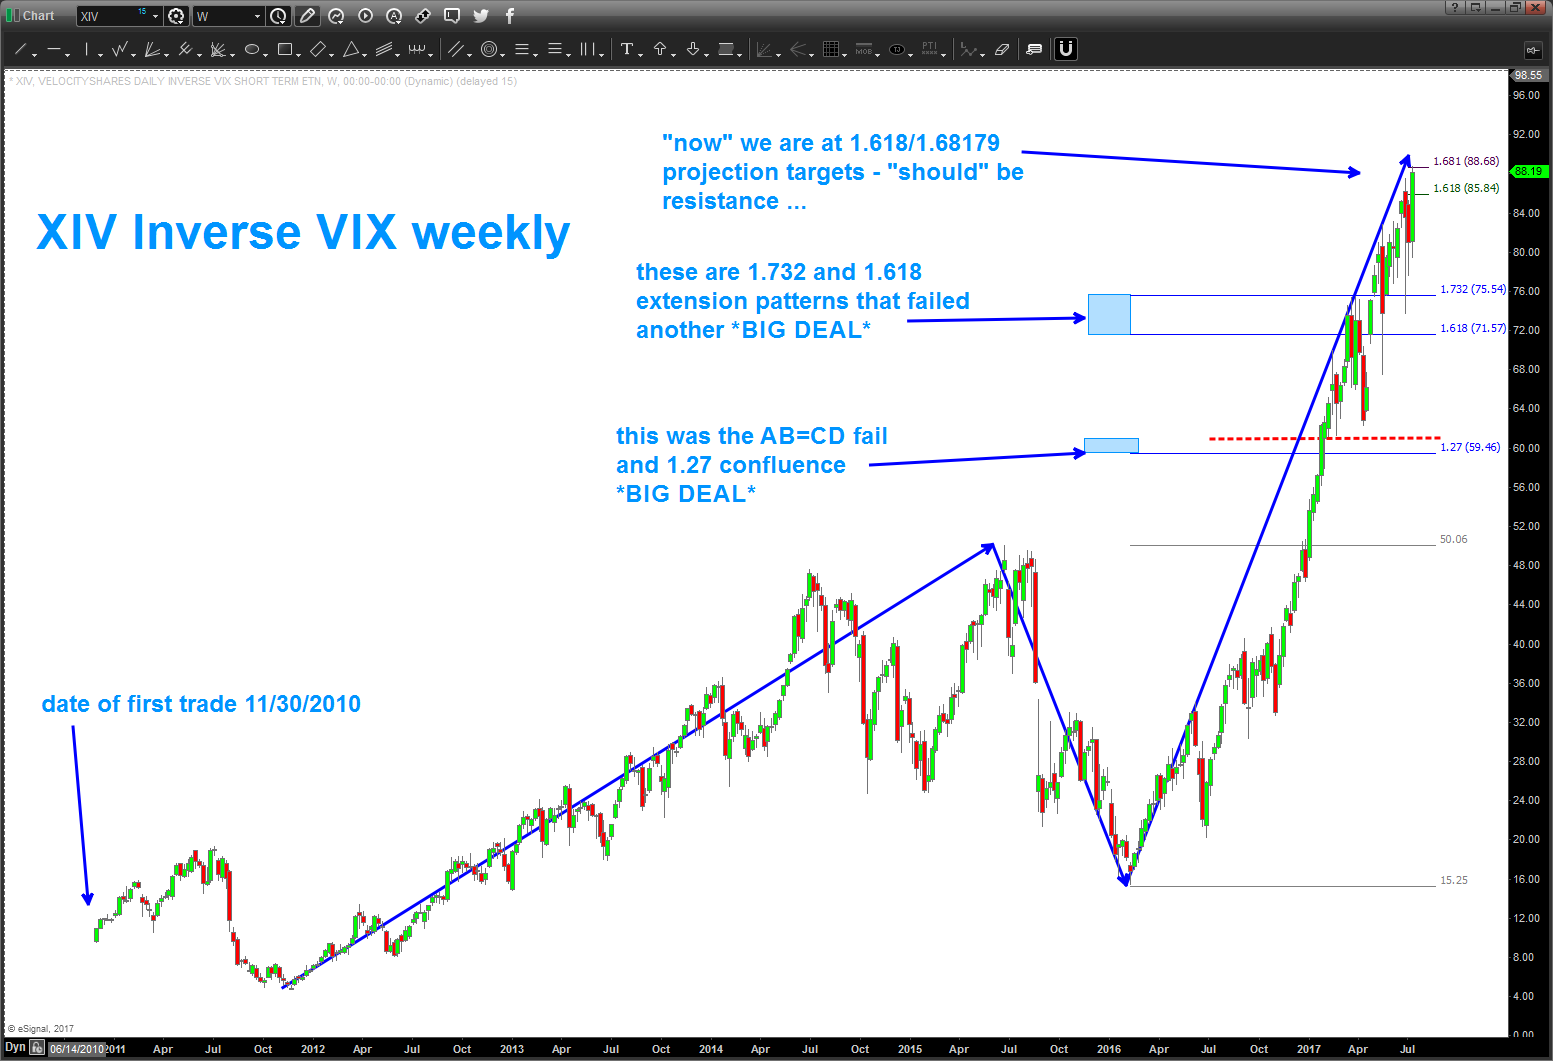
this chart below is the WEEKLY blown up to capture the most recent price action:
____________________________________________________________________________________________
Interesting chart … XIV (inverse VIX) UPDATED
Posted on July 16, 2017 Leave a Comment
07/16/2017 – NEWS FLASH Volatility is historically low (insert sarcasm here) .. as you can below on the first chart the XIV (inverse VIX) has simply CRUSHED any semblance of patterns as it screams to new highs. Sheesh! But, the more parabolic it becomes the more likely it will parabolically collapse. I’m not saying the market is going to crash all I’m saying is PARABOLIC take off’s NEVER end well. So, ride it while you can …
Below, calling out a very nice 3 drive to a top w/ price and time symmetry and, additionally, the XIV is smacking into 1.618/1.68179 projections from the date of inception. Man, if it smacks into this level and keeps rolling it’s going to be Space-X rocket.
NOTE: if your thinking the VIX is going to spike (XIV to go down) watch out – the candle going into this level is pretty large and bullish …
this chart below is the WEEKLY blown up to capture the most recent price action:
____________________________________________________________________________________________
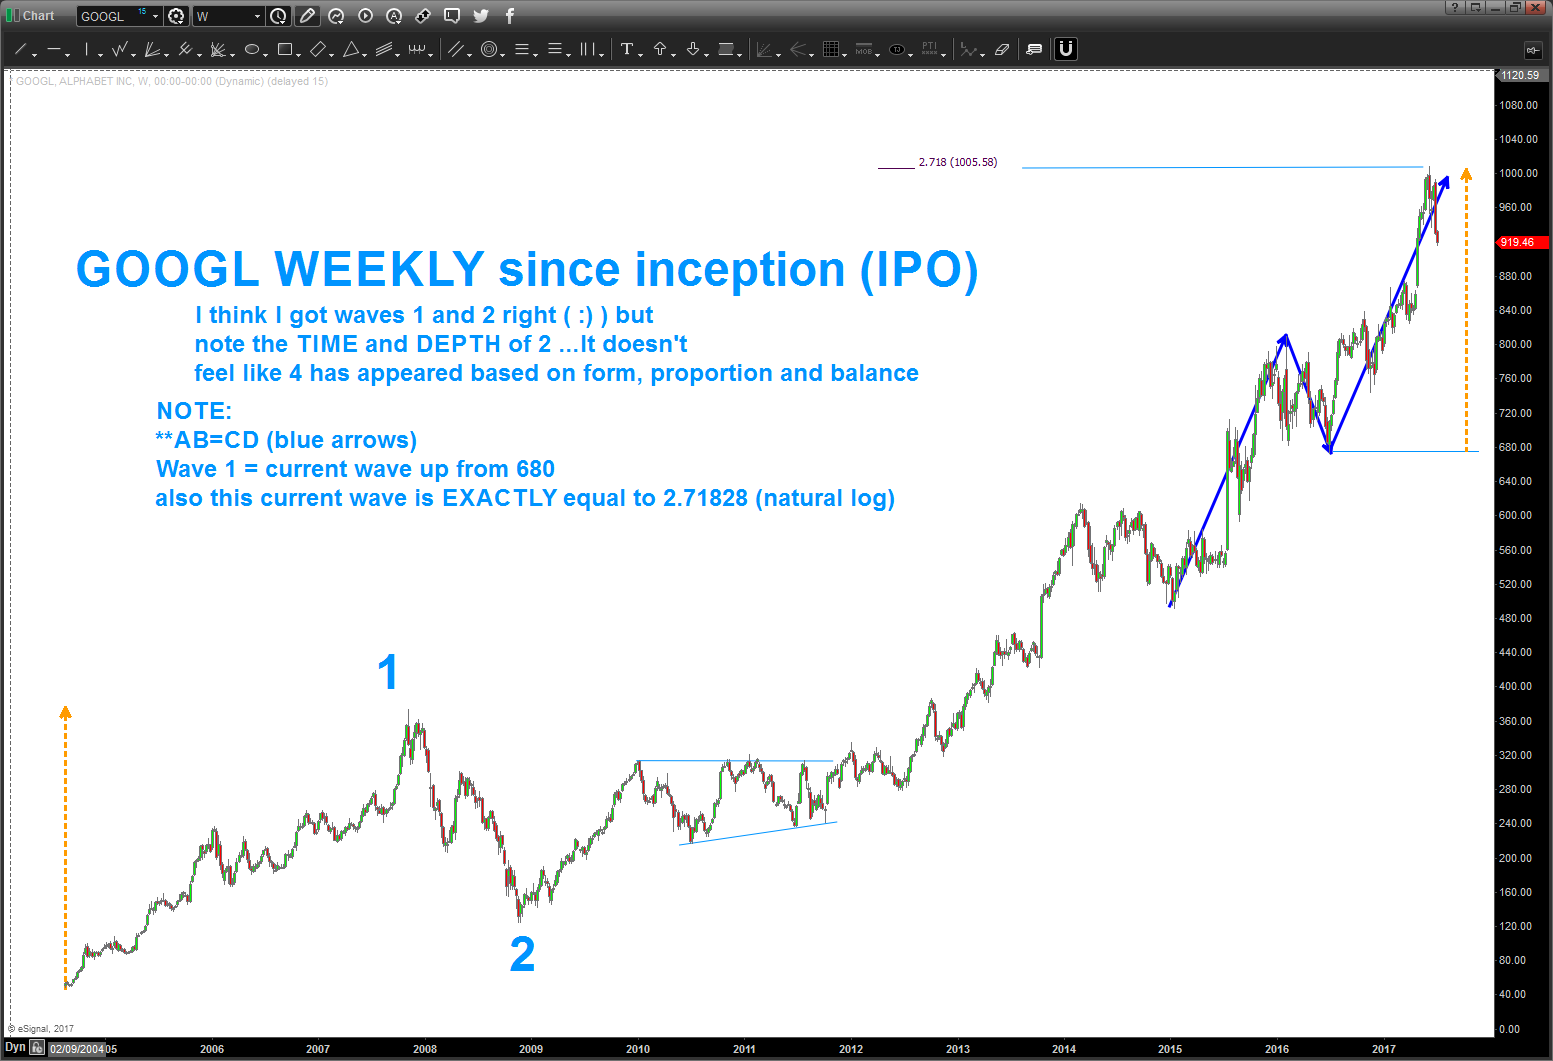
GOOGLE update
Posted on July 16, 2017 Leave a Comment
07/16/2017 – well, the area defined below did hold and, thus far, show a lot of strength blasting off from this area. for now, would look for 998-990 to act as near term resistance. There isn’t a lot of form/structure to look for a pattern SELL so for now watch the numbers discussed in the last sentence.
Chart below is an intraday – 4 hour chart of GOOGL.
Hope your having a good weekend.
Bart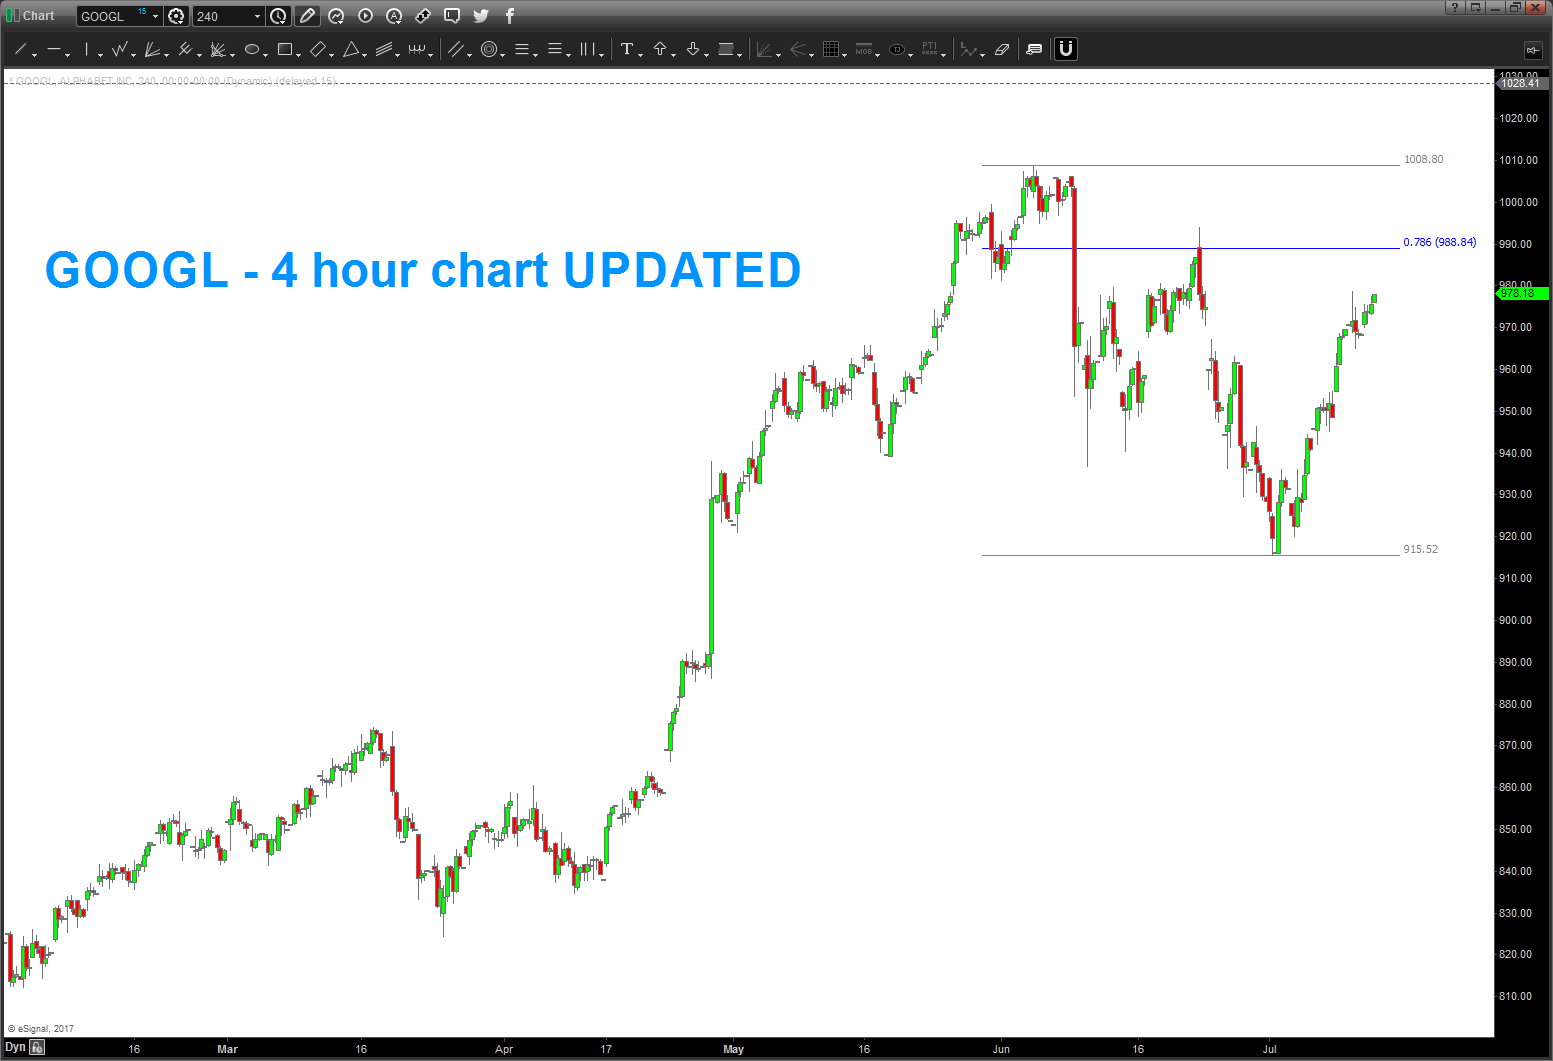
_______________________________________________________________________________________
I’ve spent some time over @seeitmarket working on GOOGLE. This was my last post:
As you are probably aware, it blew thru the target area. Now, it did spend roughly a year and half at the target level but in the end it blasted off.
Back to the drawing board …
Where are we now .. well, being a pattern dude and trying not to inject personal opinion I just try to call it like I see it. GOOGLE has a nice pattern hitting … so if the bull run is to continue current levels or a little lower need to hold.
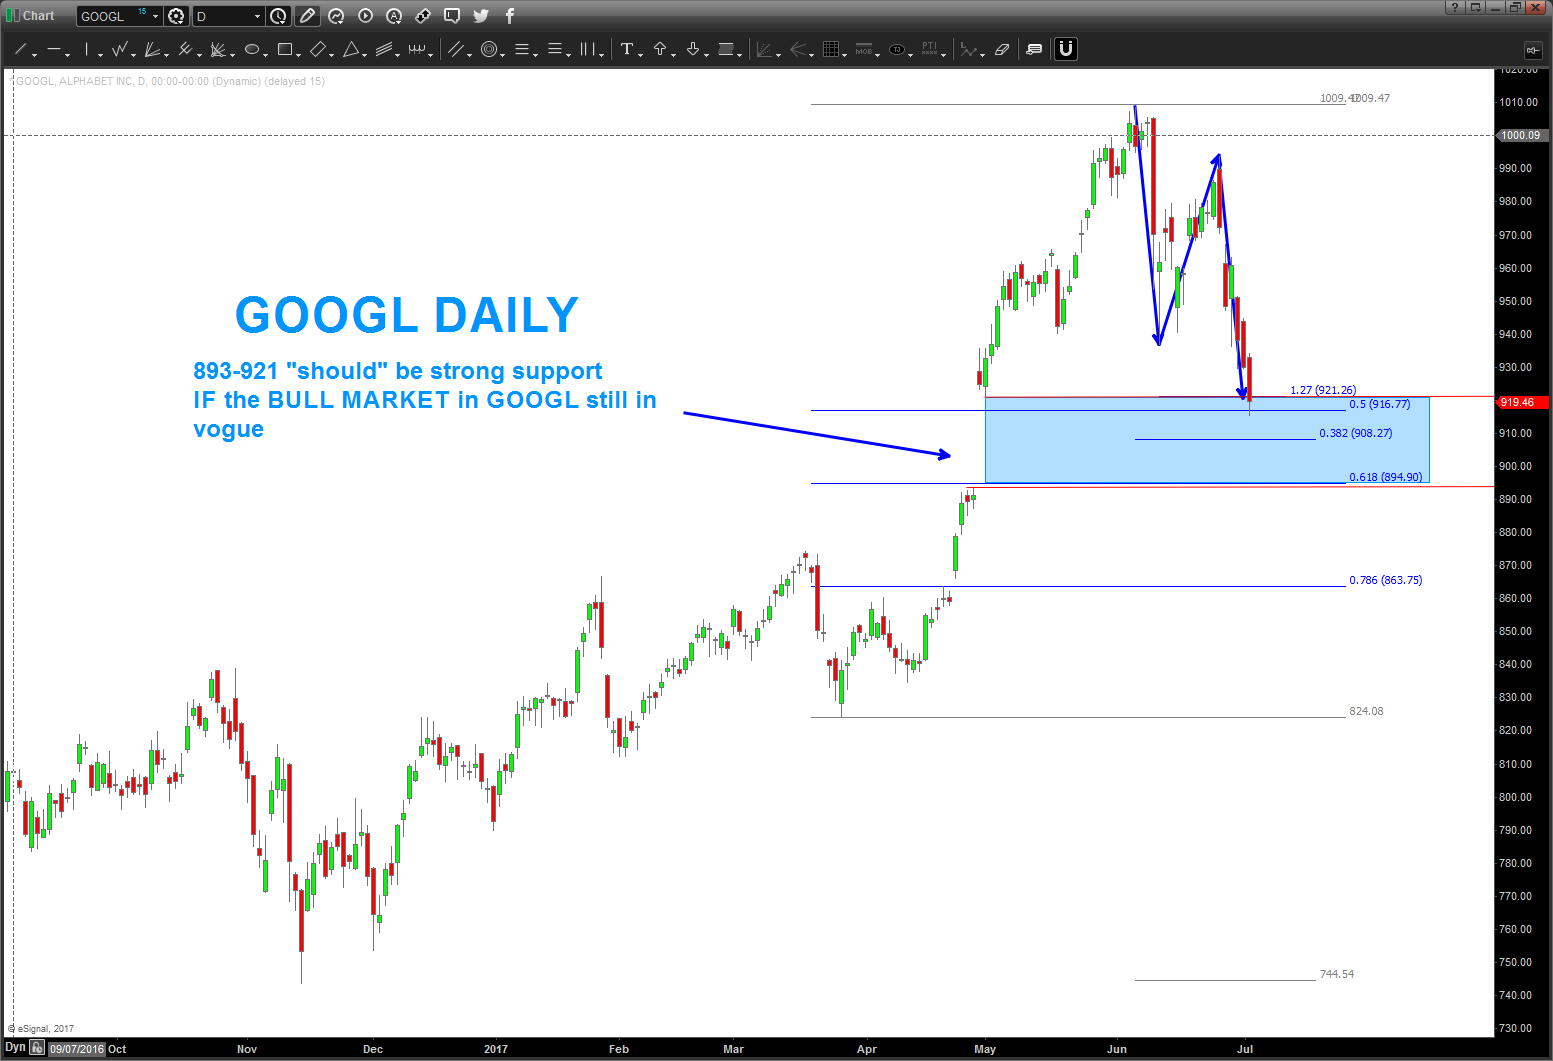
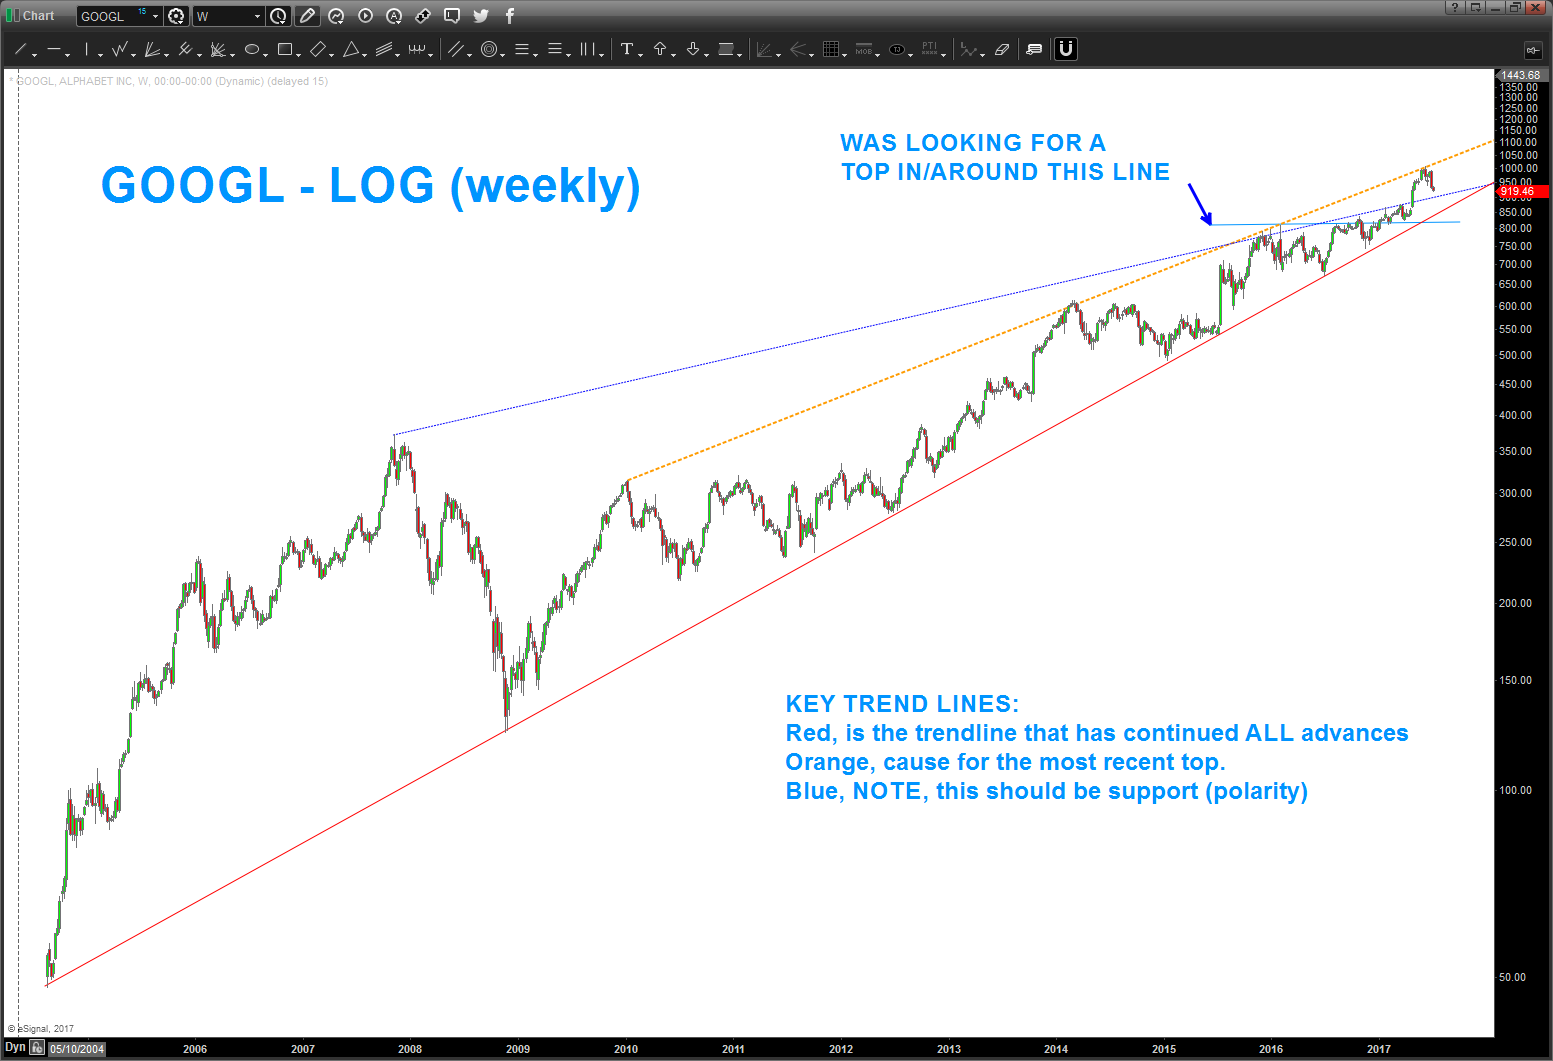
I tried (being the operative word) to give a realistic count. Ha, that didn’t work … but I know where waves 1 and 2 are! I’m going to keep the rest of the chart after 2 clear .. want to see what happens around the buy level above. But note the chart below .. some interesting stuff going on …AB=CD (blue arrows), Wave 1 equals the current wave .. and wave 1 *2.71828 exactly nailed the top (yes the natural log number – it’s a key number folks). So, we shouldn’t be that surprised on the resistance found on GOOGL
Also, you know I love long term LOG trend lines. As the chart below shows, we have 3 key trend lines … I recommend monitoring the blue and red lines. the blue, from the polarity principle, SHOULD be strong support. If that breaks, then a move to the red trend line (the one that has been the key support for ALL advances) should get attacked. IF WE BREAK BELOW (on a weekly close (?)) THAT TREND LINE THIS PUPPY COULD REALLY ACCELERATE TO THE DOWNSIDE. So, monitor GOOGL closely.