USD vs Japanese Yen coming close to resolution (?)
Posted on October 22, 2017 Leave a Comment
10/22/2017 – we discussed the ‘RSI SHIFT’ below. taking note of it again …have been on the sidelines w/ regards to the USD vs YEN as I’m waiting for resolution of the downtrend line shown …
note: still in the ‘maybe’ camp of 2 being done … so were going to be watching the YEN very closely in the coming days/weeks. In the past, YEN strength hasn’t been too good for US Stocks …

—————————————————————————————————————————————————————————
here’s some work that I’ve been doing on the YEN: https://bartscharts.com//?s=yen
just taking a look at the weekly RSI and, when I trained under Constance Brown she said “the market will tell you when it’s shifting, watch the RSI zones for clues.”
as you can see below … the, what I believe, multi-decade wave 5 occurred in 10/2011 and a VERY powerful advance occurred. You’ve read about my chaos w/in the YEN and how I got stopped out something like 6-8 times (I’ve tried to flush it from my memory) in around 76 ..(yes, 76! and, no one said this was going to be easy!) for what I was expecting was going to be a monstrous ride.
anyway, note how support SHIFTED up after the decades long bear trend … (see dashed green lines) and how, after this correction – which might be pretty much complete it the support and resistance has now shifted down (see dashed red lines) ….
I’m in no mans land right now .. while I believe another advance of the USD against the YEN may be forthcoming I would have really liked to see the RSI resistance SHIFT back up into the 80’s. So .. while our ‘count’ isn’t complete in this wave, I’m going to step aside and see what happens the rest of the month.
as you can see w/ the ???? it’s time to sit on my hands and see what plays out … that’s only me. you do what you want and follow our plan, as always.
Bart

Proctor and Gamble Pattern
Posted on October 21, 2017 Leave a Comment
PG – lot’s going on here. went up and hit 1.618 extension last week …monthly. daily showing 3 drives to a top also …

KO Coca Cola
Posted on October 21, 2017 Leave a Comment
KO is flirting w/ another breakout to the upside near/around all time highs …
note:
- the monthly .618 price projection is the ‘reason’ for the resistance at 45.66
- the TIME component is .618 the last run and it’s hitting right now …
- perhaps, a double top?
- 3 drives to a top (dashed orange lines) present
IF we get a very strong weekly close higher, then 61 area is the next ‘logical’ stopping point ….

STOXX Banks for a friend overseas …UPDATE 06/09/2019
Posted on October 21, 2017 1 Comment
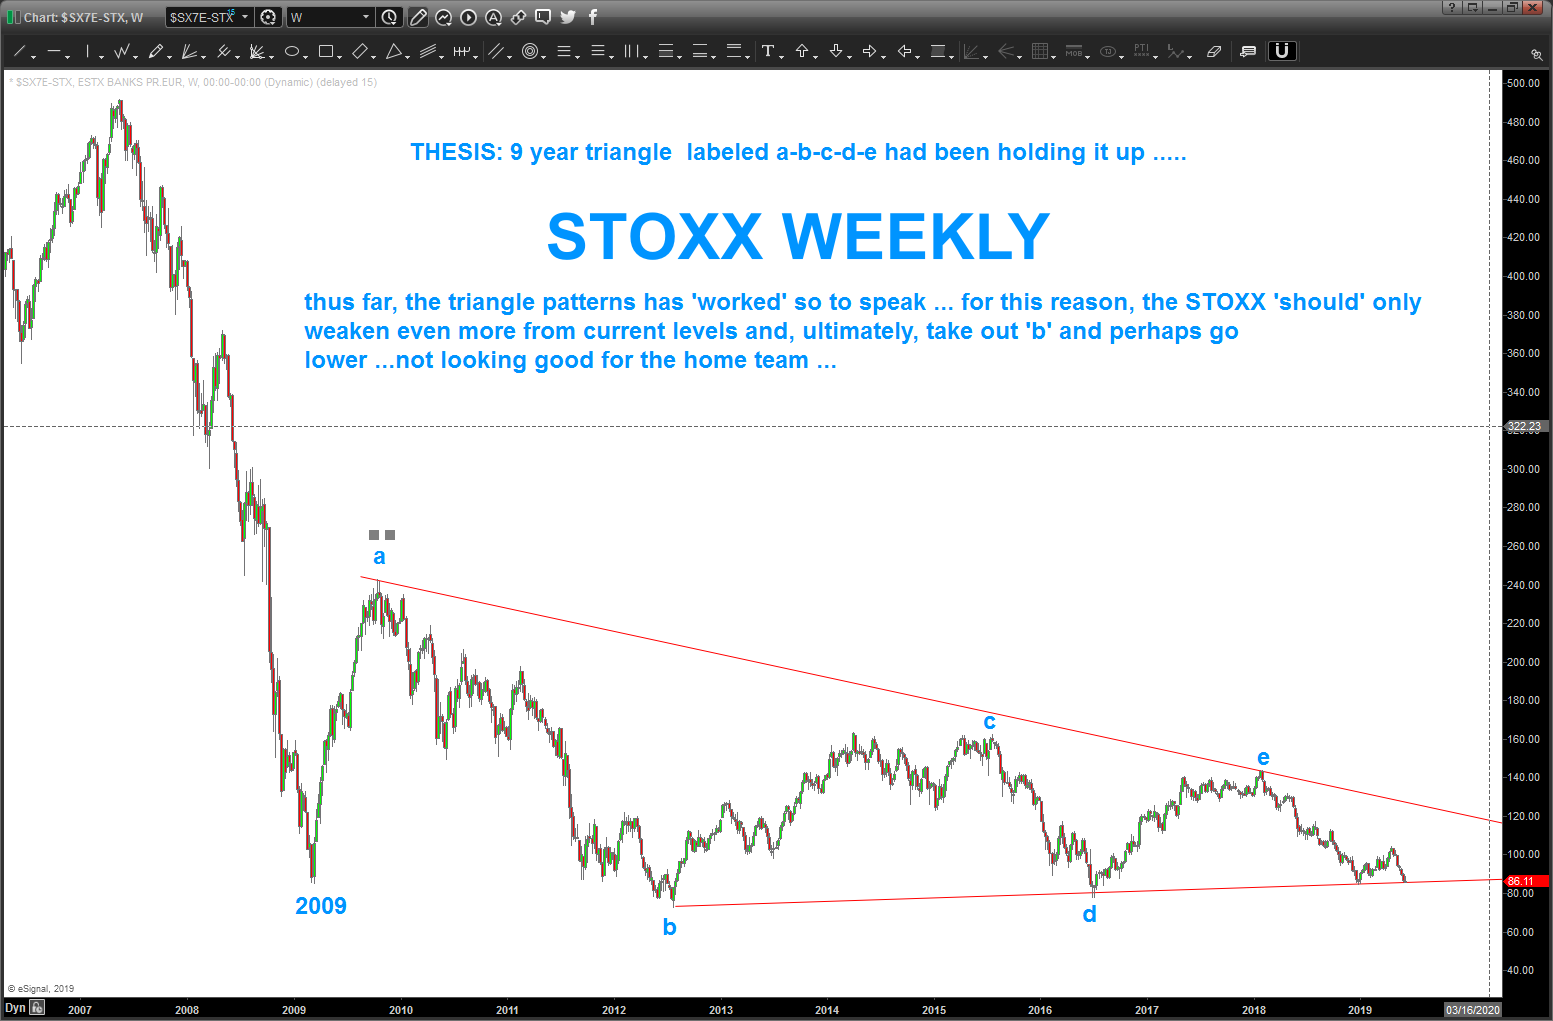
——————————————————————————————————————–06/09/2019 – well, from our point labeled ‘e’ it’s been straight down. From an Elliott perspective we are in another wave lower and it sure doesn’t look good for the home team. expect lower prices in the coming weeks, months. this doesn’t look good.
——————————————————————————————————————–
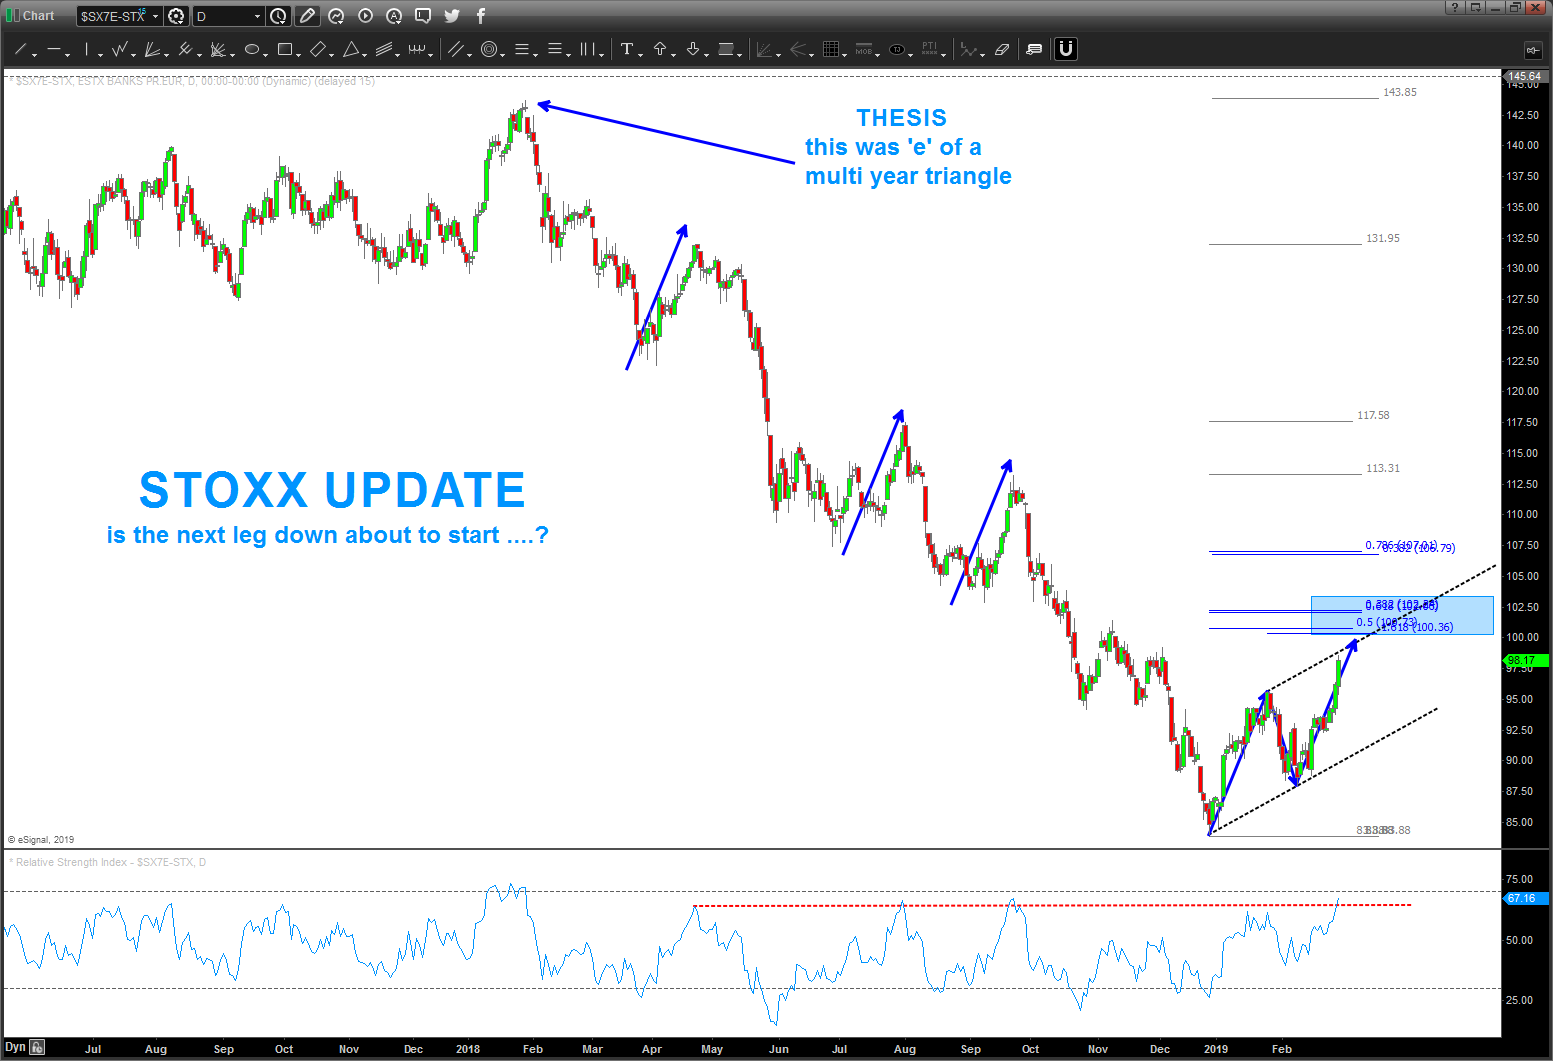
02/28/2019 – well, pattern recognition says you should always BUY or SELL the first AB=CD in an up or down trend. well, the STOXX Banks are almost there w/ regard to an AB=CD sell pattern. So far, the ‘thesis’ around a multi year triangle has worked which means, ultimately, this index will plunge to new lows lower than 20012. Is the next leg down upon us … if the PATTERN works, then yes. If it doesn’t we’ll CTRL-ALT-DEL and look for another pattern. HEADS UP OVER THERE ACROSS THE ATLANTIC!
____________________________________________________________________________________________________________________________________________________________
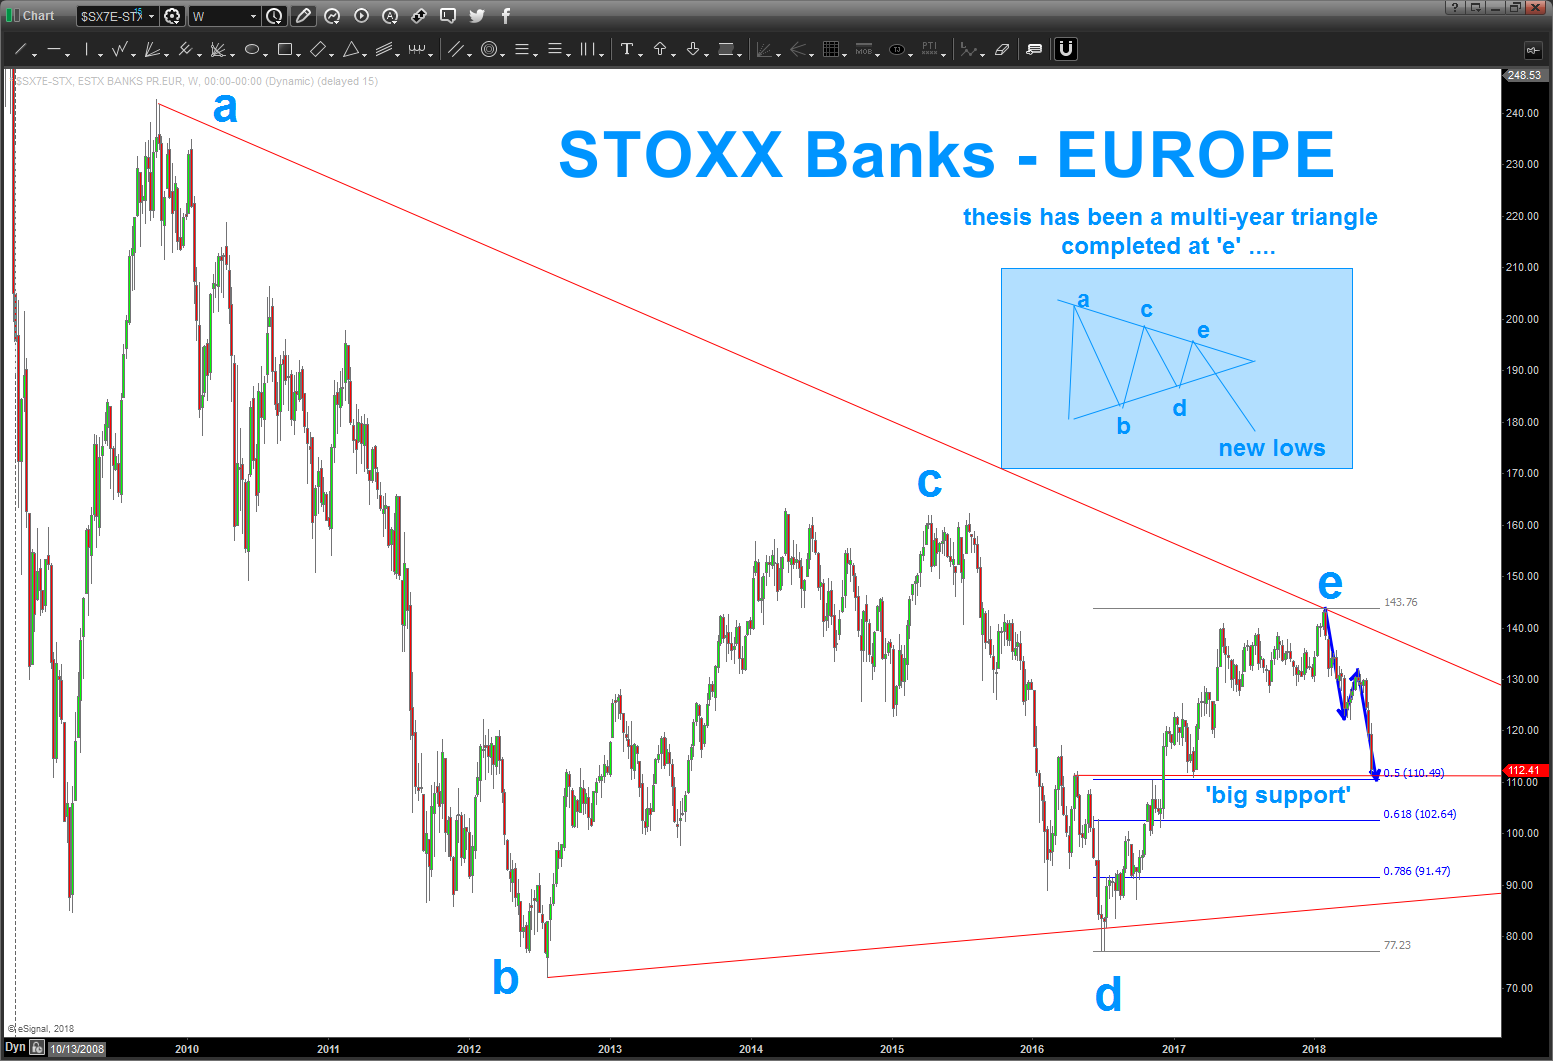
05/29/2018 – well, it is certainly not looking good in Europe and, as I just posted, we could certainly be on the verge of a contagion.
Contagion: the ready transmission or spread as of an idea or emotion from person to person. “A contagion of fear” is what we are talking about …
So, you can see we have completed a ‘pattern’ in the 112 area BUT the candles are huge coming into this level so … expect this to give way but for right now, this is a very important line in the sand.
—————————————————————————————————————————————
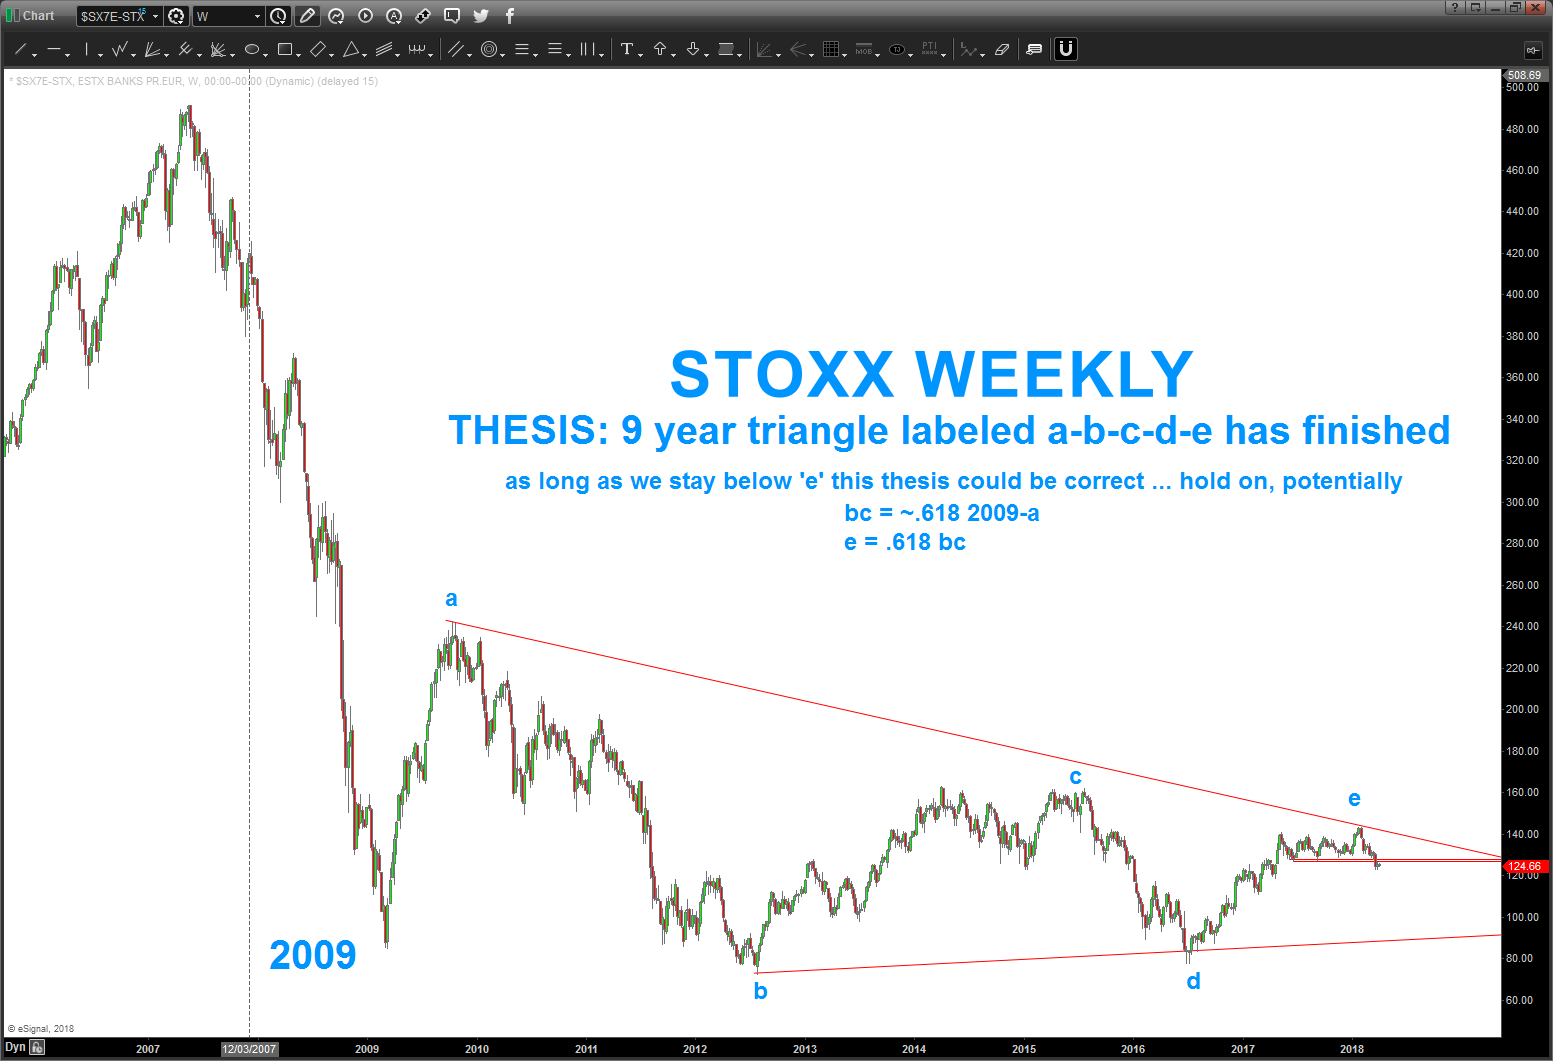
04/03/2018 – well, after roughly a year, the consolidation broke to the downside and as crazy as it seems, the triangle thesis is still a probability which is, to say it lightly, pretty darn bearish. So, would expect polarity come into play and former support becomes resistance. If we get back above that support around 126-127 then we’ll continue to evaluate. For now, that’s the resistance line in the sand where support now becomes resistance. Good grief … let me know if you have any questions. Man, that took a while to break down!
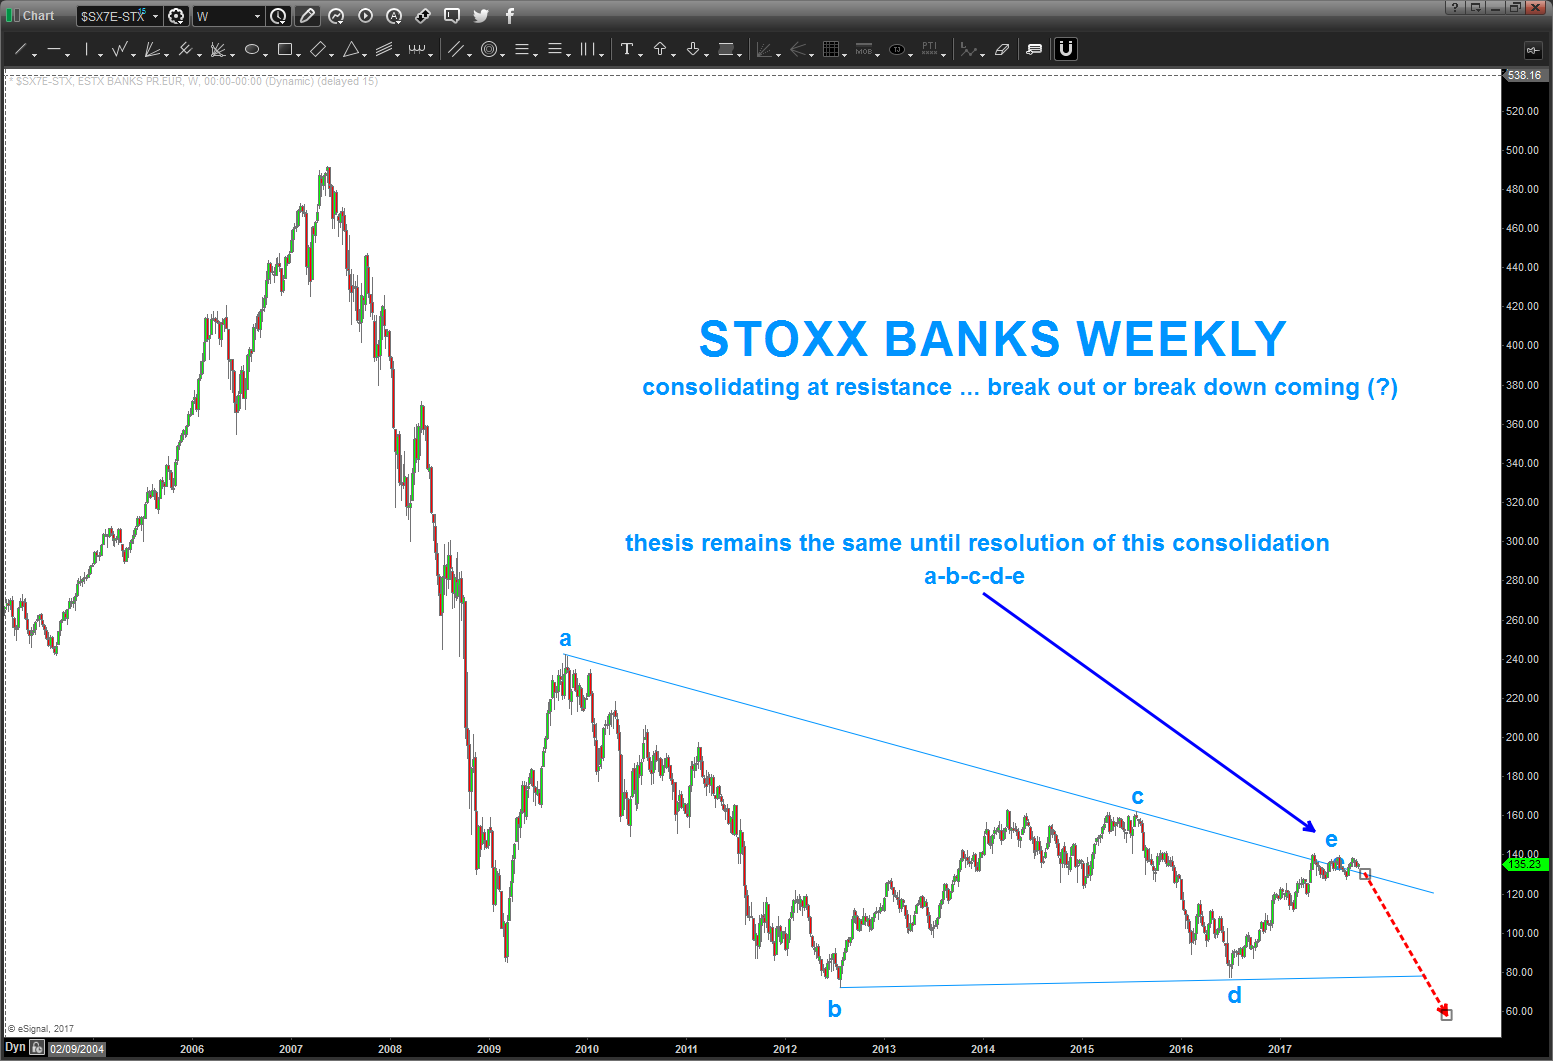
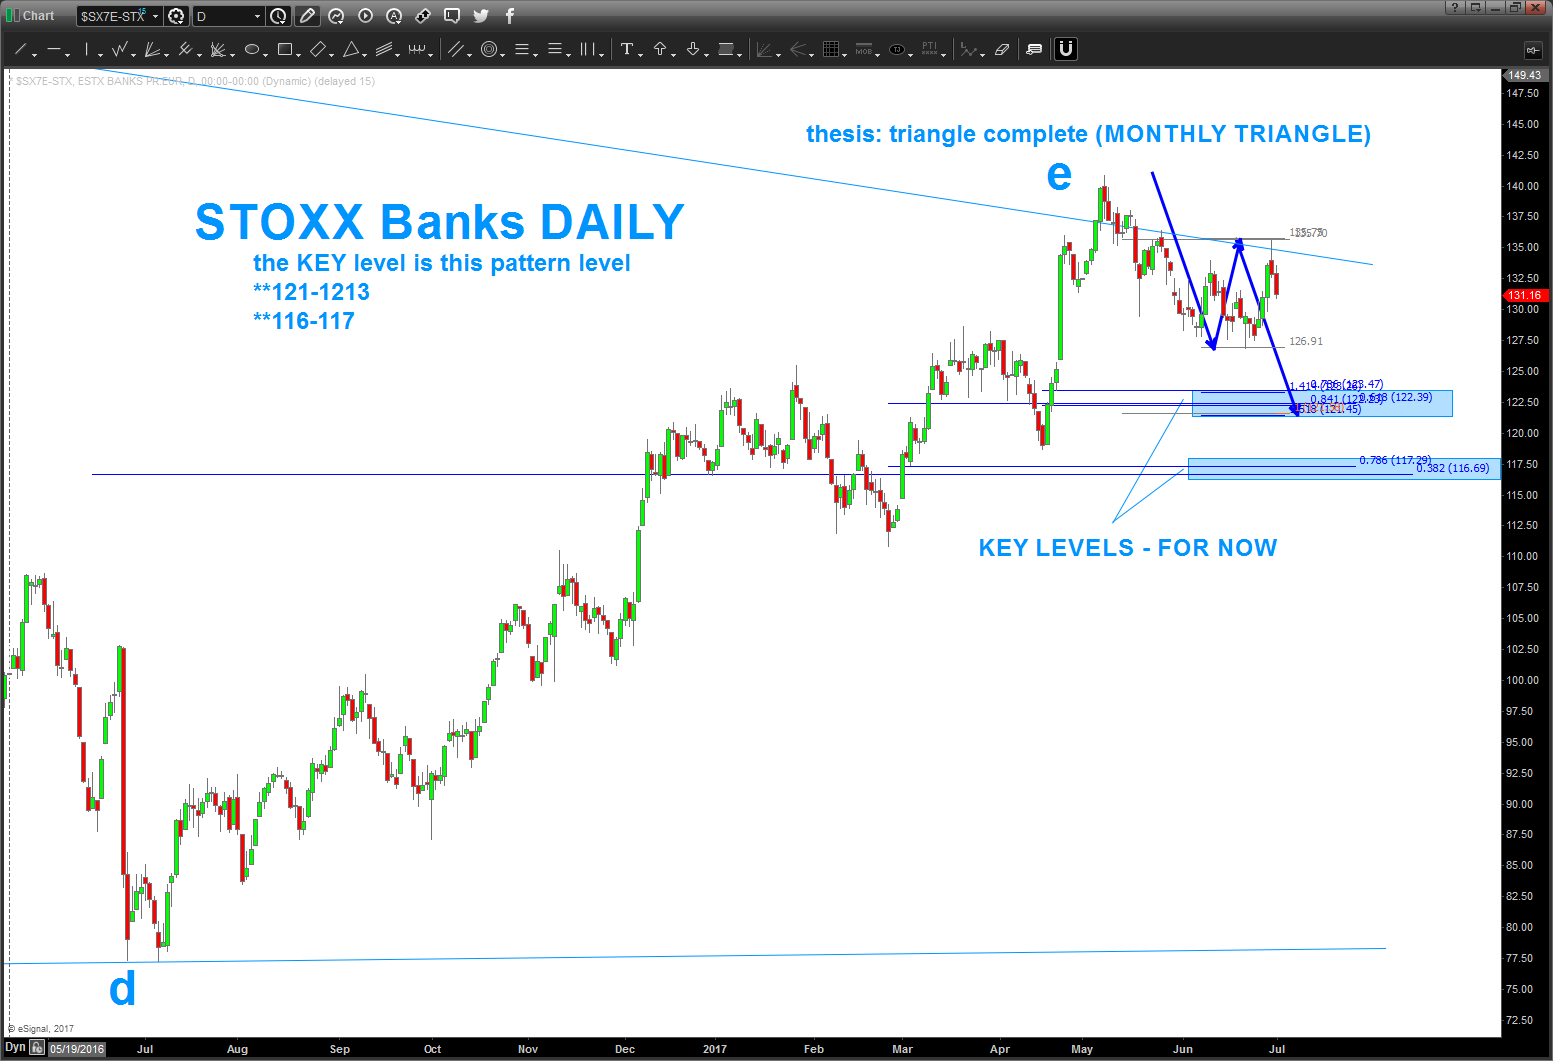
10/21/2017 – continues to consolidate. at present long term/large triangle thesis is still in play. key level remains 114.18.
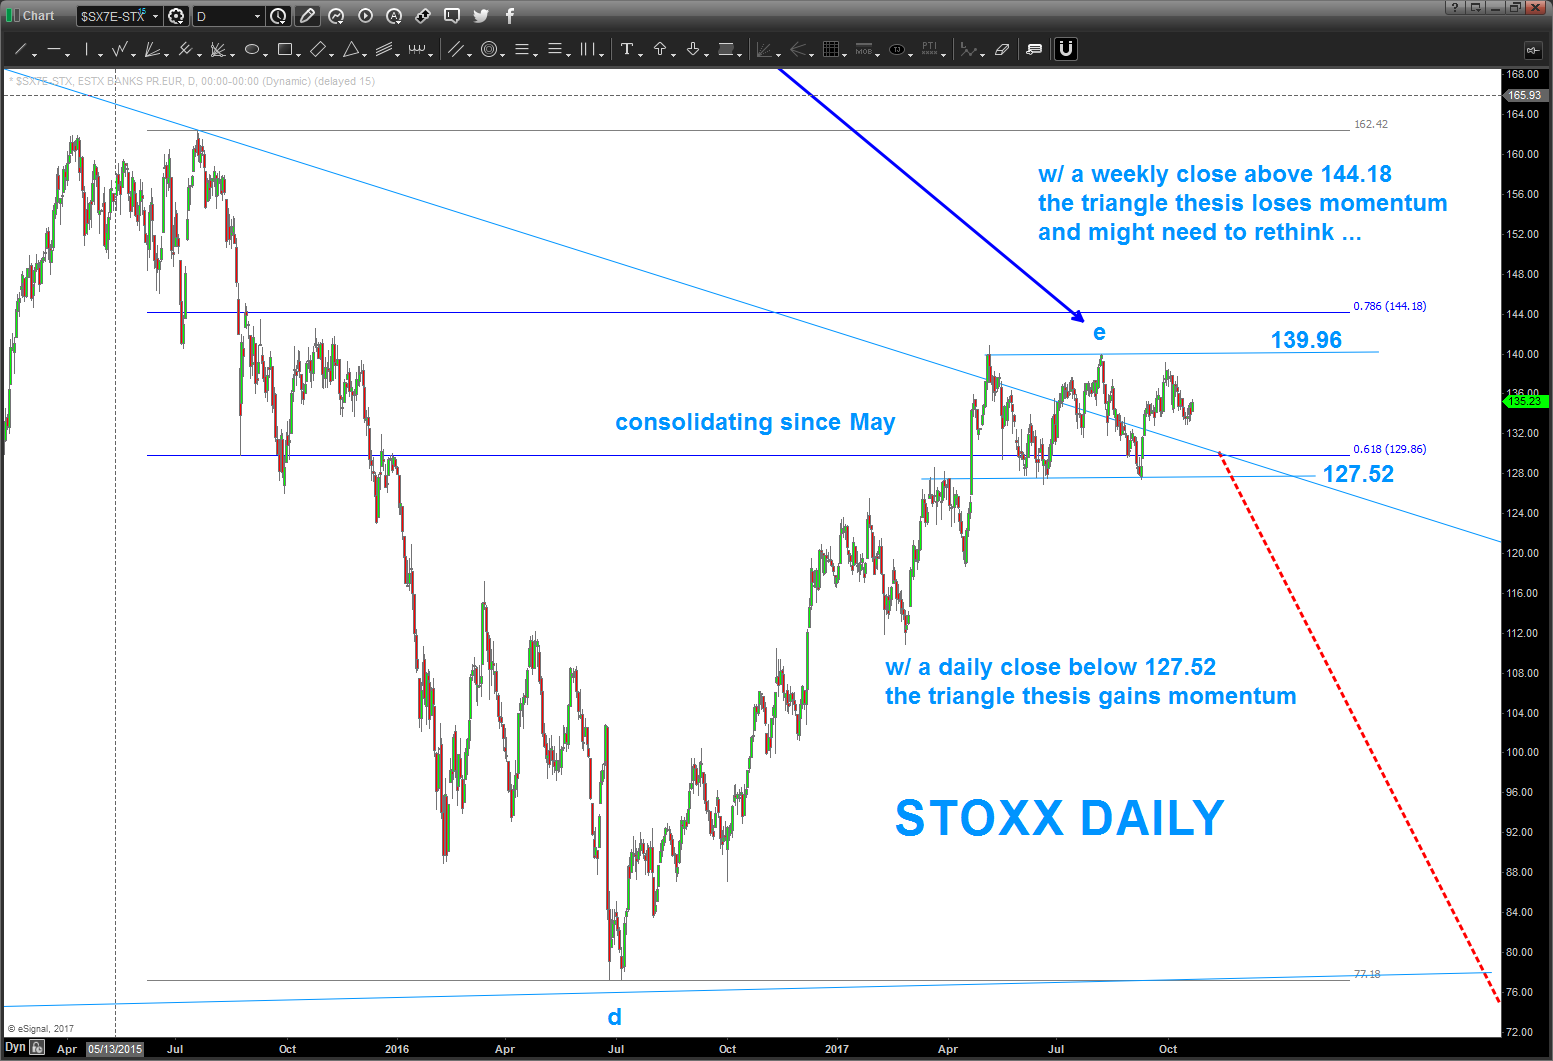
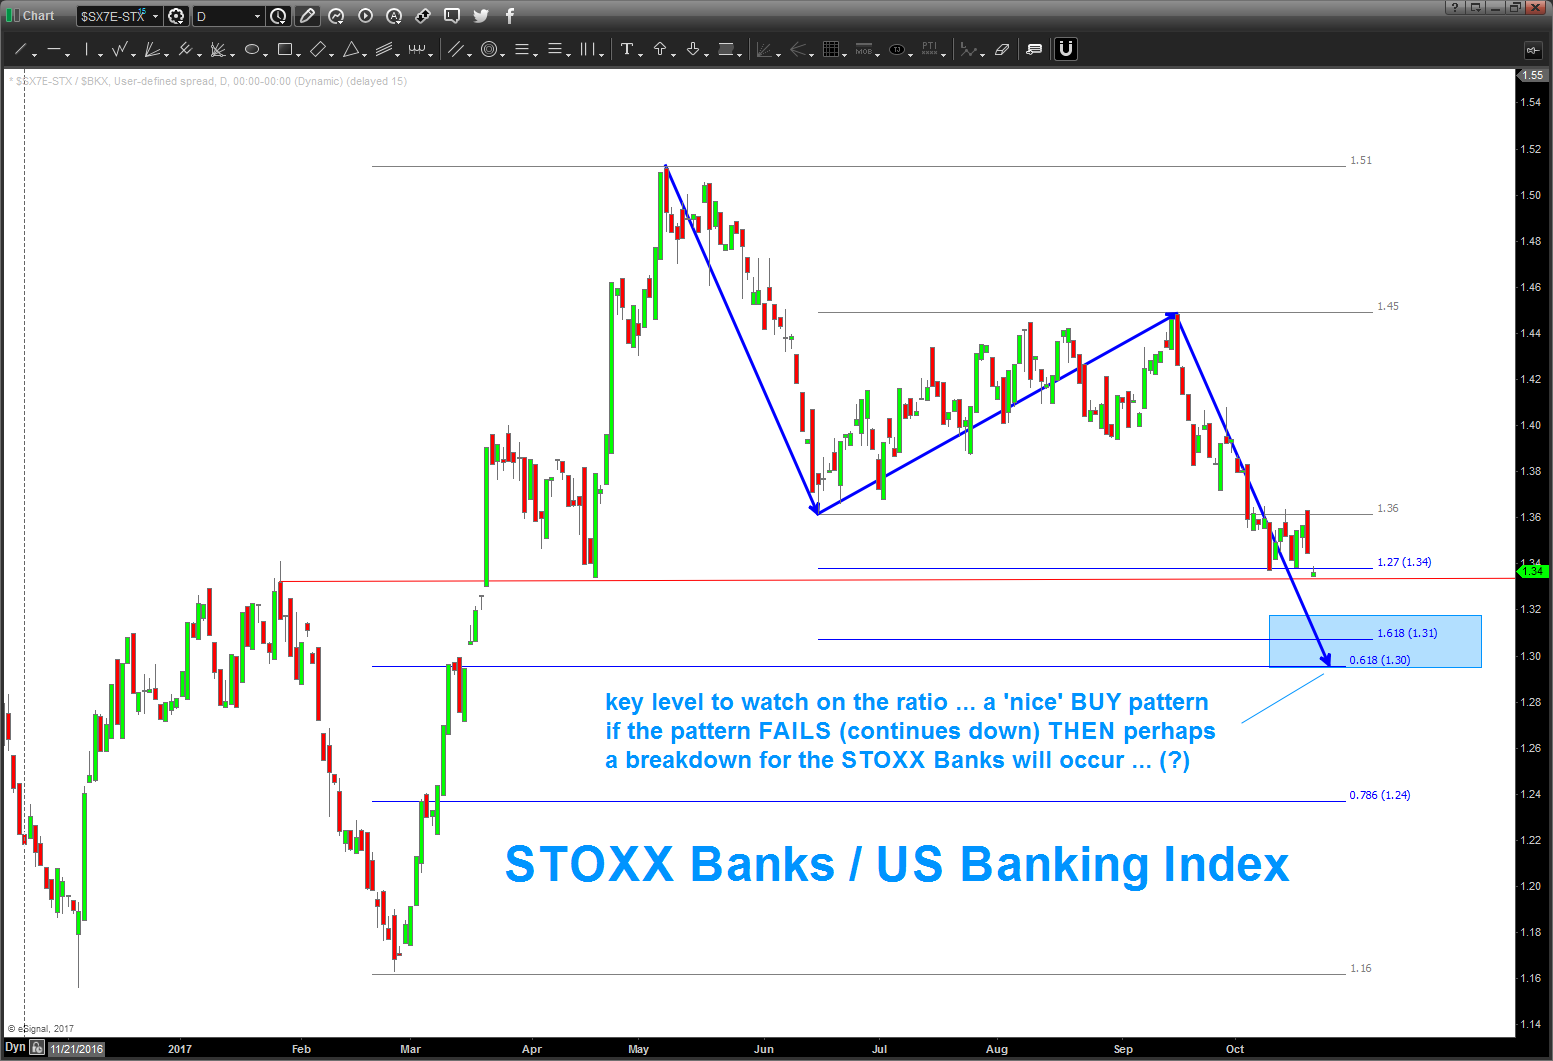
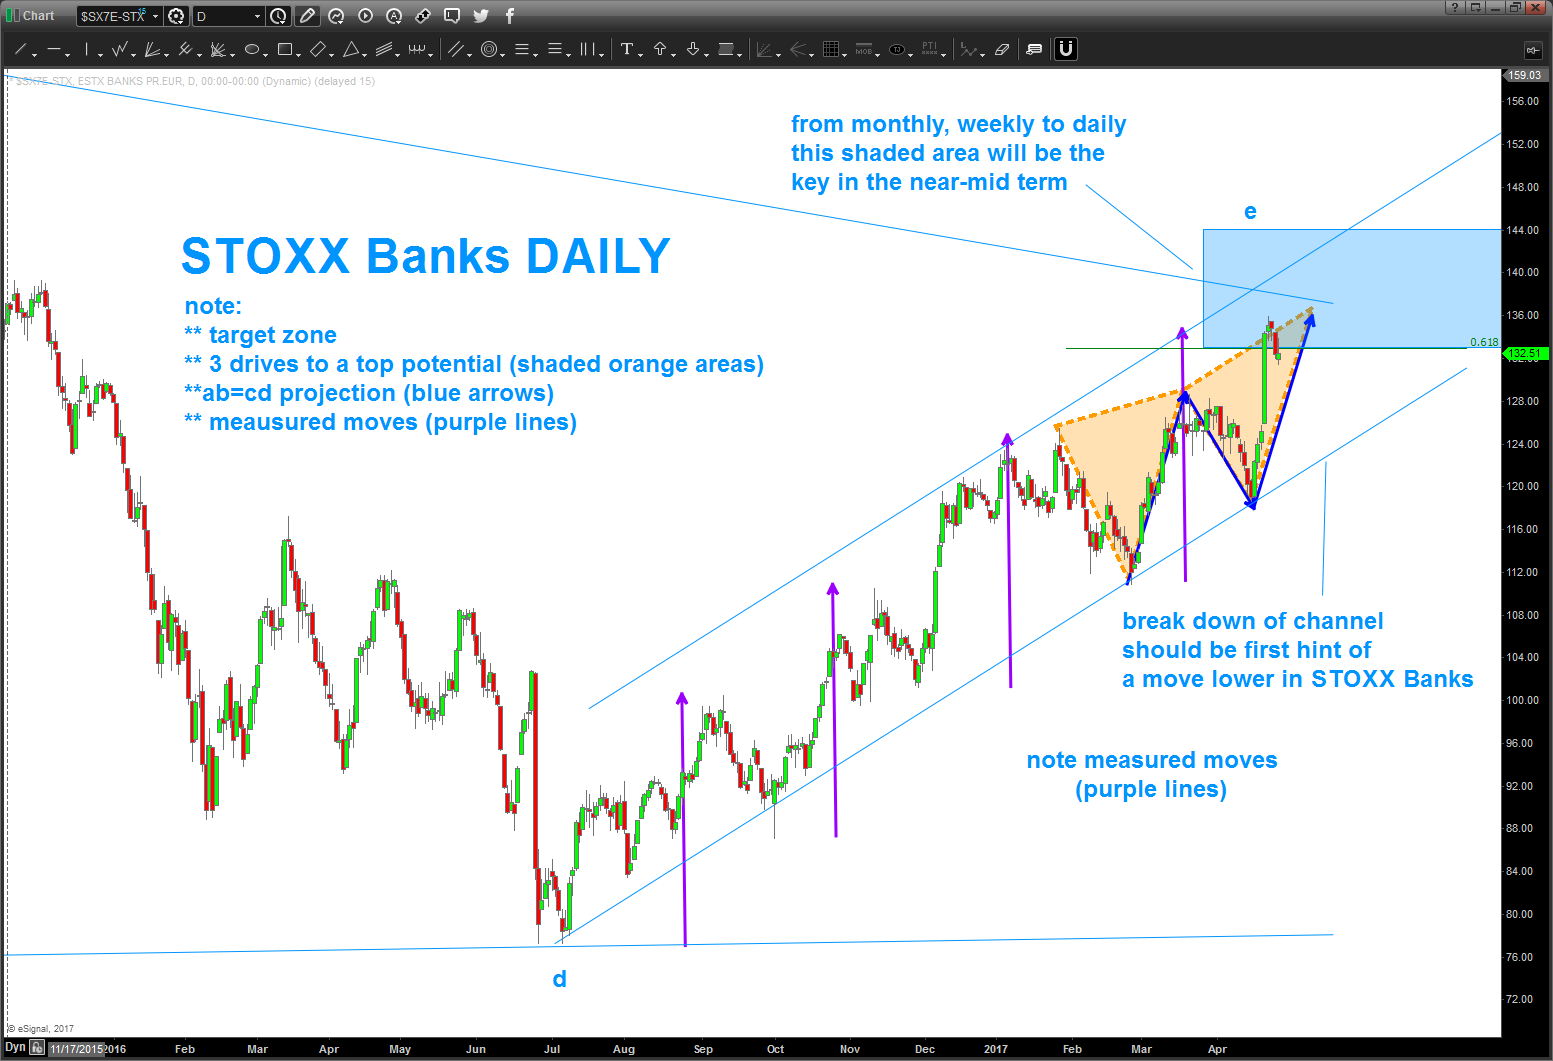
*** important development. on the daily chart below a very ‘nice’ BUY pattern is appearing a little lower. IF this PATTERN FAILS THEN perhaps this will cause further weakness in STOXX and start to resolve the consolidation that has been going on for 6 months …
————————————————————————————————————————————————————–
08/05/2017 – recent strength appears to want to take out the 139.67 high. However, the key levels still remain as shown below. A DAILY CLOSE above 144.28 will make me rethink scenario below. Hope this helps …
Bart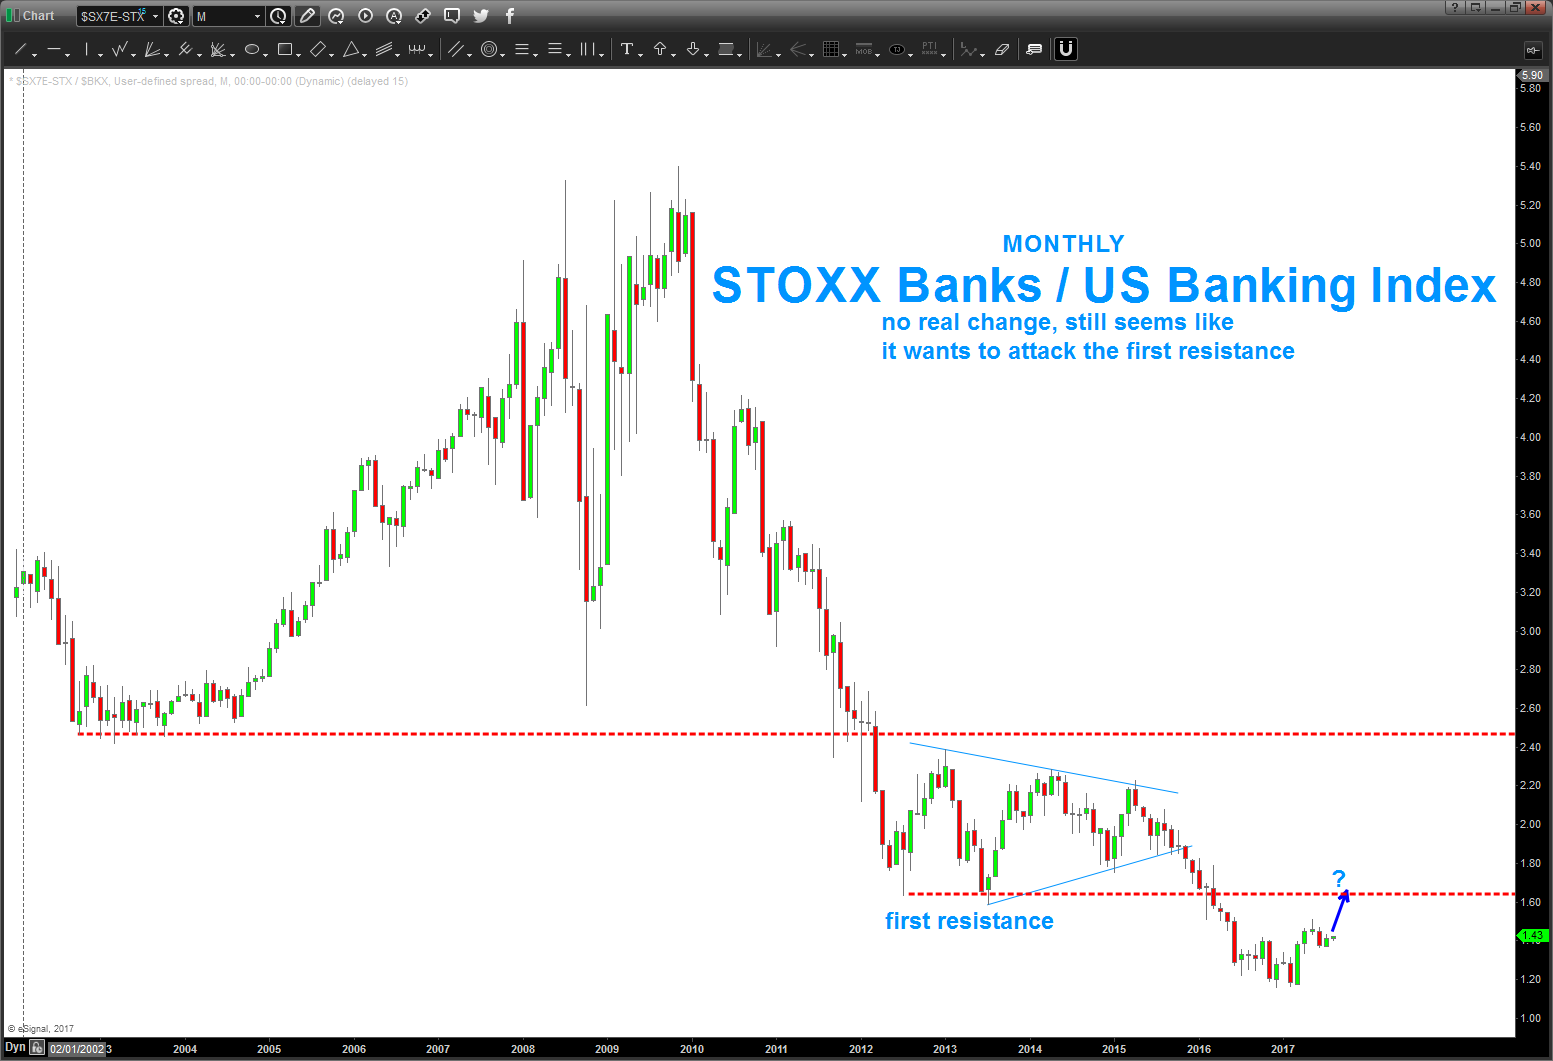
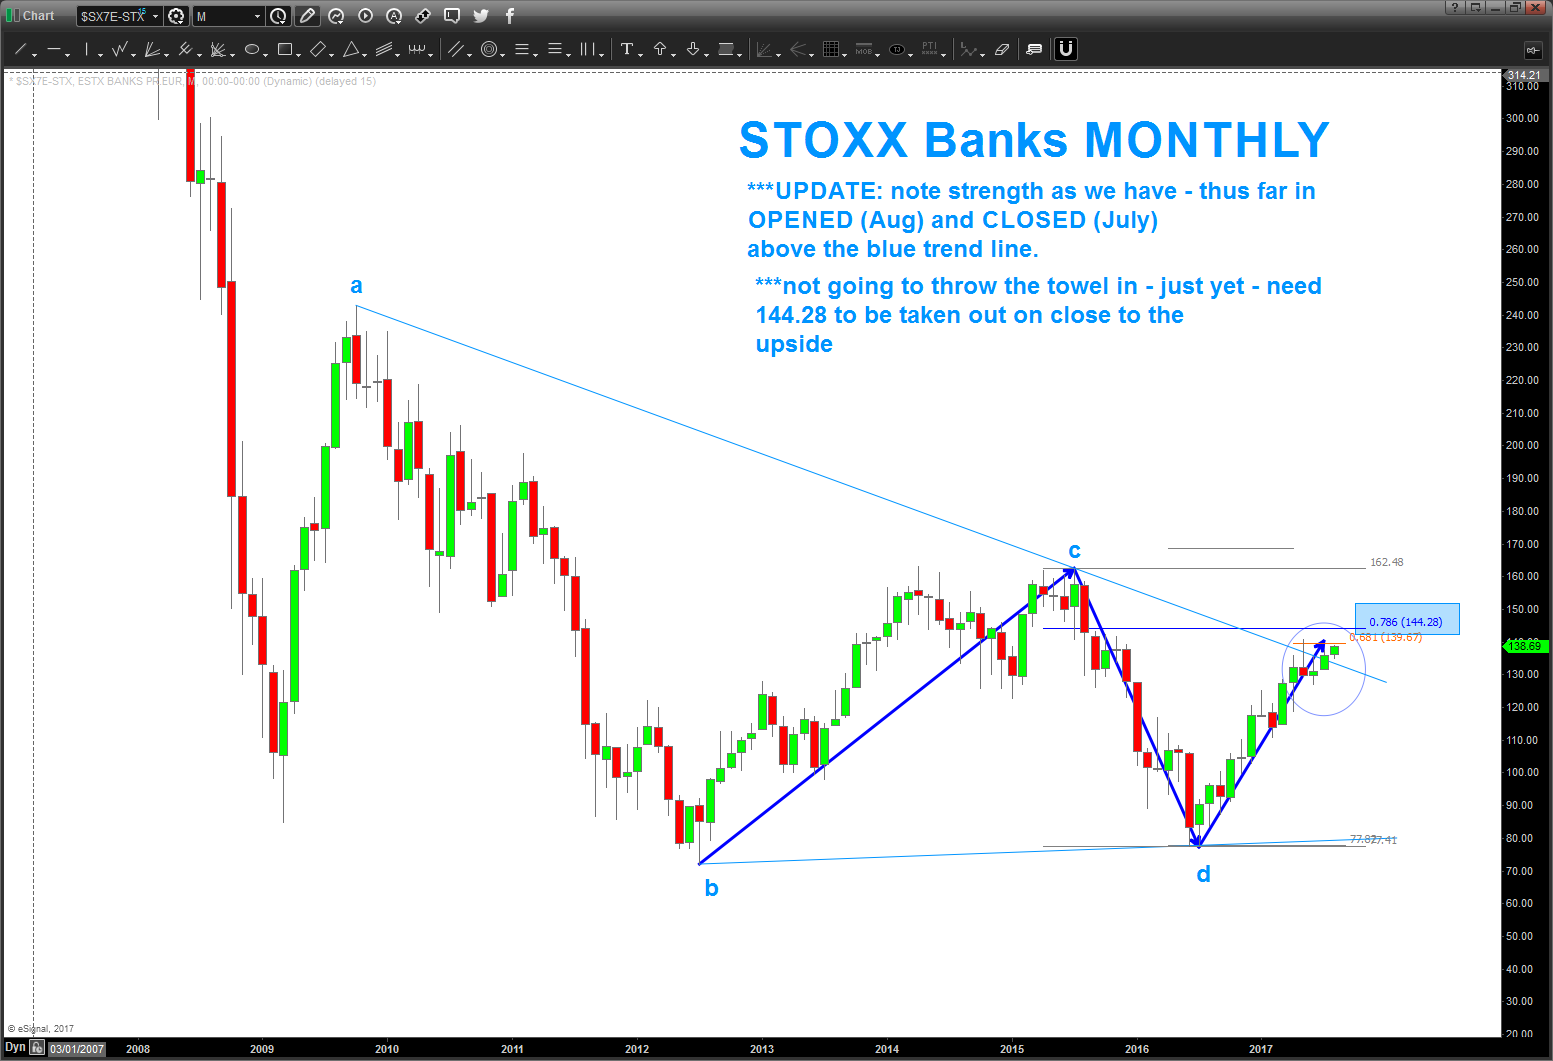
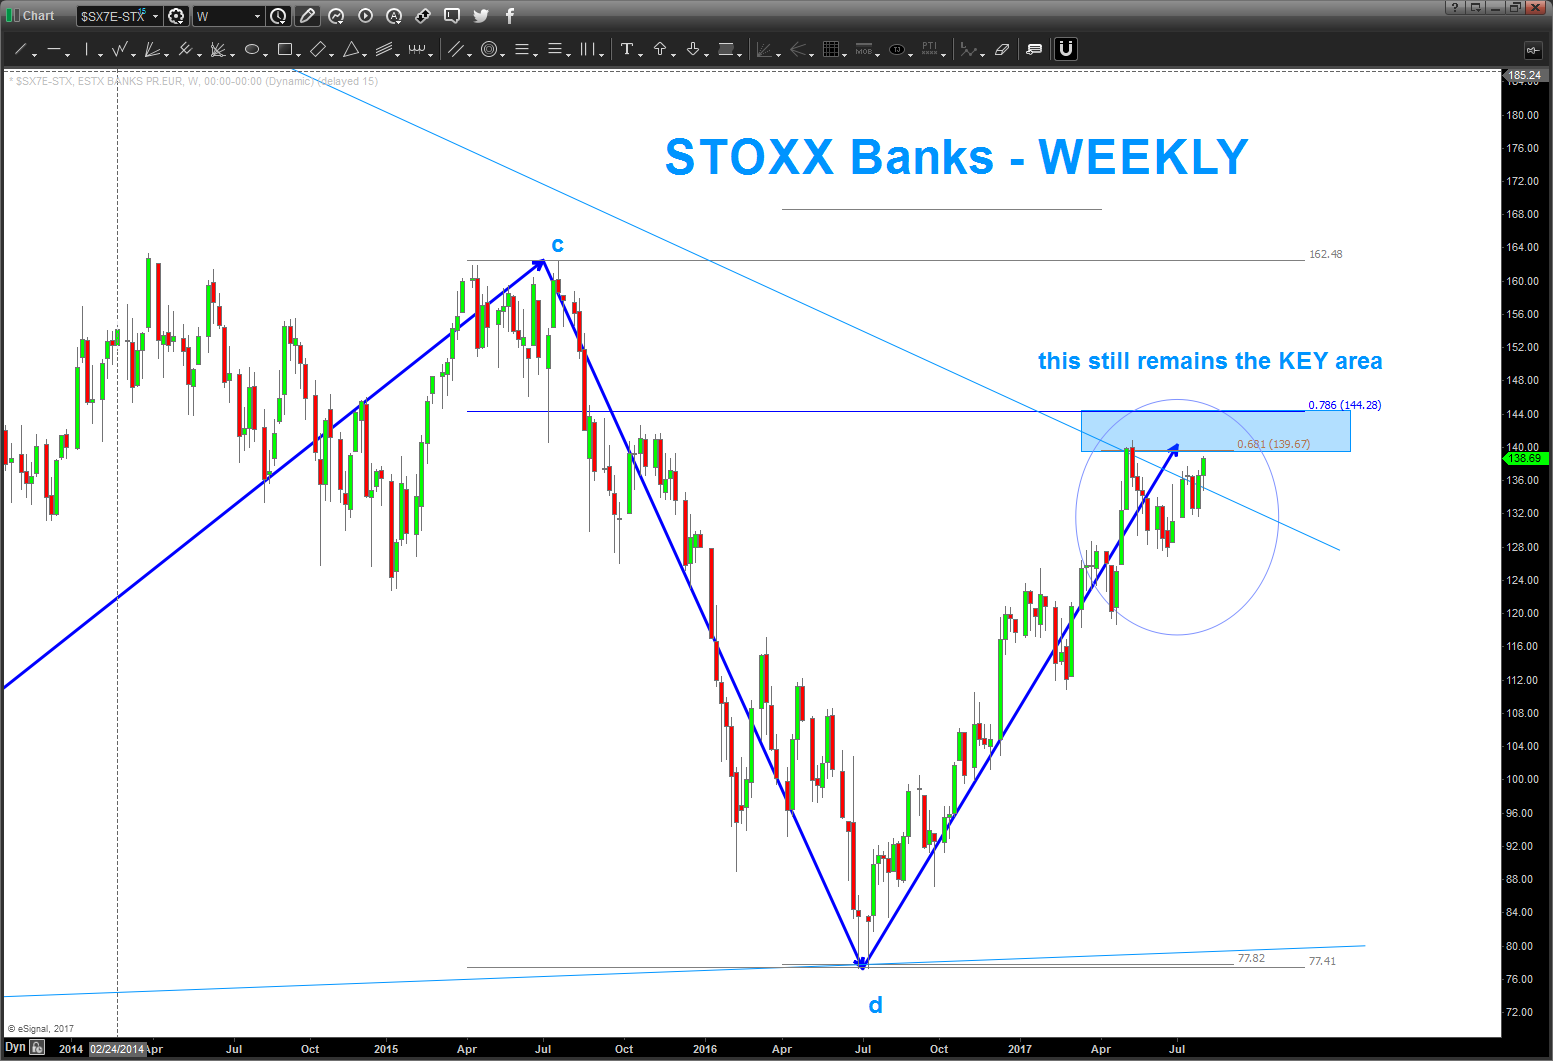
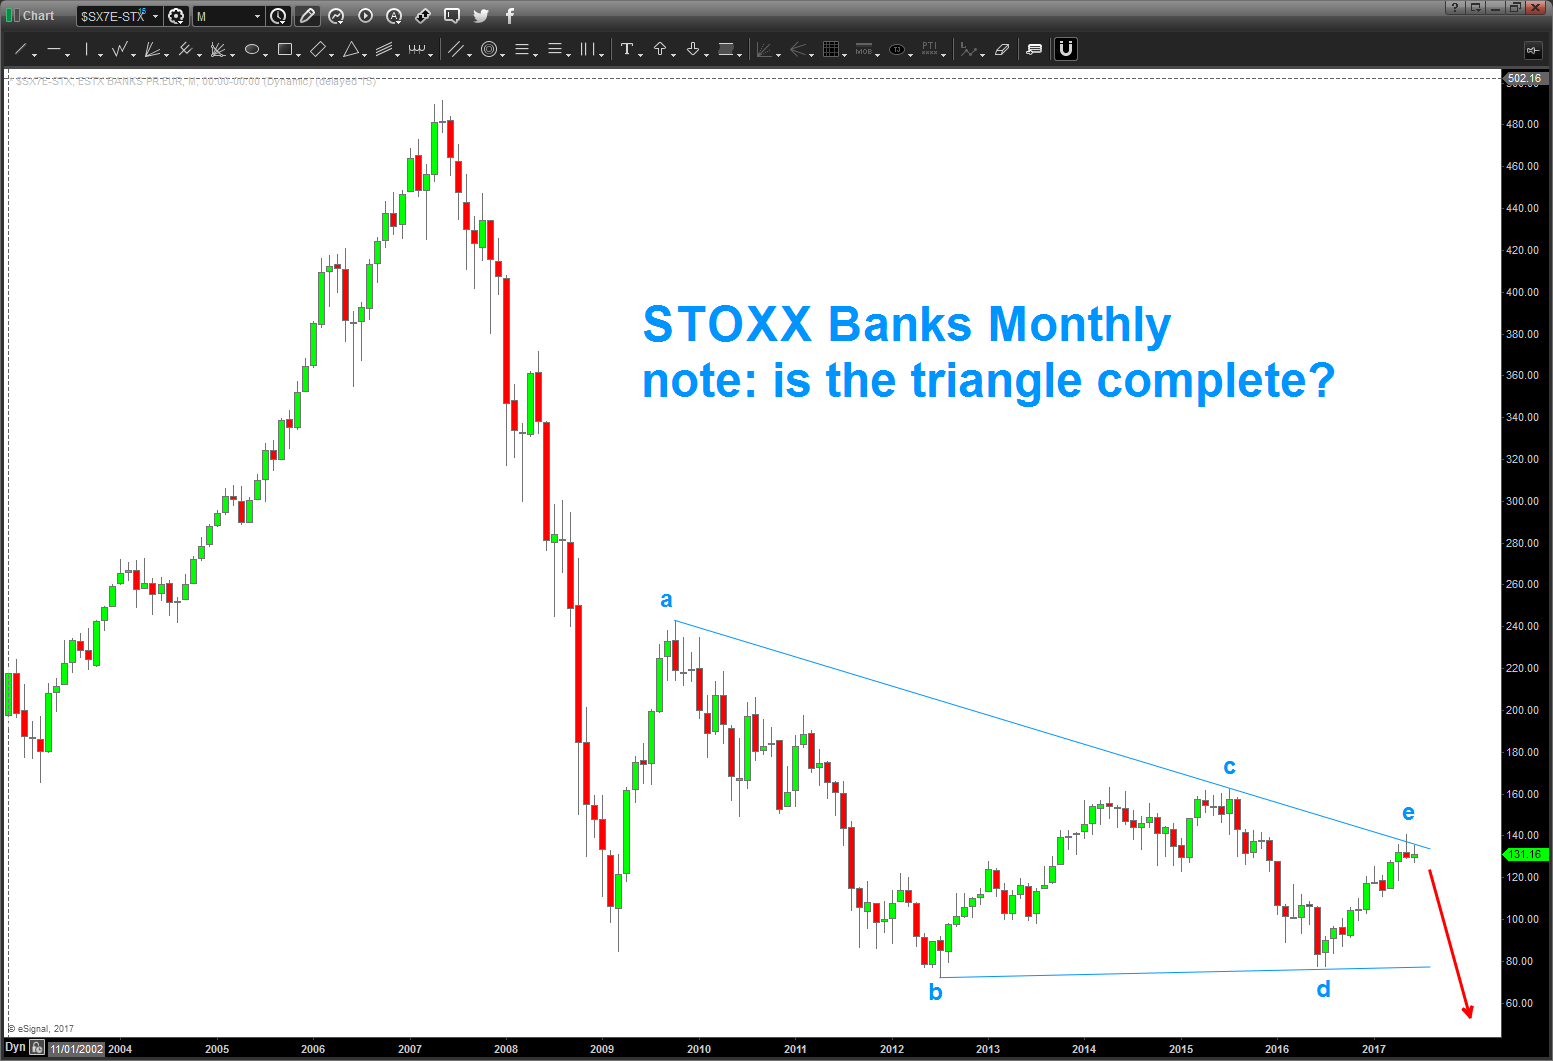
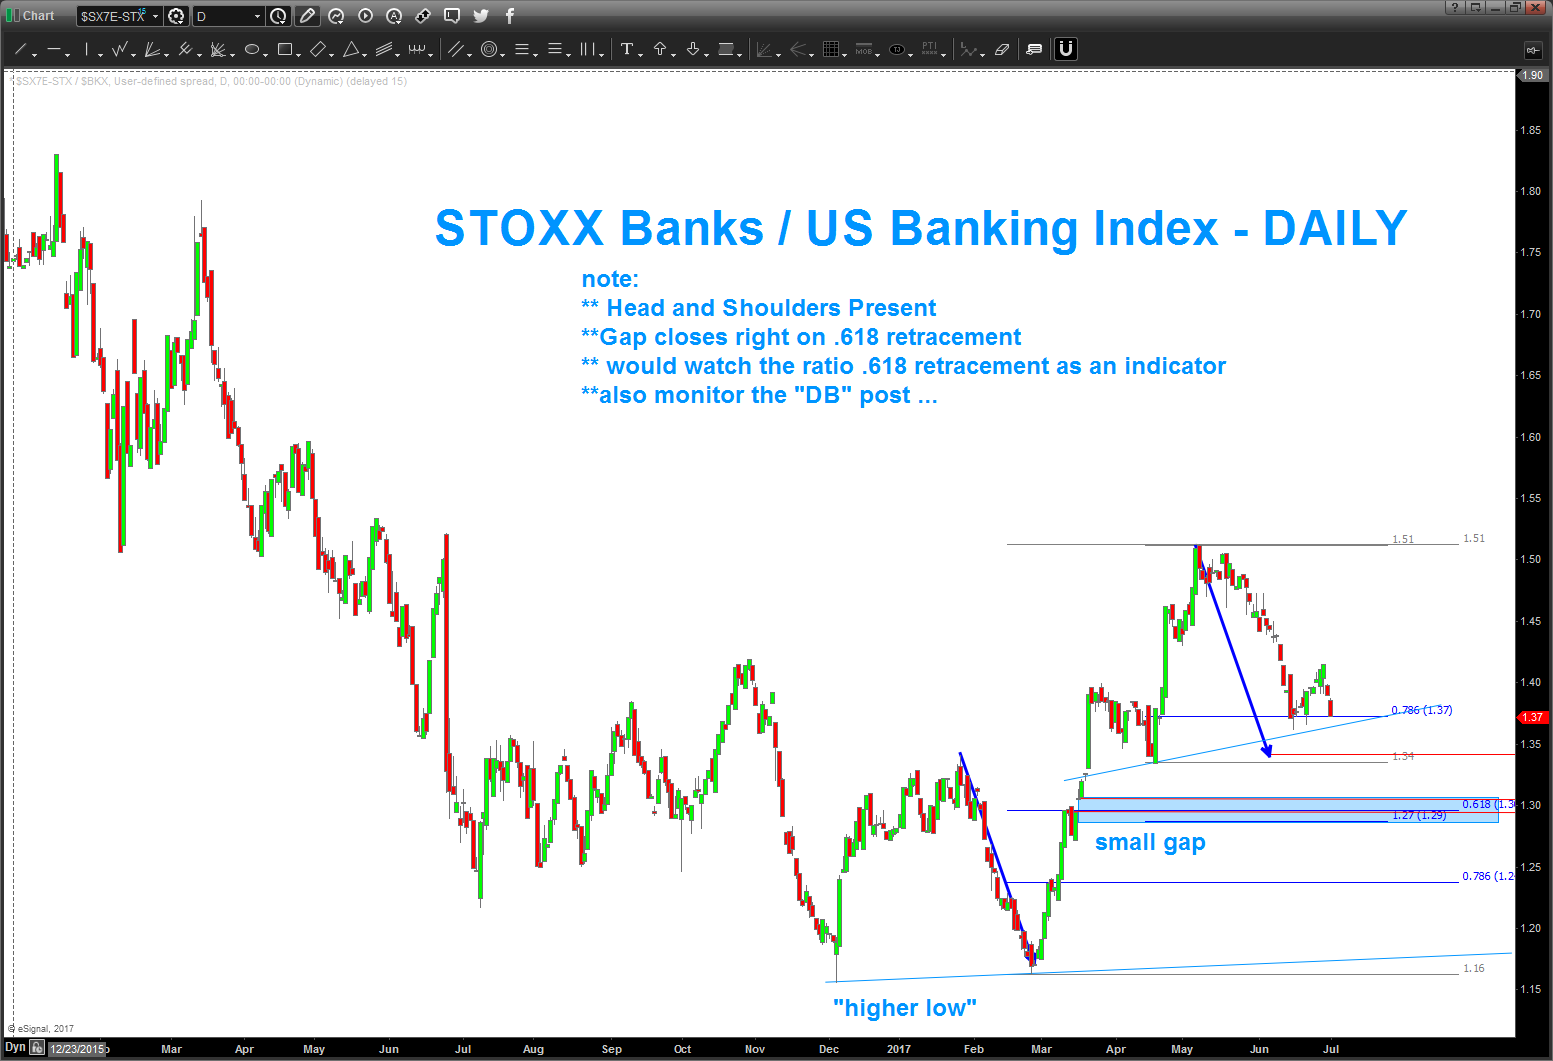
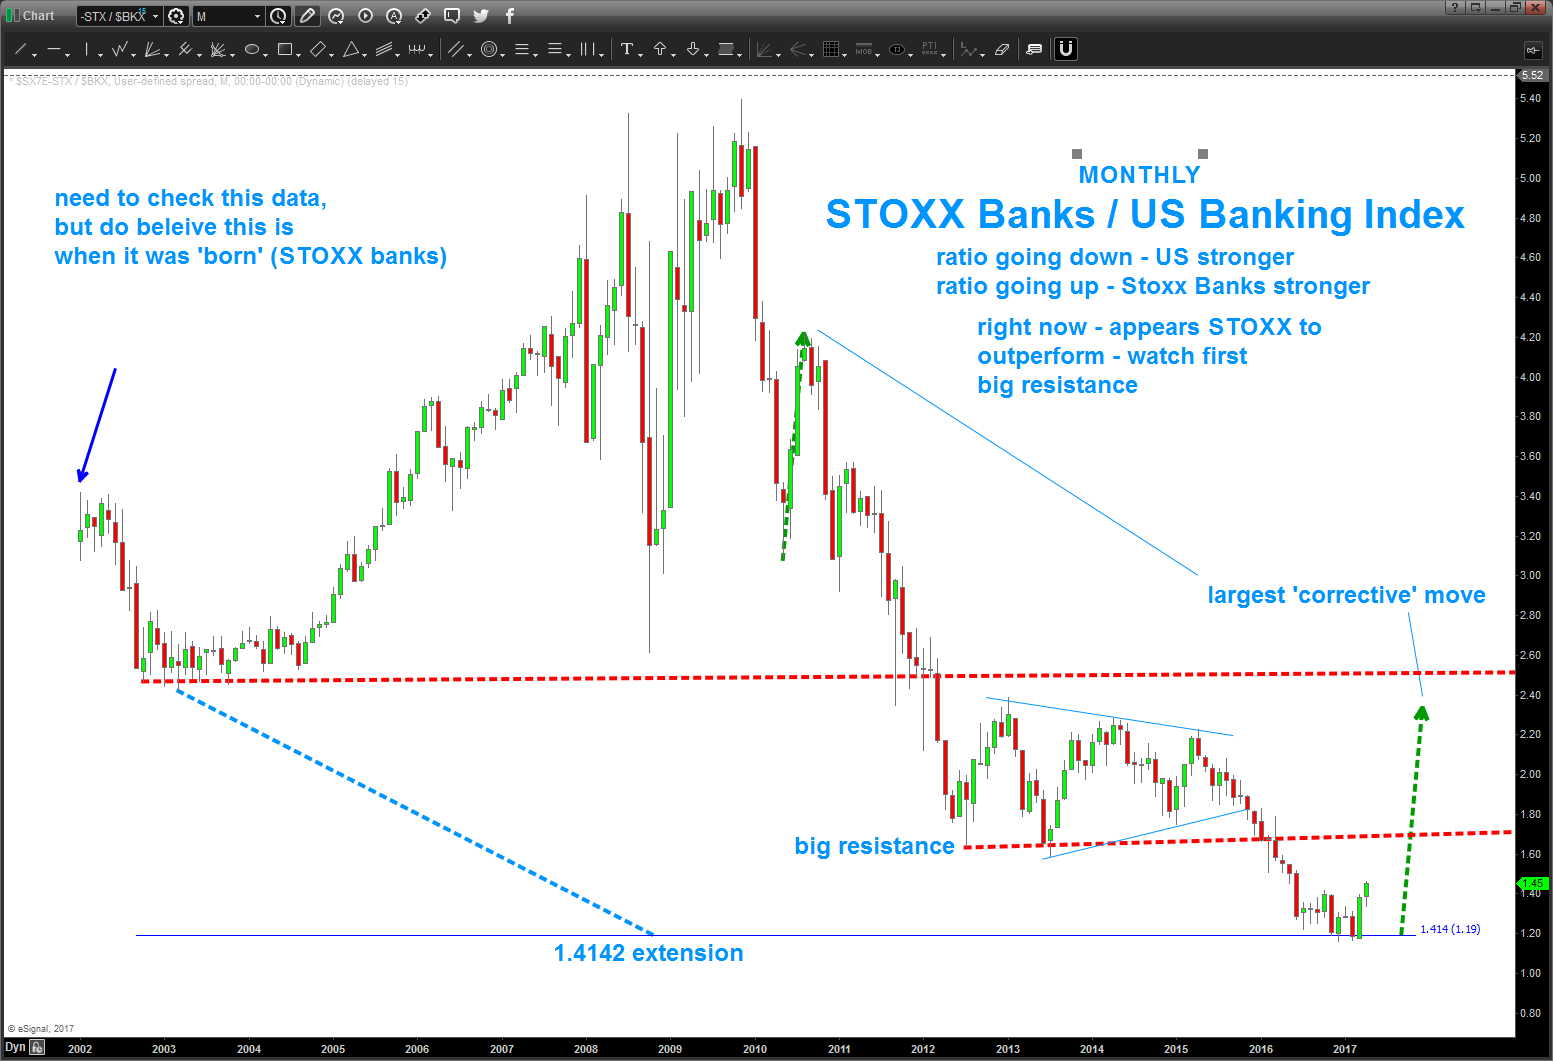
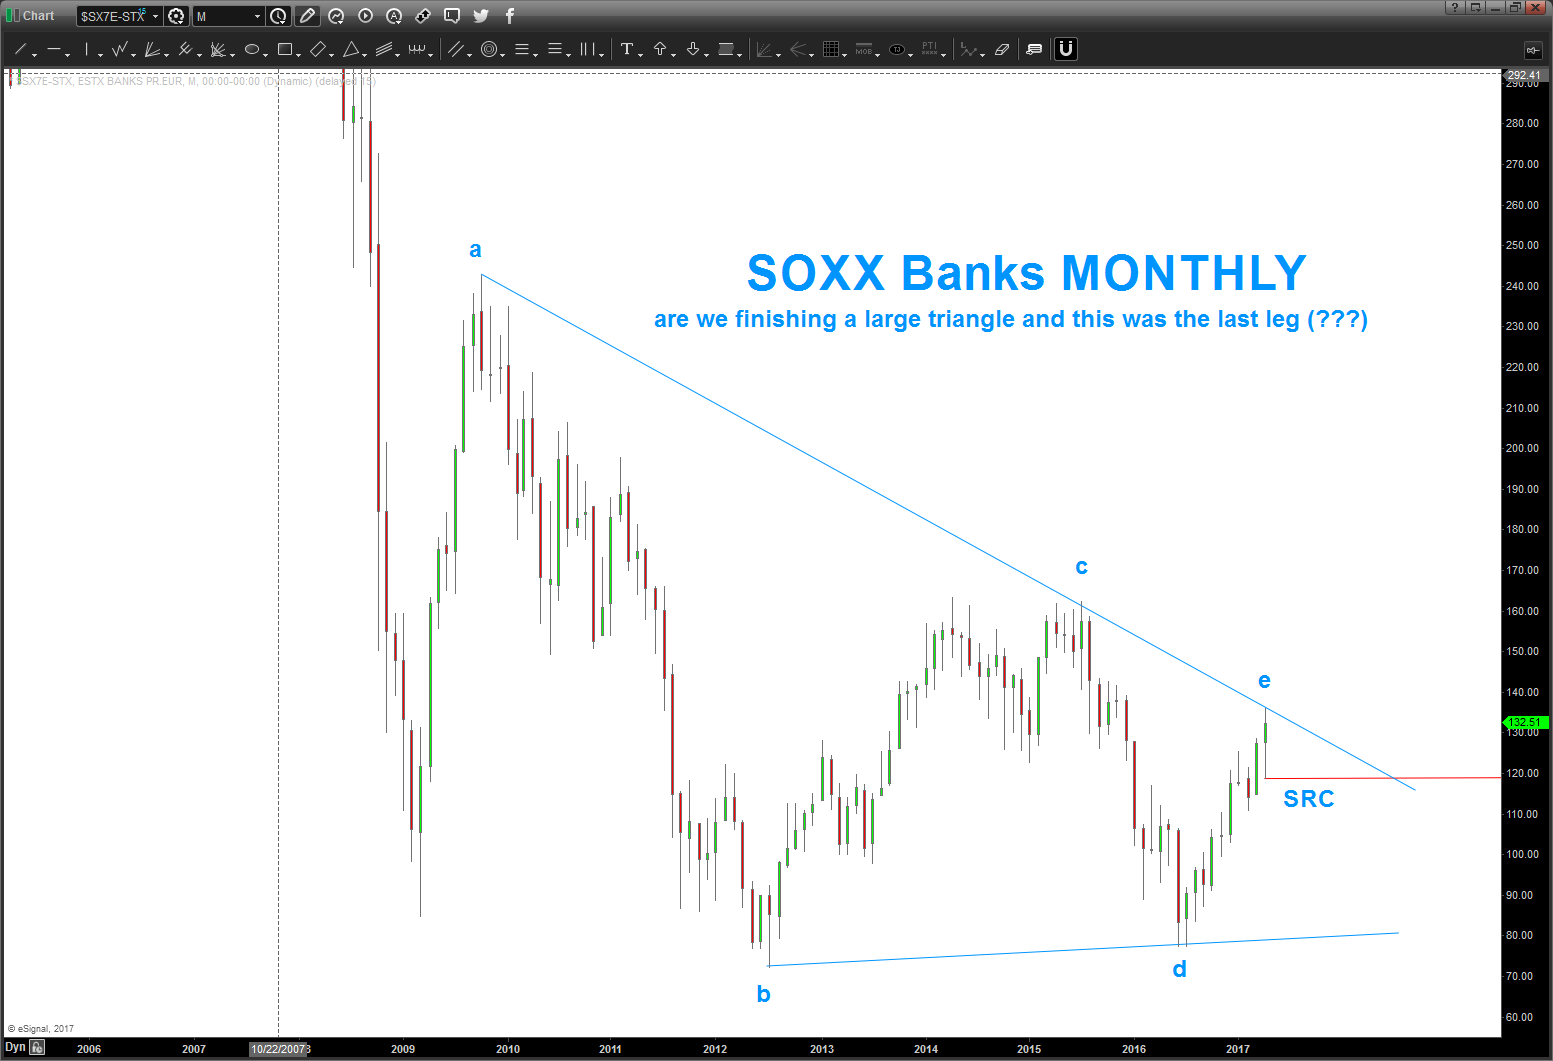
07/01/2017 – STOXX banks rallied into the target zone to keep the triangle (monthly) thesis alive. key levels indicated below on STOXX Banks and also the STOXX / US Banking Index. Hawk these levels for strength or weakness.
Be well my friends … Bart
—————————————————————————————————————————————————–
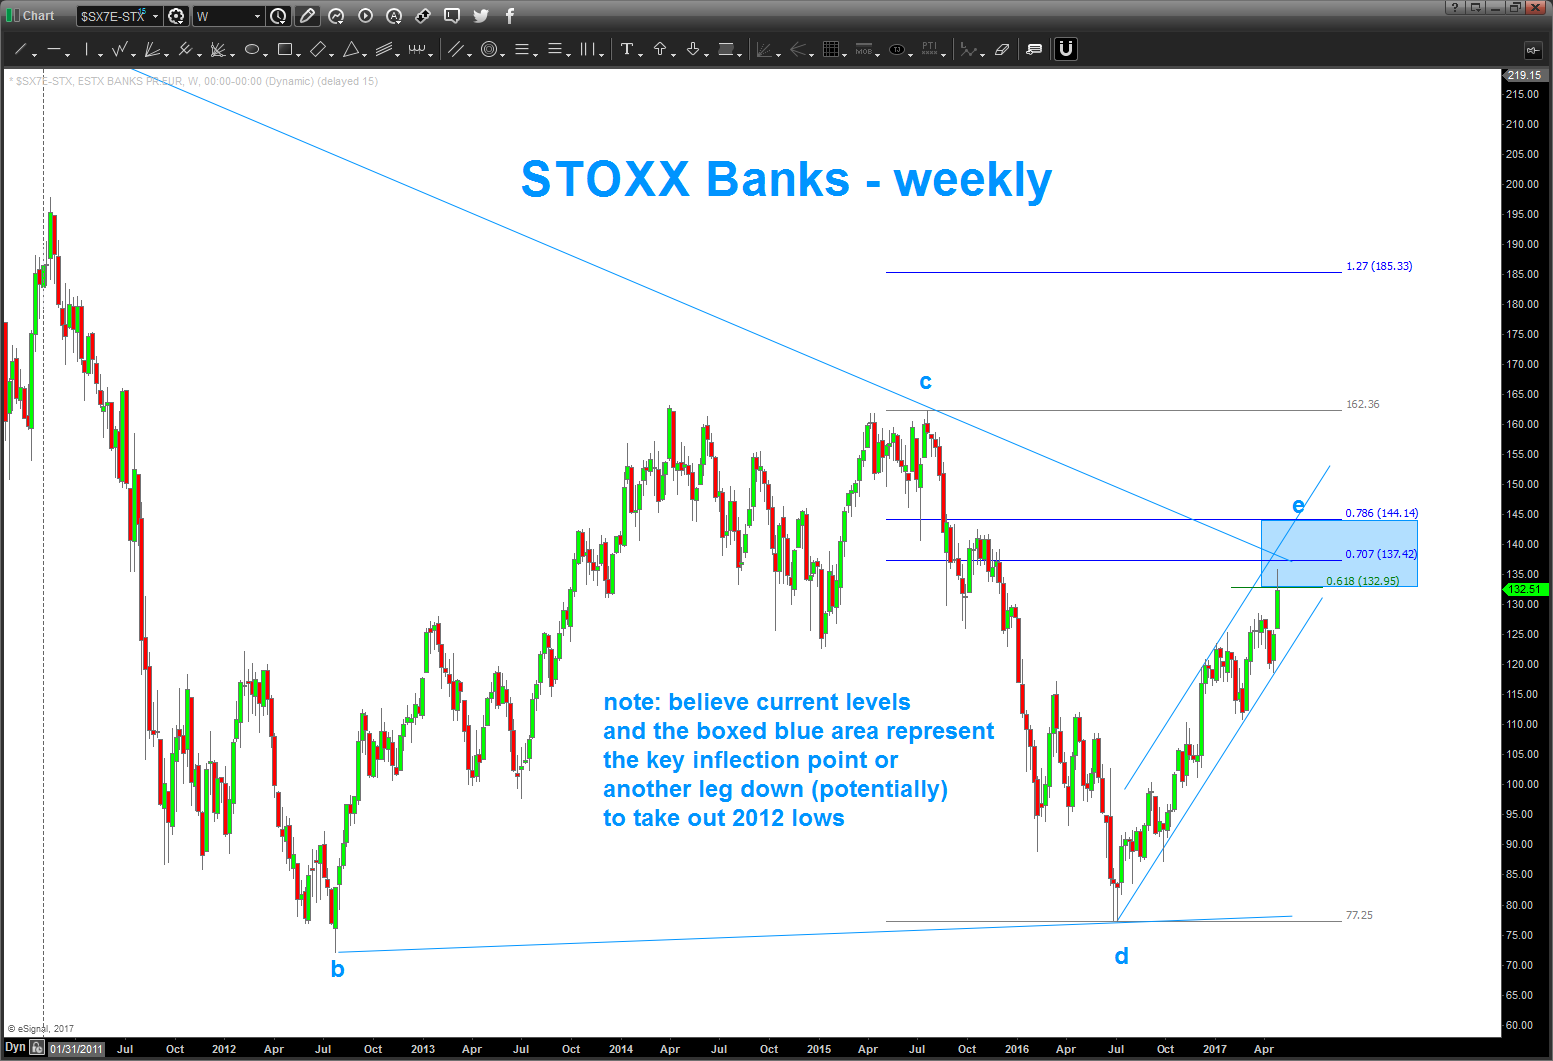
the KEY here is are we finishing a triangle and this latest leg up represents the final sequence (e) of a,b,c,d,e … the relationship that is giving me a ‘hint’ that this might be the case is the fact that the e is representing .618 of b-c (a common relationship in triangles) on the charts, that is the green line w/ .618 to the right of the green line.
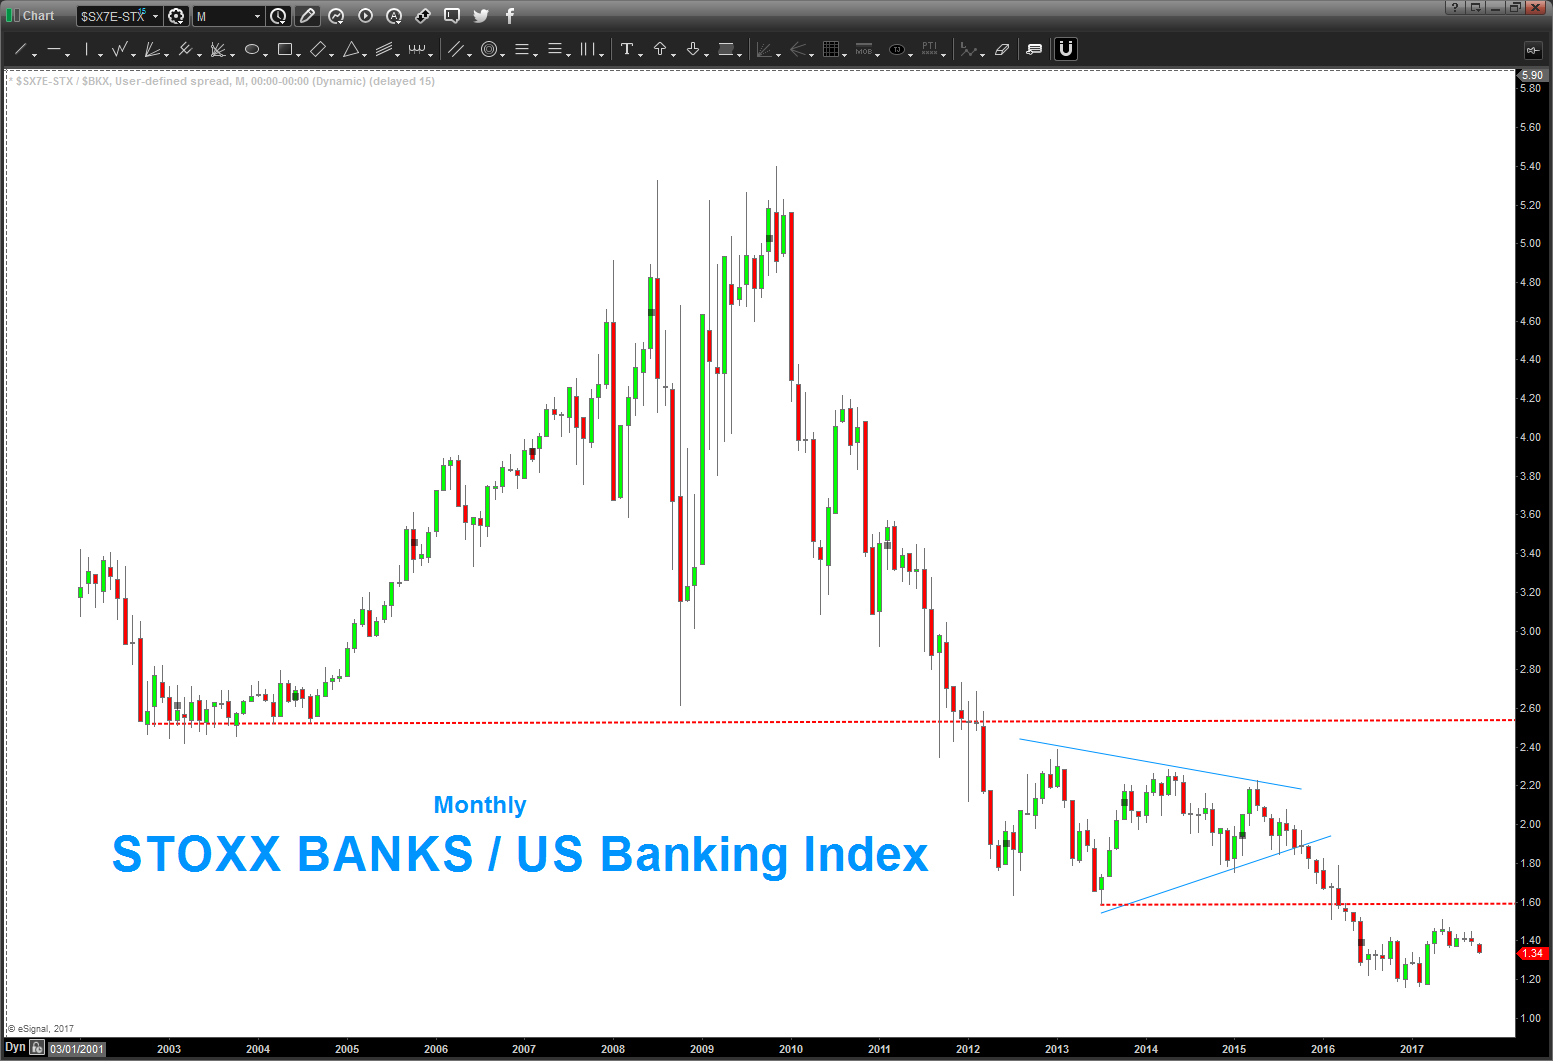
also the ratio of SOXX banks / US Banks is presented. just because a sector might outperform on a relative strength basis does not mean it will go UP because it’s outperforming. in this case, it could mean it goes down slower … or, this move up is complete and US banks to outperform. however, because of the long term downtrend in STRENGTH of STOXX vs US Banks would monitor this closely. A continued increase and movement in STOXX vs US Banks ALONG with a consolidation or a breakout of the blue shaded box shown on STOXX Banks charts could mean important and notable strength has developed. Monitor the ratio for clues ..
Hope this helps and thanks for asking and visiting the site .. let me know if you have any questions.
Bart
STOXX Banks for a friend overseas …UPDATE 10/21/2017
Posted on October 21, 2017 Leave a Comment
10/21/2017 – continues to consolidate. at present long term/large triangle thesis is still in play. key level remains 114.18.
*** important development. on the daily chart below a very ‘nice’ BUY pattern is appearing a little lower. IF this PATTERN FAILS THEN perhaps this will cause further weakness in STOXX and start to resolve the consolidation that has been going on for 6 months …
————————————————————————————————————————————————————–
08/05/2017 – recent strength appears to want to take out the 139.67 high. However, the key levels still remain as shown below. A DAILY CLOSE above 144.28 will make me rethink scenario below. Hope this helps …
Bart
07/01/2017 – STOXX banks rallied into the target zone to keep the triangle (monthly) thesis alive. key levels indicated below on STOXX Banks and also the STOXX / US Banking Index. Hawk these levels for strength or weakness.
Be well my friends … Bart
—————————————————————————————————————————————————–
the KEY here is are we finishing a triangle and this latest leg up represents the final sequence (e) of a,b,c,d,e … the relationship that is giving me a ‘hint’ that this might be the case is the fact that the e is representing .618 of b-c (a common relationship in triangles) on the charts, that is the green line w/ .618 to the right of the green line.
also the ratio of SOXX banks / US Banks is presented. just because a sector might outperform on a relative strength basis does not mean it will go UP because it’s outperforming. in this case, it could mean it goes down slower … or, this move up is complete and US banks to outperform. however, because of the long term downtrend in STRENGTH of STOXX vs US Banks would monitor this closely. A continued increase and movement in STOXX vs US Banks ALONG with a consolidation or a breakout of the blue shaded box shown on STOXX Banks charts could mean important and notable strength has developed. Monitor the ratio for clues ..
Hope this helps and thanks for asking and visiting the site .. let me know if you have any questions.
Bart
JPM update
Posted on October 21, 2017 Leave a Comment
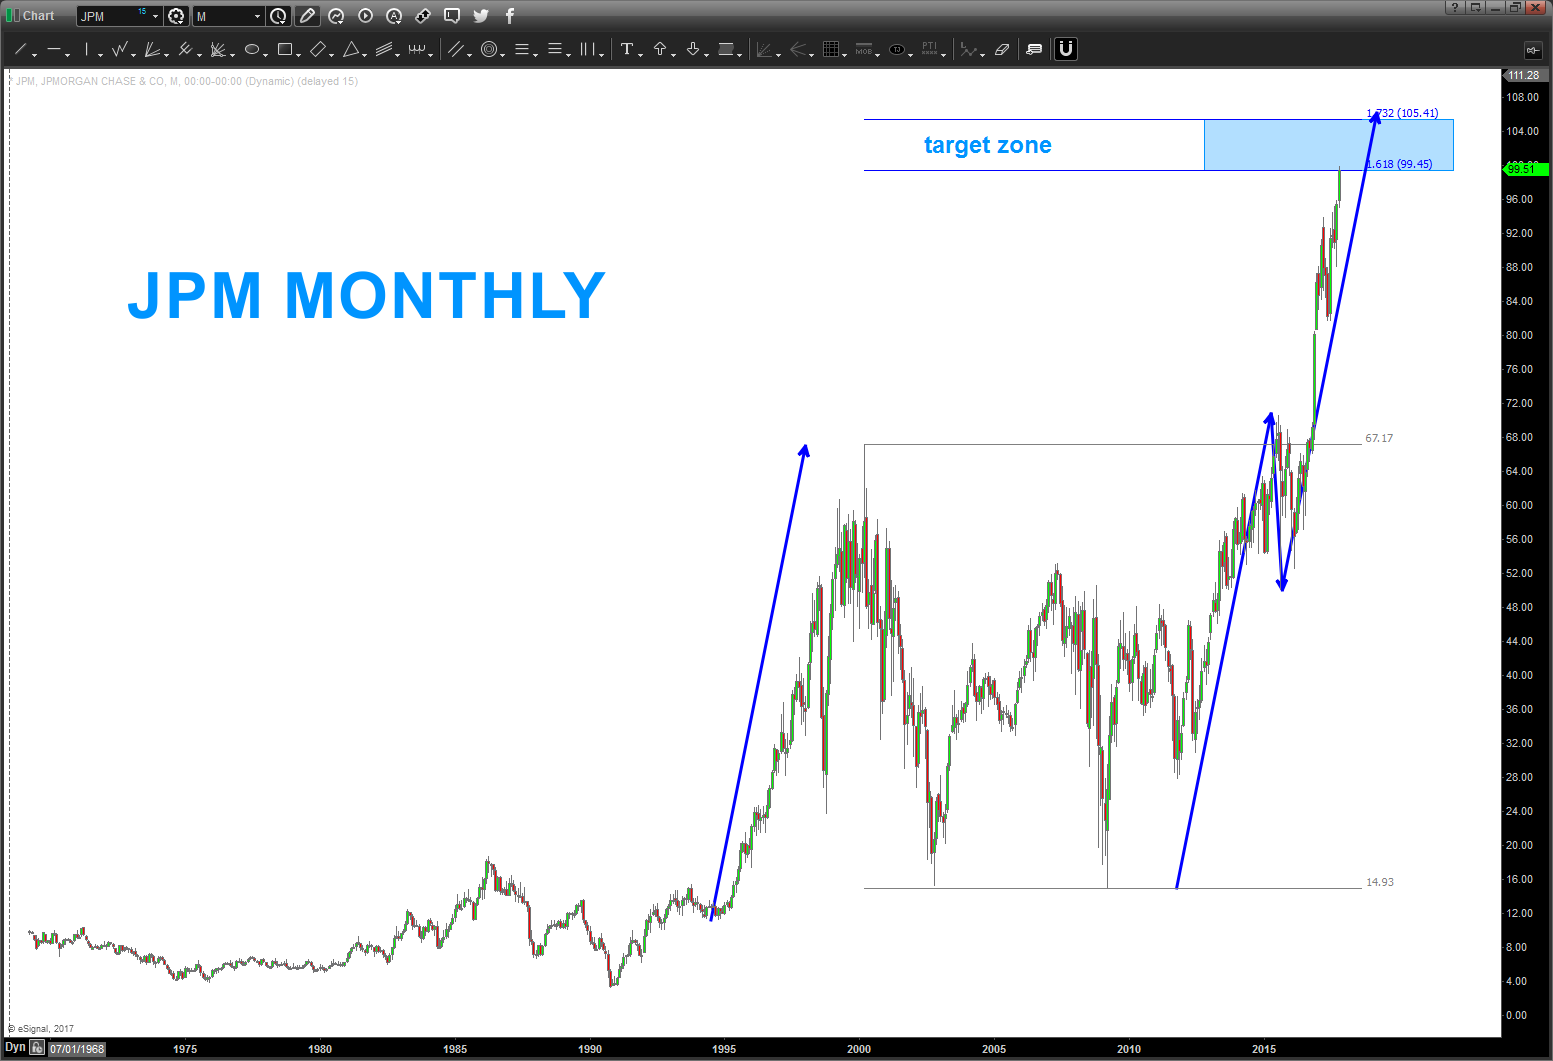
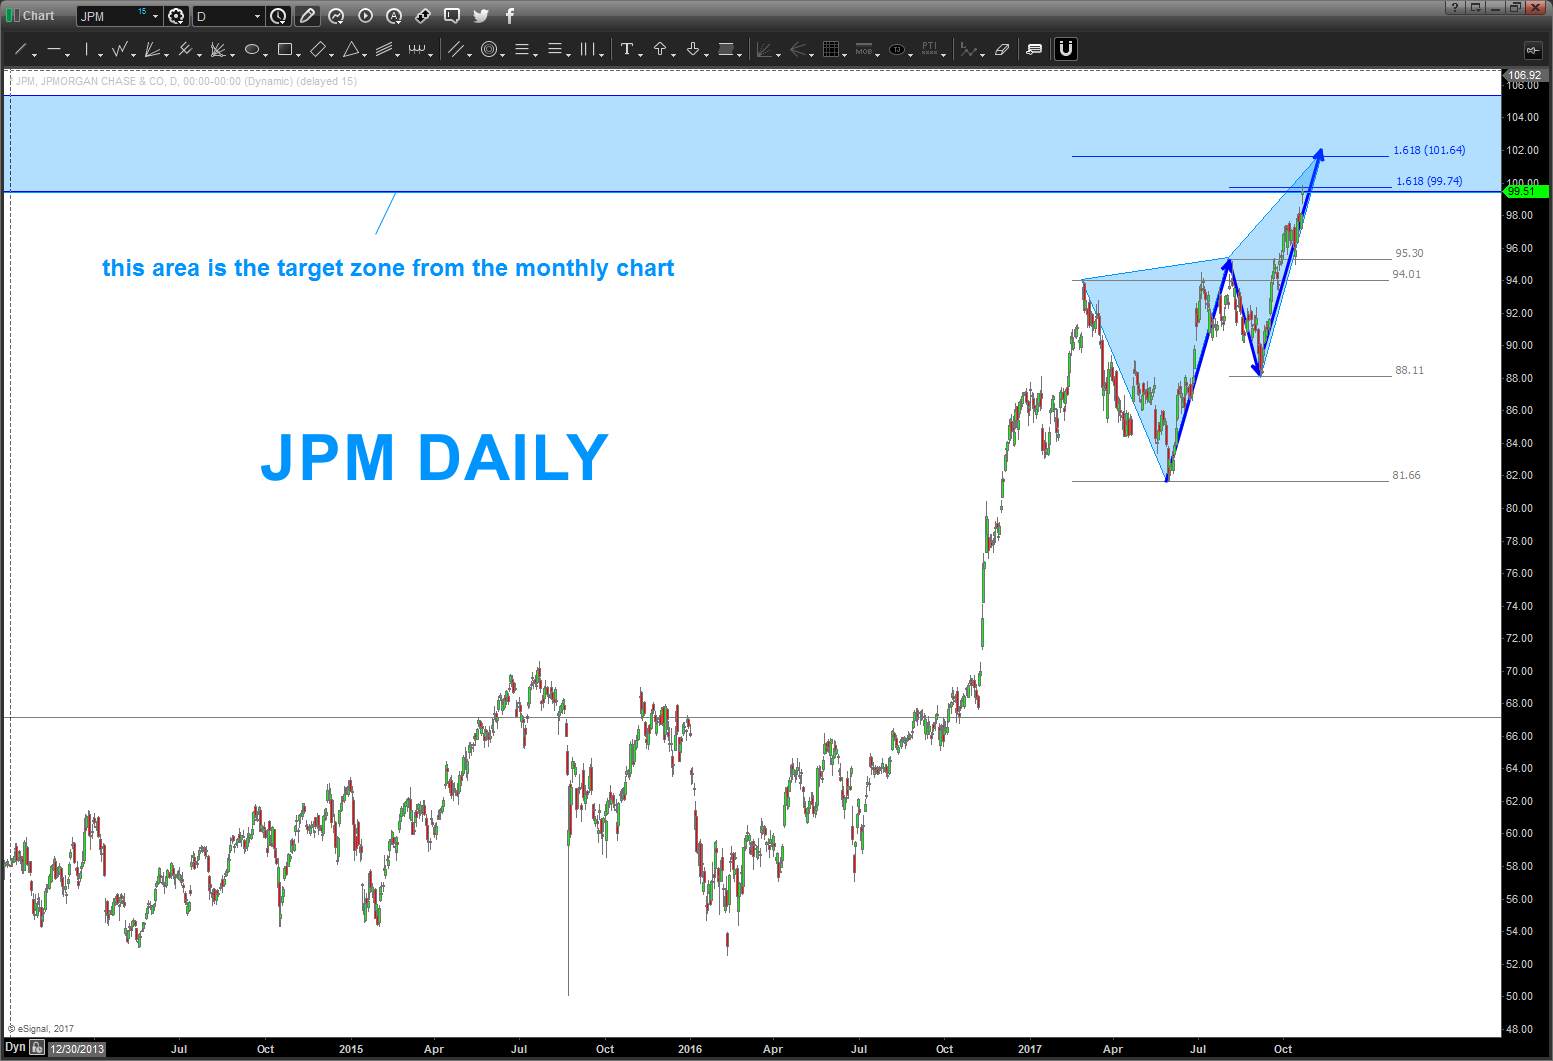
10/21/2017 – around a year ago the pattern below was defeated by JPM. as you can see from November 2016 it was a pretty big candle coming into this level.
we are now at another crucial level for JPM. 100-105 ‘should’ cause some stiff resistance. w/ the continued bullish movement of the overall market would definitely WAIT for a monthly/weekly SRC before selling or taking profits.
Bart
——————————————————————————-
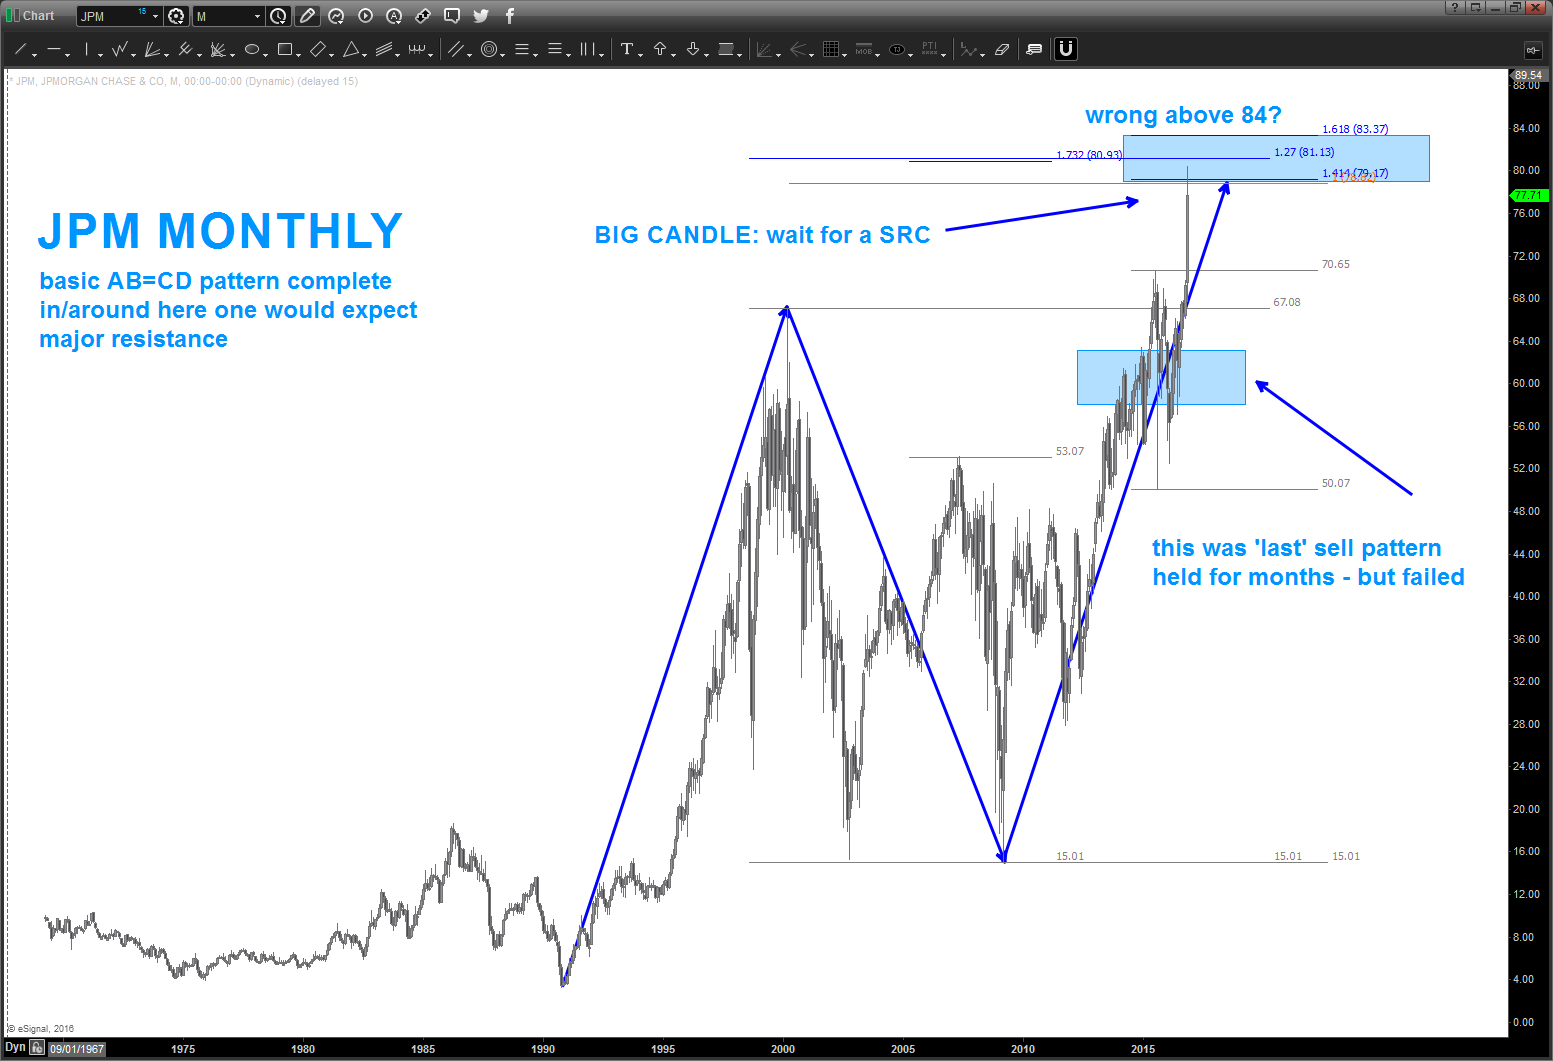
11/19/2016 – update to JPM.
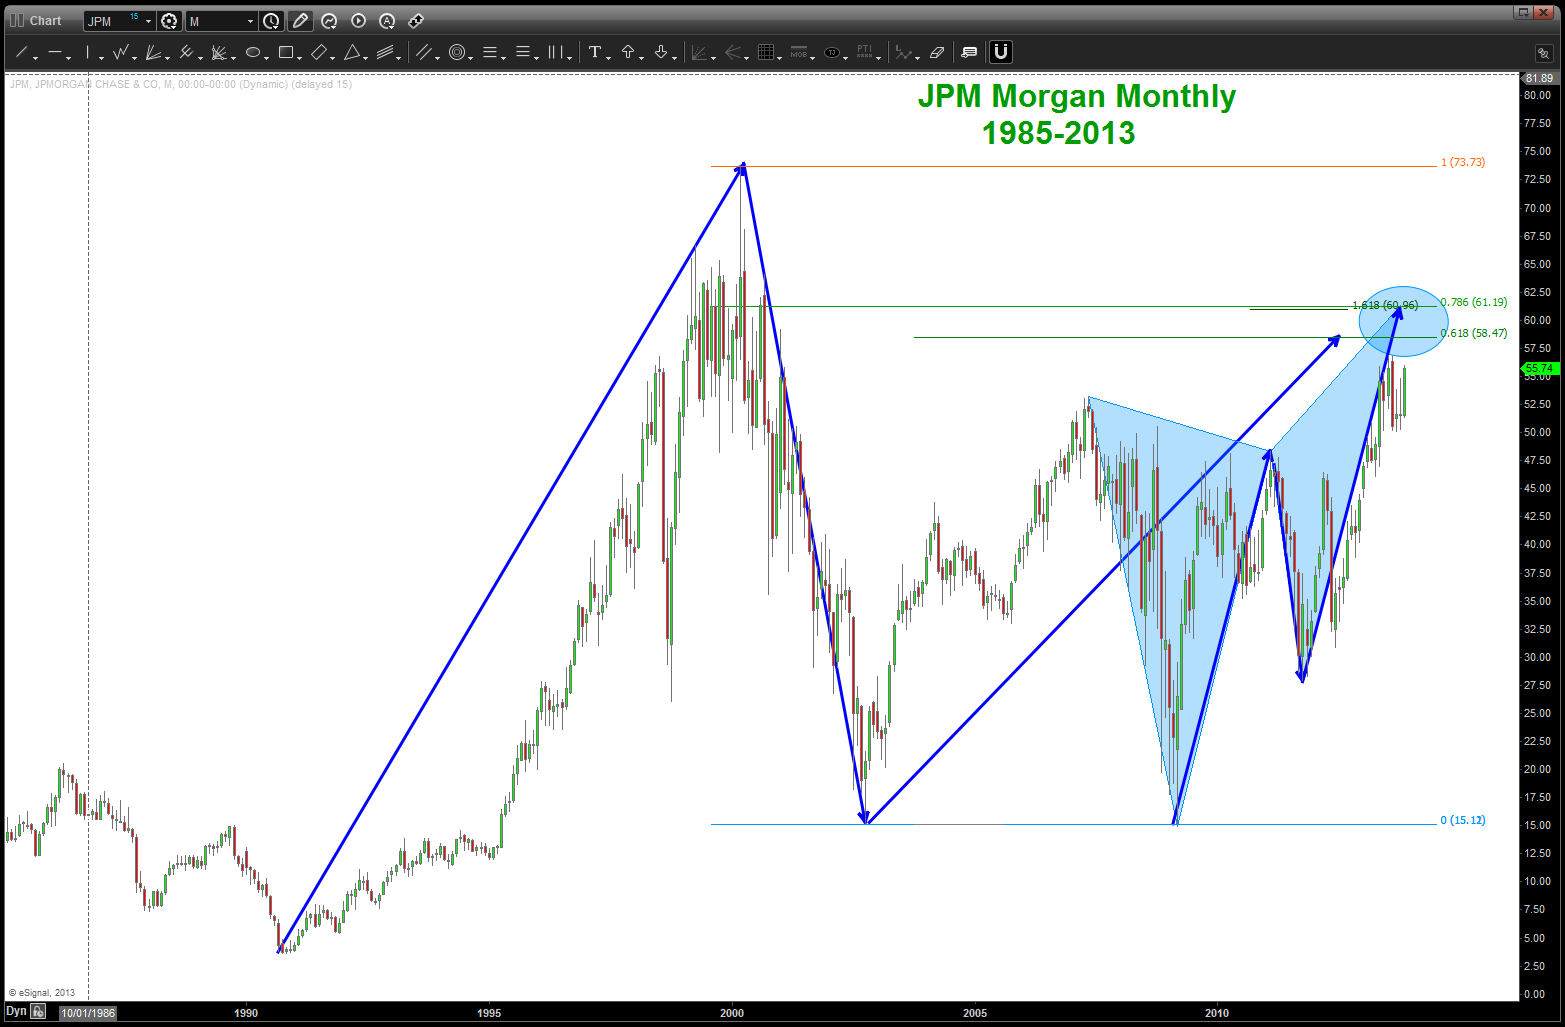
the pattern in/around the 60’s caused quite the chop fest but was, ultimately, defeated.
now, since the election, JPM has vaulted out of the gate into the ‘big AB=CD’ and extension area … because of such a big candle coming into this level, it begs of caution if trying to short – perhaps look for a weekly or daily signal reversal?
wrong above 84 …
B
JPM sell pattern
Continuing to Monitor the XLP / NYA important ratio …
Posted on October 8, 2017 Leave a Comment
did this for Andy and the gang @seeitmarket: https://www.seeitmarket.com/are-consumer-staples-signaling-a-volatility-omen-17331/
here’s an update as of Friday’s close:
If I learned anything from getting my CMT it was the power of ration analysis. X/Y …. If X is stronger the chart goes up and if Y is stronger then the chart goes down. And, since we are charting securities guess what works on them –the PATTERNS. So the theory goes IF the insititutions are risk off the chart goes down and volatility is suppressed. If the institutions are risk adverse then the chart goes up and volatility picks up and stocks sell off.
Thesis:
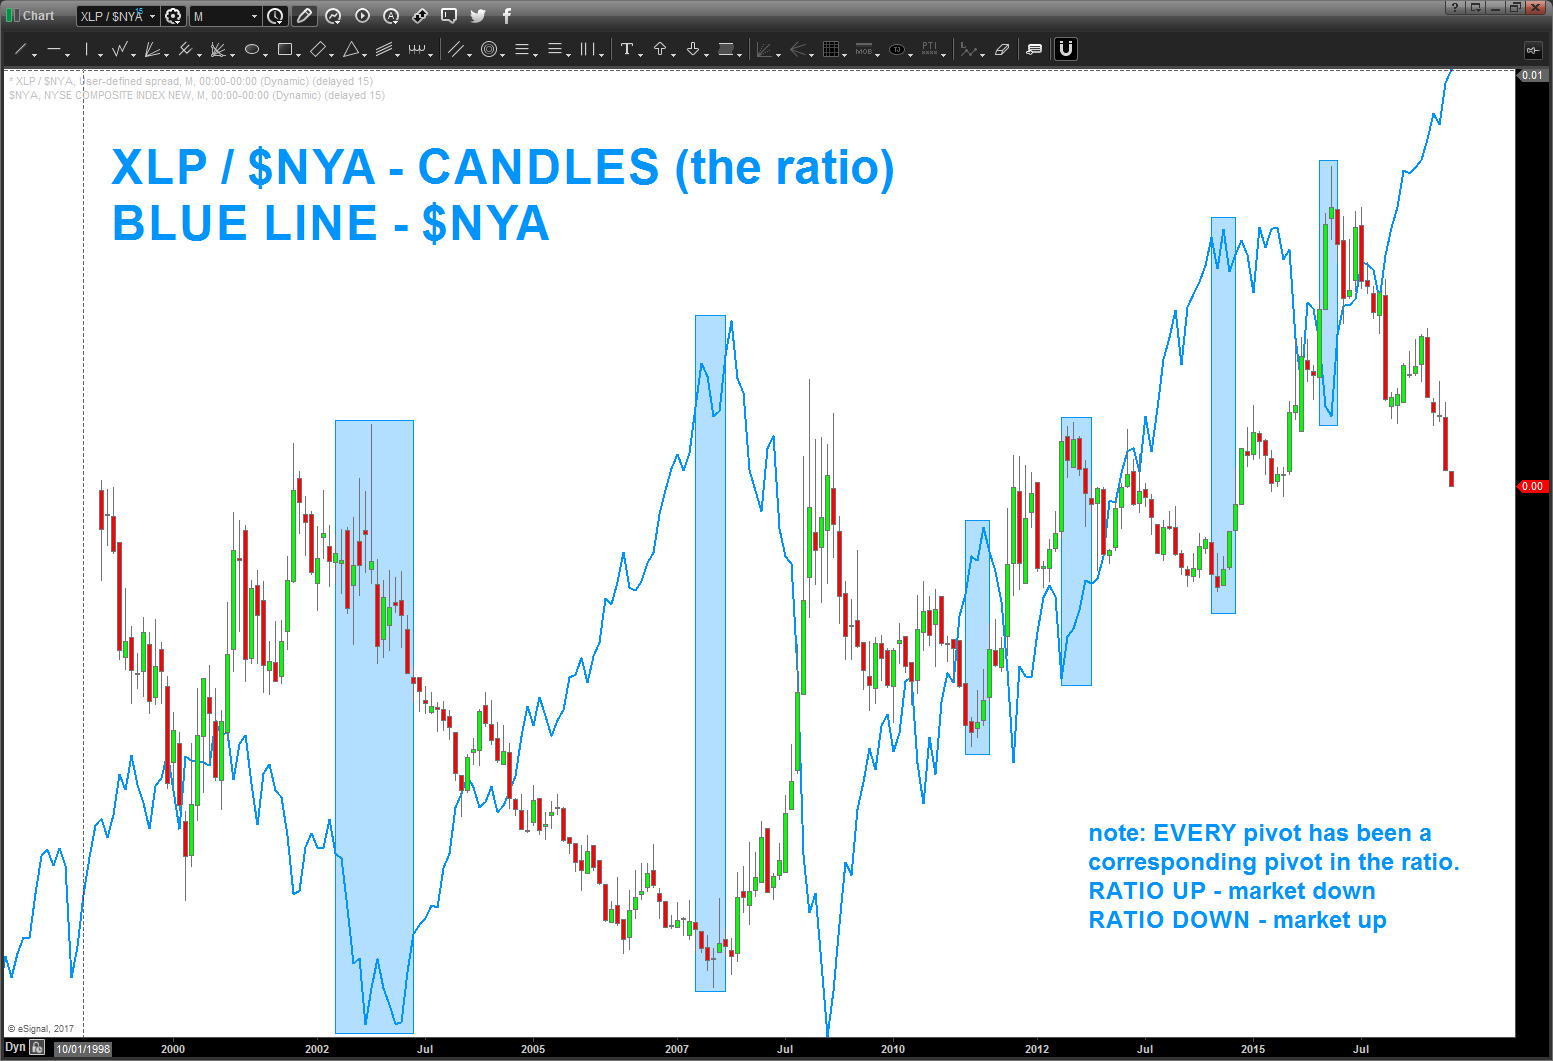
- MONTHLY of XLP / NYSE Index w/ candles being the ratio and the blue line being the NYSE Index.
- Note, at EVERY major inflection of the NYSE Index the RATIO pivoted … it either inflected to go up or down BUT every move of the NYSE Index respected this move.
- Monthly XLP / NYSE Index.
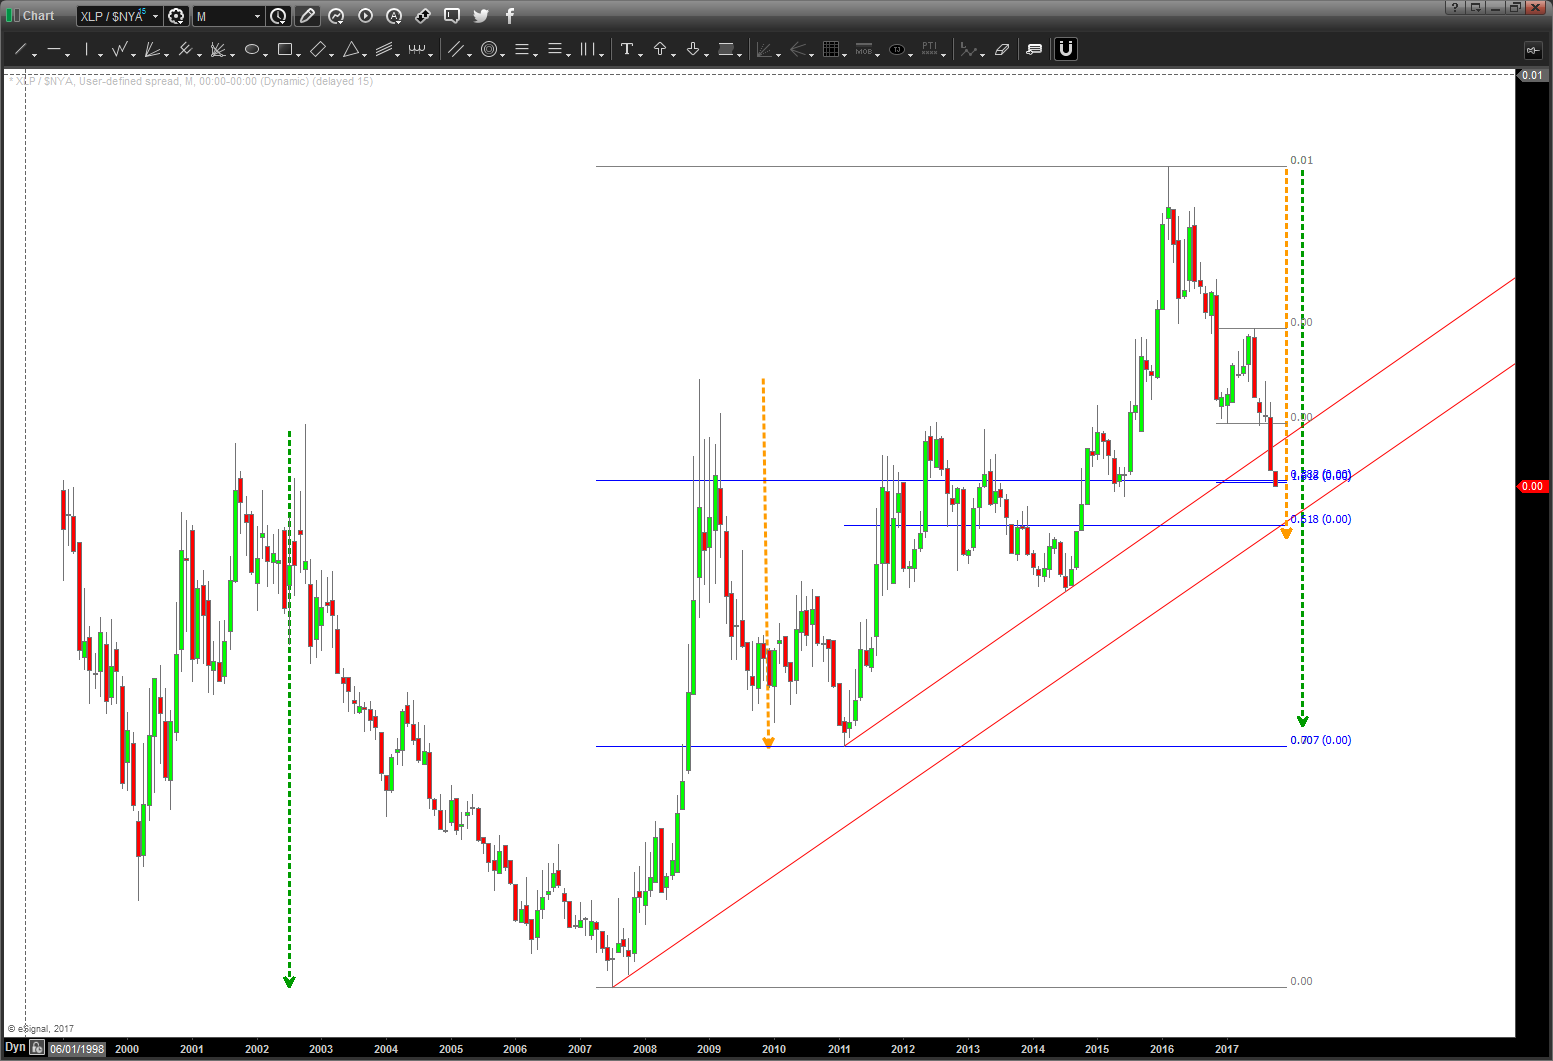
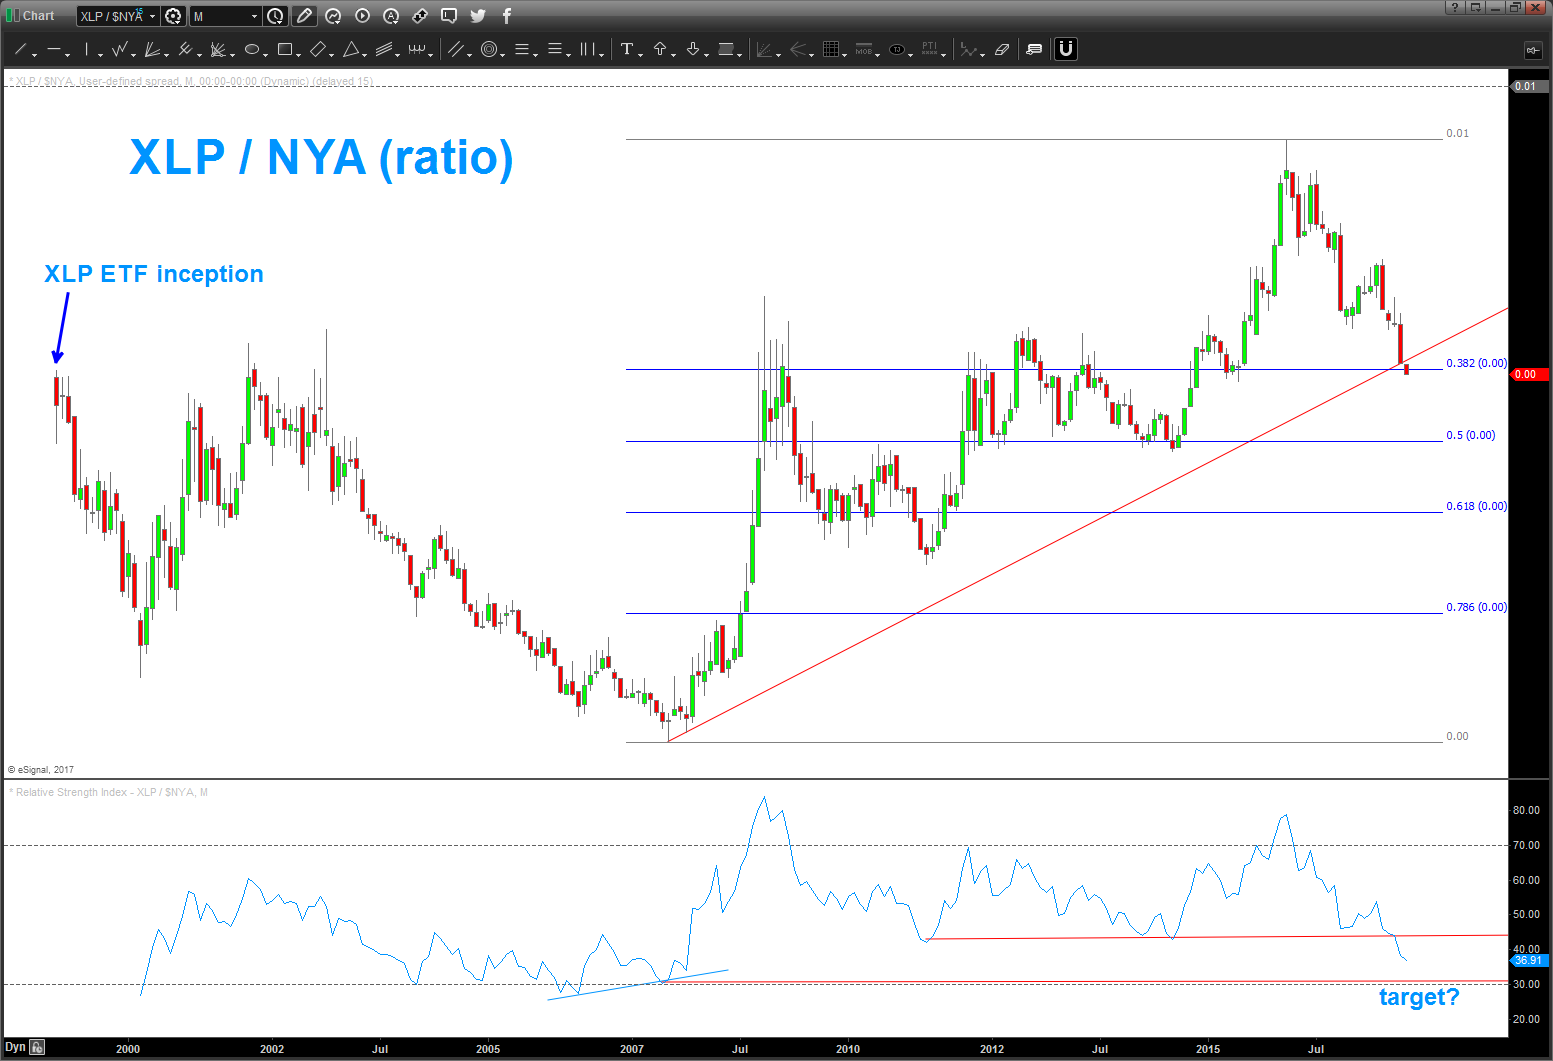
- Note, most oversold in 6 years and slammed into the .382. Weekly bearish close … did expect it to respect this area and w/ Bradley Date, Martin Armstrong Directional Change and the note from Mike – along, and most importantly, the PATTERNS I did expect this to find support and give at least a daily BUY signal. It has not done that …but all is not lost.
- Monthly XLP/ NYSE Index
- Note, if we don’t find support here then we have a measured move target a little lower and, ultimately the big green target …
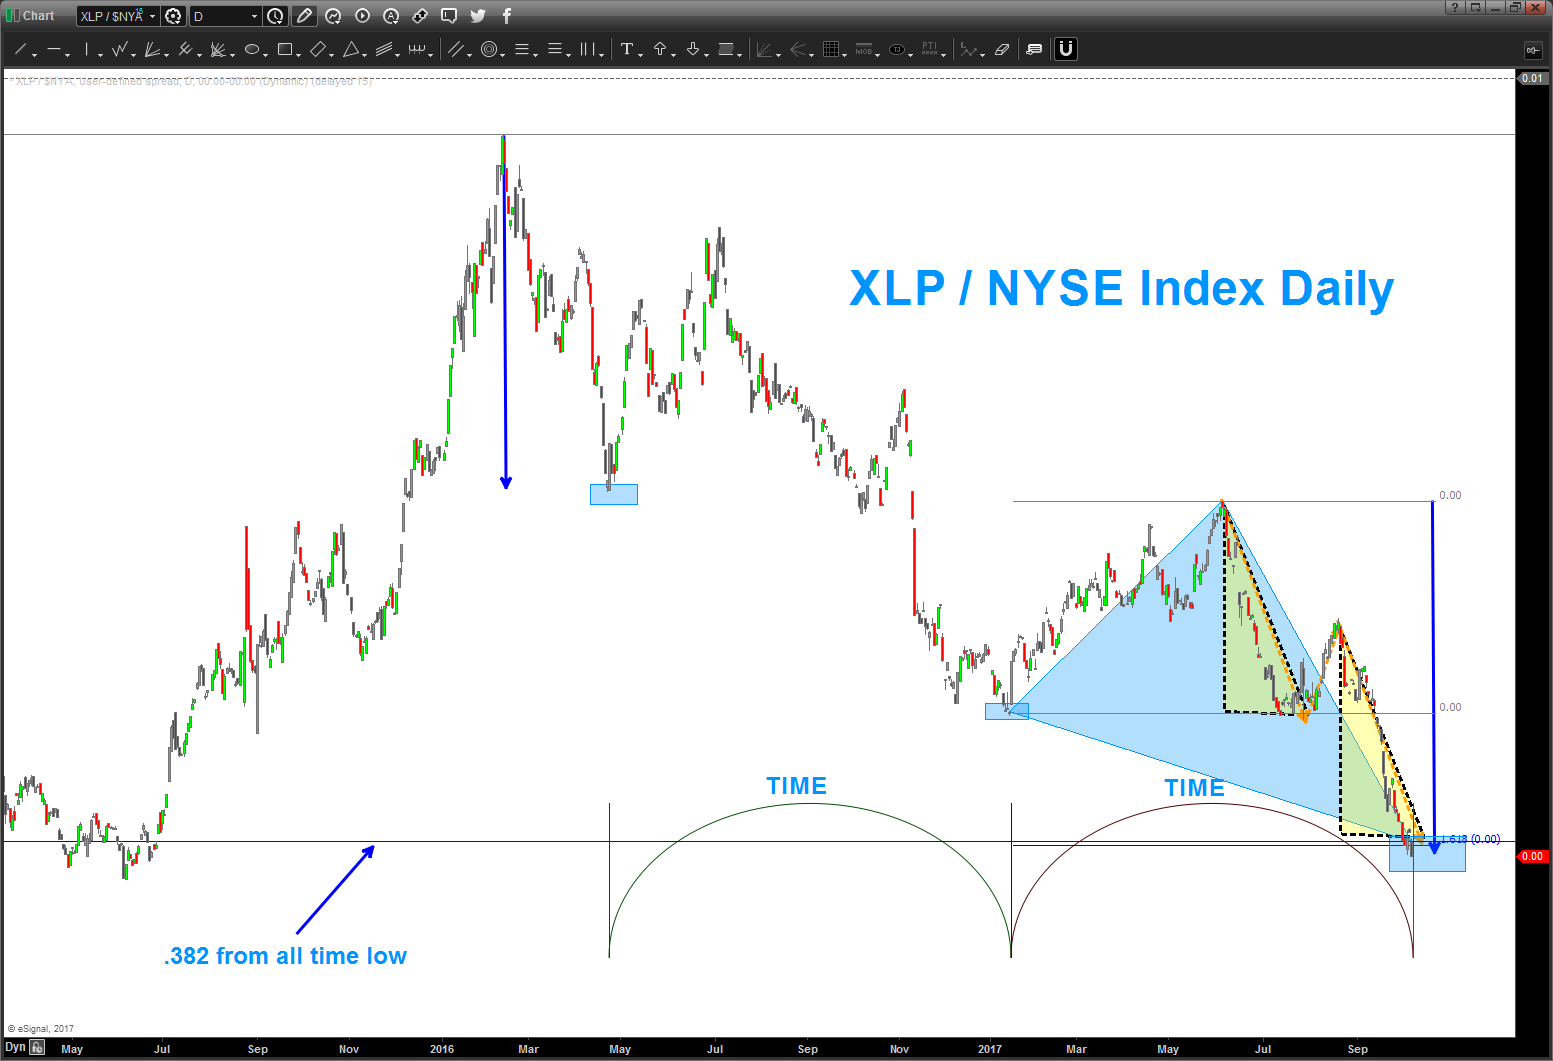
- Daily XLP/NYSE Index
- Note, the time component (somewhat of a 3 drives to a bottom but still in line w/ ‘time’ of every rally ….
- Note, the 1.618 w/ an AB=CD (nice time on AB=CD) right at our .382 from the all time low
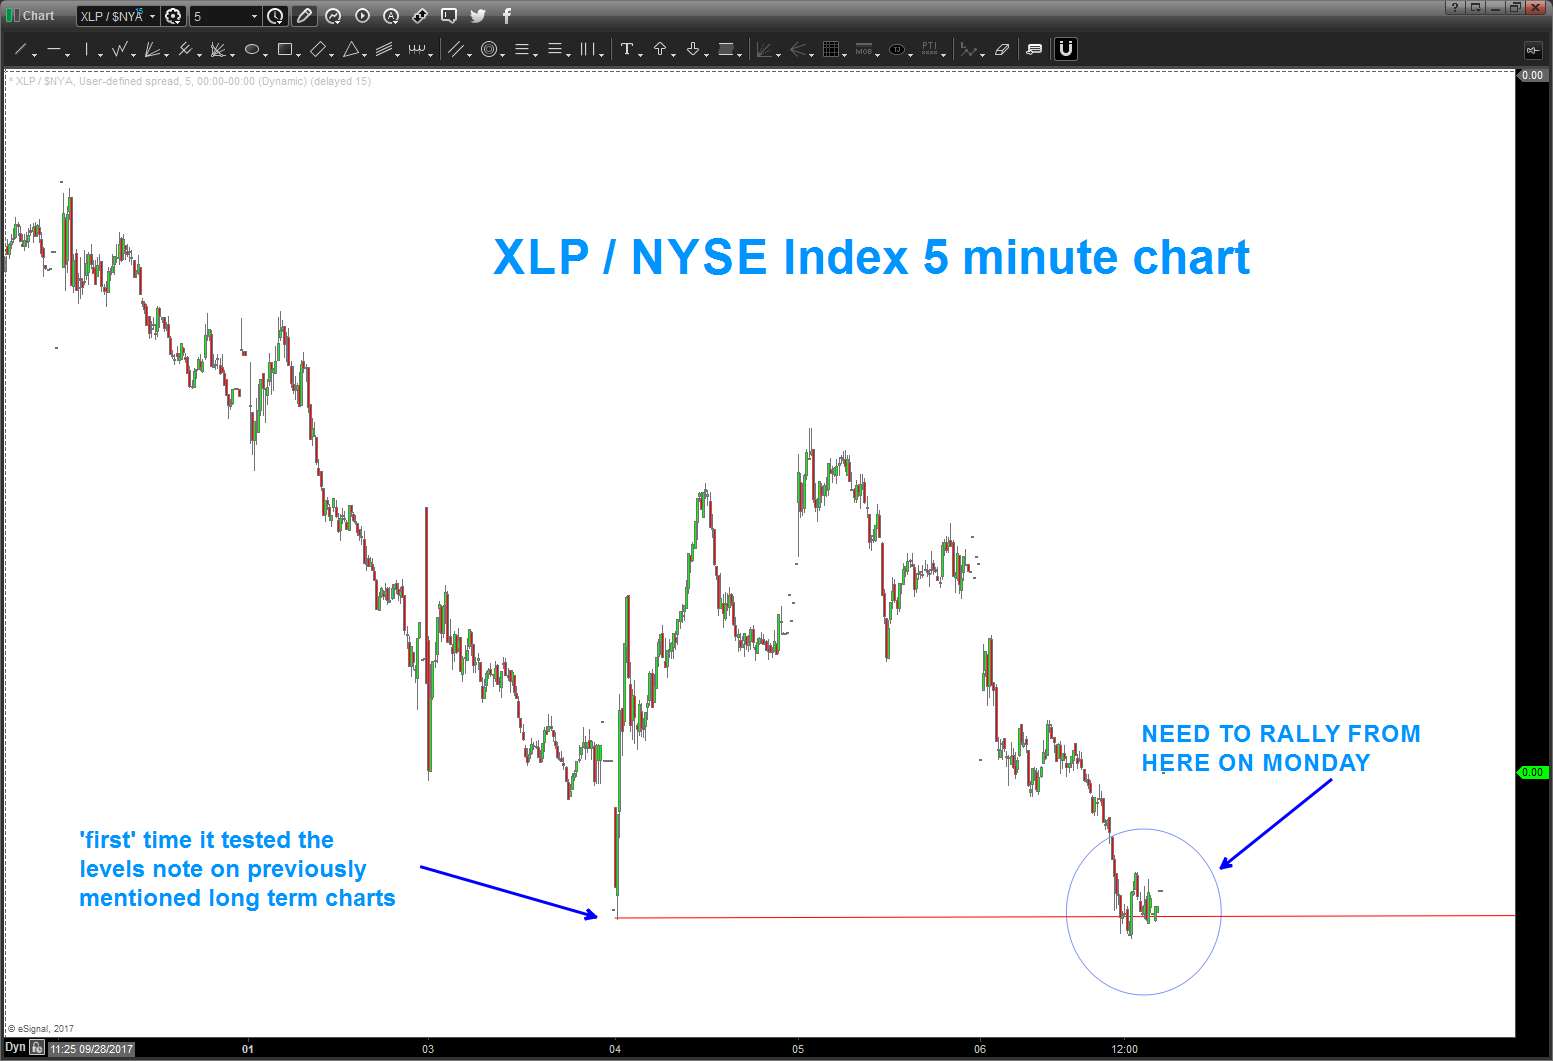
- Intraday (5 minute) XLP / NYSE
- Yes, we closed at the lows … but yes we ‘really didn’t’ break the lows so in order for this market to pivot and correct next week believe this level needs to hold and rally tomorrow morning.
Conclusion: believe this ratio remains important for the overall health of the market and if it can hold these lows then volatility should uptick and the market sells off. IF we breakdown from these levels THEN we’ll seek the next lower target and the market will continue top march up a wall of worry.
$NFLX another short swing at the bat? Perhaps? UPDATED 10/1/2017
Posted on October 1, 2017 Leave a Comment
10/1/2017 – going to start this post w/ the image that I used before to describe my love affair w/ NFLX. The patterns have been strong and it’s blow thru many levels sighted below. I BELIEVE in PATTERN RECOGNITION as an AMAZING TOOL to manage risk and put probability in your favor. NFLX has been an amazing run …and it has the bar eating me, right now. Enough said! 🙂

since my last post in April, NFLX is up roughly 20 percent. Pretty darn good … but, again, I’m just trying to remove any bias and simply take a look at what I SEE and NOT BELIEVE. You’ll see in the chart below that 1) the patterns have failed on this puppy and it’s strong strong strong! 2) we have some factors coming into it which SHOULD (the operative word) cause resistance or a stall or a fall from in/around current levels.
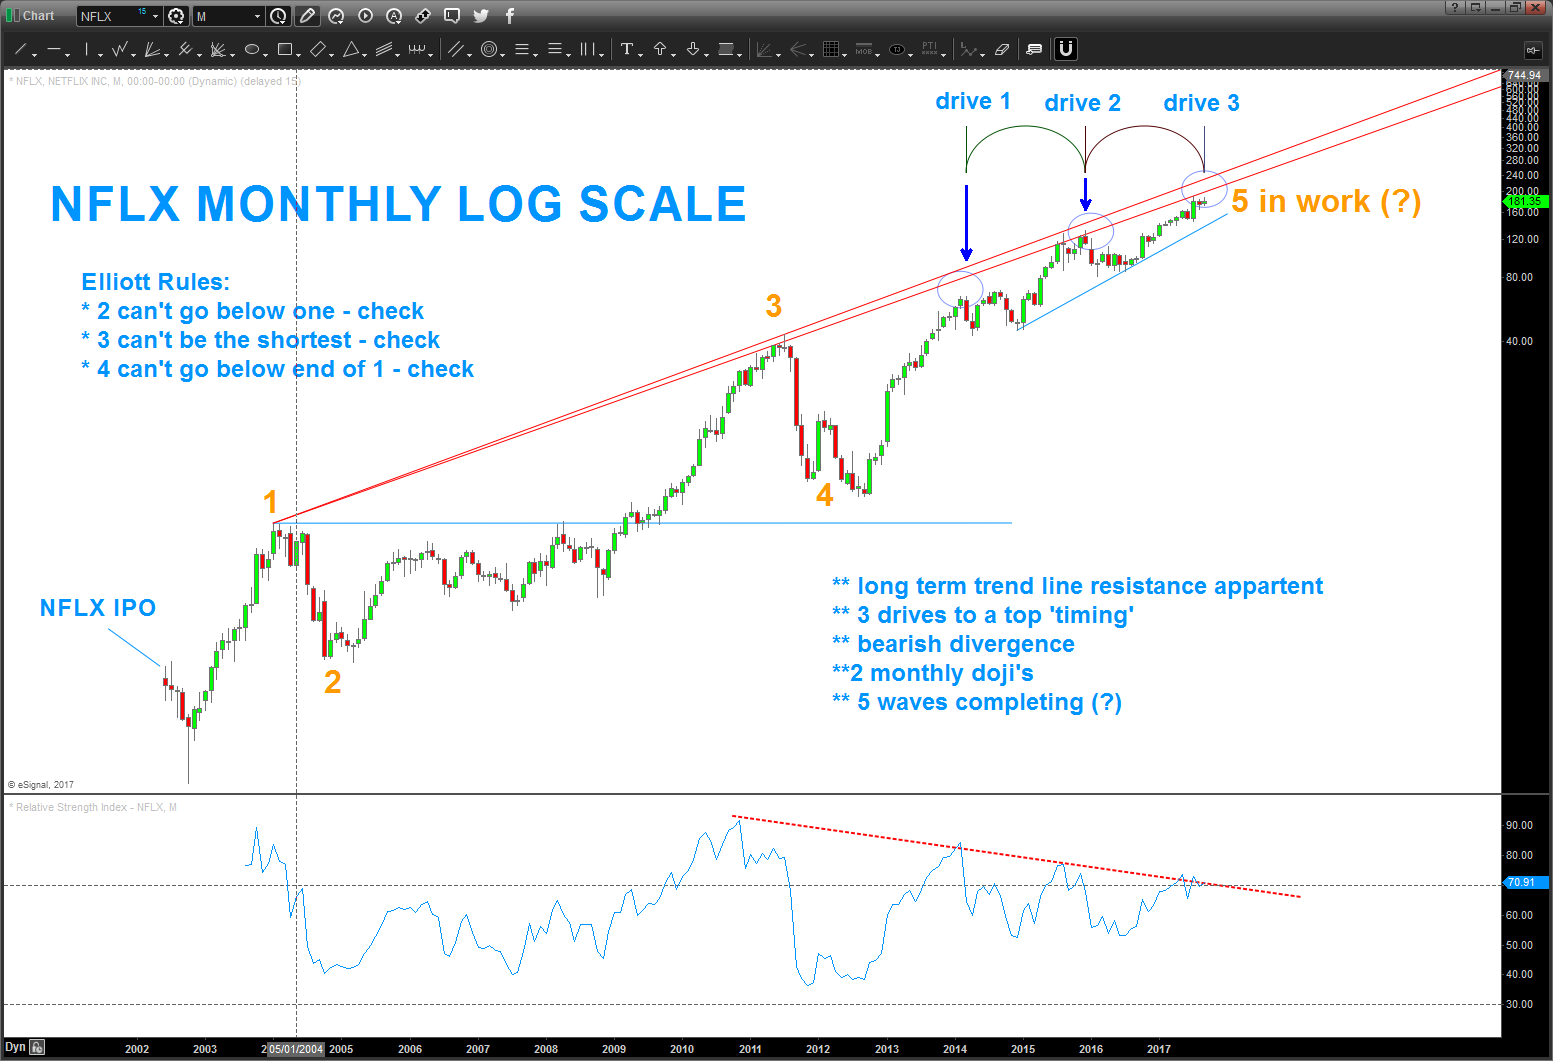
roughly 5 people from all over the world (pretty cool hugh?) have asked me to take a look at NFLX. I waited till the end of the month to see wha the monthly candle would bring …it’s a doji. In the PAST this has led to strong explosive moves UP. I still SEE 5 waves but until we get a monthly signal reversal candle (look for a close beneath 160 on a weekly level as a first sign) then the beat goes on …
now that the quarter has ended I sense/believe and, yes, want the market to reveal itself this first week of October …
thanks for reading ..
Bart
—————————————————————————————————————————————————————-
04/22/2017 – trade what you see, not what you believe. NFLX has been “topping” since January 2017. shown below are the key gap areas and the looming trend line …but folks, it hasn’t moved lower. unless we get a weekly close below 133 – step aside. the ‘math’ stopped it but it sure seems strong to me, for now …

2/14/2017
- basically hit the target zone we were identifying. now it gets interesting as you can see, on the daily, we have many gaps staring from this past summer. if we can break thru the 133-137 level then the gap 100-112 seems like a reasonable target for now.
our assumption is we have completed 5 big waves per the below so … could get interesting? Or, the stock will never go down, right? the market only moves up.
Bart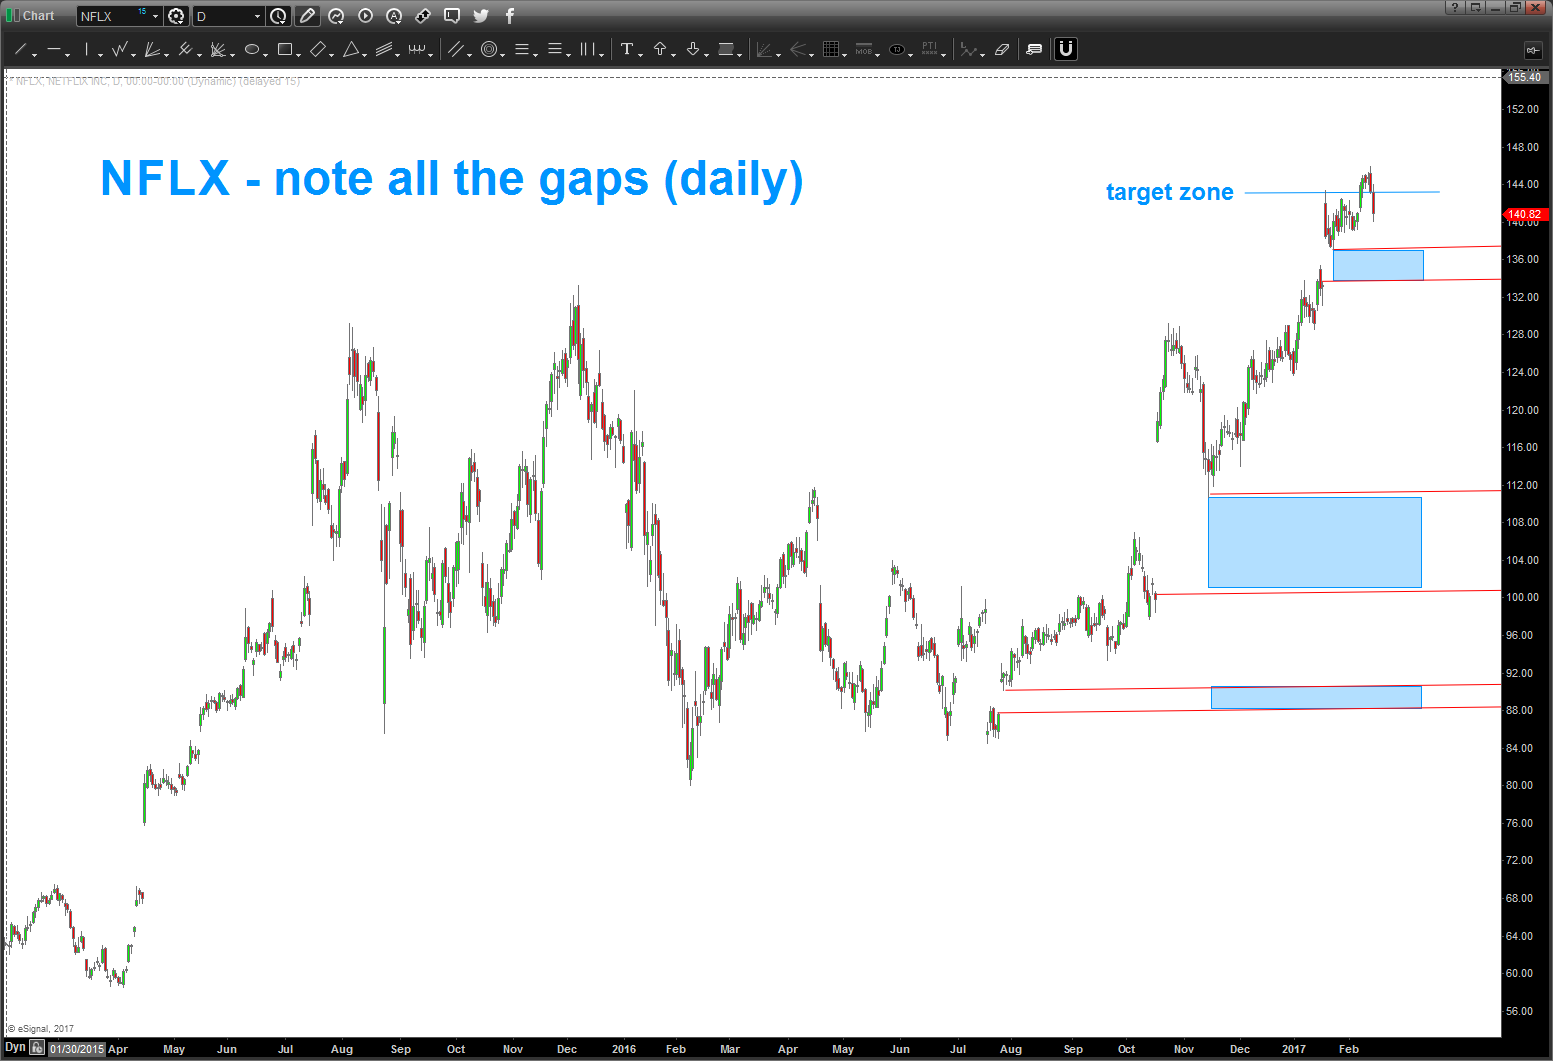
1/12/2017 – well if at first you don’t succeed, try again. doesn’t matter this its NFLX, in the world I live in, it’s just a ‘chart’ so here we are at it again …
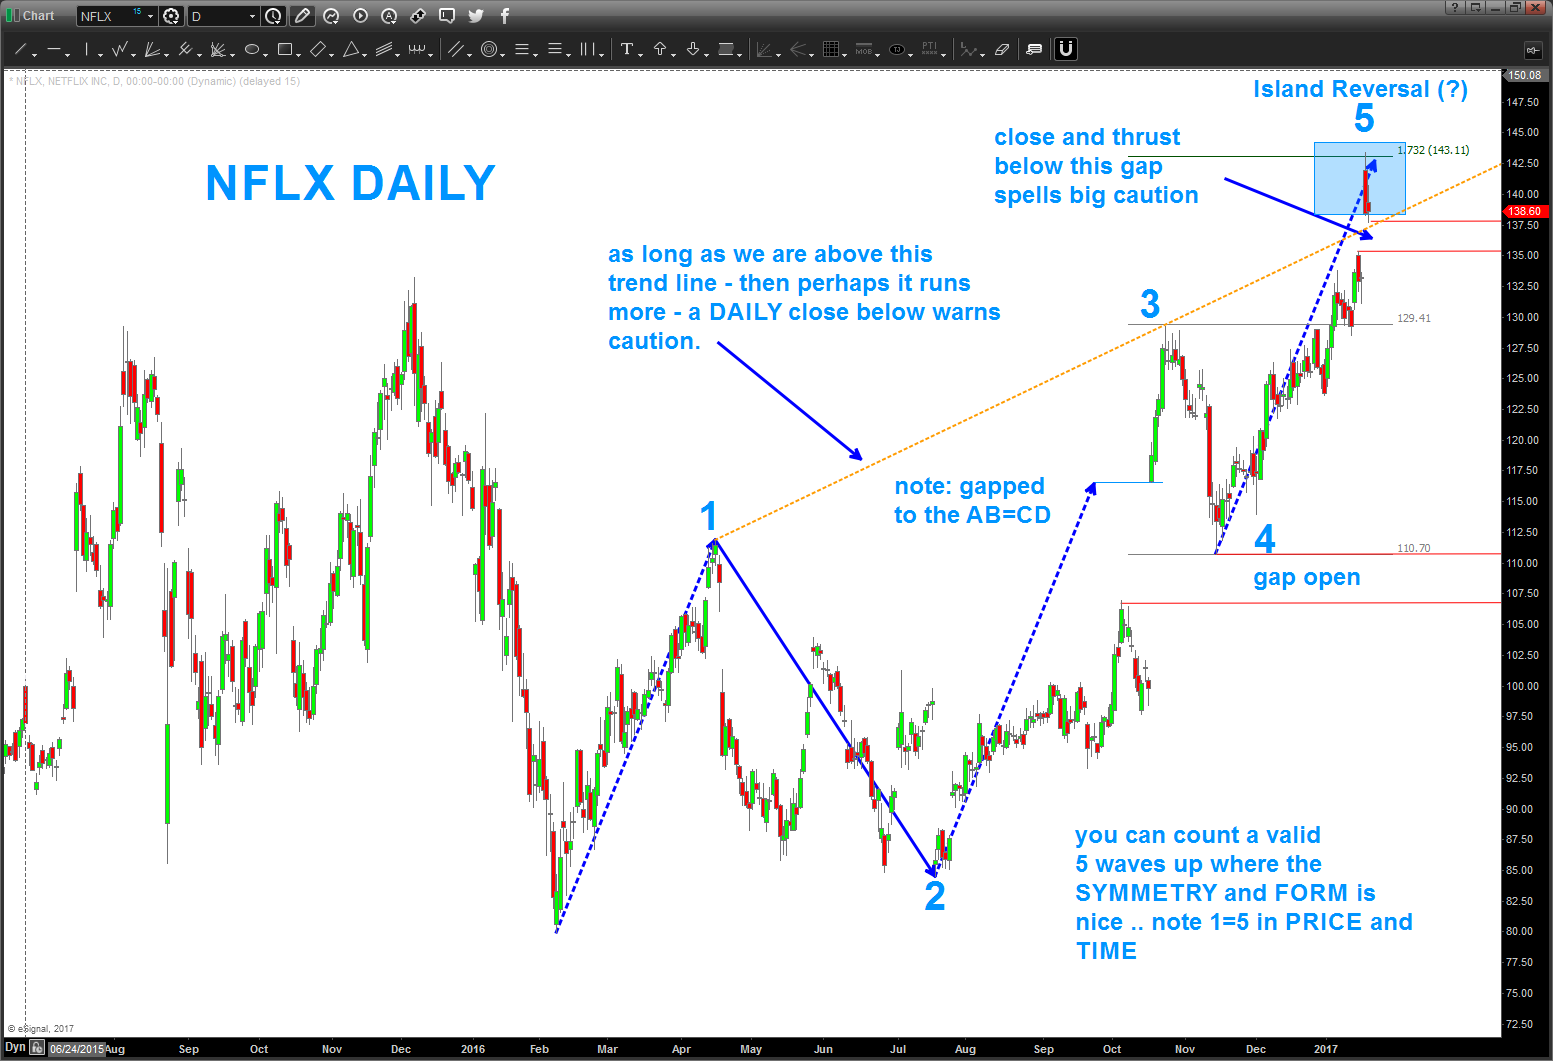
well, the GAP from the former congestion area into new highs was powerful BUT note that we have been selling off since the gap and IF (the big if folks) we close back below the dashed orange trend line AND close the open gap (a gap down back below is ‘technically’ the island reversal THEN guess what things could get going to the downside. so use those levels noted below as your guide.
some key stuff:
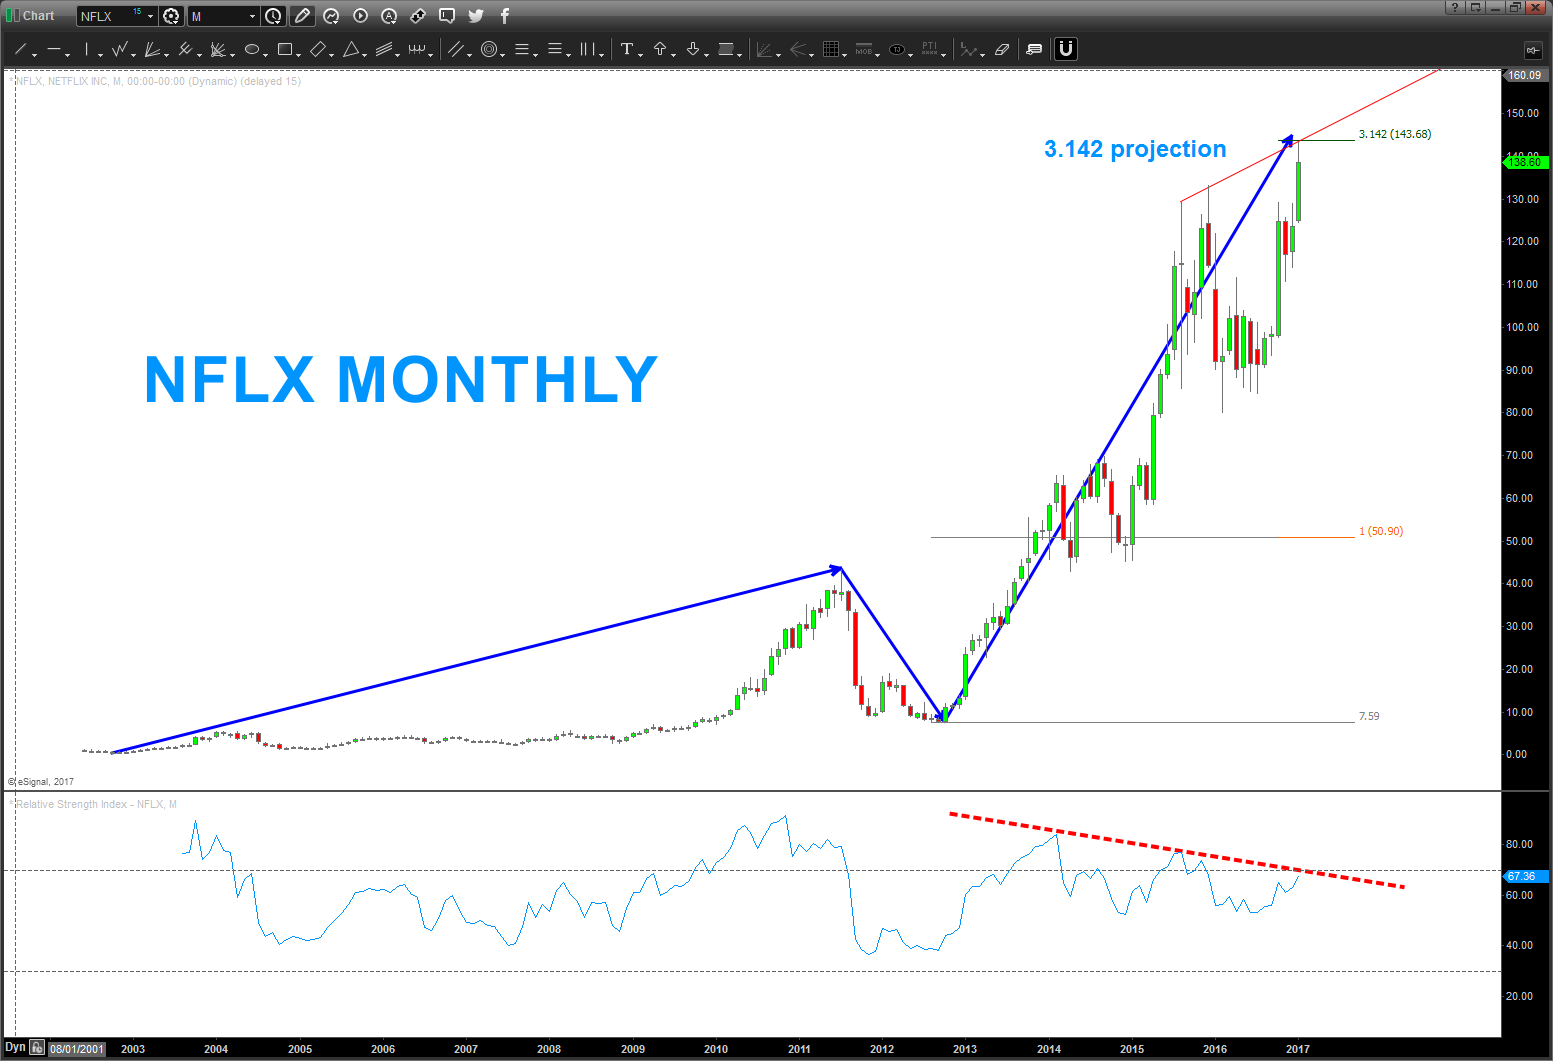
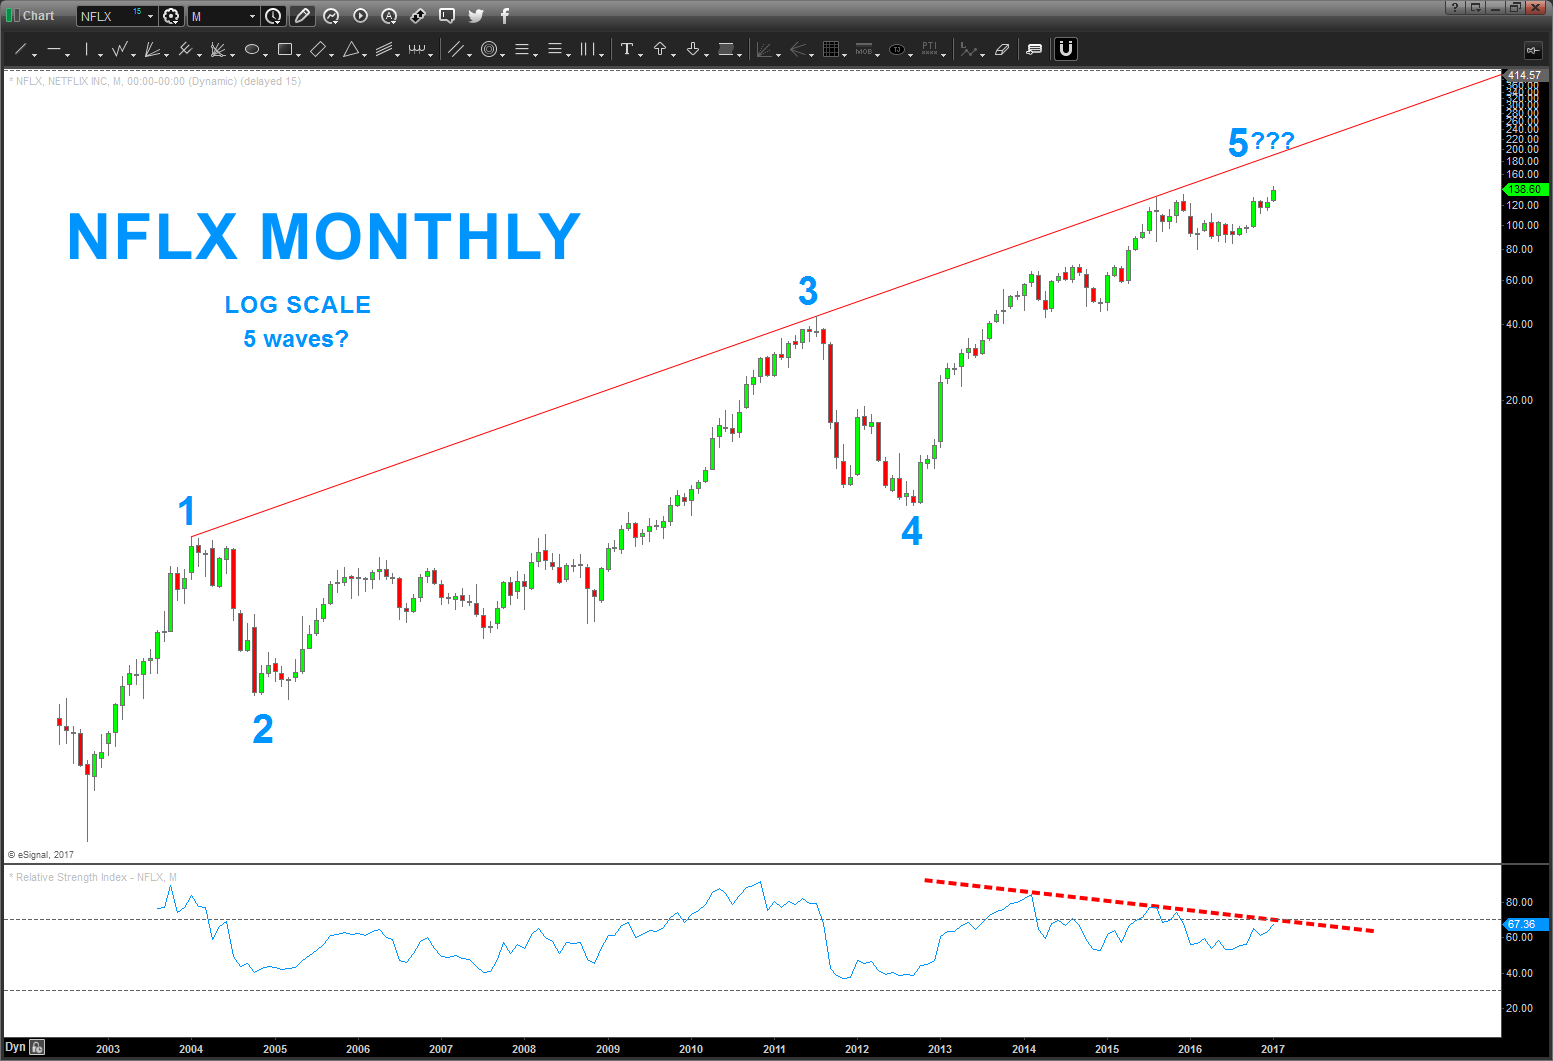
- note the monthly
- that’s some pretty large bearish divergence
- also note, from the first move up way back when it ‘perfectly’ hit the 3.142 (PI) projection
- also note the top trend line … a daily close above that is VERY bullish but right now, banged right into it as resistance
- note the monthly ‘log’ chart
- the top trend line held price at bay (that caused the consolidation IMHO) but if we keep going that top trend line would be the next logical target
- note the daily
- see the orange dotted trendline … that’s the one to really watch for now
- I REALLY like that wave 1 up and wave 5 up are equal in PRICE and TIME
- note how wave 3 gapped rigth up to the AB=CD where wave 1=3 and then ran ….
- REALLY pay attention to the gap that was left a couple days ago – that’s the one which, if gapped down below will cause the island reversal
perhaps NFLX will kick my butt again … we’ll see.
cheers!
B
if you look thru or have been reading my blog you’ll realize that the patterns do fail .. invariably when this occurs I’ll go back to the drawing board and come up w/ another PATTERN. check out WYNN … you never know what’s going to happen and the PATTERNS do fail. manage the risk …
$NFLX has beaten me – alot. Uncle ….
https://bartscharts.com//?s=NFLX
that being said, I hit erase all on $NFLX chart and took a fresh look at it … I still see 5 waves up w/ no RULES broken so the count is valid and there’s monthly bearish divergence and we are about to tag the upper long term trend line that is roughly 10 years old. I still say be careful up here but .. again … UNCLE.
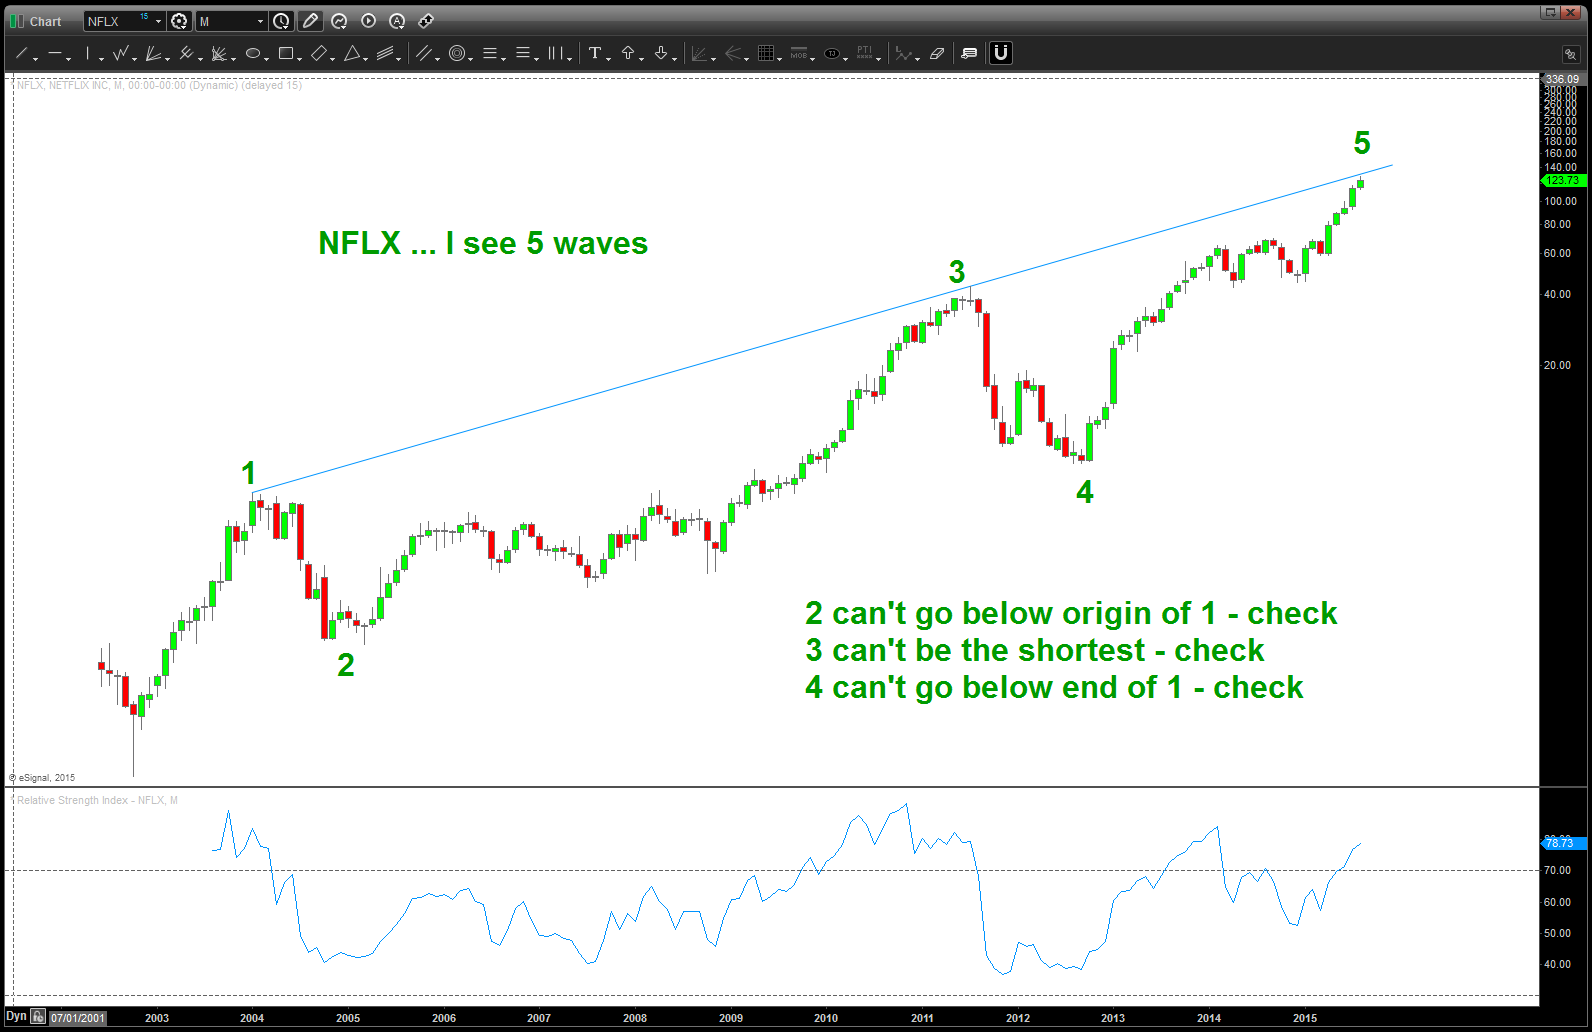
NFLX Monthly
but what’s the next pattern or set of target areas? No flipping idea …nope, not going to do it.
“f’it dude, let’s go bowling”

XLP / $NYA … approaching .382 from all time low
Posted on September 28, 2017 Leave a Comment
if the XLP/NYA ratio finds support and appears to end an A-B-C correction THEN we ‘should’ see Volatility Spike and correspondingly a nice correction in equities. If this level fails, then we might see some consolidation or a little pullback but nothing that could spook the masses.
it might be noted that … right now we are levels of bullishness as measured by market vane that we haven’t seen since ..yes, you got it the 2007 top.
a plunging liquidating sell-off should, ultimately be bought .. as I still don’t think this run is over but I do believe we are long overdue for a nice pullback. W/ the options expiration and most mutual funds legally bound NOT to sell and be invested at all times I don’t think we’ll see anything till next week, if at all.
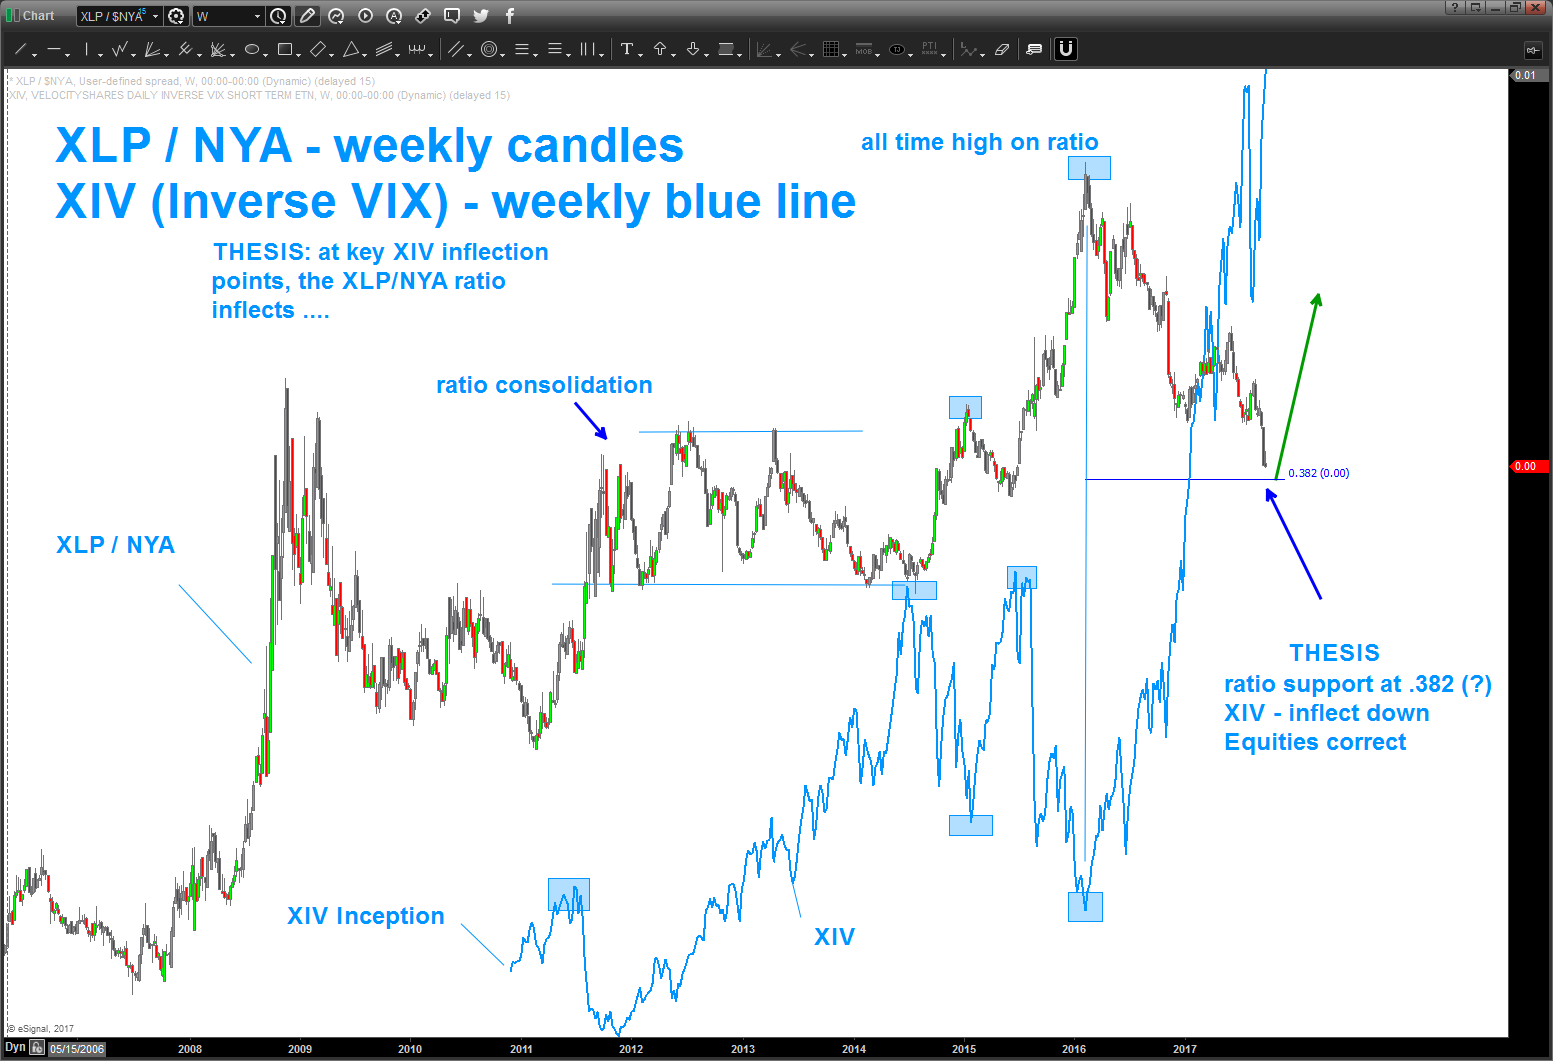
Note the chart below ..
- XLP/NYA – candles
- XIV (inverse VIX) blue line
- NOTE: a most inflections of the XIV (up or down) the ratio either led or gave a heads up that volatility would increase or decrease.
- Our thesis is the ratio ‘should’ find support on the .382 from the all time low in 2007 and correspondingly cause an uptick in volatility and a market sell off.
- A CLOSE (WEEKLY) BENEATH THE .382 WILL TARGET A LOWER MEASURED MOVE TARGET. IF THIS HAPPENS EXPECT SOME CONSOLIDATION OR MINOR FITS AND STARTS BUT NOTHING TO KNOCK YOUR SOCKS OFF. WOULD WAIT TO SEE WHAT HAPPENS A LITTLE LOWER IN THE RATIO.