XLP / $NYA … approaching .382 from all time low
if the XLP/NYA ratio finds support and appears to end an A-B-C correction THEN we ‘should’ see Volatility Spike and correspondingly a nice correction in equities. If this level fails, then we might see some consolidation or a little pullback but nothing that could spook the masses.
it might be noted that … right now we are levels of bullishness as measured by market vane that we haven’t seen since ..yes, you got it the 2007 top.
a plunging liquidating sell-off should, ultimately be bought .. as I still don’t think this run is over but I do believe we are long overdue for a nice pullback. W/ the options expiration and most mutual funds legally bound NOT to sell and be invested at all times I don’t think we’ll see anything till next week, if at all.
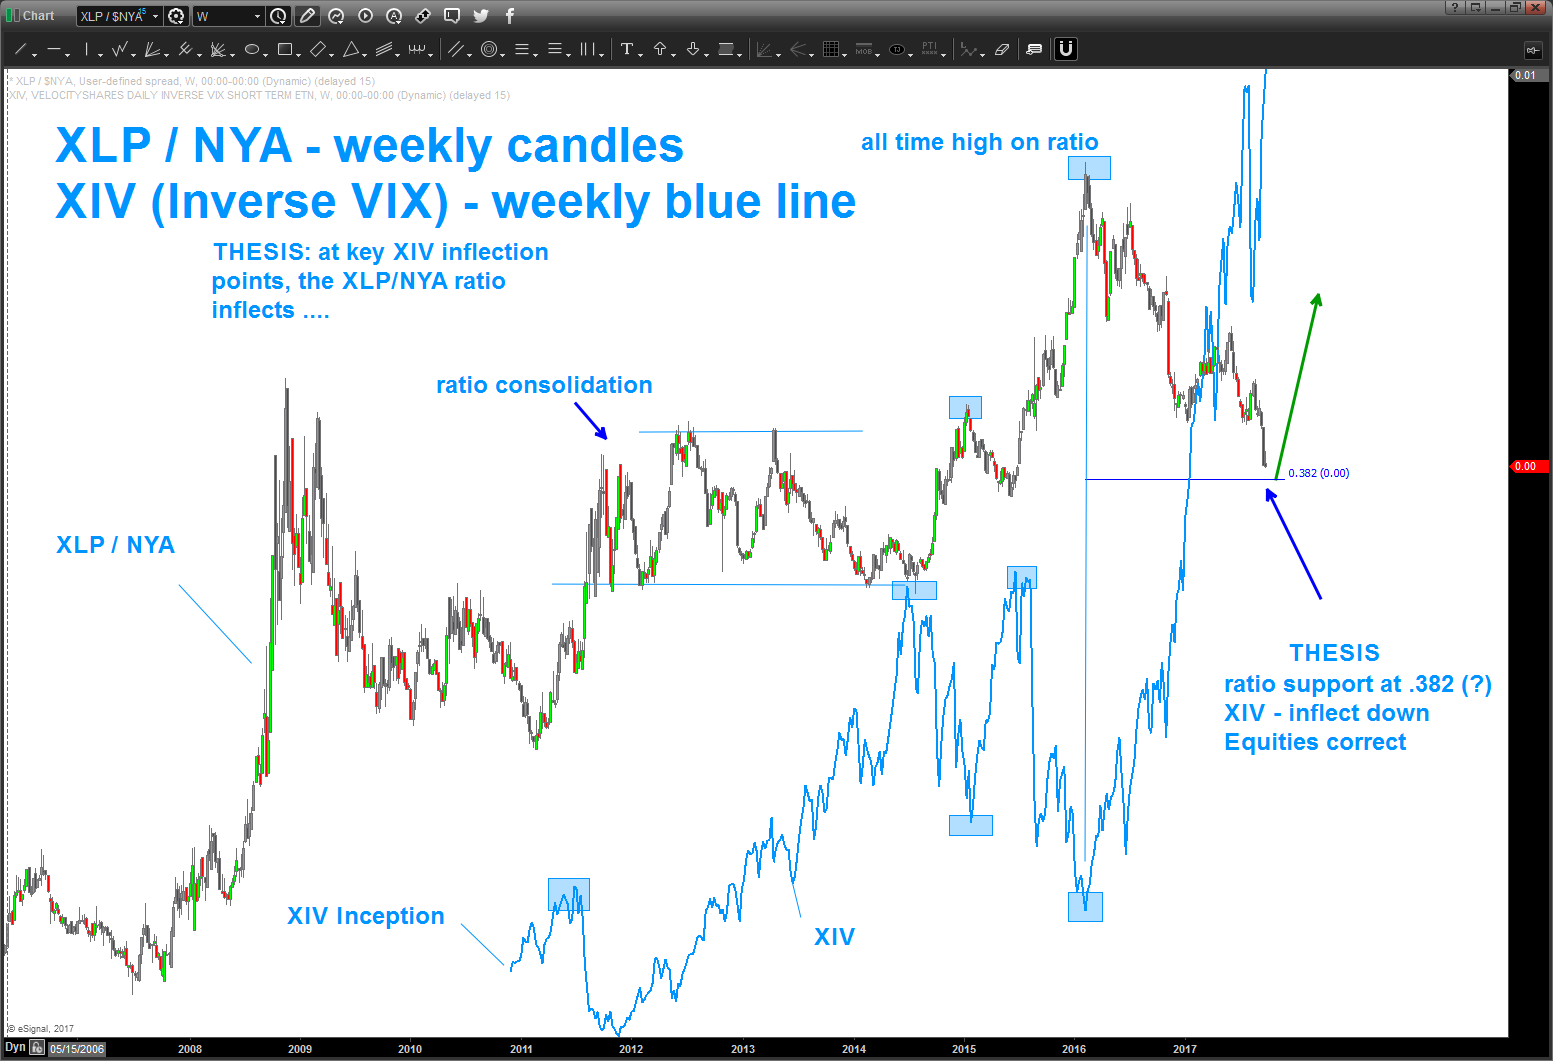
Note the chart below ..
- XLP/NYA – candles
- XIV (inverse VIX) blue line
- NOTE: a most inflections of the XIV (up or down) the ratio either led or gave a heads up that volatility would increase or decrease.
- Our thesis is the ratio ‘should’ find support on the .382 from the all time low in 2007 and correspondingly cause an uptick in volatility and a market sell off.
- A CLOSE (WEEKLY) BENEATH THE .382 WILL TARGET A LOWER MEASURED MOVE TARGET. IF THIS HAPPENS EXPECT SOME CONSOLIDATION OR MINOR FITS AND STARTS BUT NOTHING TO KNOCK YOUR SOCKS OFF. WOULD WAIT TO SEE WHAT HAPPENS A LITTLE LOWER IN THE RATIO.