GOOGLE update
I’ve spent some time over @seeitmarket working on GOOGLE. This was my last post:
As you are probably aware, it blew thru the target area. Now, it did spend roughly a year and half at the target level but in the end it blasted off.
Back to the drawing board …
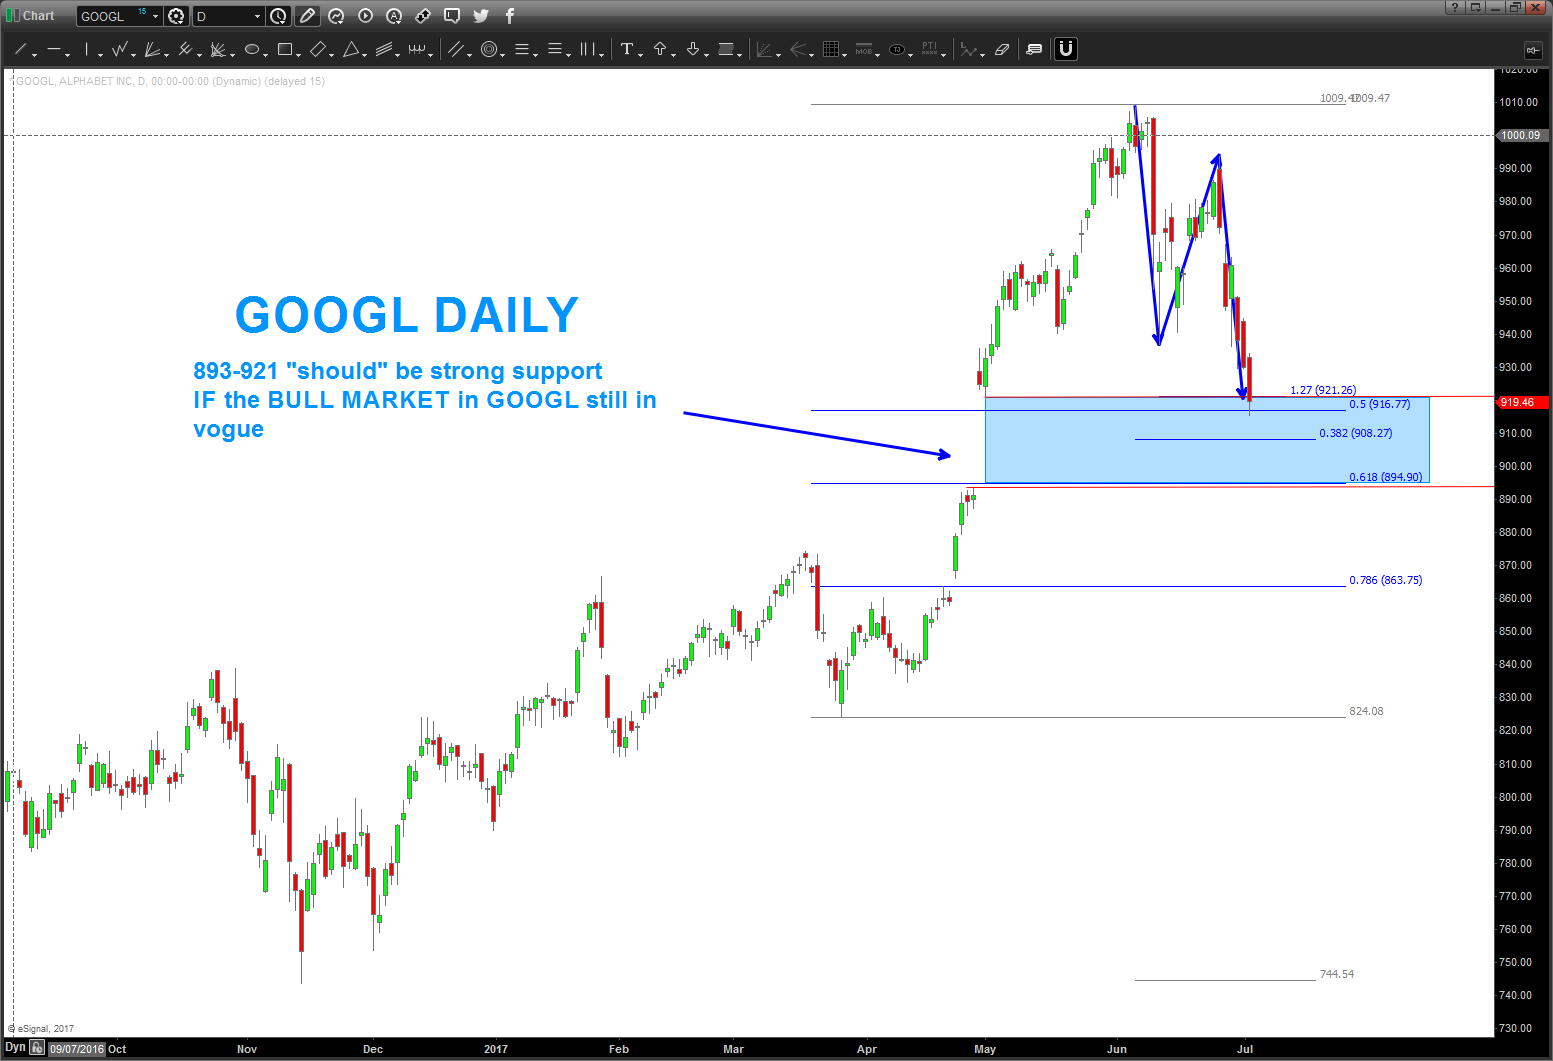
Where are we now .. well, being a pattern dude and trying not to inject personal opinion I just try to call it like I see it. GOOGLE has a nice pattern hitting … so if the bull run is to continue current levels or a little lower need to hold.
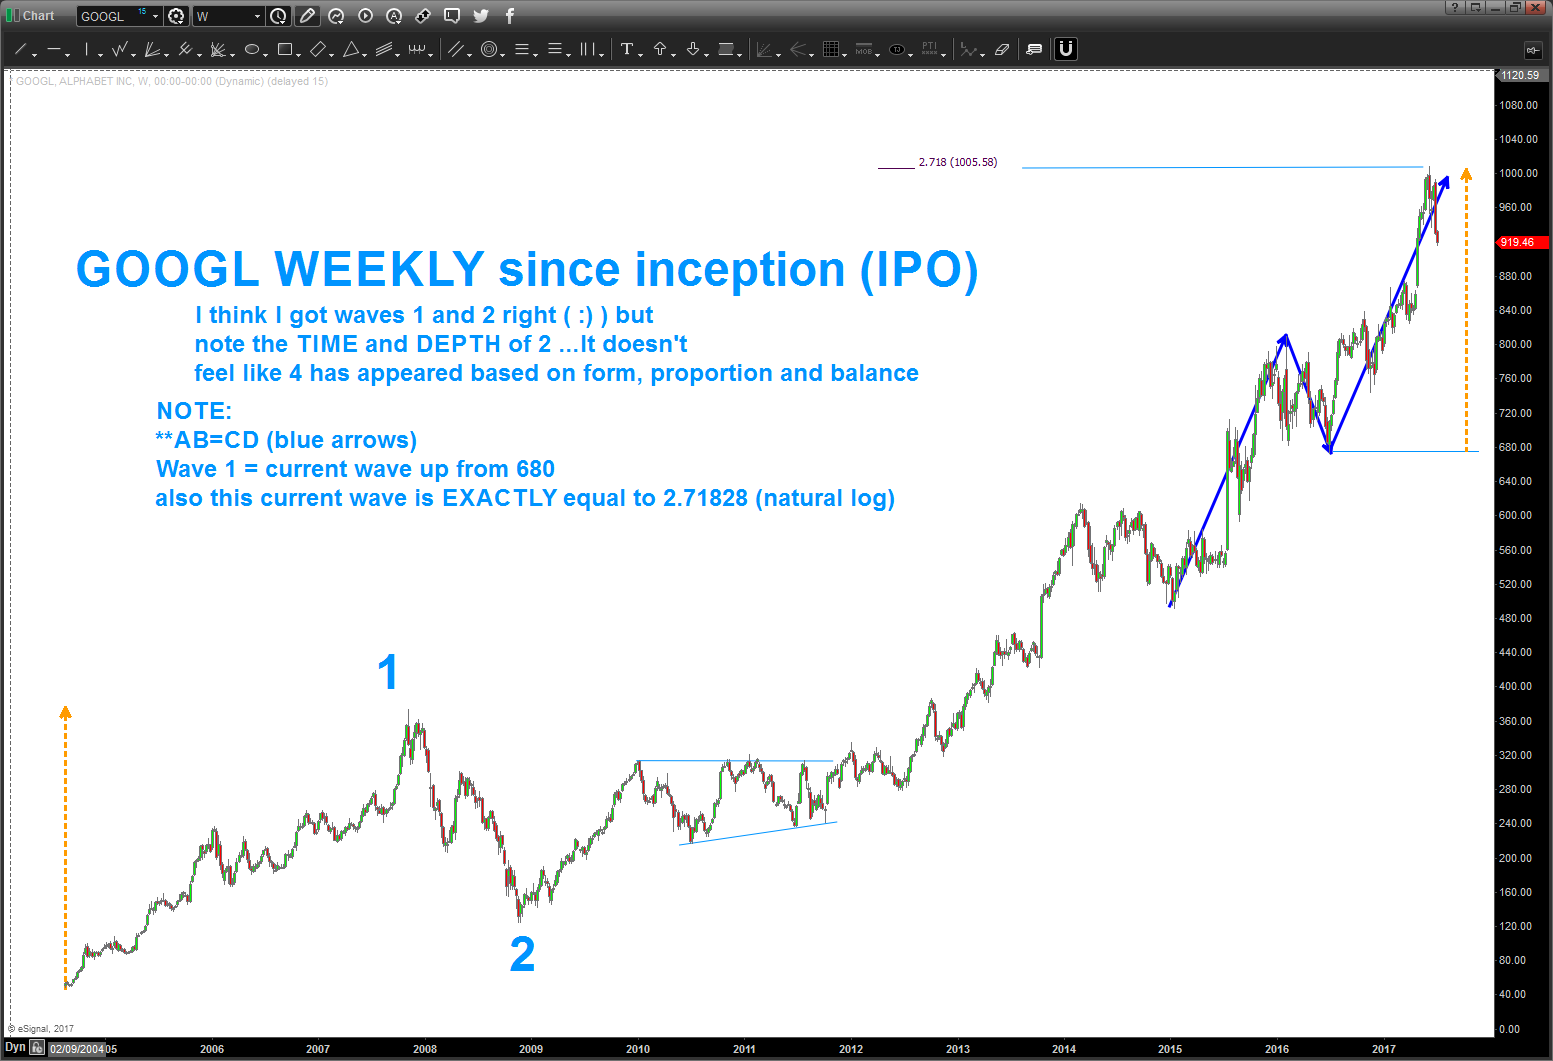
I tried (being the operative word) to give a realistic count. Ha, that didn’t work … but I know where waves 1 and 2 are! I’m going to keep the rest of the chart after 2 clear .. want to see what happens around the buy level above. But note the chart below .. some interesting stuff going on …AB=CD (blue arrows), Wave 1 equals the current wave .. and wave 1 *2.71828 exactly nailed the top (yes the natural log number – it’s a key number folks). So, we shouldn’t be that surprised on the resistance found on GOOGL
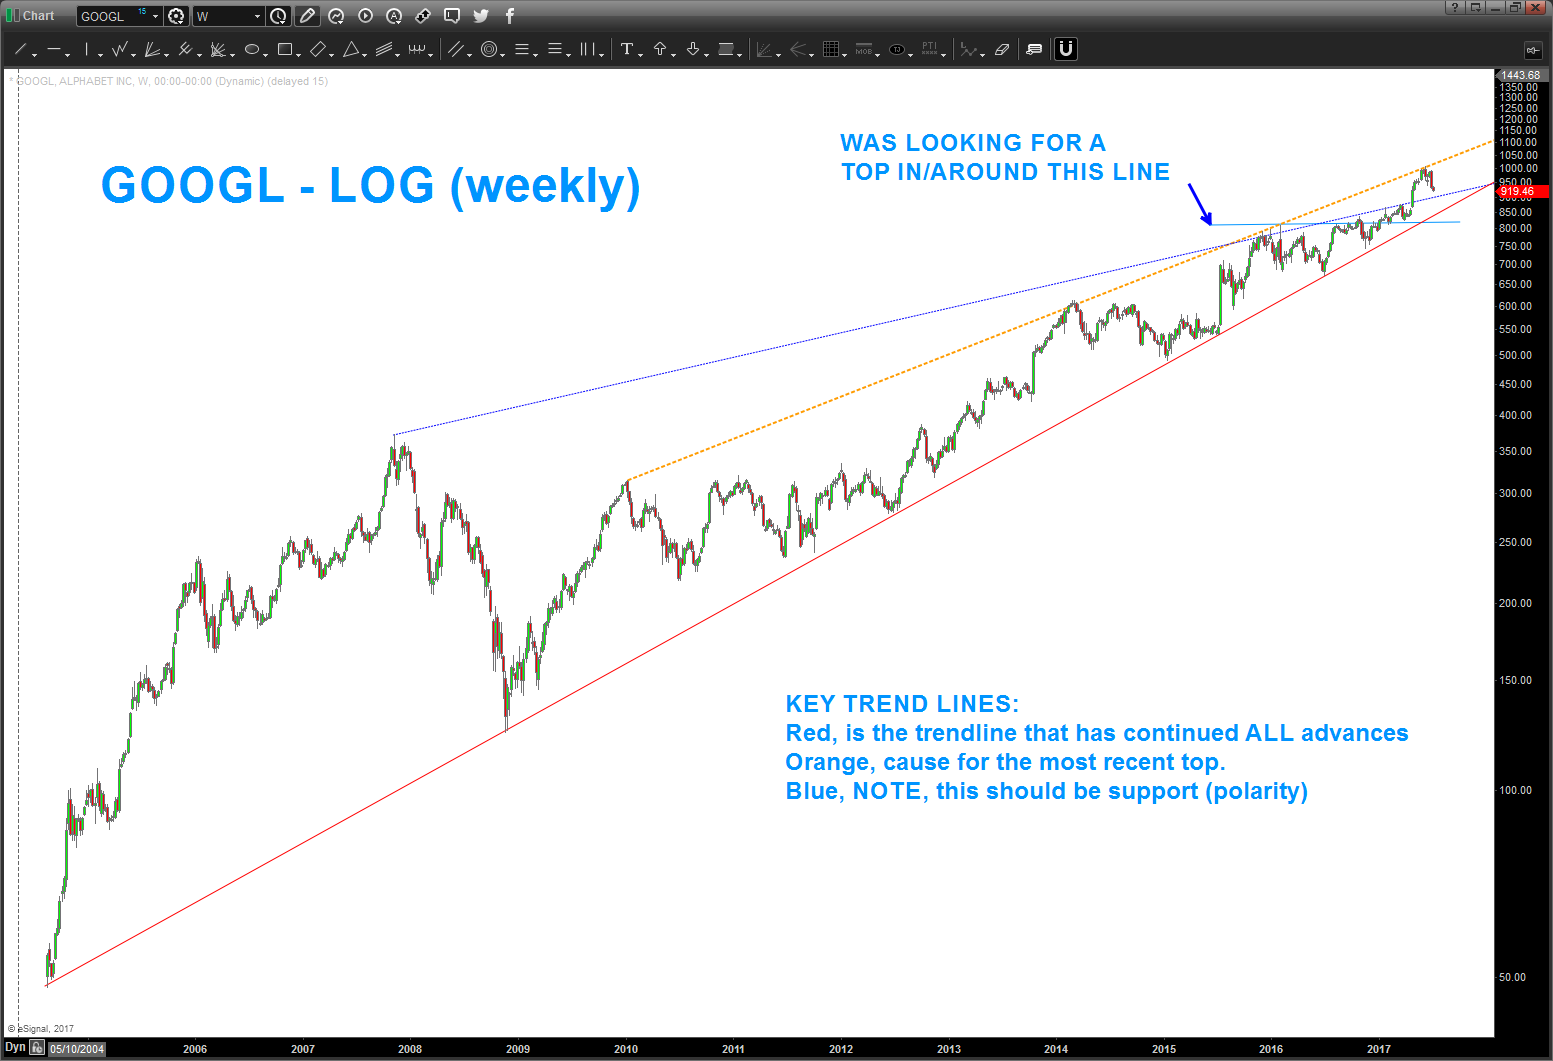
Also, you know I love long term LOG trend lines. As the chart below shows, we have 3 key trend lines … I recommend monitoring the blue and red lines. the blue, from the polarity principle, SHOULD be strong support. If that breaks, then a move to the red trend line (the one that has been the key support for ALL advances) should get attacked. IF WE BREAK BELOW (on a weekly close (?)) THAT TREND LINE THIS PUPPY COULD REALLY ACCELERATE TO THE DOWNSIDE. So, monitor GOOGL closely.