Pound Negative Reversal Potential – Long Term Chart
i had the wonderful pleasure to teach, for a little over a year, the Capstone CMT III course…the positive and negative reversal arena usually made both me and the candidates head explode. so, if you want to read about it and catch some understanding, Google: RSI negative and positive reversal by Connie Brown.
in this case we have a negative reversal, potential, on the POUND vs the USD on a monthly chart … negative reversal is when the PRICE does NOT make a new high relative to a former peak and the RSI DOES make a new peak. Basically, price isn’t keeping up so a change in trend might be on the way ….here’s the chart:
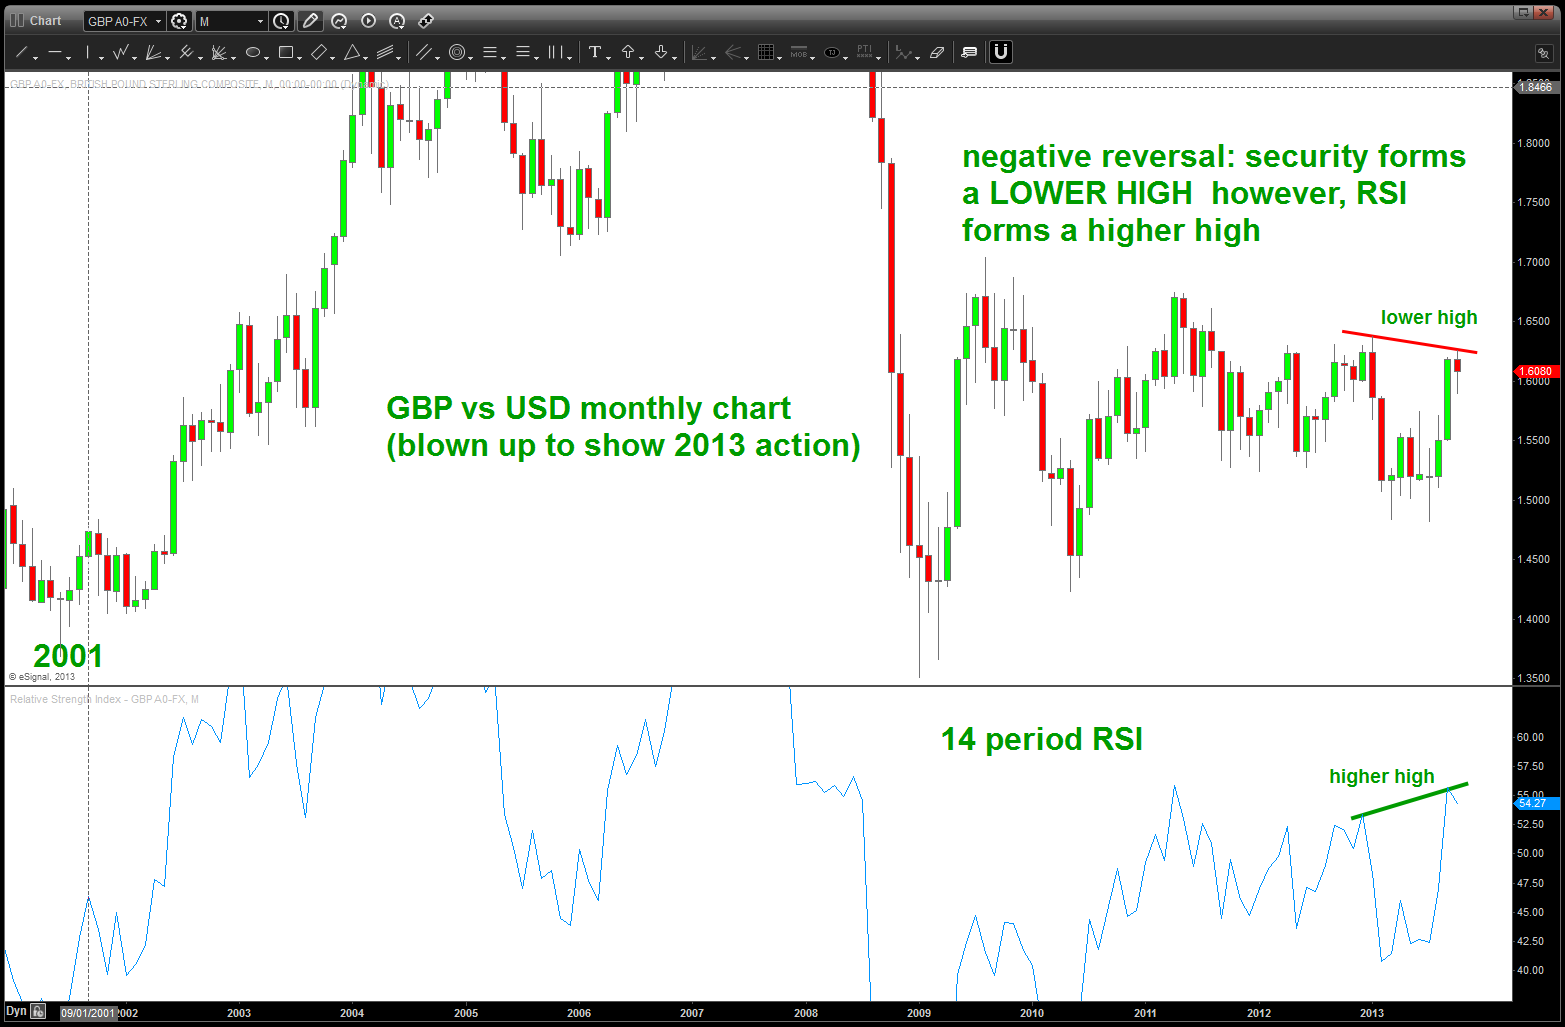
Long Term Negative Reversal on the POUND vs the USD (potential)
when we move to the weekly I’ve added the “bearish zones” for the RSI and “THINK” this entire range has held the bearish range as shown and is characteristic of a very large 4th wave triangle that lasted 4 years. recent price action labeled (1) and (2) are the beginnings of a 5th wave that will ultimately take out 1.350 which forecasts a 2500+ pip move in the POUND vs the USD.
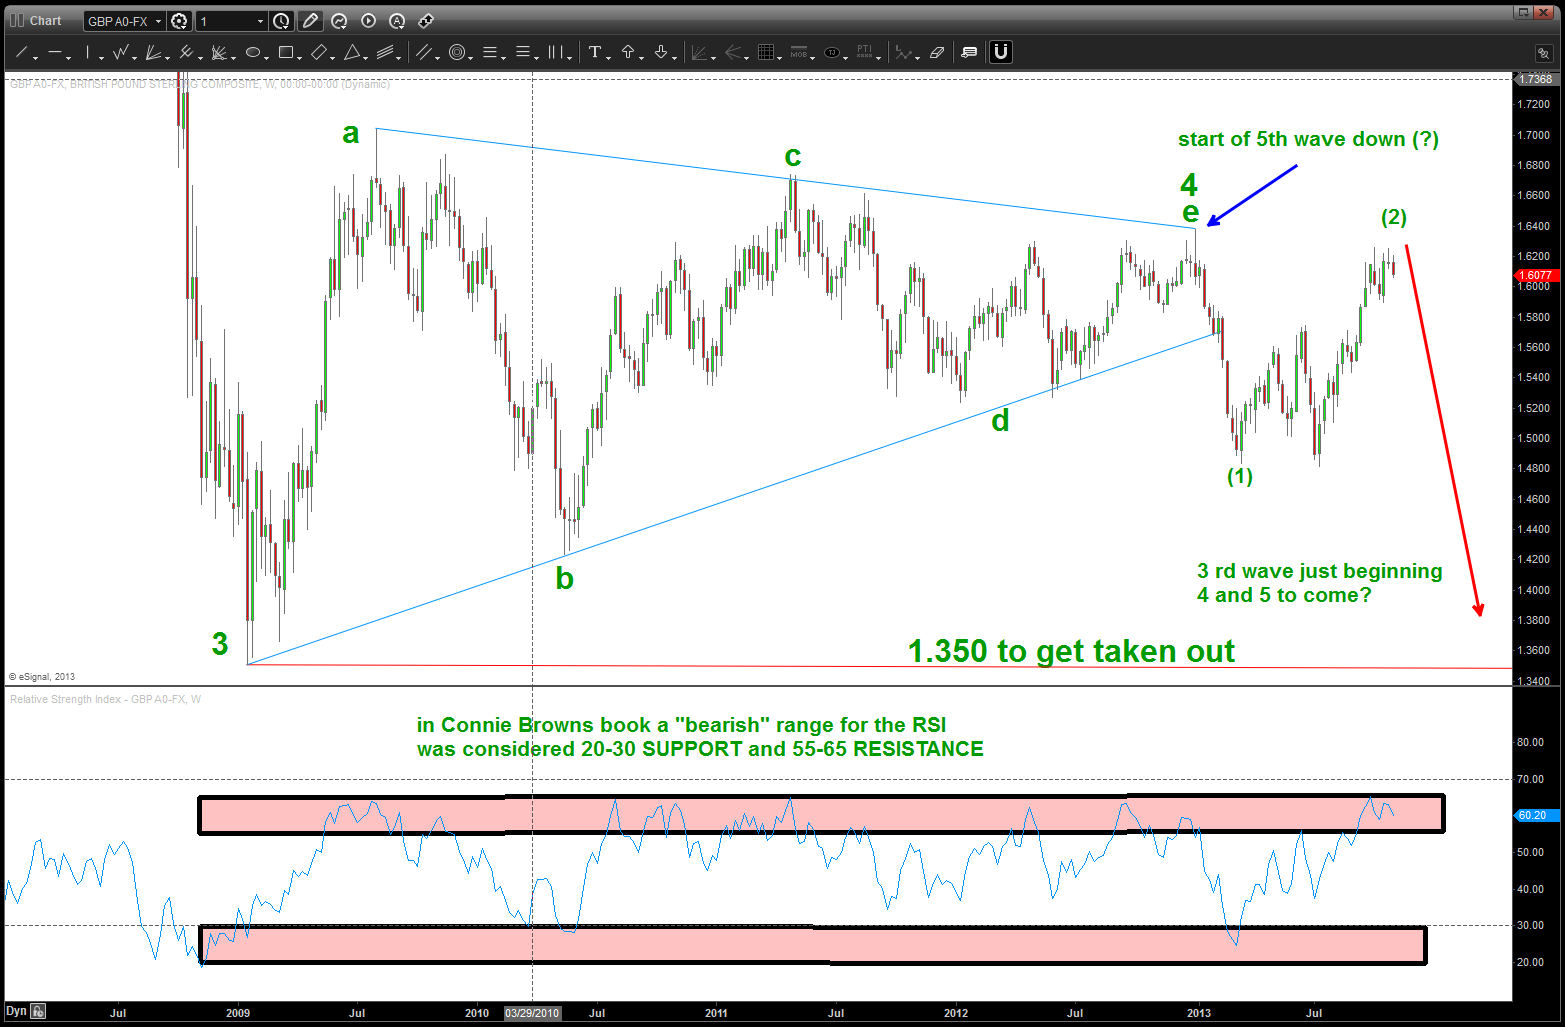
bearish RSI zones on the POUND showing how this could POTENTIALLY fit into the context of a 4 year triangle
where are we now? well, if you have been following, my target zone of 1.6320 ish never got hit and it was missed by 60 pips which is just too many pips to swallow right now. so, below is the count I’m watching that could rise us to that area … I have not included the bearish count because it gets too darn confusing (imagine that in Elliott Wave) but the key here is that the “was this the high” could have done it and therefore we are in a wave 3 of something ( :)) so using stops if trying to get long is highly recommended. If we can successfully defend the 1.6020 area and get some THRUST and MOMENTUM going up then perhaps the target will be realized. If we LOSE 1.5969 then I think the top could be in place and I’m going to have to work like heck to get into a move .. sounds easy on this blog, but in the real world w/ massive moves and swings and a 24 hour market it’s simply hard to do …
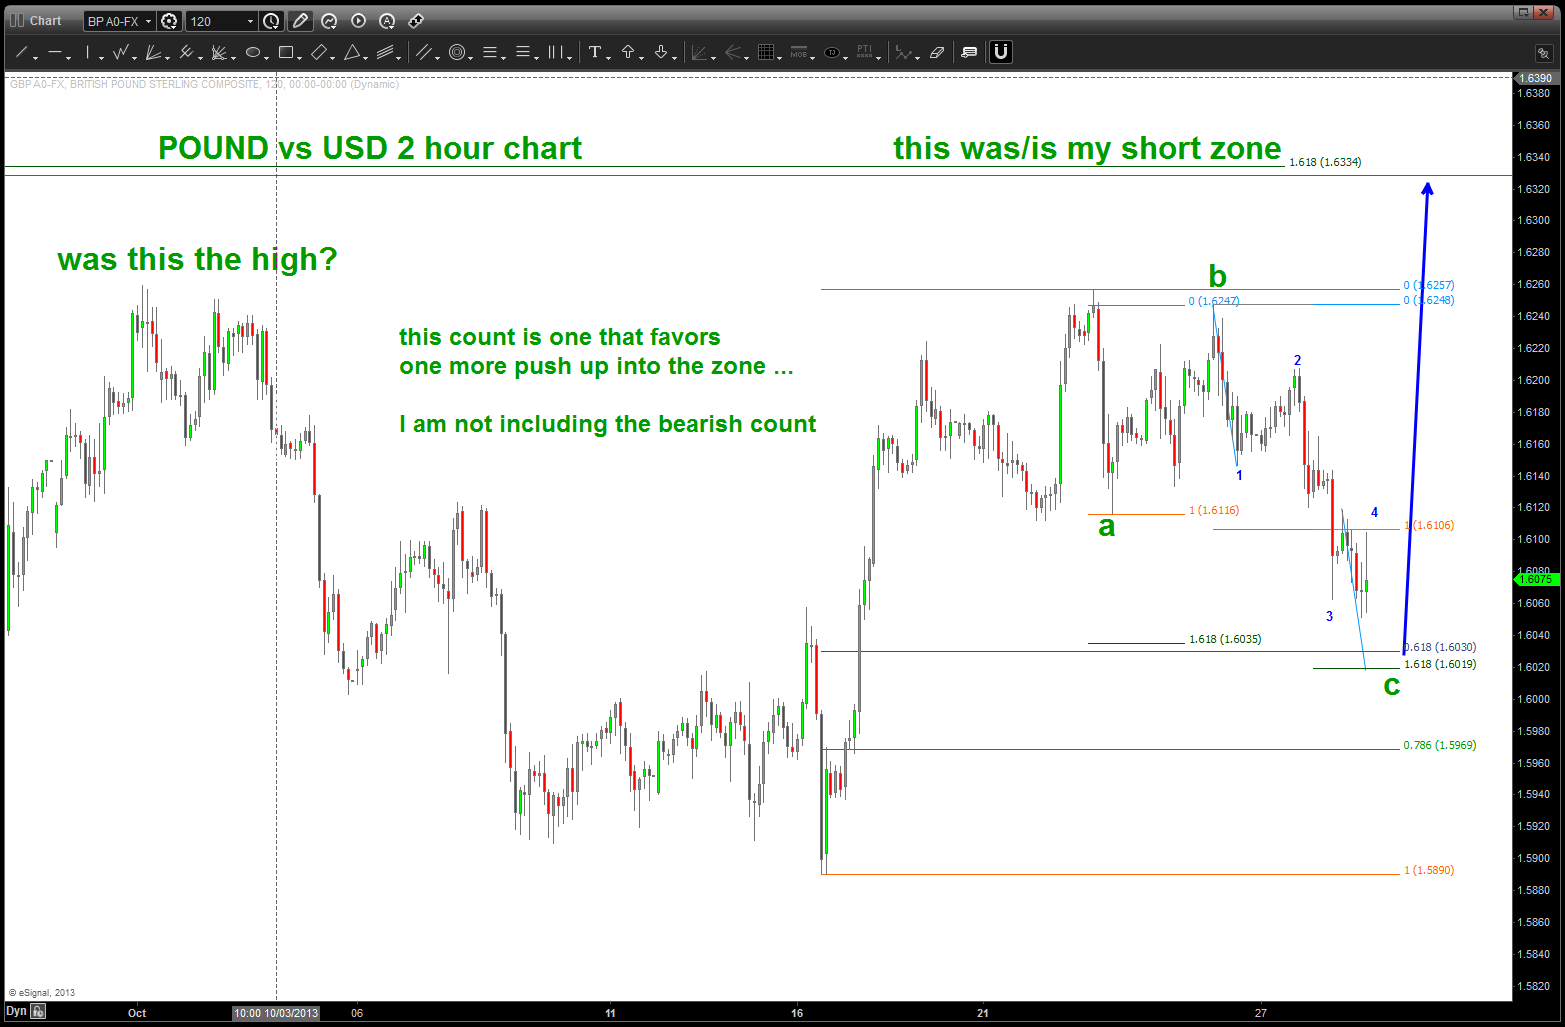
where we might be …
we’ll see and let me know if you have any questions ….
B

Pingback: Great British Pound – again | Bart's Charts