Attractors – May 10, 2026

My bud Ponch is going to BLOW AWAY the Hedgeye crowd this week …trust me.
I had a conversation w/ him late last week ( we have talked continuously for 2+ years ) and simply thanked him for, literally, teaching me the ‘real OODA LOOP’ such that pretty much everything around us is controlled by this masterfully complex yet simple in design ‘loop.’
To imagine the John Boyd literally studied the Hermetica and beyond to complete his theory of how living systems persist thru time is hard when the ‘loop’ seems so simple. It’s actually brilliant.
Tune into this talk …

Got me thinking … not that I’m anywhere close to where Ponch and Mr. Boyd are from an intellectual capacity perspective but I have gone down the rabbit hole, pretty deep. Almost came out in China to be honest …
My friend Alan Green told Ponch and I that Einstein was “obsessed w/ simplicity.” Think about it … E=MC^2. One of the MOST complex subjects distilled to that. Elegance in simplicity …
That’s why, ultimately, I simply trust the harmonics of the measured move. Why?
Because they are the basis for the fractal nature of our entire universe.
If PRICE = TIME … in that, say, a high price of 40 will spin of time cycles of 40 … minutes, seconds, days, degrees of planetary travel, etc. etc. then the harmonics of time are directly equal to the amplitude of the price move.
So, as you will see in the charts below, the MEASURED MOVE contains all the DNA (key here folks) for those who are invested in a particular security or index. The theory being that on the quantum level all the vibratory aspects of ACTION w/in, say, the stock of SBUX is manifested by geometric attractors – just like everything – that create the foundation energetic footprint of the masses. Since we push a stock up or down based on greed and fear those price vectors ultimately HAVE to contain a DNA element w/in them containing time.
What IS the ultimate guide for time w/in this 3D construct called “life” or “earth” if you will? The planets …
Don’t believe me?
“And God said, Let there be lights in the firmament of the heaven to divide the day from the night; and let them be for signs, and for seasons, and for days, and years.”
— Genesis 1:14
Or, do your own work:
Genesis 1:14–19 Genesis 1:16 Psalm 104:19 Psalm 104:20–23 Psalm 19:1 Psalm 8:3 Psalm 74:16 Psalm 136:7–9 Psalm 147:4 Job 38:31–33 Job 9:9 Job 26:13 Jeremiah 31:35 Amos 5:8 Isaiah 40:26
Psalm 104:19 is especially direct: “He appointed the moon for seasons; the sun knows its going down.”
Job 38:31–33 is worth highlighting — God asks Job whether he can “bind the Pleiades” or “bring out Mazzaroth in its season,” implying the constellations/planets operate on a divine schedule.
Jeremiah 31:35 refers to God giving the sun, moon, and stars as a “fixed order” — another strong timekeeping verse.
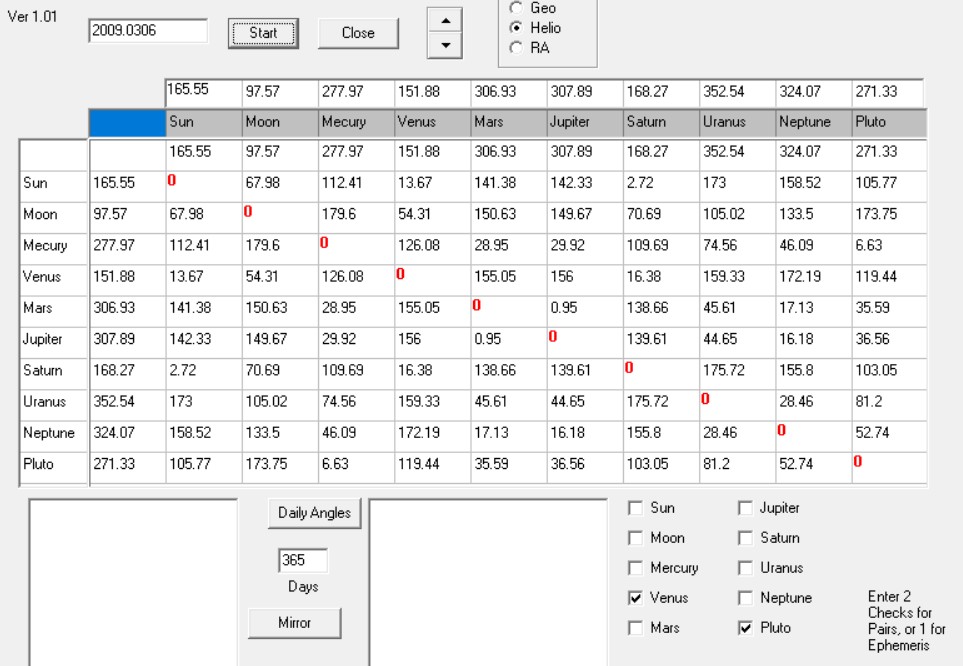
So, ultimately, there is a harmonic sheet of music being played …the below is an application that I received from Michael Jenkins and its the location of the planets, heliocentric, the date of the low for the Great Financial Crisis.
The numbers are the degrees of separation, helio, between the planets on that date. That date was a tremendously key low from a cycles perspective. Ya think?
So, if that is the beat of ALL the planets – think of it as the reflection of the beat of the masses on that date – when the orchestra of the world, perhaps, transitioned there emotion of fear to greed. A transition like the one that occurs in Led Zeppelin’s Classic Kashmir … a new beat. Since this is the ‘orchestra’ of the markets any/all future and (foot stomp) past market movements are harmonic to this ‘beat.’
It’s not just one planet or set of planets …it’s the entire orchestra that transitions. You catching what I’m throwing down …?
You see, every angle is key and not only every angle but also planetary travel of individual planets. And, yes, of course, tertiary angles … picture each planet as a musical instrument in the orchestra of the market. Each has a role and it’s multi functional and, frankly, multi dimensional (I said it).
So, how do you keep track of square outs, fundamental frequency targets, square of nine price and time targets, planetary and geometric angles based on the platonic solids, planetary motion, etc. etc. You don’t but … AI certainly might be able? Ya think …?
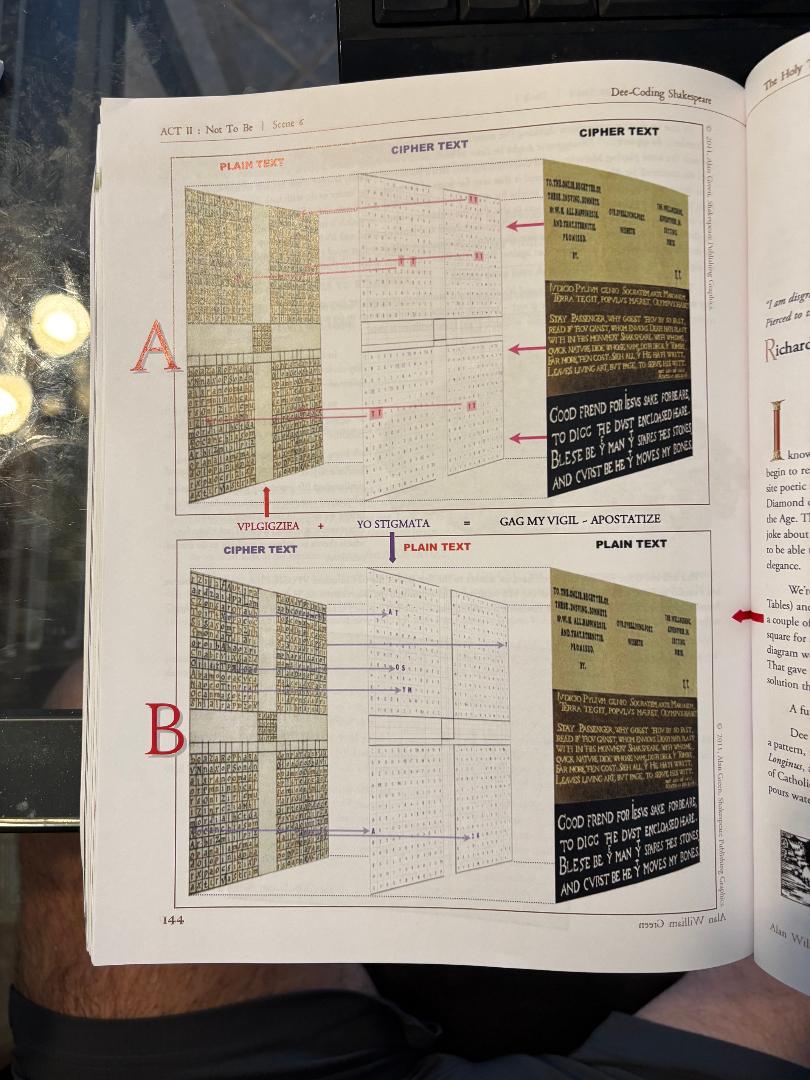
Is this doable … honestly, not sure. That being said, having read Alan Green’s book DEEcoding Shakespeare 3 times one can see that AI is not necessarily needed as John Dee, who downloaded the Enochian Tables from Angels (documented) and encrypted Shakespeare in a 3D manner (shown in the picture above) could certainly see the movement and flow of everything.
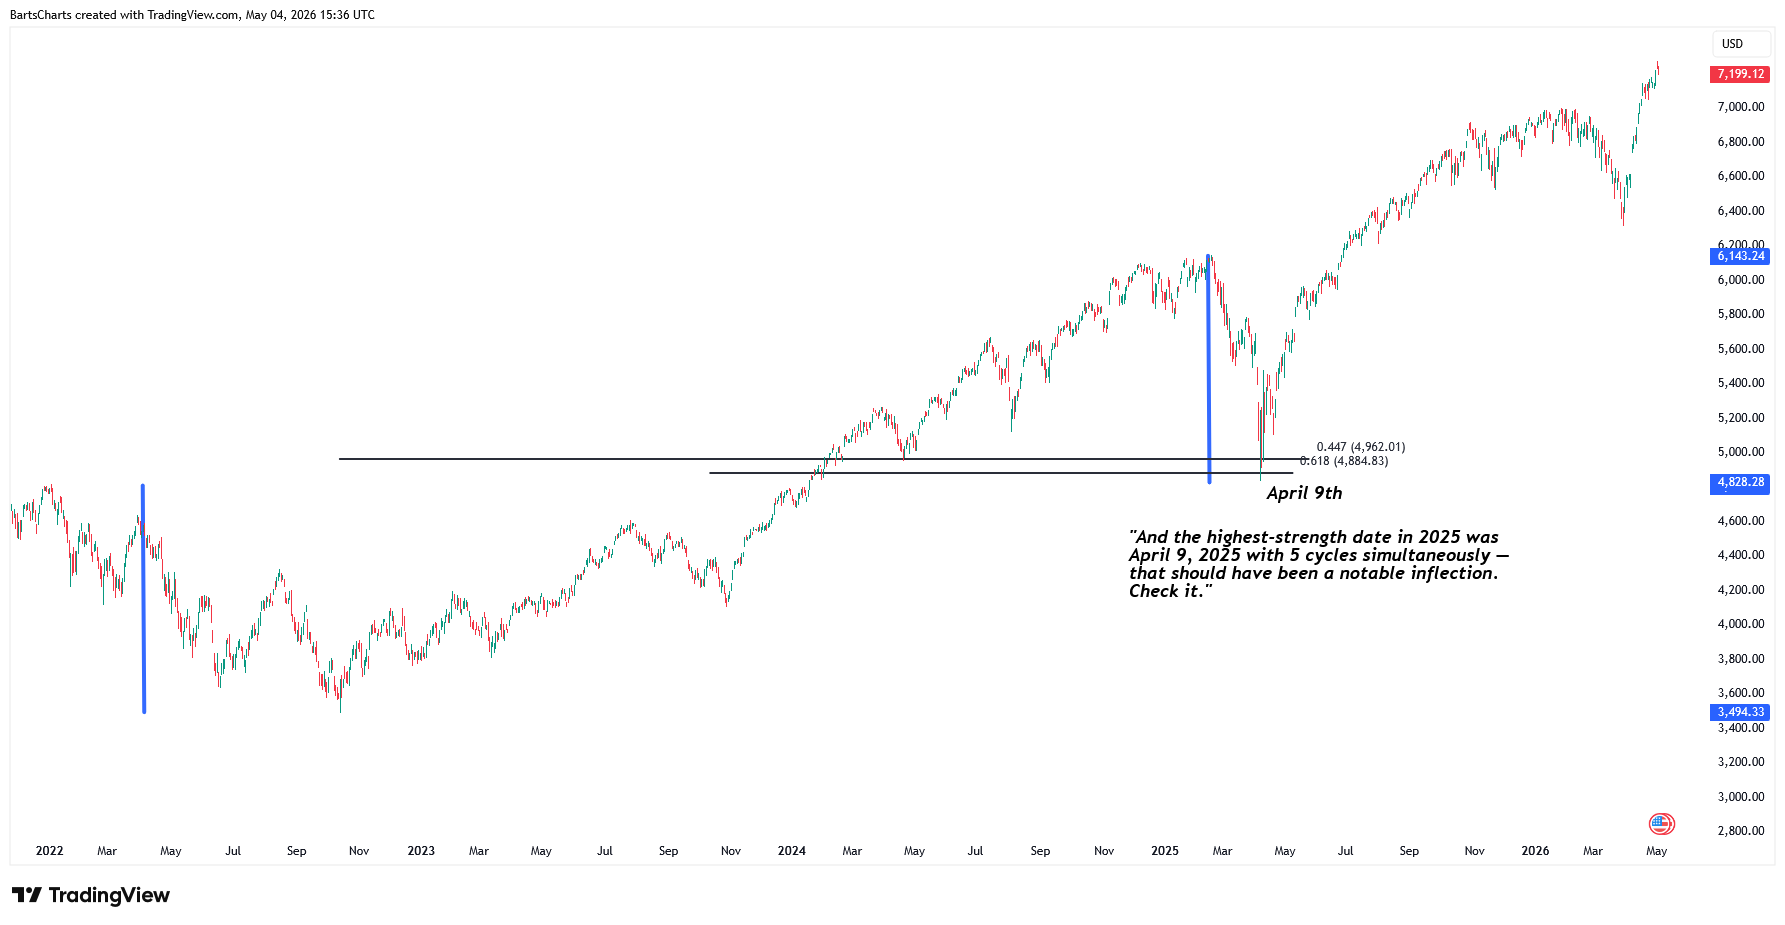
Just ‘playing around’ w/ an LLM I created a planetary AI Agent to look for cycles … the above is what it came up with. This is having NO access to any market data. Well, here’s what is interesting … look at that, a measured move, on a confluence zone on the date of a major cycle hitting …
All of this is a long way of saying that I simply trust the measured moves and, frankly, live and die by them as they are the truest indicator of market trends and emotions. Humor nature NEVER changes – why? Well, because it is ALL happening now just at different vibrations. Time … is not … linear. The UAP release should (operative word) give you some permission to explore this … don’t ya think?
So, tomorrow AM, I’m going on Stock Market TV w/ Spencer to talk the following charts.
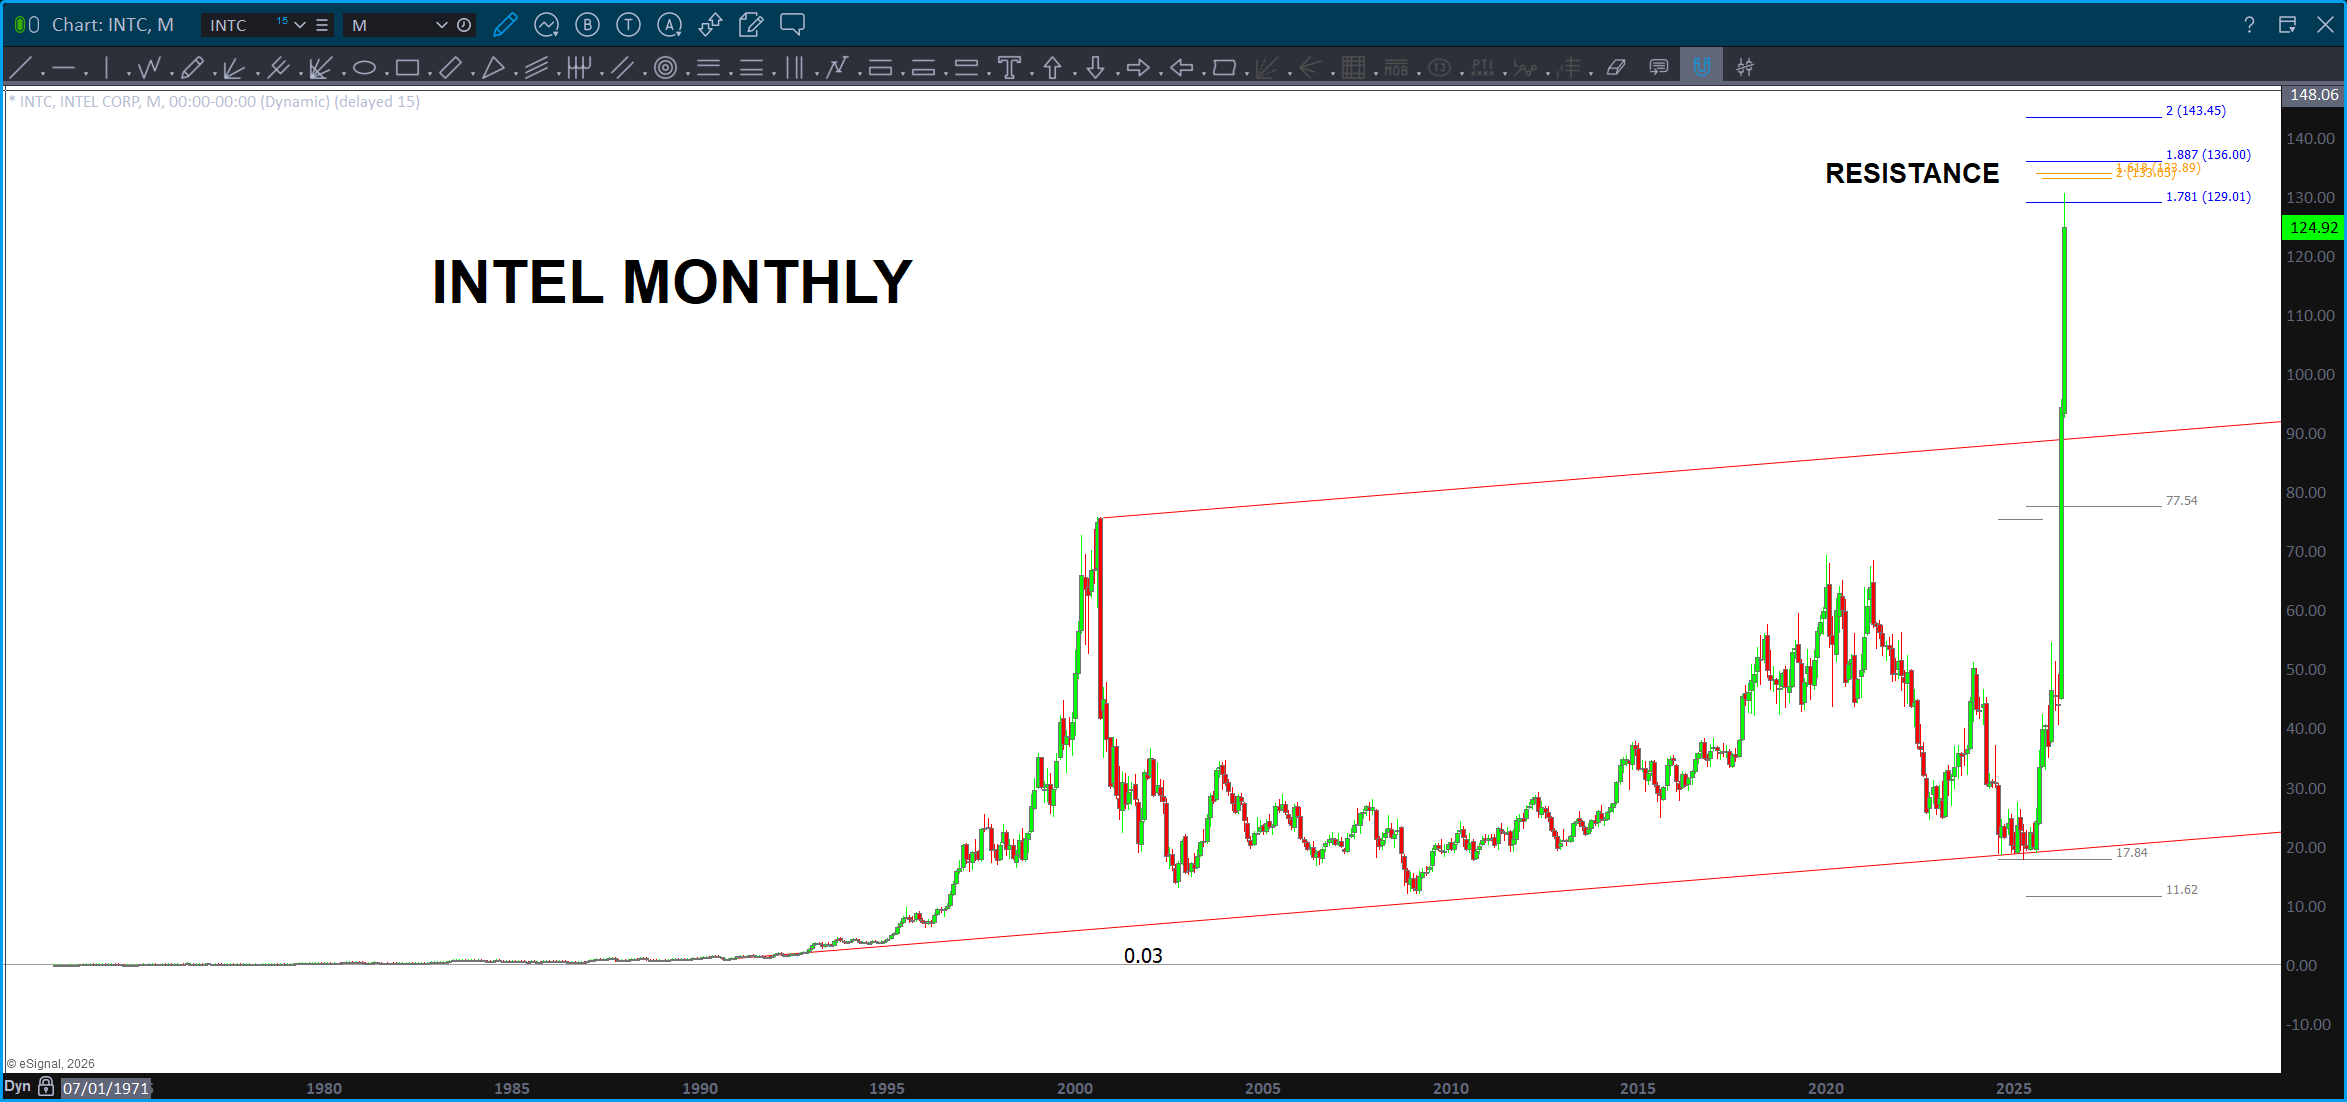
BLUF: If we are up at the end of the week, then I would expect a parabolic blow off. But remember, we are dealing w/ quantum level emotions of the masses. At this level, for every action there is an equal an opposite reaction. So, when something takes off in a parabolic run like INTEL, it will have to be balanced by FEAR. That’s just the way it is folks … it’s physics.
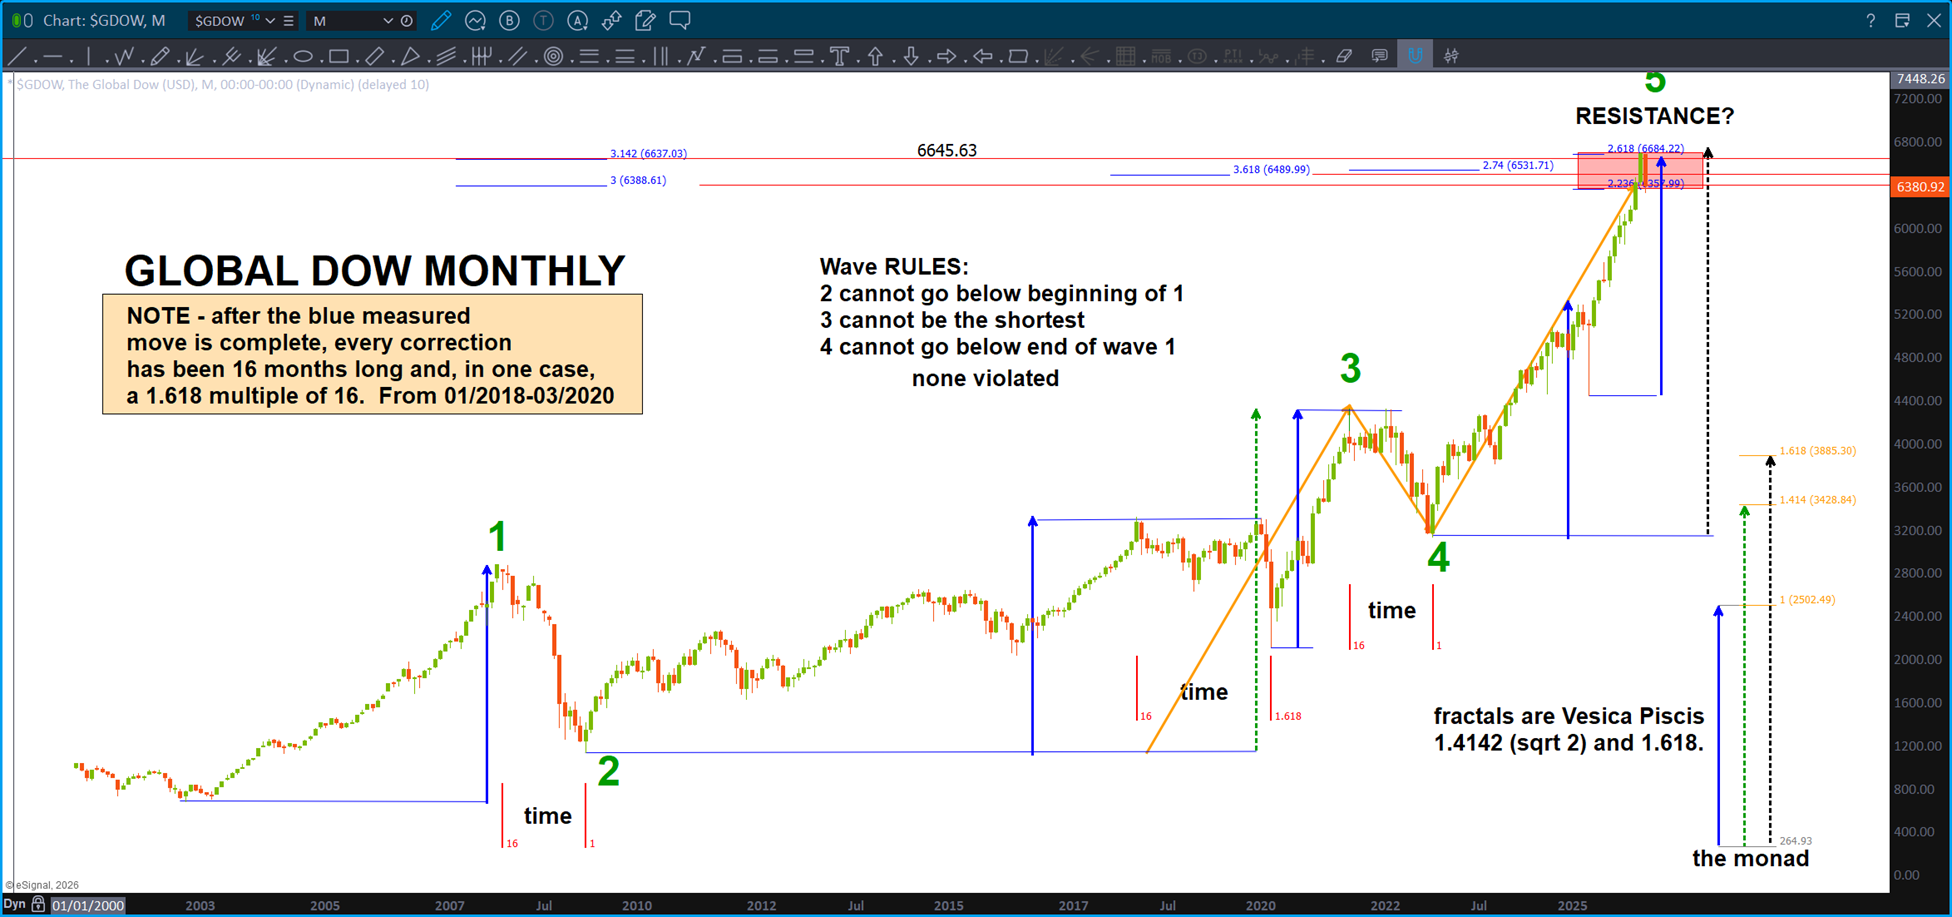
I always start w/ this chart when I talk to Spencer. It’s the Global Dow from 3 months ago … this is a VERY key chart folks. NOTE, every single up move was equal to the BLUE MEASURED MOVE. EVERY SINGLE ONE which was then followed by a correction of – at a minimum – 16 months. Folks, almost a 1.5 year correction.
Well, here we are now … for the first time in 25 years it has blown thru this level. I have put another level above, but it has NEVER done this before. This is strength … we will see what the next target does or doesn’t. I just find it hard to believe (don’t trade what you believe, trade what you see) that after the same measured move we … failed.
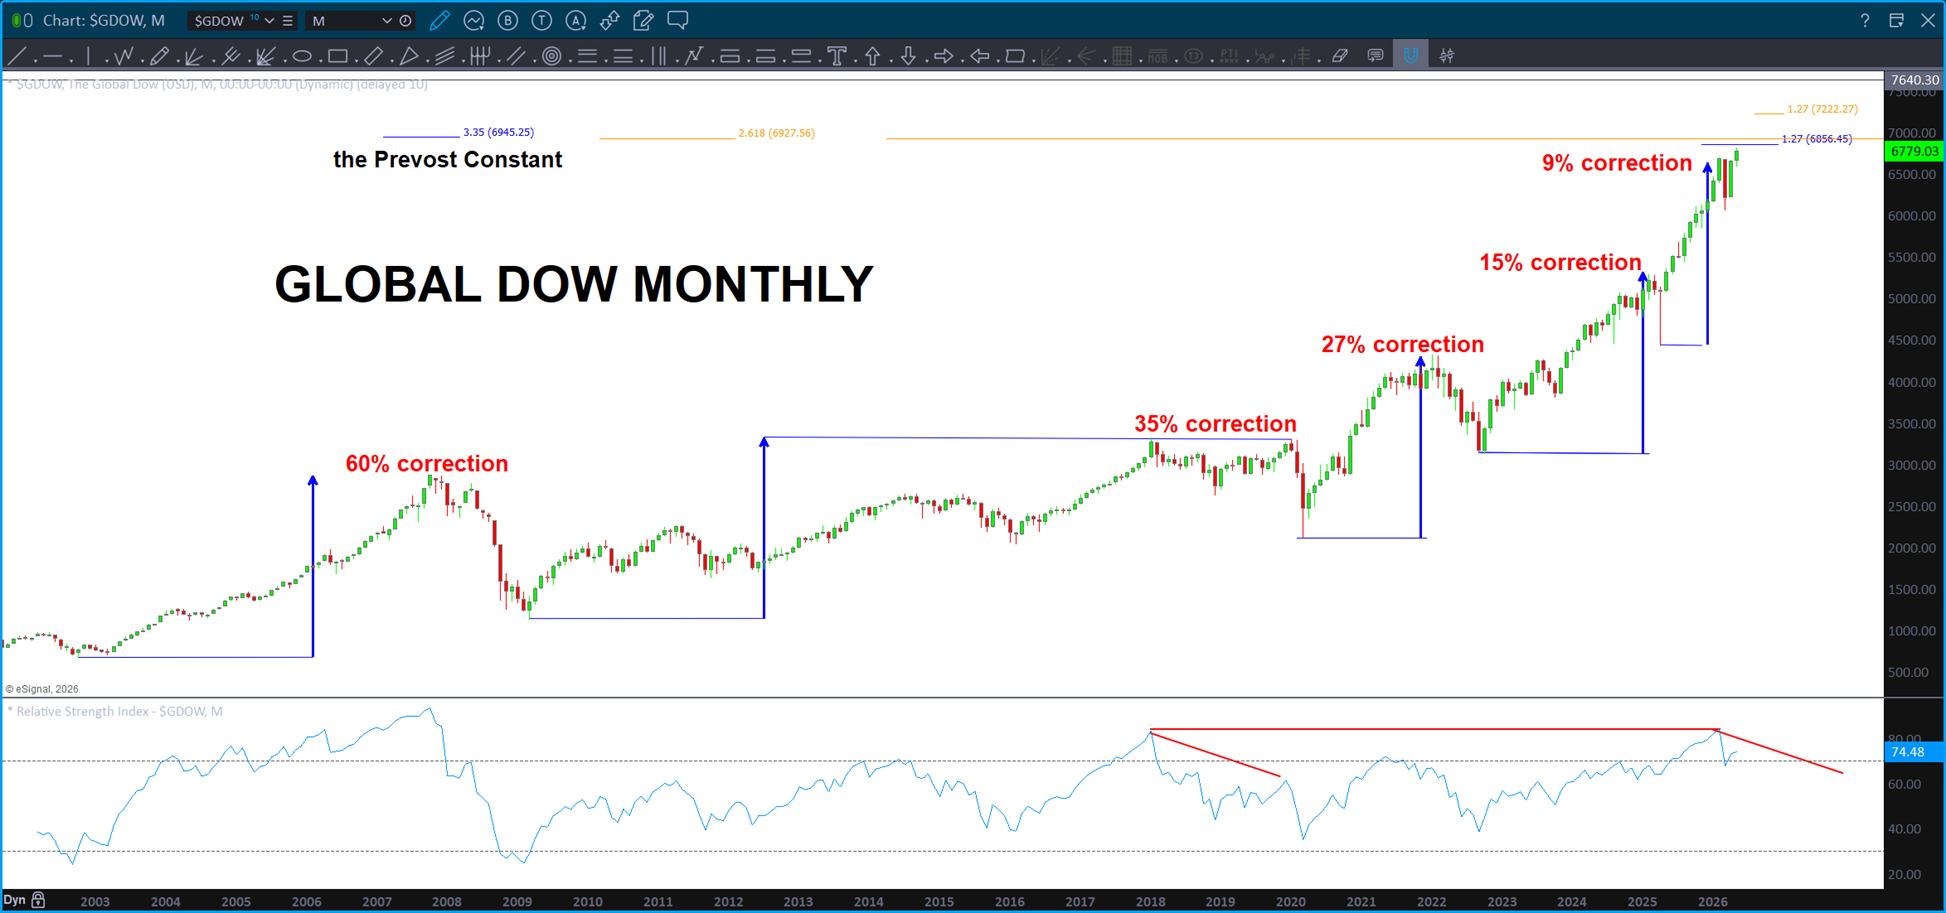
One last, before we leave the Global Dow … same measured move price every time but take note the corrections have become less and less each time. Hmmmmm ….are we about to explode higher? Need to see some failures first …
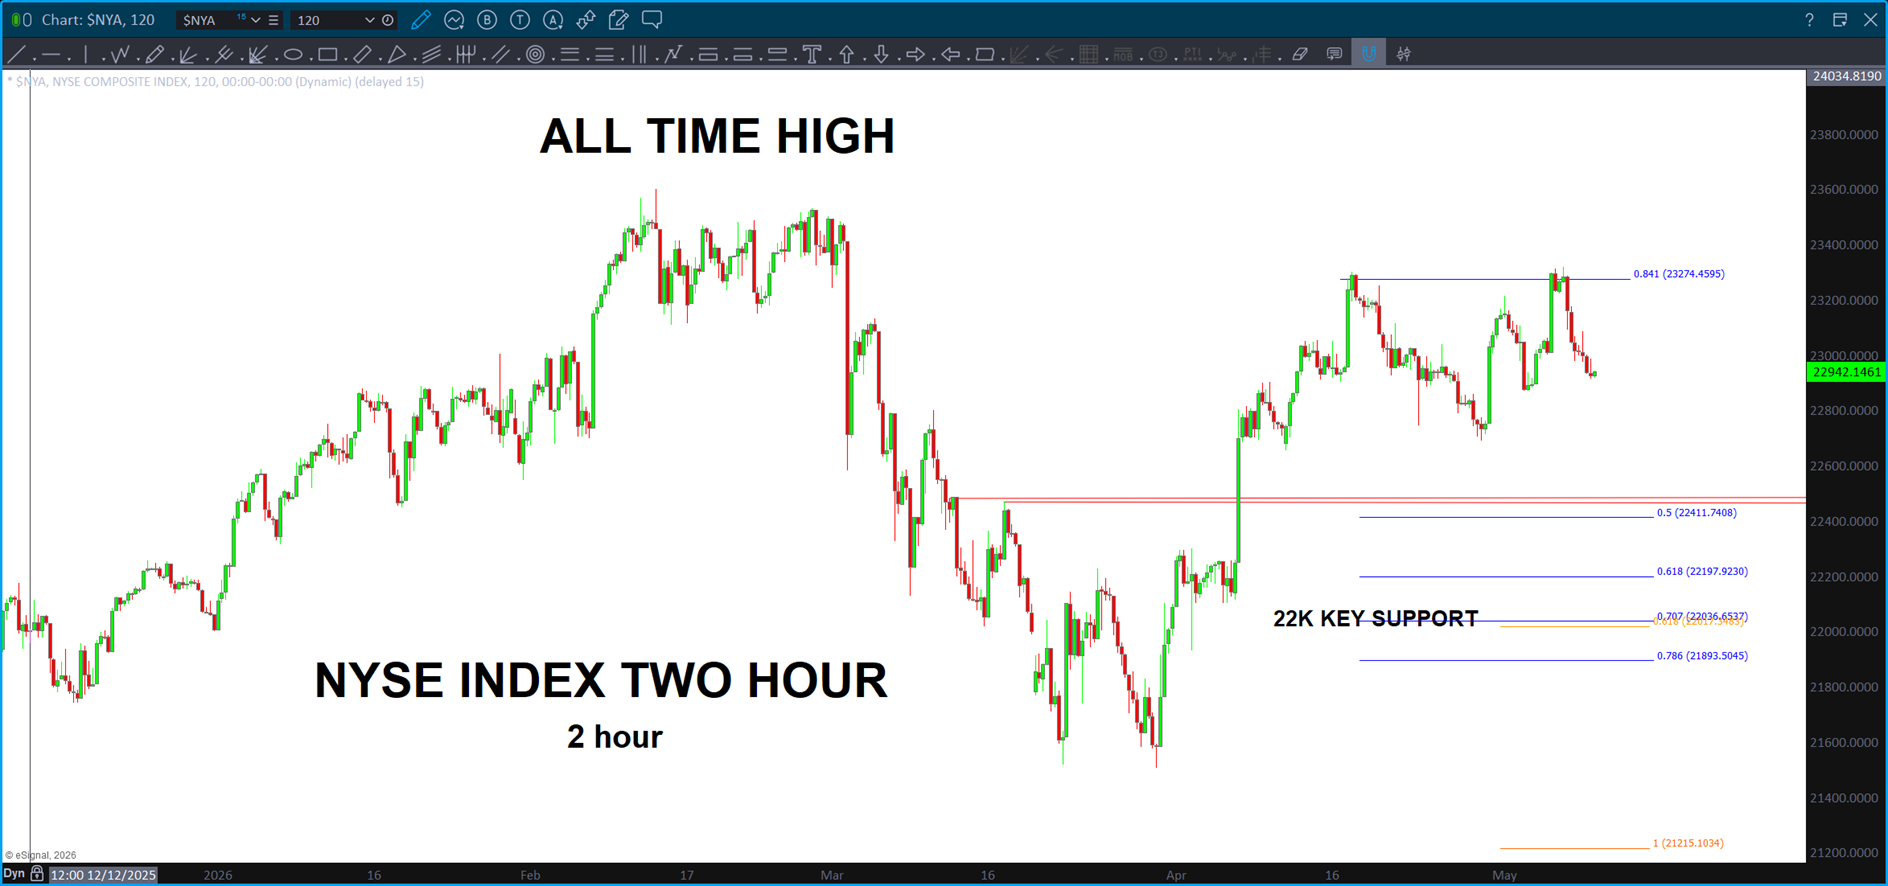
NYA … New York Stock Exchange Index – NO NEW ALL TIME HIGHS.
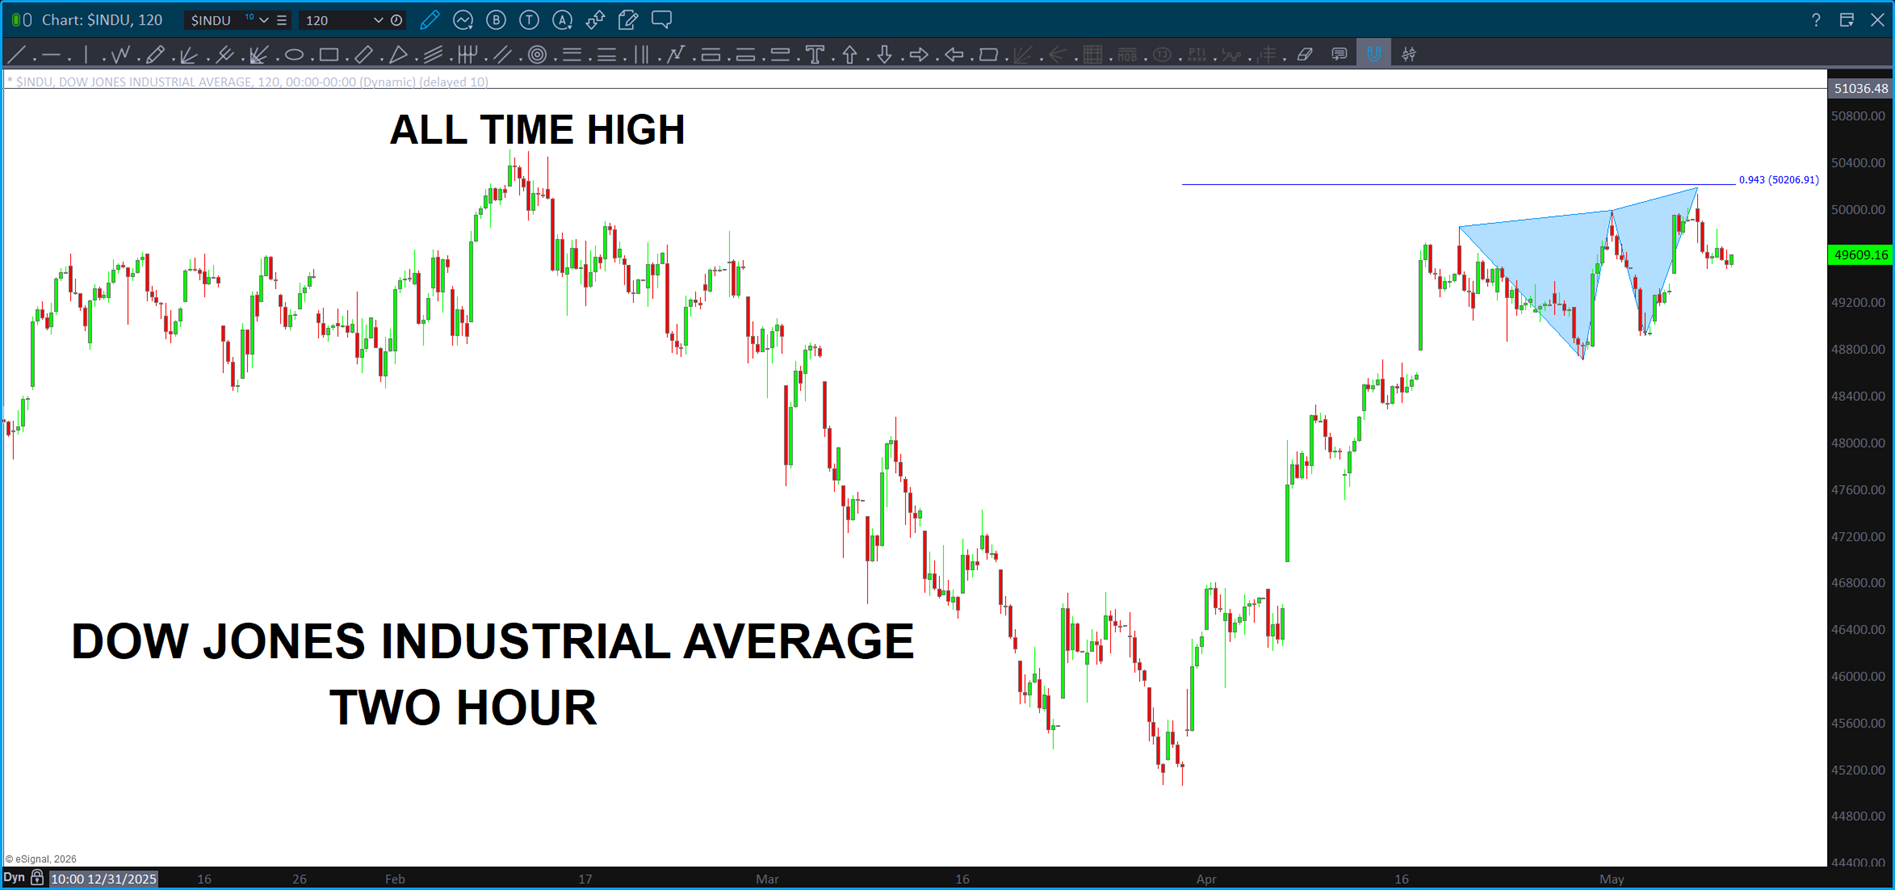
Dow Jones Industrial Average – no new highs.
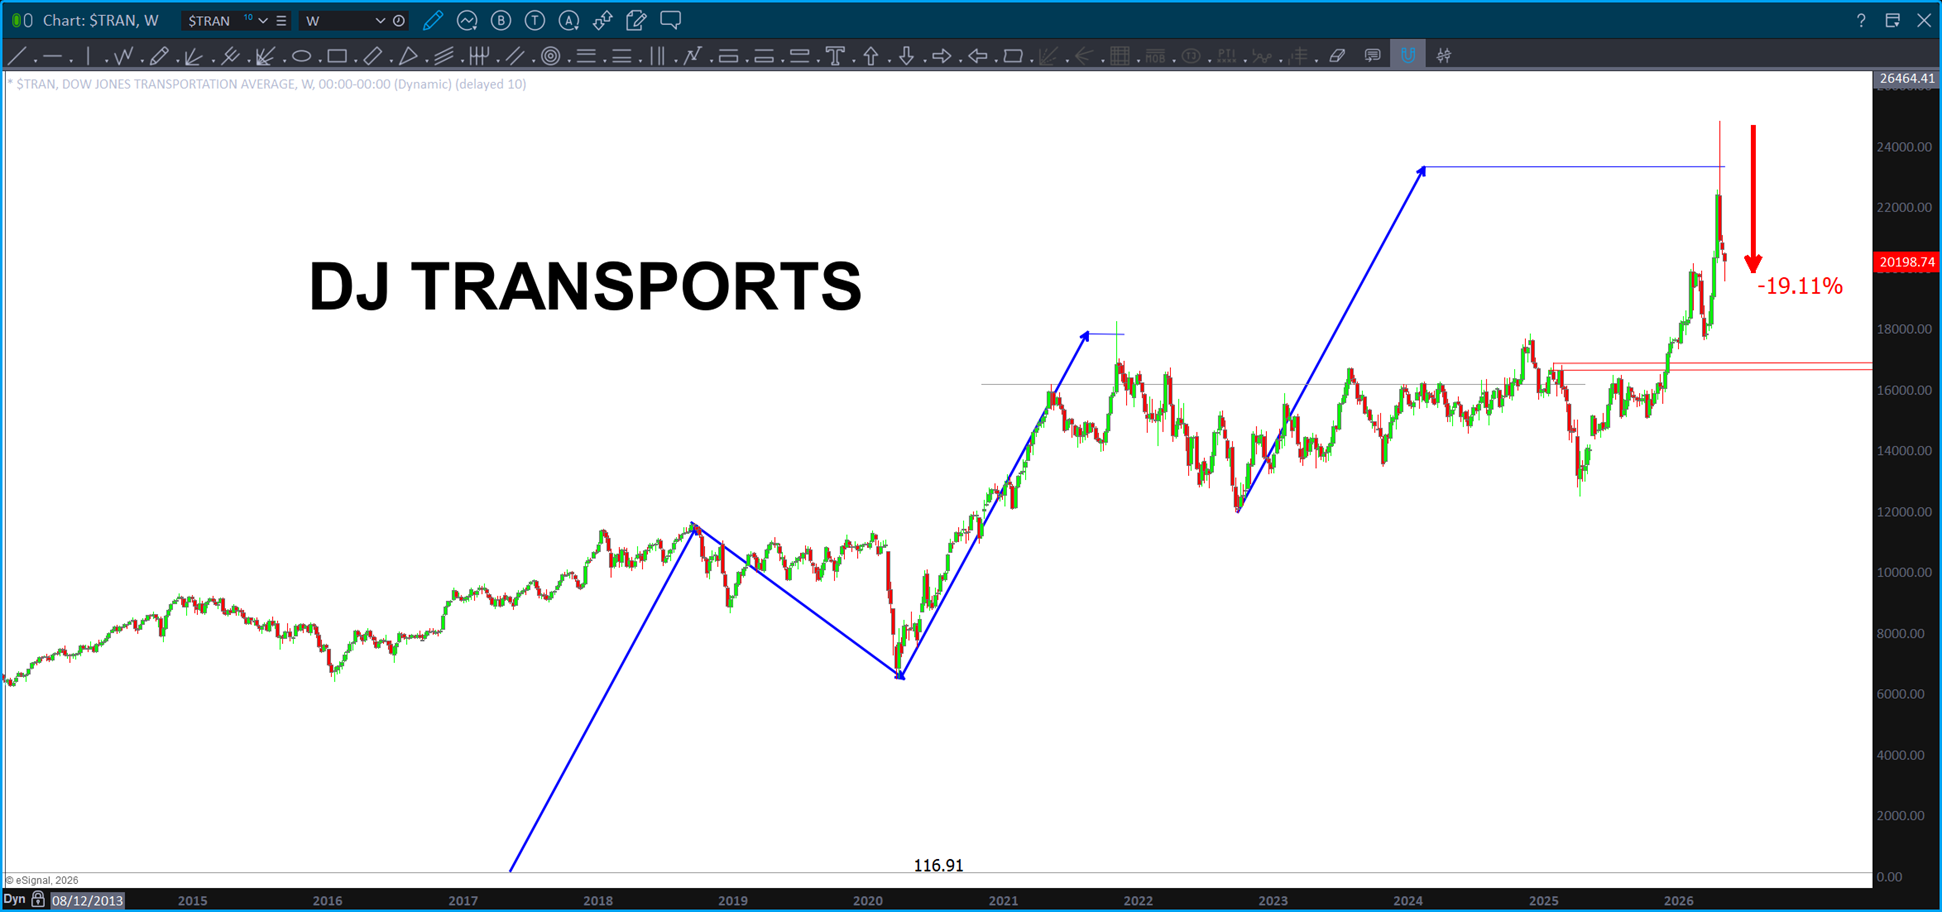
Here’s the Transports (throwing a little Dow Theory at ya) … take note of this longer term weekly chart. The blue measured move projections comes from the all time low. Then, the next two blue measured moves nagged the highs. Transports are down almost 20 percent from the high. Hmmmmm …
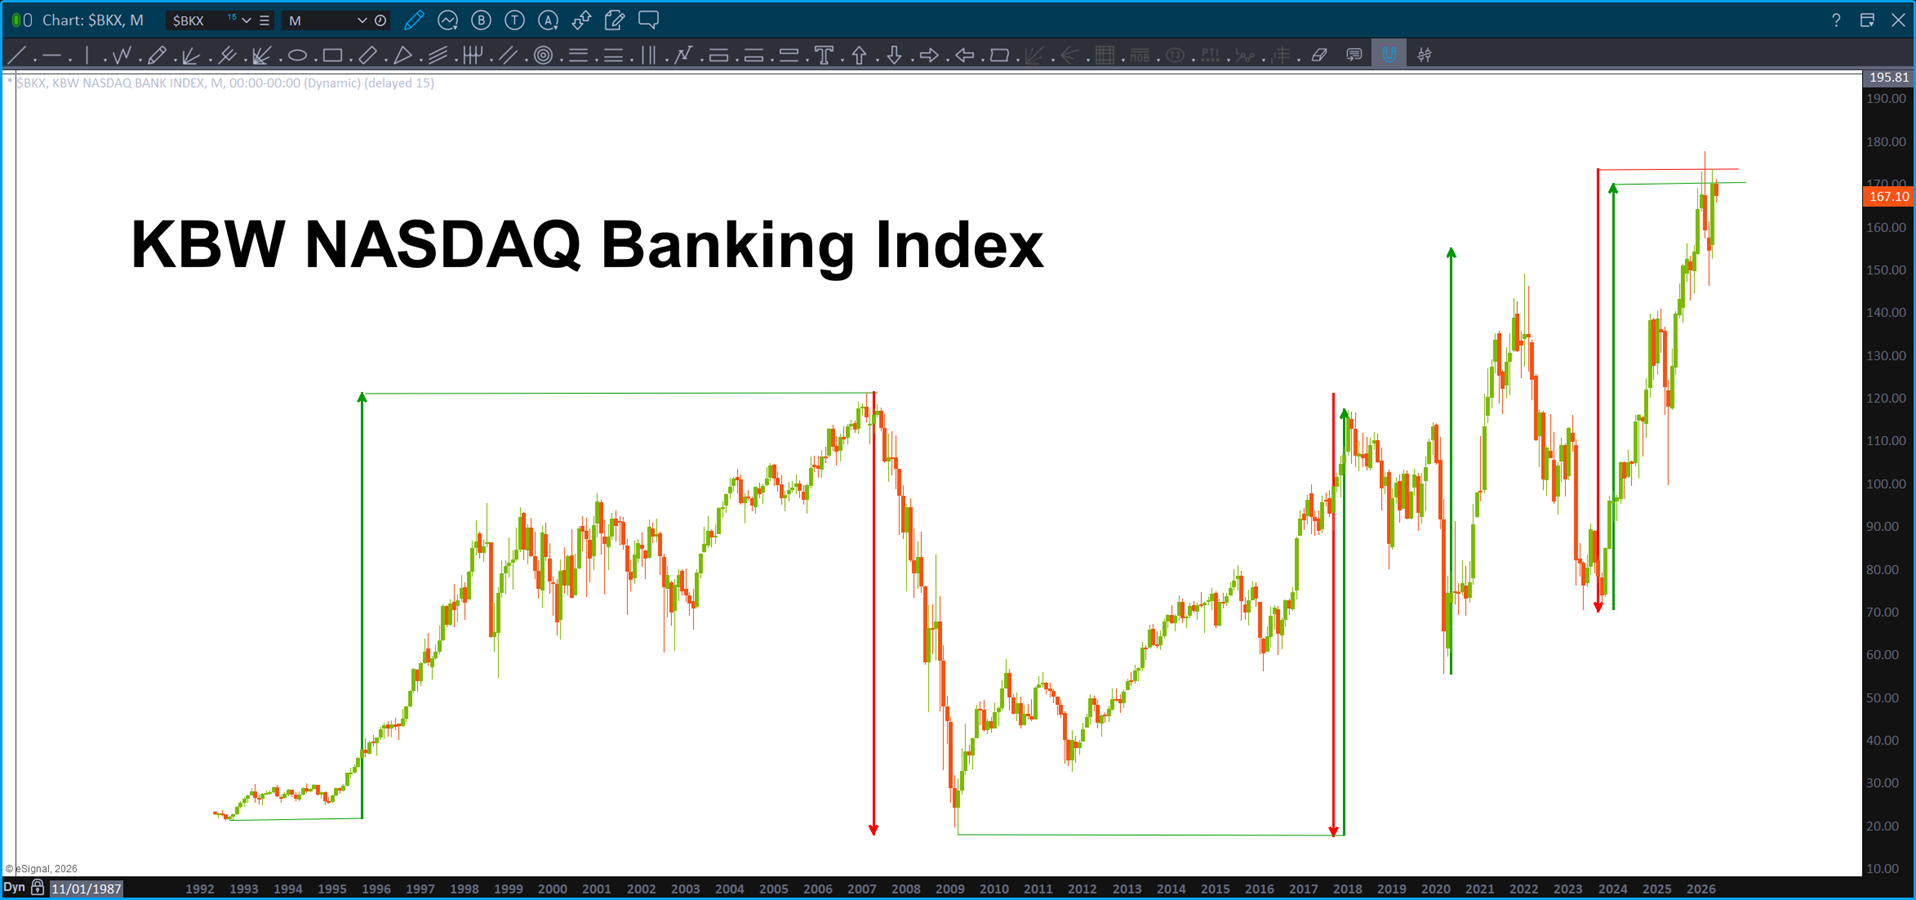
We watch the Banks … you’ve seen me type this and speak this before “just watch the banks .. they lead us up and they lead us down.” Well, they have completed their bullish measured moves and each time after that, the banks/financials corrected and the entire market followed. Here is the KBW NASDAQ Banking Index .. no new highs and largest measured moves in the history of this index: complete.
If you have followed me for a while, then you know I love to check out the patterns and measured moves on the XLP/ NYA ratio. Folks, remember, the low in the ratio was a perfect LOG price and time projection. Here’s the latest kicker … it’s completing the same exact pattern as it did in 2007. Yeah, no kidding check it out:
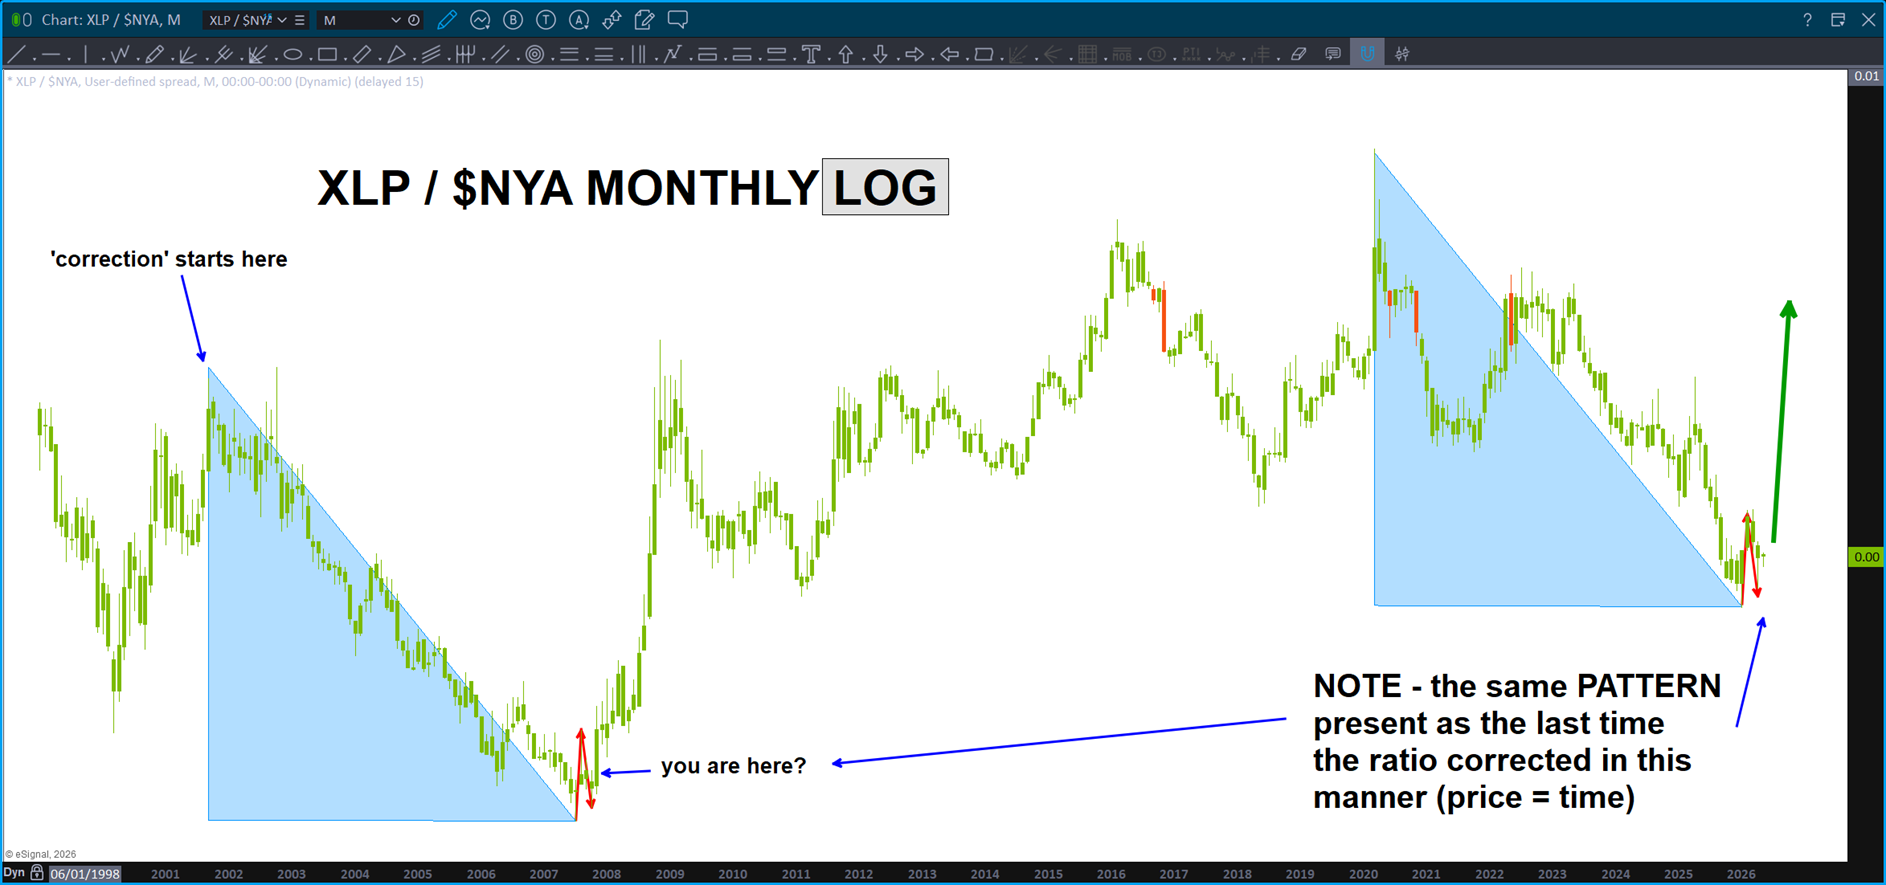
IF we were tremendously bullish, then I would expect this ratio to be falling pretty nicely … it’s making higher lows. And, the red moves up and down are exactly the same. Probability would tell us that the next move is higher in the ratio which tells us – weakness in stocks. 2007 weakness…? I have no clue but ‘should’ be some resistance …
Which leads us to the S&P 500 – folks, it’s simply finishing the next measured move:
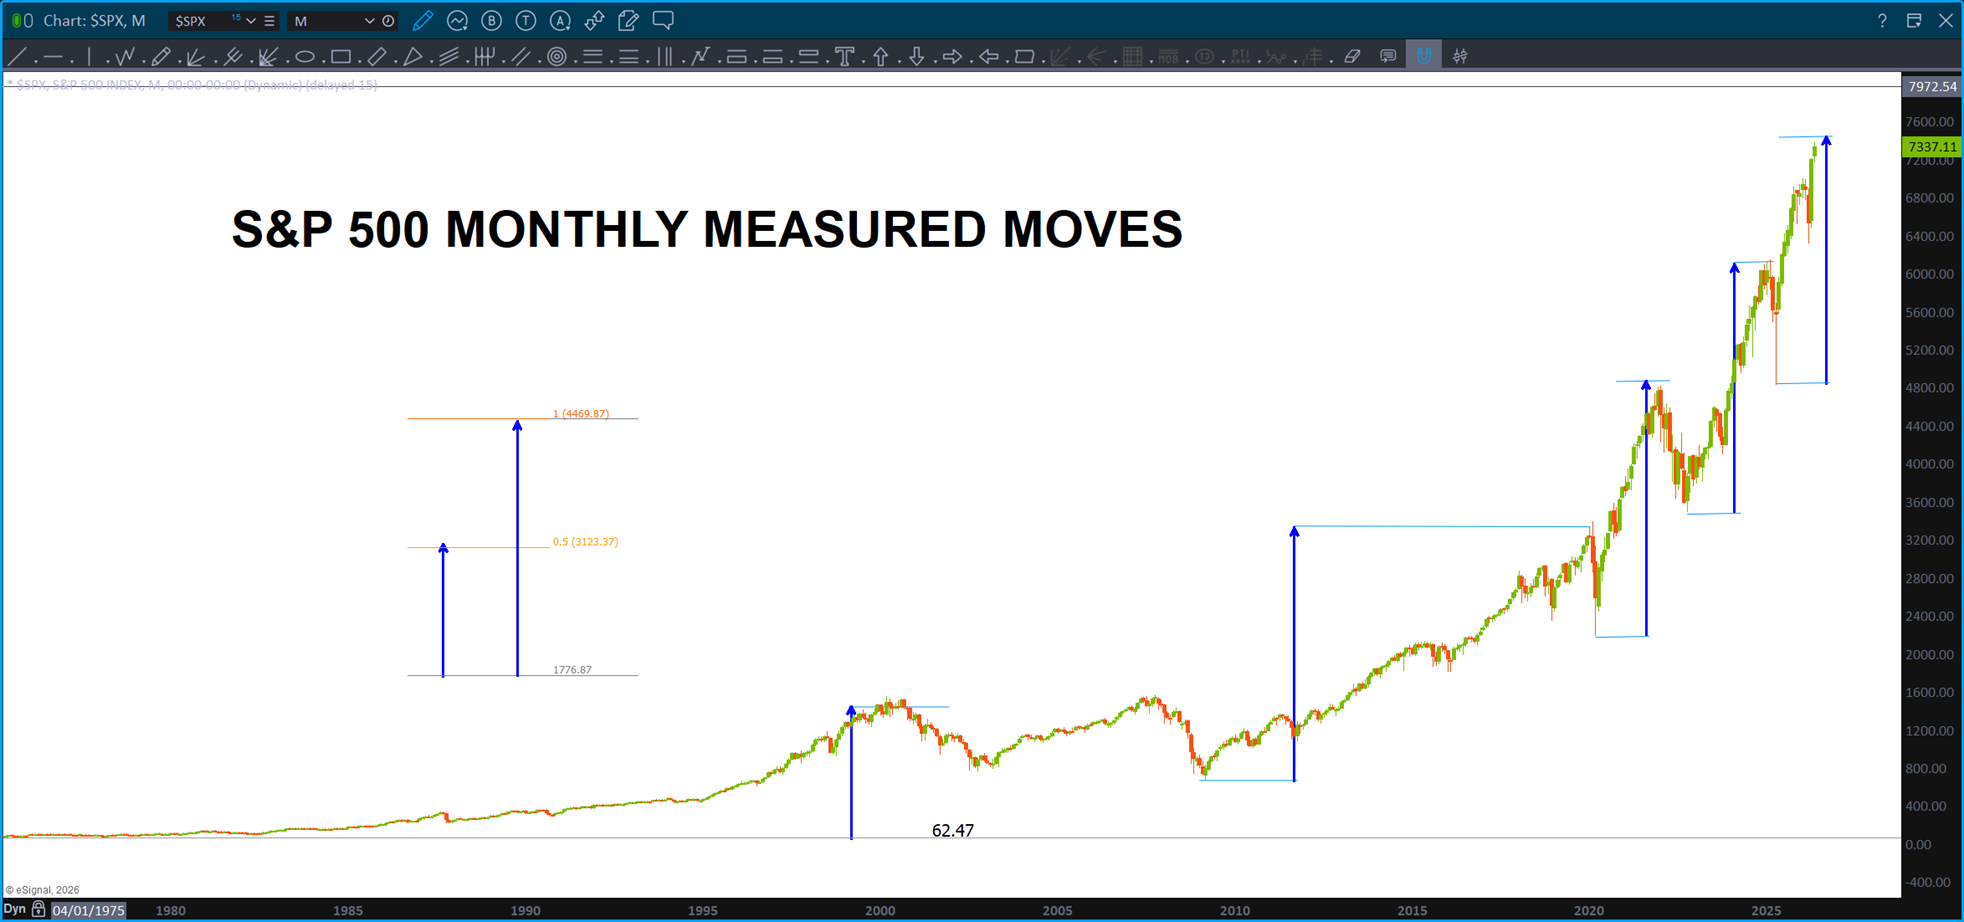
Since the low in 2007 … every major move higher has run into significant resistance when completing a price move equal to the blue measured move. The move from the all time low to the high in 2000 … 0.618 of the blue measured move (or the monad – I’ll stop there)
How about the Semi-conductors. Ding Ding measured move arriving. Note, as the buying intensifies the measured moves expand from the initial monad, moving to the next geometric nodal intersection in the platonic space which is naturally corresponding to the gold mean 1.618 and music. Tilt? What …
The frequency of a string is proportional to the square root of its tension, inversely proportional to its length, and inversely proportional to the square root of its linear mass density (mass per unit length).
So, square roots and inverses have a direct relationship to the vibration or frequency of a string … square root of 1.618 = 1.27.
The Golden Mean and music … note, the measured move of the DJ Transports has expanded 1.27 of the Monad. Just like everything in creation vibrates to create geometries found w/in the platonic space attractors, the same thing happens w/in the vibratory energy of fear and greed of the masses. It’s harmonic and fractal based on the golden mean and sacred geometry. It has to be …
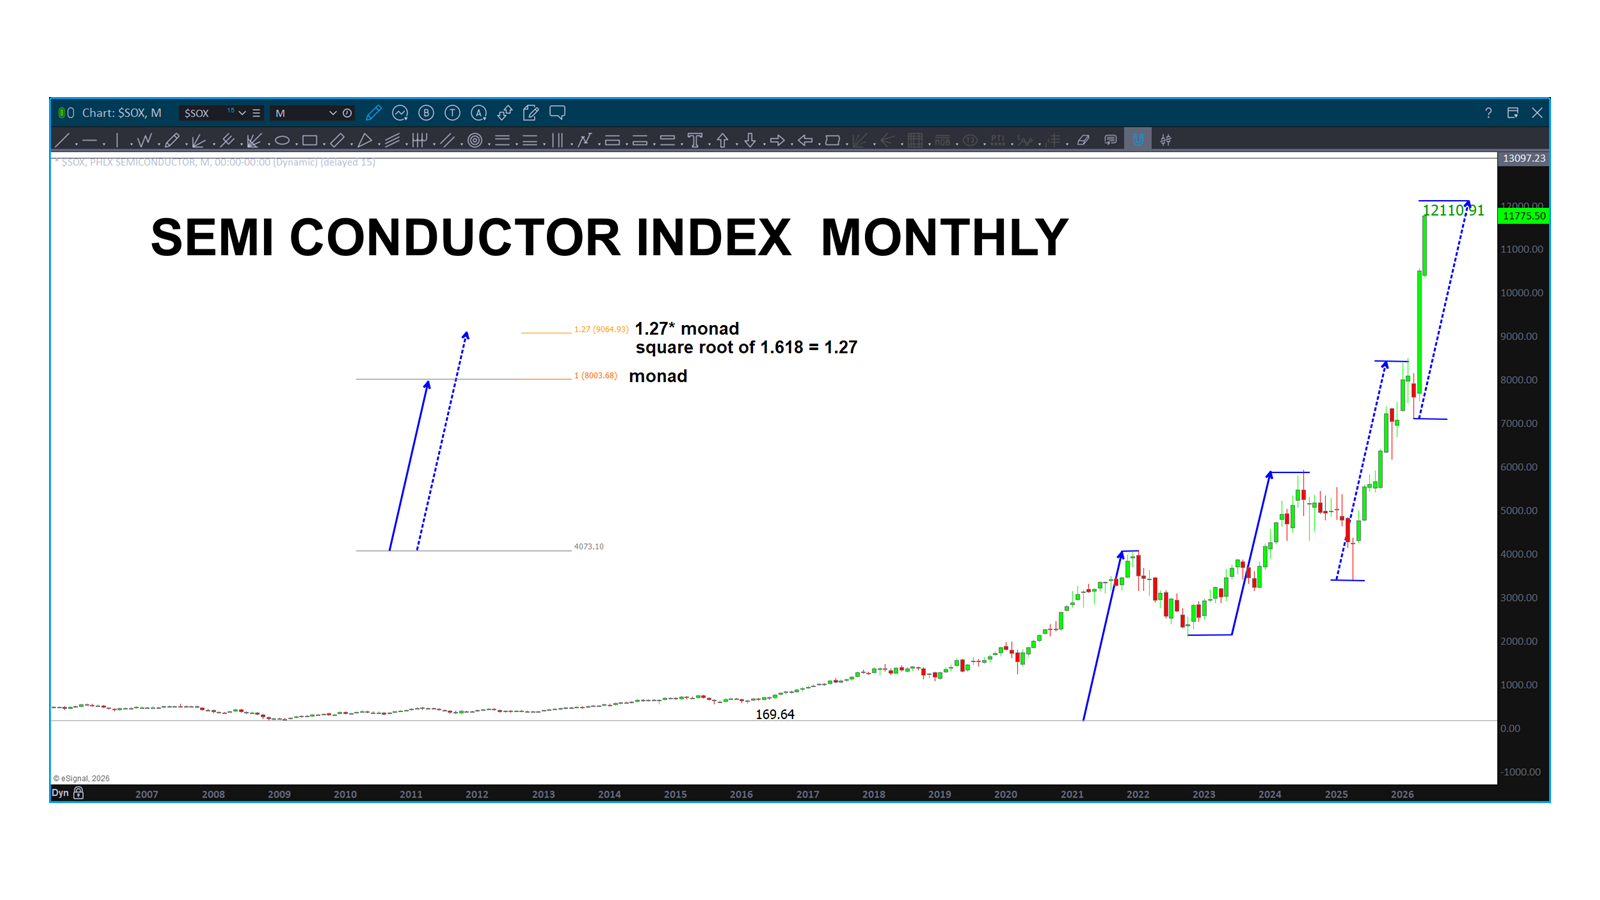
Looks like 12, 110 ‘ish’ should offer resistance …
Last, the NASDAQ … ABCD from the all time low.
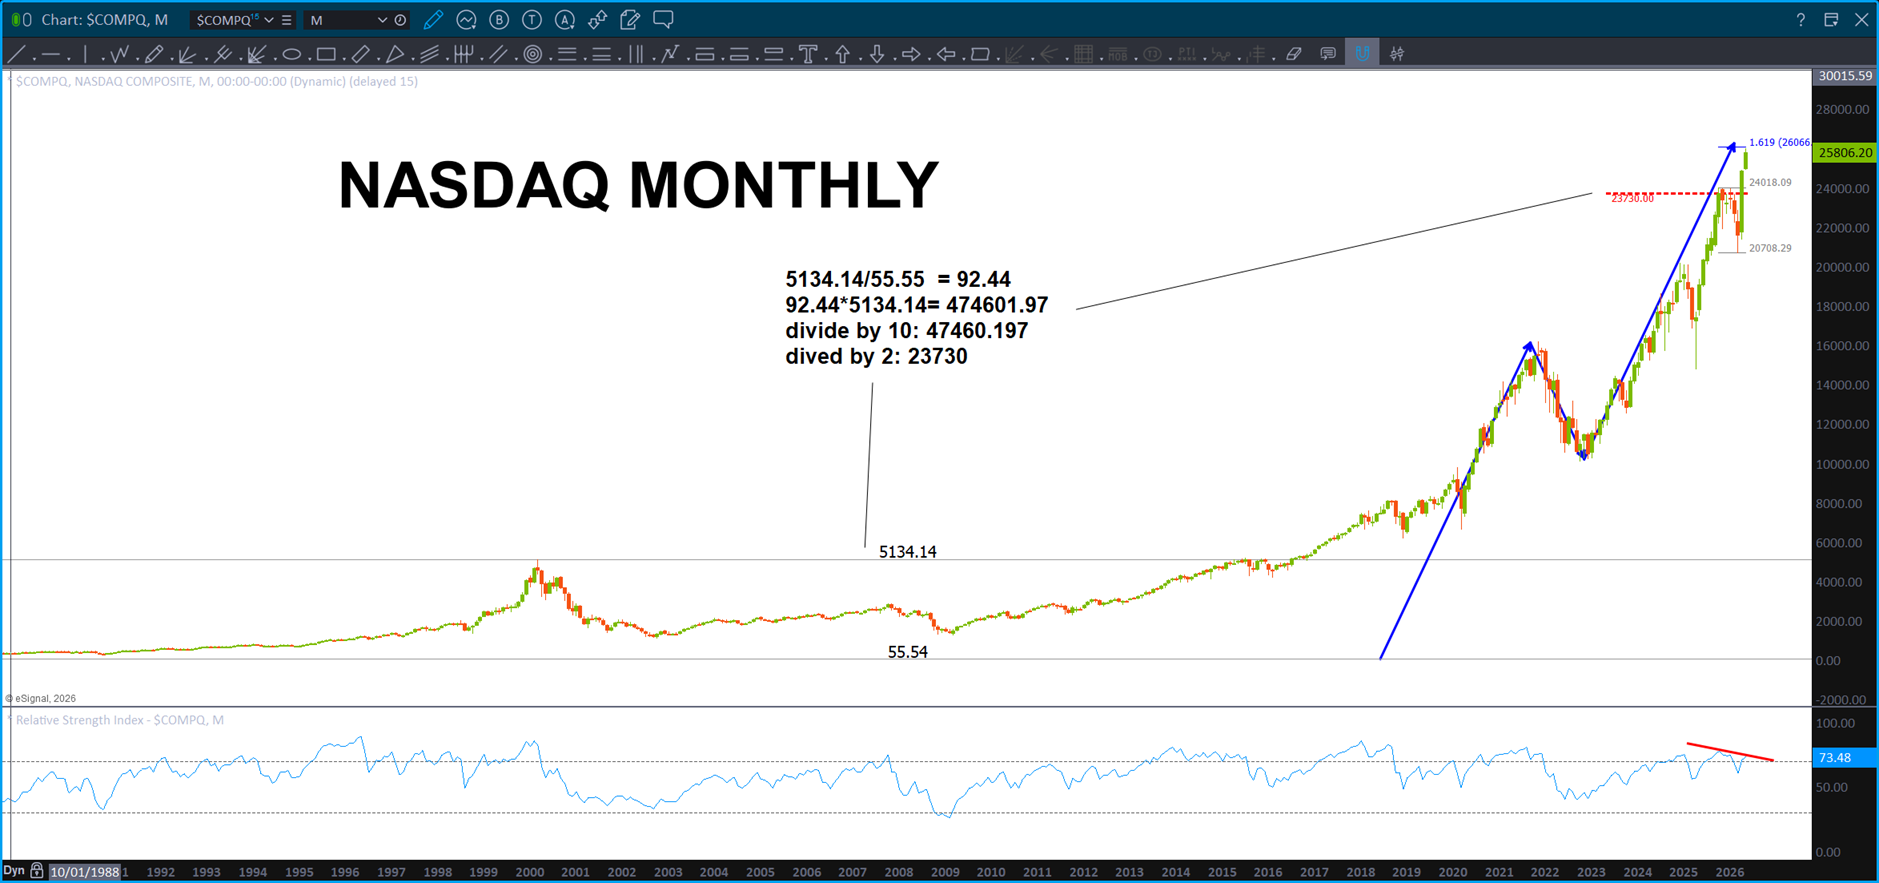
Market has hit resistance and corrects – looking for a double digit CORRECTION for now. If aggressive WAIT fora weekly signal reversal candle or weekly bearish engulfing panel to short.
If long and nicely long, stay long but keep in mind that we have hit and are hitting some MAJOR targets so … put a mental stop in place. I know we all expect and think the market can never go down and, if it does, I’ll just ride it out might not be the best position to take if things REALLY start selling off. So … I’ll be looking to BUY at a MONTHLY measured move level. Why? That is the predominant cycle level we are hitting right now. (hint hint, if you haven’t figure it out, the measured move is ultimately a ‘cycle’ finder because there ARE harmonic cycles present at the end of these longer term month measured moves – hence monthly cycles. 🙂
Market has hit resistance, doesn’t care and parabolically explodes higher. Completely doable … why? Where else is the WORLD going to go … look outside our borders and things are getting quite messy in Asia and Europe. Capital needs to flow somewhere … hello USA.
Here’s the last slide of my deck. I bet he doesn’t show it … I am SO thankful for my time w/ Mr. Alan W. Green. Everything occurring makes sense …he is the one who has opened my eyes to the script being played out right in front of us …
The amazing irony as the USA approaches its 250th birthday and the exact 400 year anniversary of the publishing of The New Atlantis by John Dee. (John Dee being the potential author of Shakespeare and called himself 007 – not kidding) He demanded, before he died, that it be published on July 4th, 1626. 400 years ago … 400 is the number w/ regards to size and distances of the sun and moon which, ultimately, signify the Divine Masculine and the Divine Feminine and that is WHY they are able to make an eclipse and become ONE.
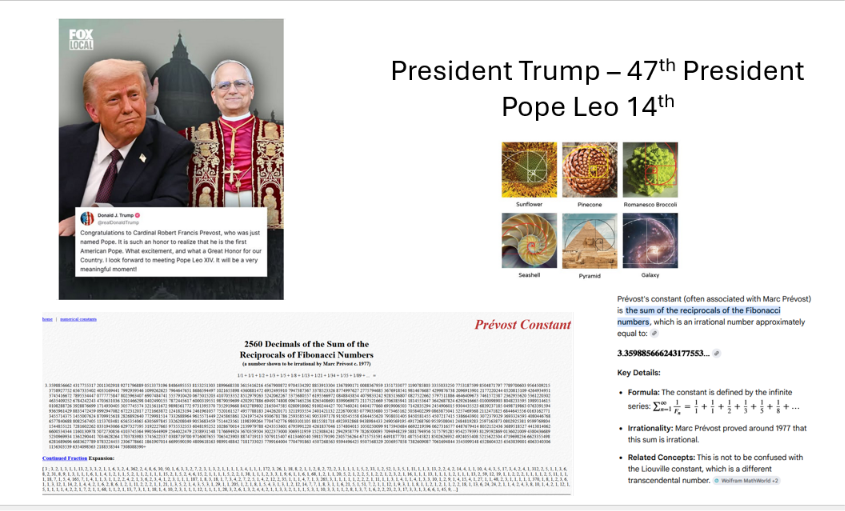
Anyway … what are the chances that the 47th President (Iran has been at war for us for how man years? Oh yeah, that is righ – 47! When was the Roswell UFO crash? July 4th, 1947. Look it up … ) and the current Pope are not only both Americans but their numbers are important. Tilt, again?
Sure, divide 47/14 … you get the Prevost Constant. Pope Leo 14th is … Robert Edward Prevost.
When the 47th President and the 14th Pope emerged simultaneously, their ordinal positions divided to trace the Prévost Constant — the infinite sum of all Fibonacci reciprocals, a number that encodes the totality of nature’s own sequence. In this, the universe whispers that these two men do not merely hold office, but occupy resonant positions in a deeper mathematical order, their tension and opposition the living expression of growth against convergence, expansion against wholeness.