XLE ratio analysis worked well, this time
1/23/2016 – wanted to show these charts again. they are all ratio analysis of XLE (energy) versus the major components of the S&P. Ratio analysis w/ pattern recognition is very powerful.
all of these patterns hit, oil moved down to the 25-27 area, the OSX/NYA ratio worked and Oil popped and the Loonie got 500+ pips in two days.
not sure, honestly, if we have a trend change BUT it does appear that the energy sector has a trade worth bottom in place.
Bart
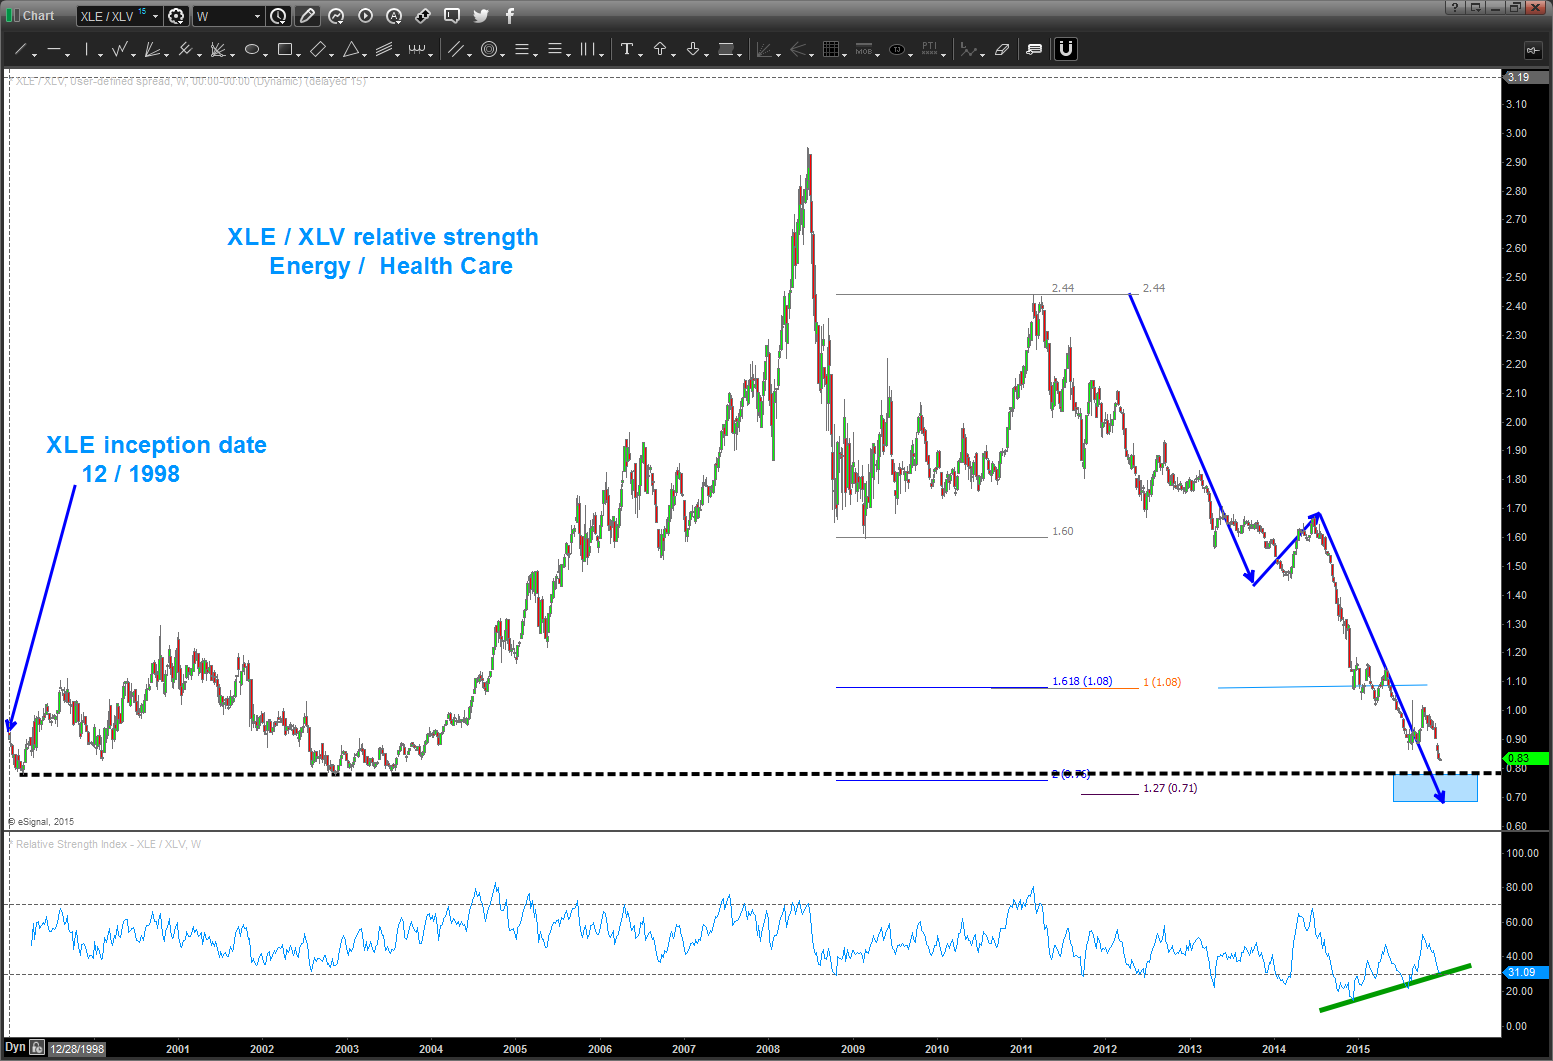
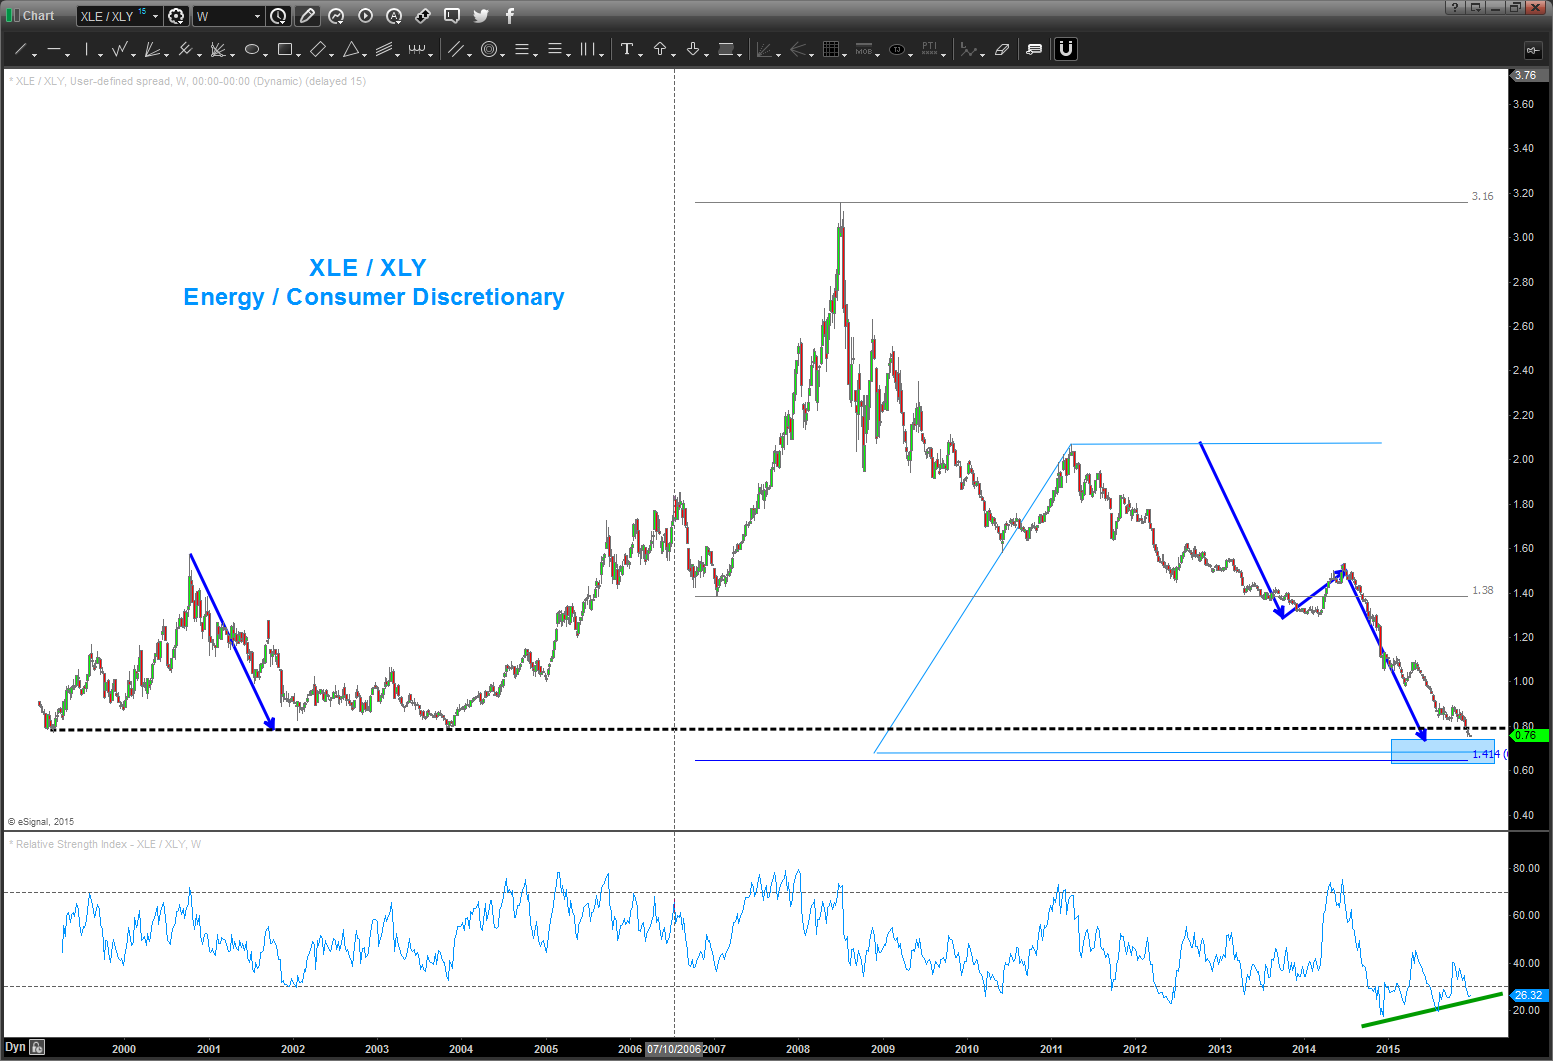
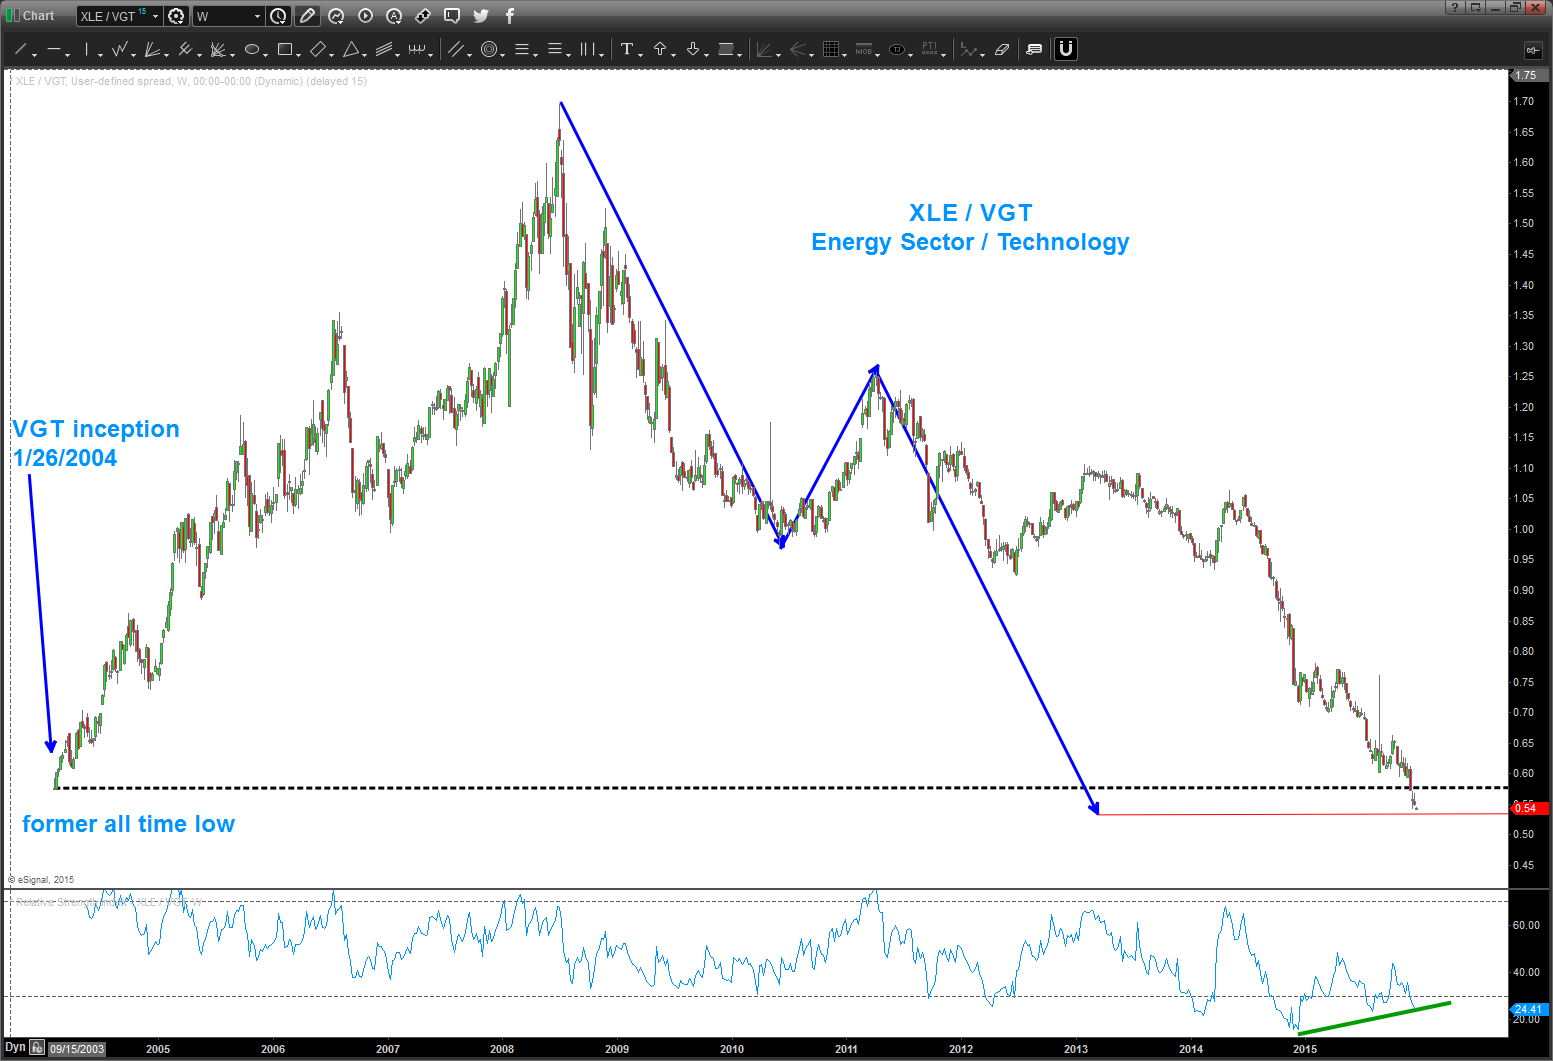
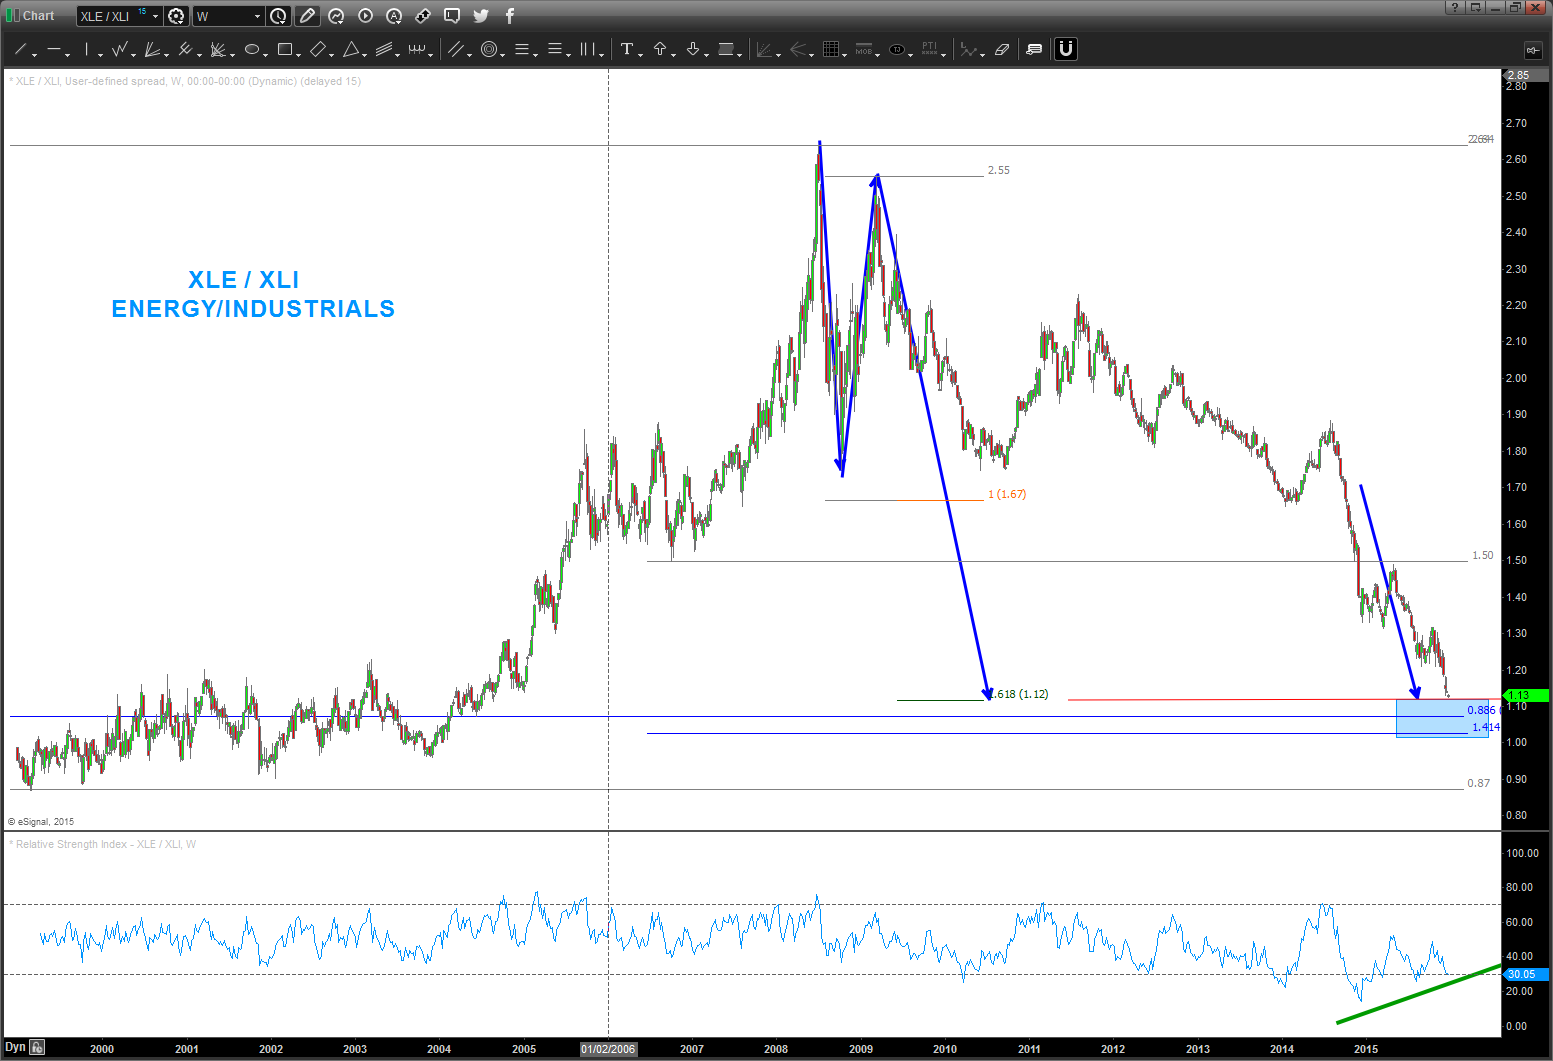
am looking at the relative strength of the XLE versus components of the S&P that make up more than 10% of the S&P.
sure looks like the RELATIVE STRENGTH of XLE is about to start outperforming the larger components of the S&P based on patterns.
of course, the patterns can always fail and the drift of the energy sector into oblivion continues .. patterns suggest a pause, bounce or strong up move coming.
means to keep on the lookout for that LOONIE buy ….