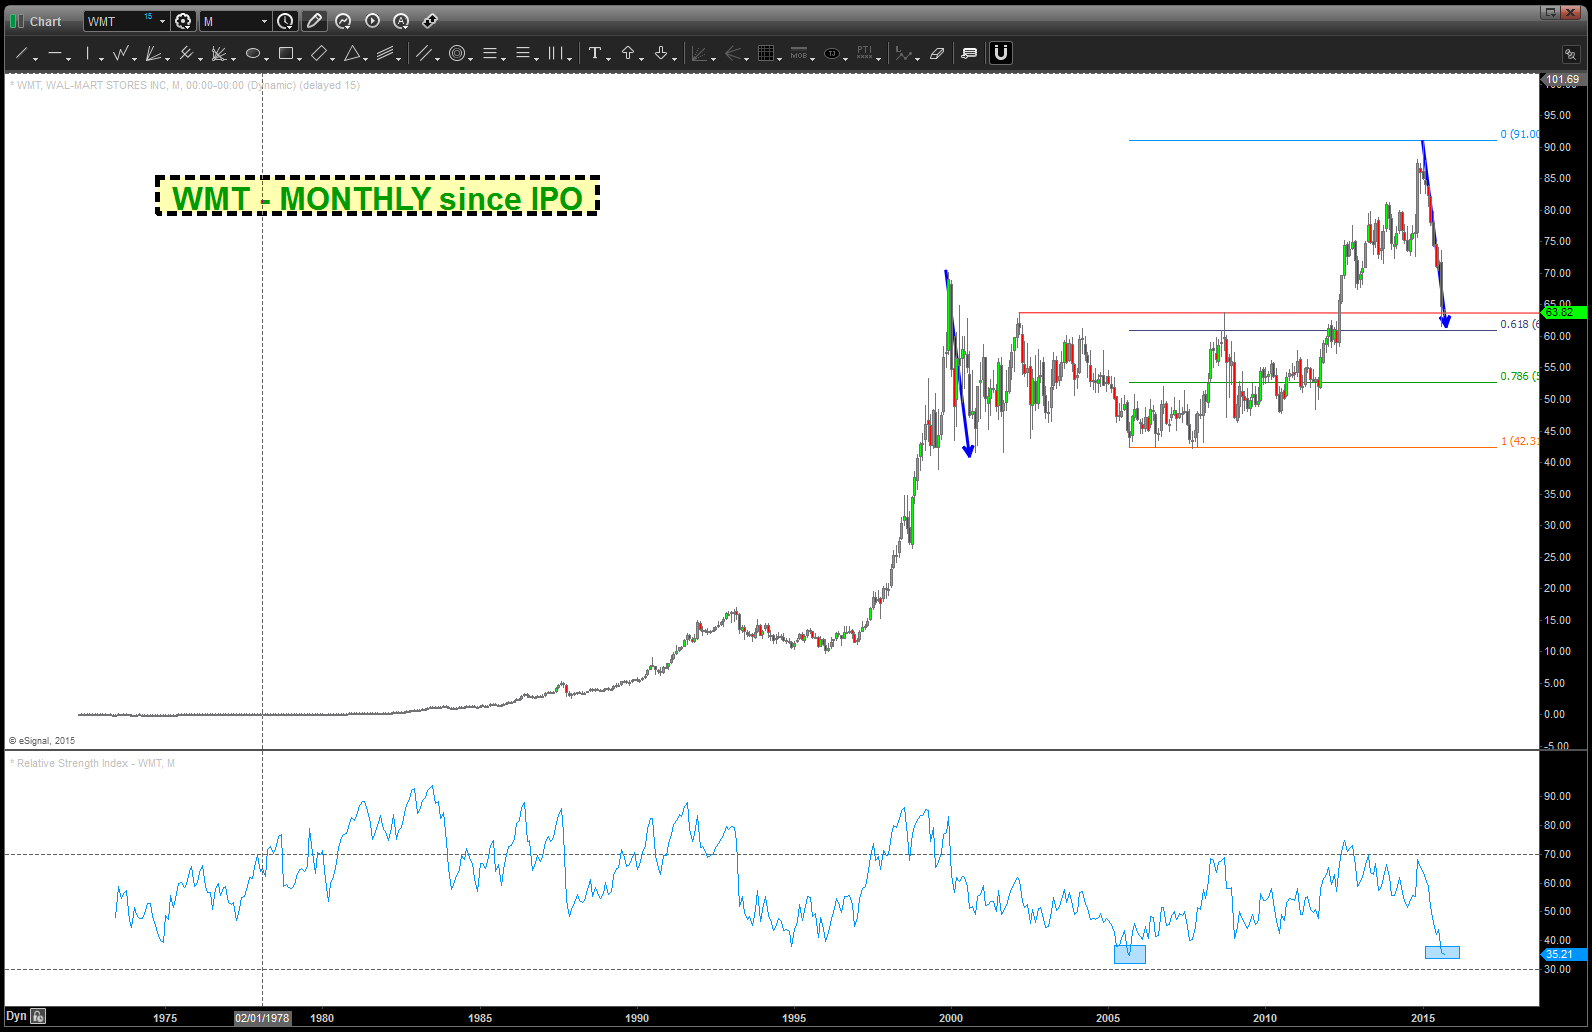
WMT set up …slow down and digest the logic… this is important, I think
BUY WMT (?)
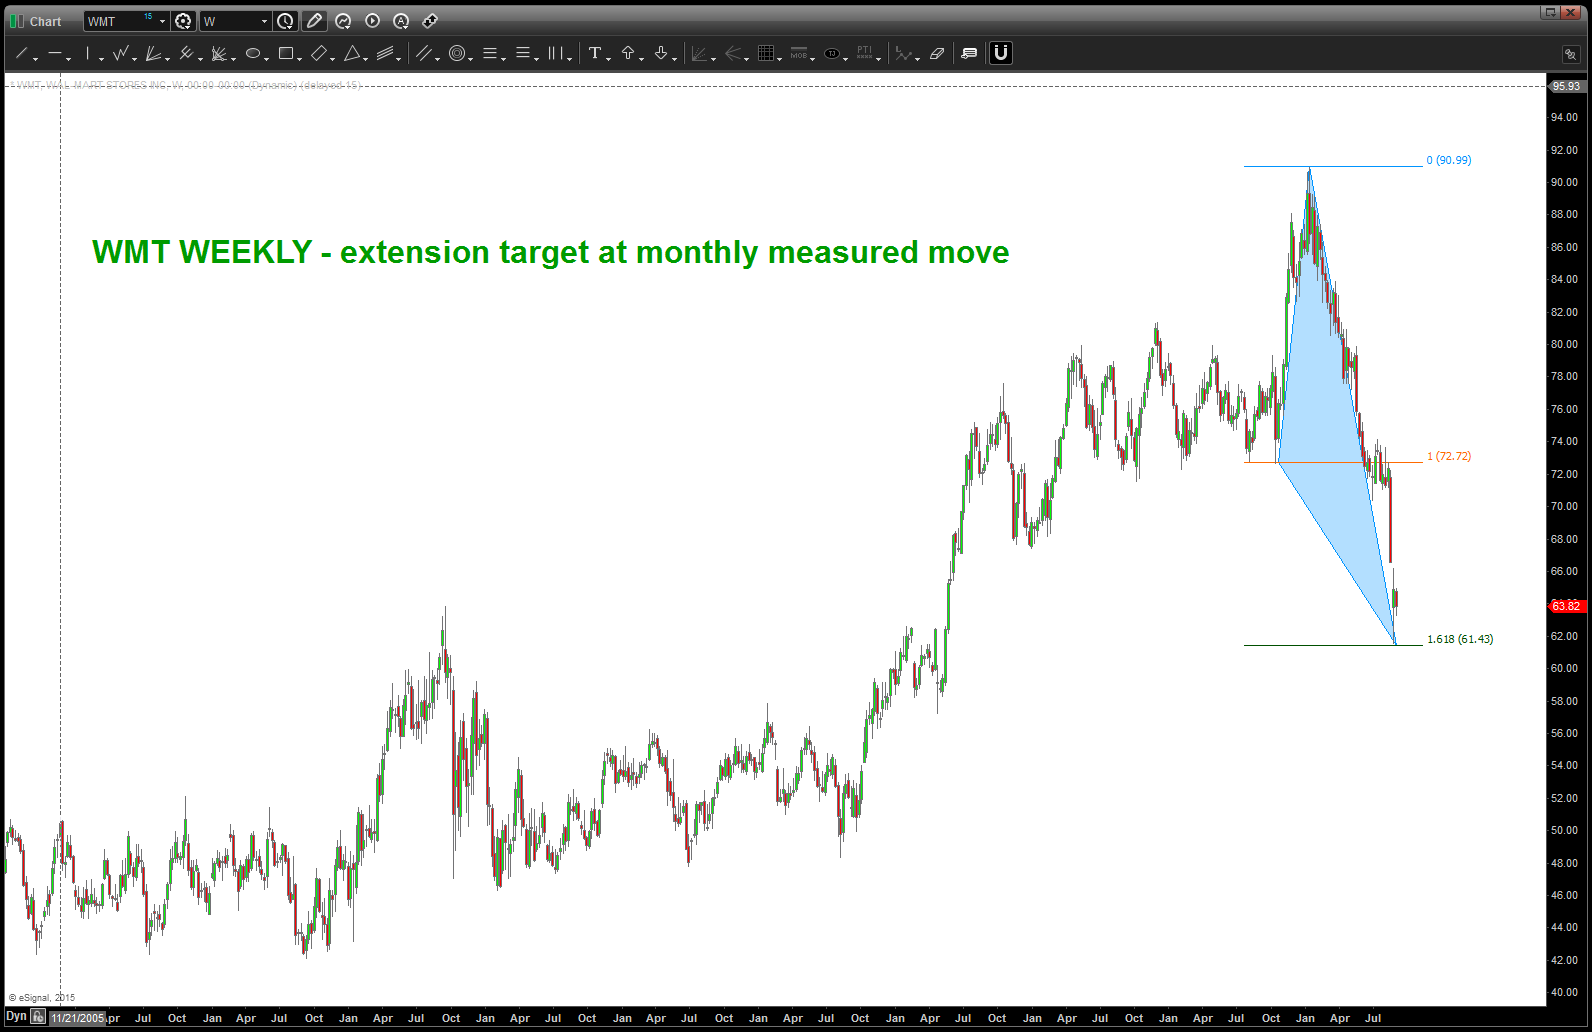
- note – measured move ( in price and time), polarity and an extension target ….
- needs to stop here and start back up, IMHO.
- we are also sitting on a former resistance zone of 15 years folks .. if break down from here – we’ll call that a “what’s the fighter thinking” moment …
- here’s the charts:
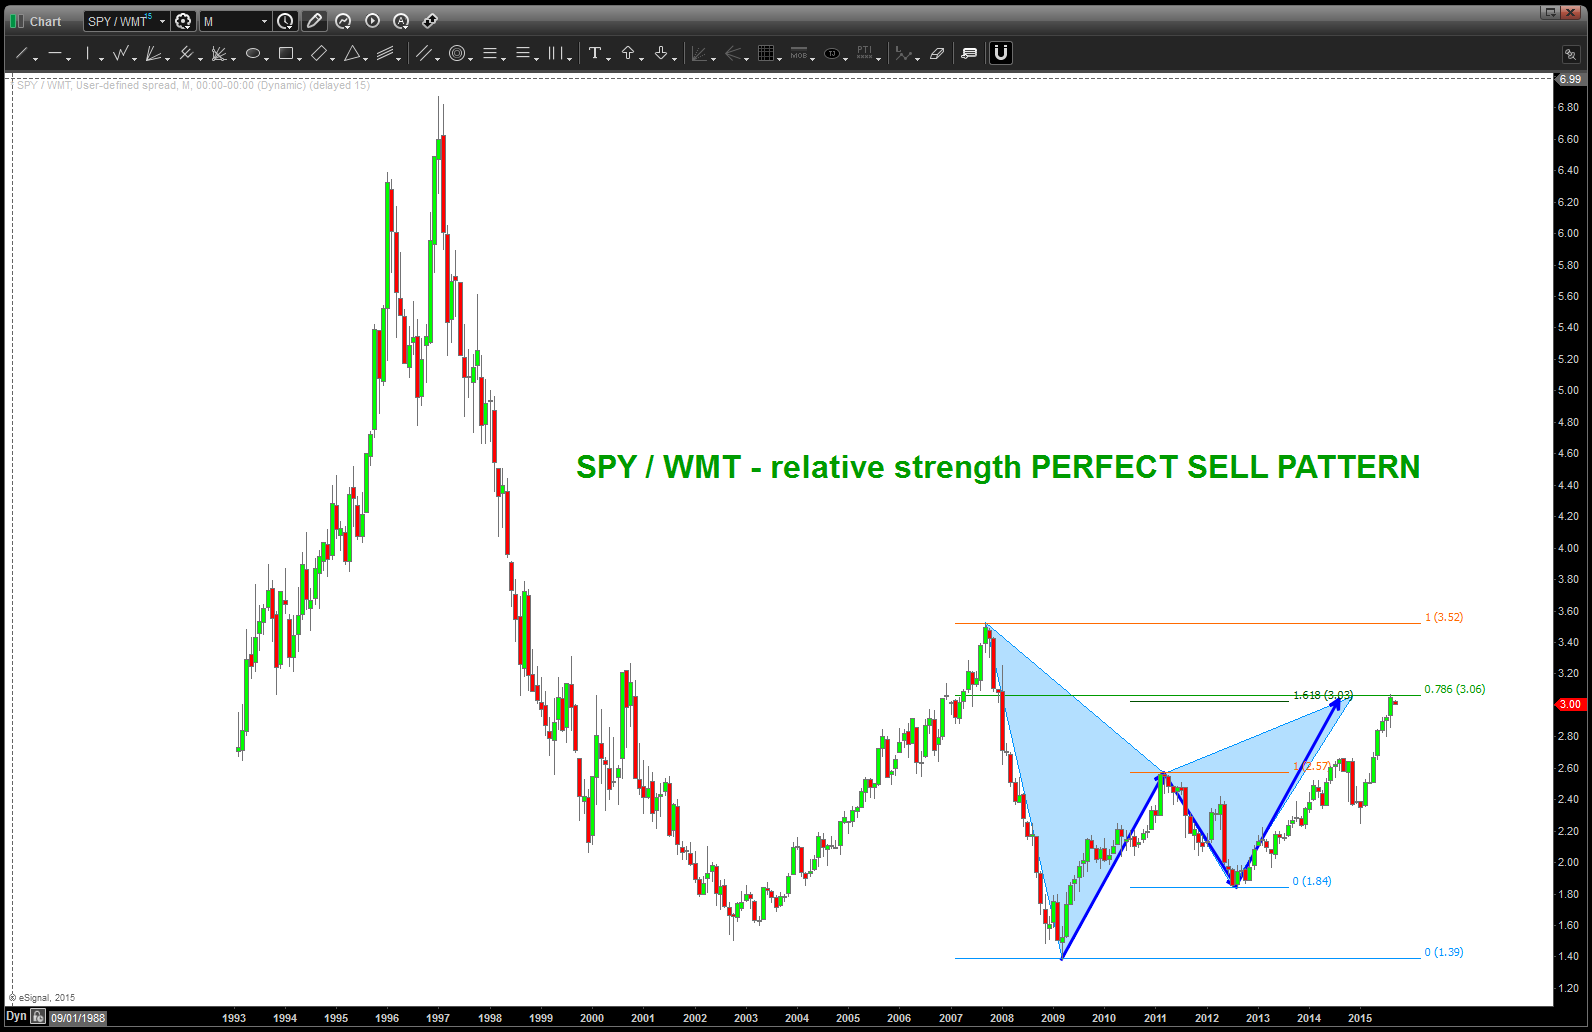
with the above being posted I’m going to try and present the plausible IF-THEN scenario using PATTERNS and ratio analysis
- Ratio Analysis is VERY powerful and when coupled w/ PATTERNS it really gives you a flavor for institutional positioning and money flow.
- Certain stocks “own” the world of safety, risk-off, “if the word ends tomorrow I buy xxx”, etc.
- $WMT is one of those names. A lot of the public shops at $WMT.
- So IF WMT is strengthening from a relative strength perspective then institutions are taking risk off … if it’s losing strength then risk is on …
- How do we know when to “wax on” or “wax off?” (Pardon the Karate Kid pun)
- HINT: PATTERNS.
- Here’s the text books SELL PATTERN on the SPY/WMT ratio
- What’s this mean?
- IF the PATTERN works then WMT is going to be a “risk off” asset and the SPY will lose relative strength to WMT.
- What’s this mean?
CLIFF NOTES: why is this important? See chart below … EVERY TIME since 2000 that the ratio inflected the SPY did at the EXACT TIME.
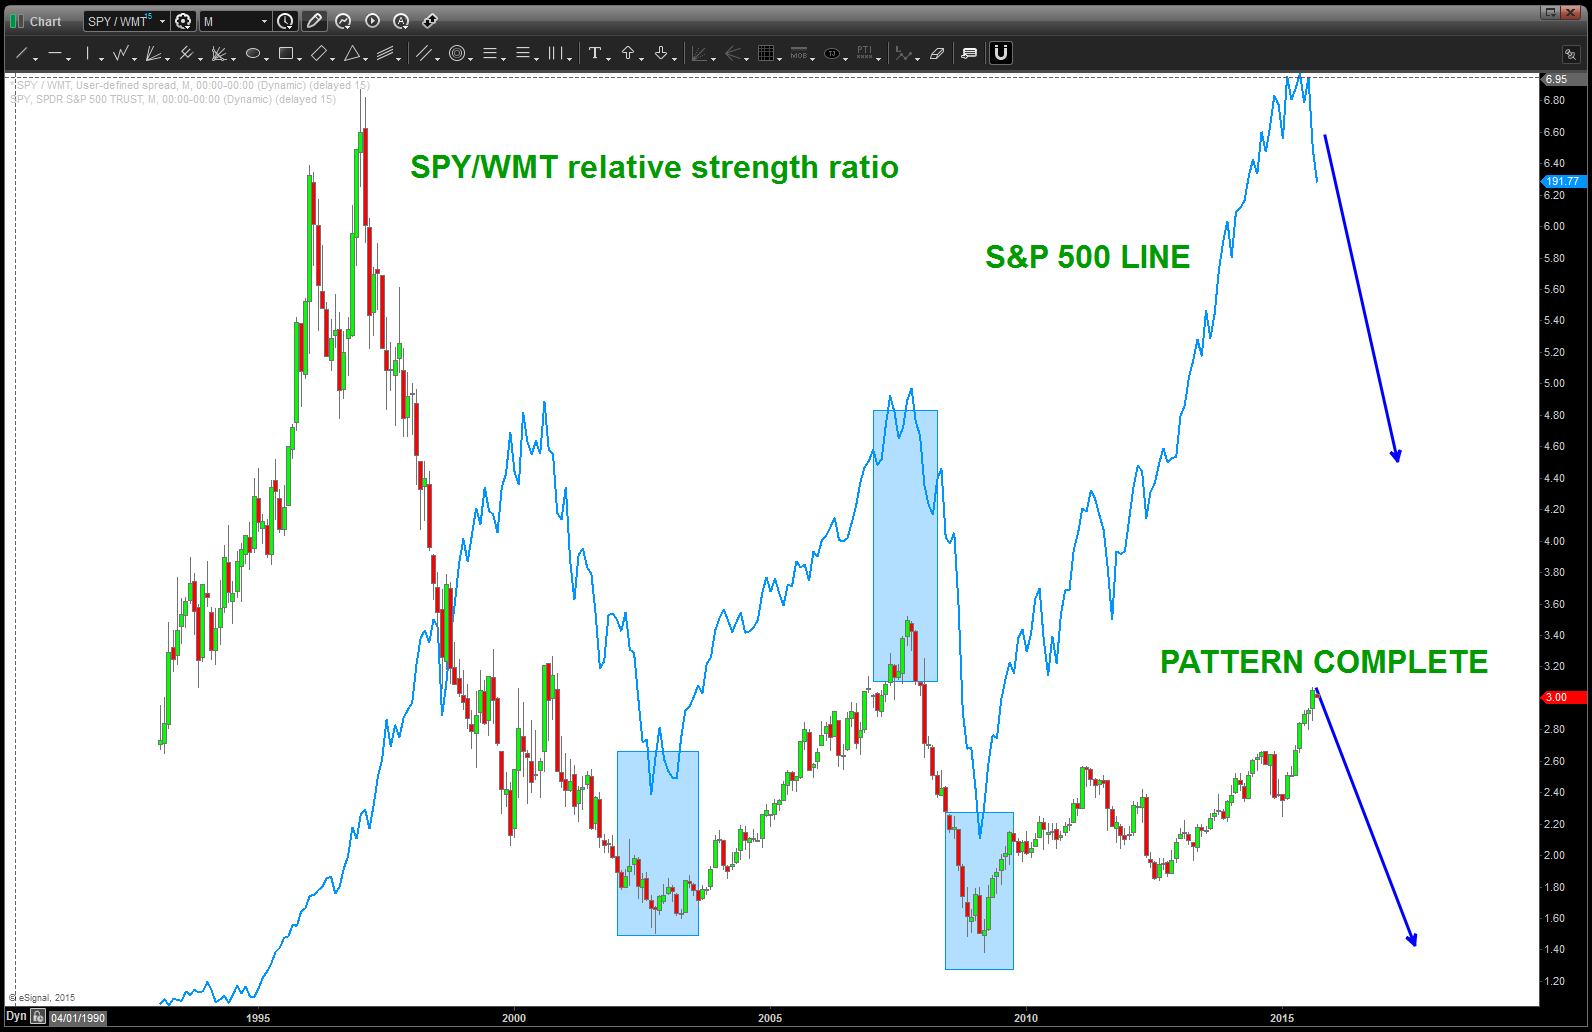
SPY/WMT ratio w/ SPY overlaid (blue line)
SO – “if then” w/ me …
IF this pattern holds then the US Equity market is in on the magical mystery tour … step right up, come this way.
IF it fails (the ratio goes higher) then this correction “should” end soon and game on ….
HINT HINT: watch monitor this ratio, closely.
THIS IS WHAT I SEE AND NOT WHAT I BELIEVE ….
Cheers and rock on, ok?
Bart
