Bill and Ted’s Excellent Adventure Meets the Matrix in two charts …
folks, work w/ me …
- ratio analysis: A/B ….if A stronger (relative strength) then chart goes up. if B stronger (relative strength) then ratio goes down.
- $NYA – New York Stock Exchange Index – largest barometer of stock market health
- XLP – institutional rotation occurs into staples in a “risk off” world .. people need “staples” to live so they should outperform and have more relative strength …
here’s my “if-then” logic …
IF $NYA is good to go and healthy THEN a ratio of $NYA/XLP will go UP and IF the ratio of $NYA/XLP is going down then something ain’t right at the circle K ….

something aint right at the circle k
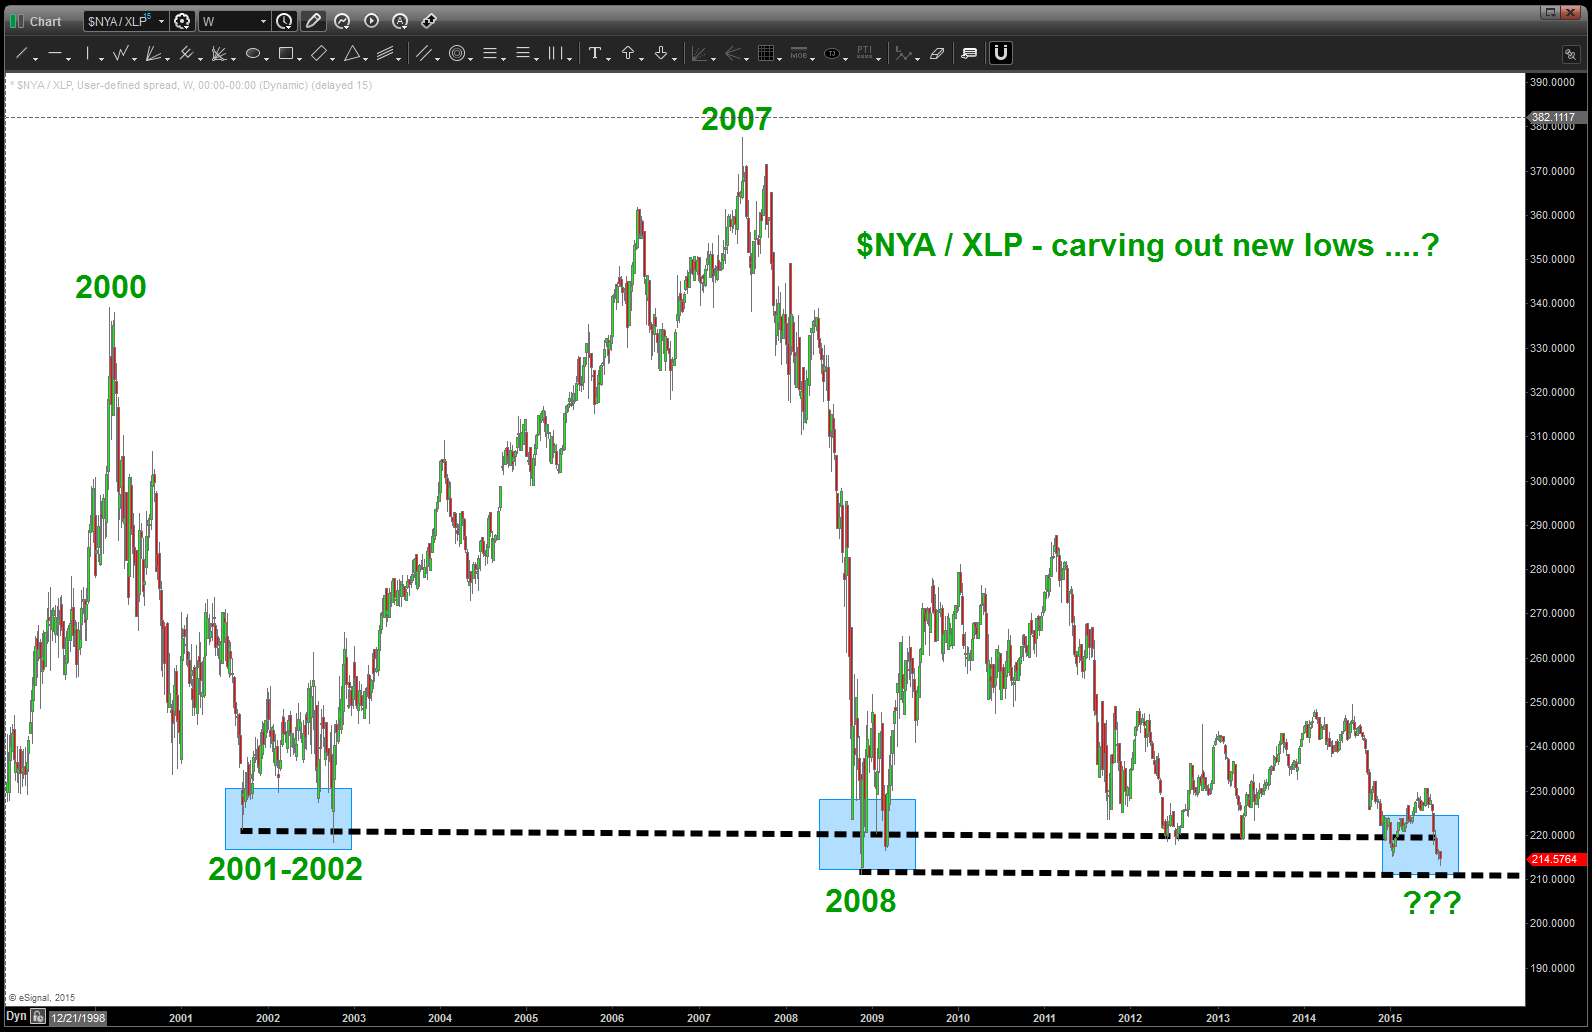
$NYA / XLP
Note: at these levels (in the past) the $NYA has always started to outperform (the ratio goes UP).
Now, take a look at this chart w/ the $NYA overlaid on top of the ratio ….
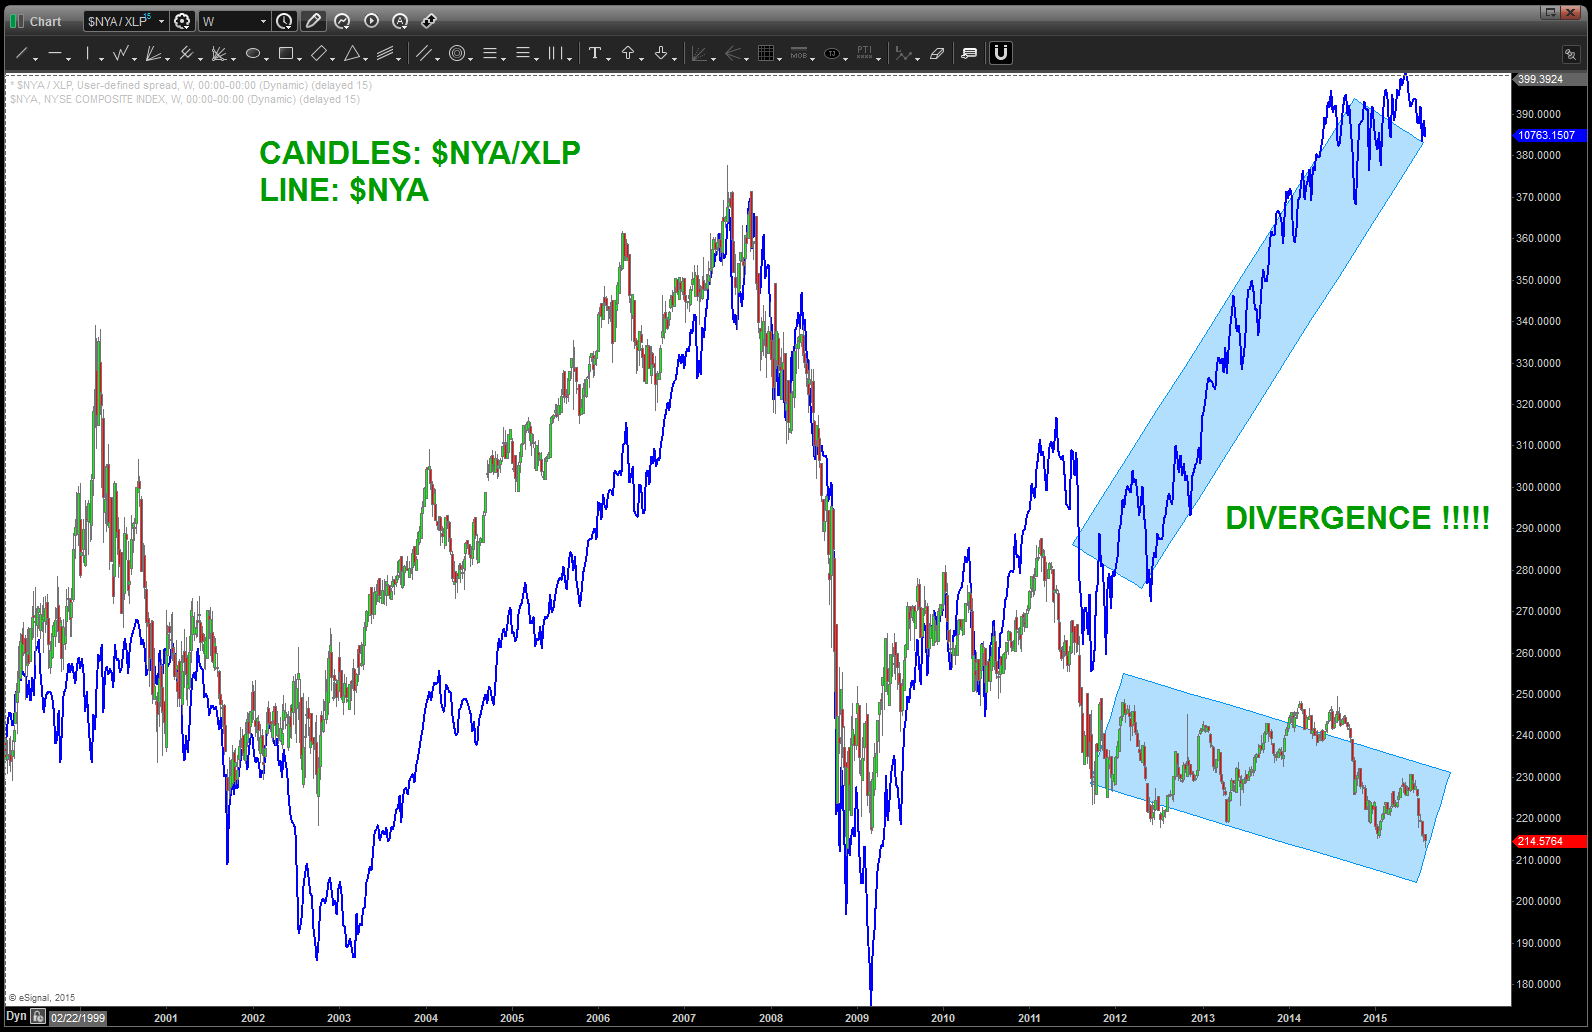
note the massive DIVERGENCE – the ratio should track the $NYA UP into new highs … instead it’s plumbing new lows. IT WILL RESOLVE
so, if you’ve read this far, then your a SPECULATOR and you like to play. One thing that I’m fairly certain .. this discrepancy in the ratio and the $NYA will resolve. Two outcomes …
- w/ $NYA at new highs, the ratio will find support as it did in 2001-2002 and 2008 and start back up and the $NYA will take off and move higher and higher and higher …
- w/ $NYA at new highs the ratio will crack thru this decades old support (showing institutional rotation into staples) and cause a rather big move to the downside and, perhaps, much larger correction than anyone is expecting.
YOU CHOOSE:

Blue – $NYA keeps going higher and higher …
Red – $NYA cracks, ratio accelerates to new lows and … you do the math.
PICK!
rock on, ok?
B
