a “relative strength ratio” revisted …about to fall off a cliff?
CLIFF NOTES: the XLP/$NYA ratio, when it inflects UP or DOWN, has been responsible for every major pivot in the US Equity Structure over the past 14 years. It is sitting on a cliff of support, which if lost, will signify a move OUT OF “risk adverse” asset class of staples and I would expect the entire equity complex to explode in a phase transition of parabolic proportions. Stay tuned … if it holds, then perhaps the SELL pattern on the $NYA will hold and a “normal” and “needed” correction will ensue. Trying to be to the point and point readers in a less looked at aspect of institutional rotation and flow of funds.
Let’s start at the beginning w/ definitions –
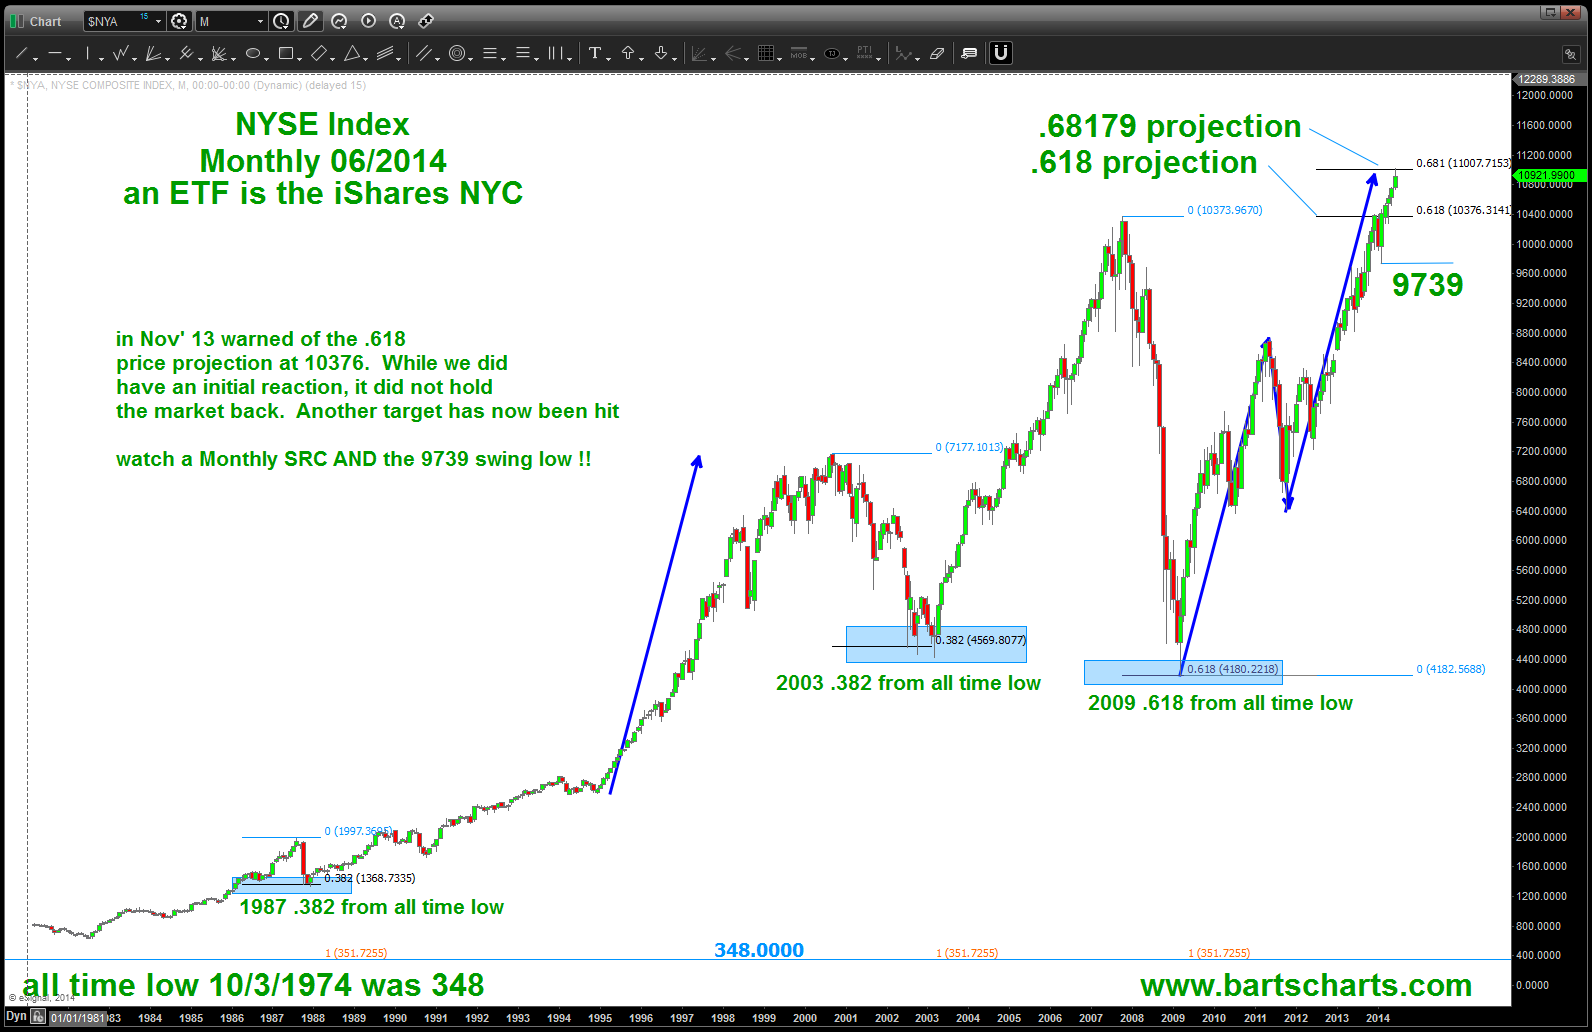
New York Stock Exchange Index ($NYA):
- An index that measures the performance of all stocks listed on the New York Stock Exchange. The NYSE Composite Index includes more than 1,900 stocks, of which over 1,500 are U.S. companies. Its breadth therefore makes it a much better indicator of market performance than narrow indexes that have far fewer components. The weights of the index constituents are calculated on the basis of their free-float market capitalization. The index itself is calculated on the basis of price return and total return, which includes dividends.
- The two biggest benefits to investors of the NYSE Composite Index are (a) its quality, since all its constituents have to meet the stringent listing requirements of the exchange, and (b) its global diversification, with non-US companies accounting for more than one-third of market capitalization. NYSE-listed foreign companies have their headquarters in 38 different countries, with the most foreign issuers from Canada, China, the U.K., Japan and Mexico.
Consumer Staples (XLP)
- Essential products such as food, beverages, tobacco and household items. Consumer staples are goods that people are unable or unwilling to cut out of their budgets regardless of their financial situation. Consumer staples stocks are considered non-cyclical, meaning that they are always in demand, no matter how well the economy is performing.
- Consumer staples can be a good option for investors seeking slow and steady growth.
Ratio Analysis using Technical Patterns:
- Numerator / Denominator
- If we want to see if a certain (security vs sector) or (security vs security) or (sector vs sector) or (whatever) we put one on top of the other. IF the ratio goes UP then the top “thing” is stronger. If the ratio goes DOWN the bottom “thing” is stronger
XLP/$NYA :
- w/ the definition of staples above, one would think that “institutional money” would rotate into defensive names during times of volatility, corrections or bear markets.
- if we plot the ratio above THEN when XLP/$NYA goes DOWN we can think the party continues … when it completes a bottoming pattern and goes back up then a defensive rotation should occur signifying relative strength increasing and a move into the staples.
So, w/ the definitions complete, let’s see where we are:
In the charts below you can see that, back in June we saw a pattern completing in/around the 10900-11080 level. It did in fact hit and the market sold off. The broader indices are making new highs and the bullish aspects of this current picture are unquestionable strong. On an intraday basis, we are approaching a key level at 10988. If we are going lower then I would expect it too hold as resistance.
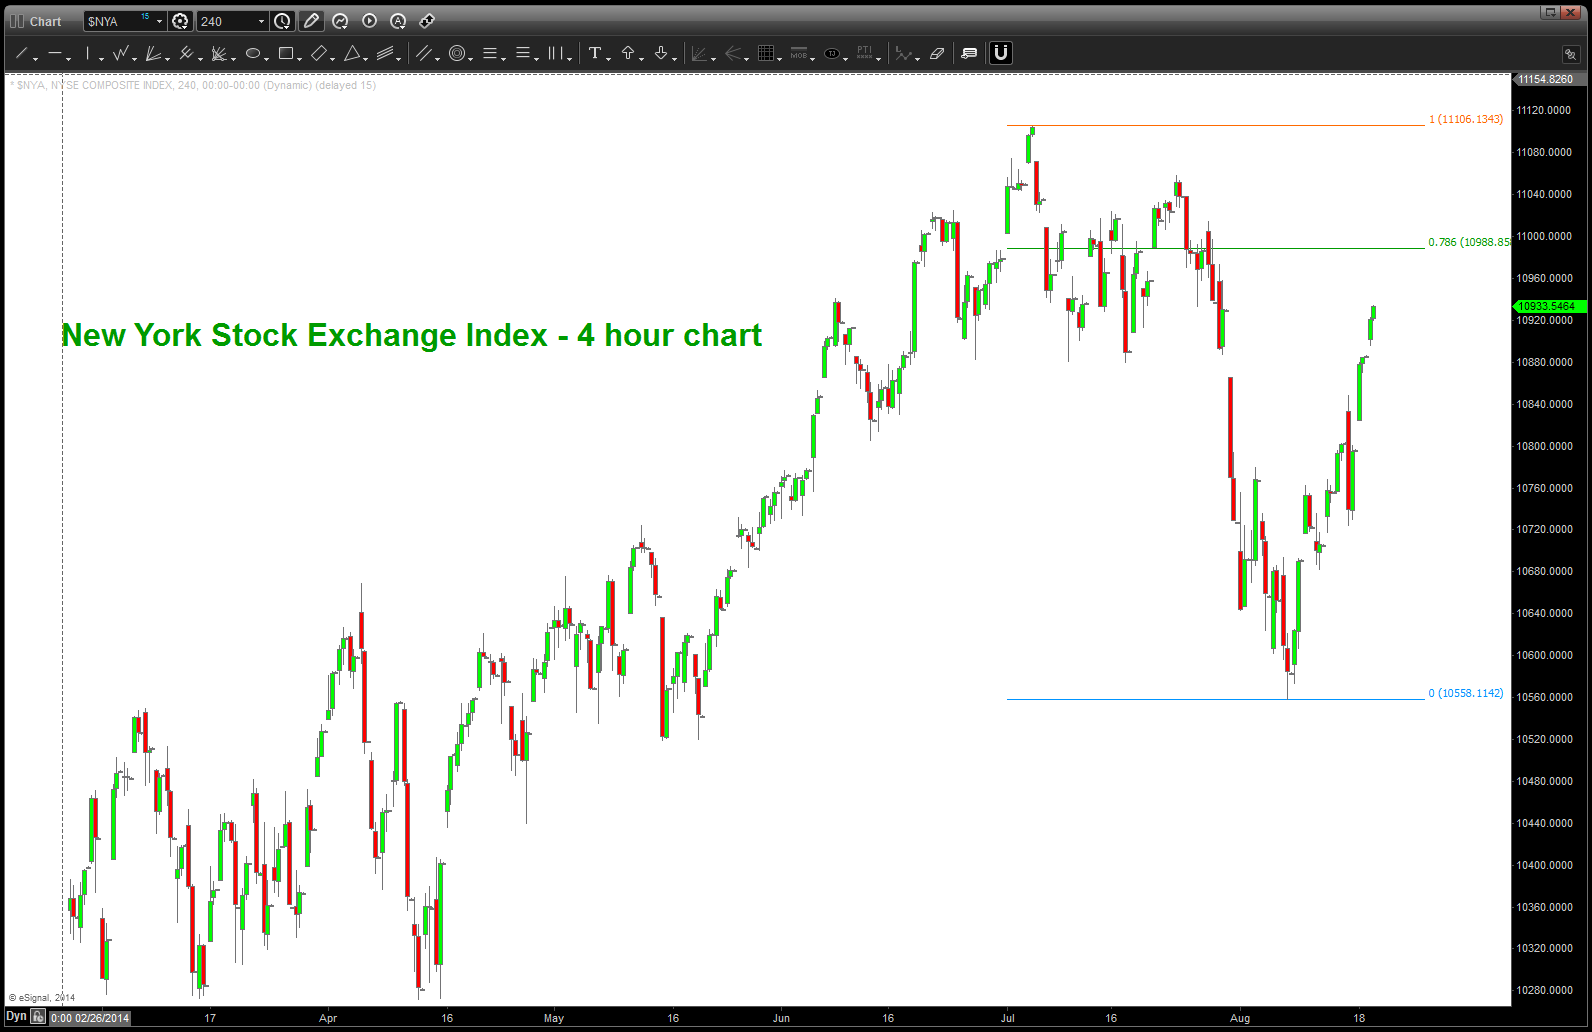
NYSE Index 4 hour chart
here are the charts from June 2014.
doing some geometry work, but basically showing resistance as noted in the above chart.

now, what about the ratio? Is that telling us anything of importance? Well, yes.
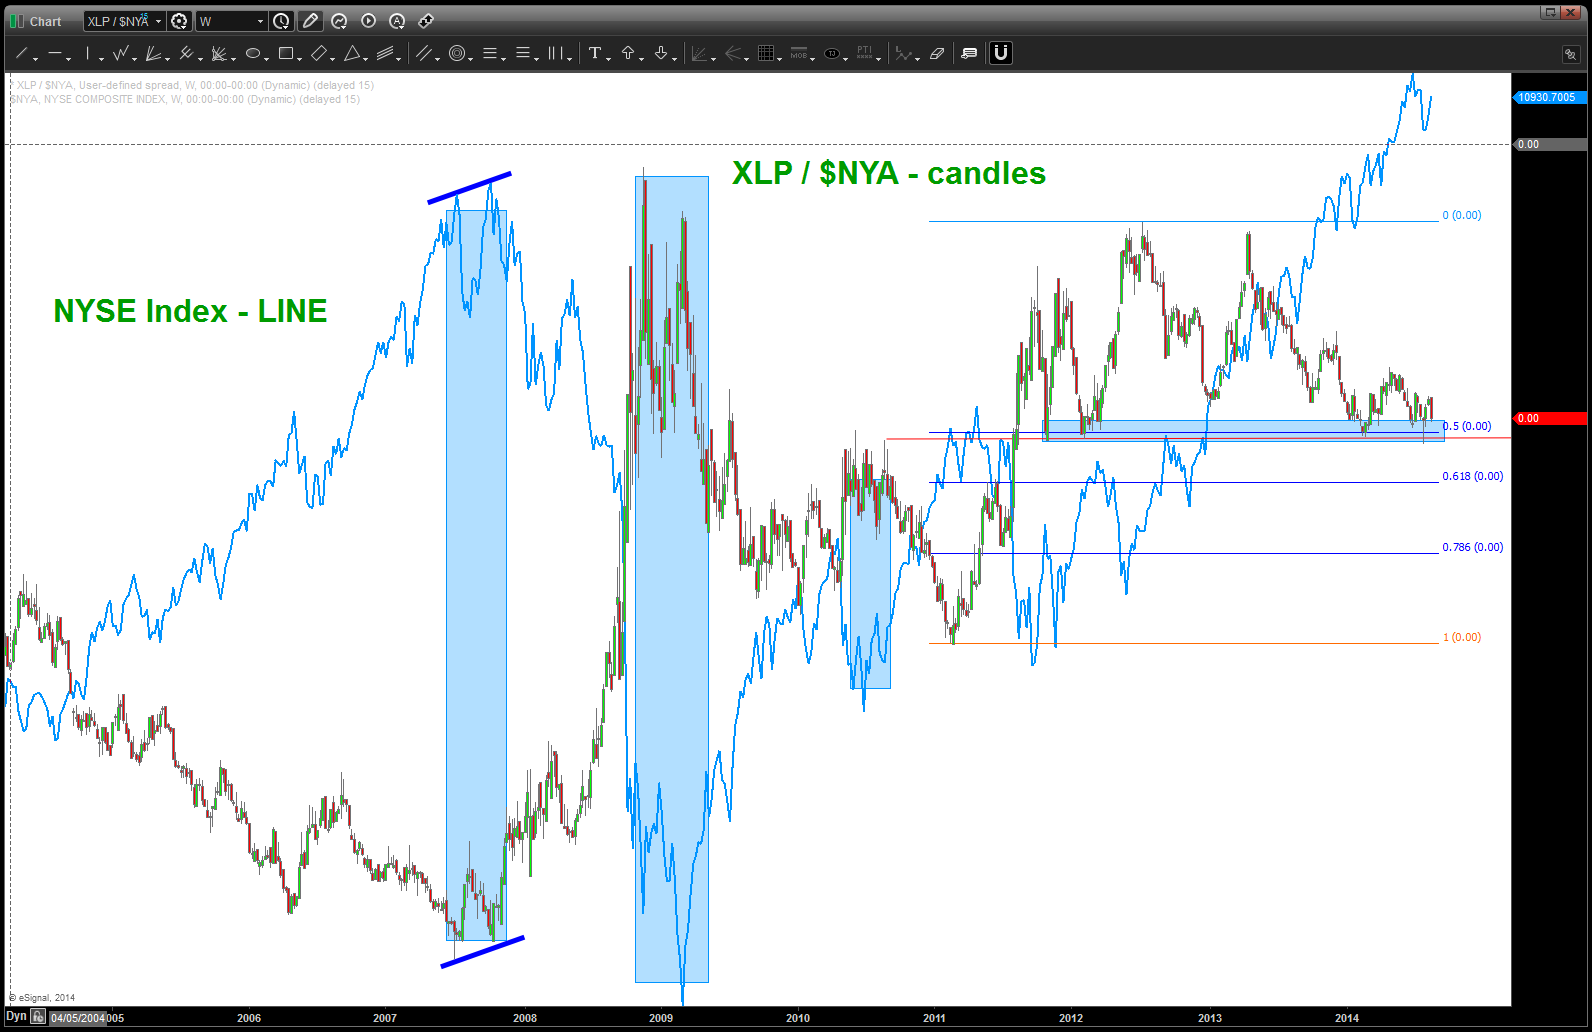
Ratio Analysis w/ $NYA overlaid on top of the ratio
Bunch of stuff going on here:
- the blue line is the $NYA
- the candles is the ratio of XLP/$NYA
- note the blue rectangles – at every MAJOR pivot the ratio is almost a mirror image of the $NYA.
- the big “clue here” is that the ratio has held the 50% retracement level since 10/2011. folks, that’s almost 3 years. stop and think for a moment about that one … notice in the past we had straight UP moves and DOWN moves which corresponded very nicely to the $NYA equally and opposite. HOWEVER, now for almost 3 years the XLP has, on a relative strength basis, held it’s own, so to speak.
- this divergence is something to watch and be very aware. YES, I know that we are continuing higher and higher. I also know that it’s been confirmed that the Central Banks around the world have injected 29 trillion (yes 29 trillion) into the US equity structure…it’s the greatest ponzi scheme of our time.
- what’s the bullish picture … ? Well if we lose that level to the downside that has held for 3 years THEN this market will EXPLODE higher and vacuum into the stratosphere. not that I don’t want that ….but I do want a NORMAL market. Folks a .382 correction is very bullish and natural …what’s so wrong w/ that?
If you do ratio analysis, you absolutely need to keep this level and pattern on your radar screen ….
BART
