turn off the talking TV pundits, the endless Twitter feeds and defy human nature …
“defy human nature and do the work …”
Jim Twentyman
folks, the market is giving us a road map and, if we get our “heads out of the airplane” you can see it …
what’s the “best” road map, in my HUMBLED opinion? Ratio analysis using pattern recognition …the key w/ ratio analysis is it gives you the “big boys” road map.
XLP – staples. in times of “risk off” the institutions have to go somewhere, right? they go defensive – staples.
$NYA – a really really important index.
so, when the XLP starts to outperform on a relative basis, then the gig is up and the rotation is occurring.
here’s a more in depth blog about it: https://bartscharts.com/2015/06/27/revisiting-the-xlpspx-ratio-again-in-june-2015/
here’s the ratio, updated:
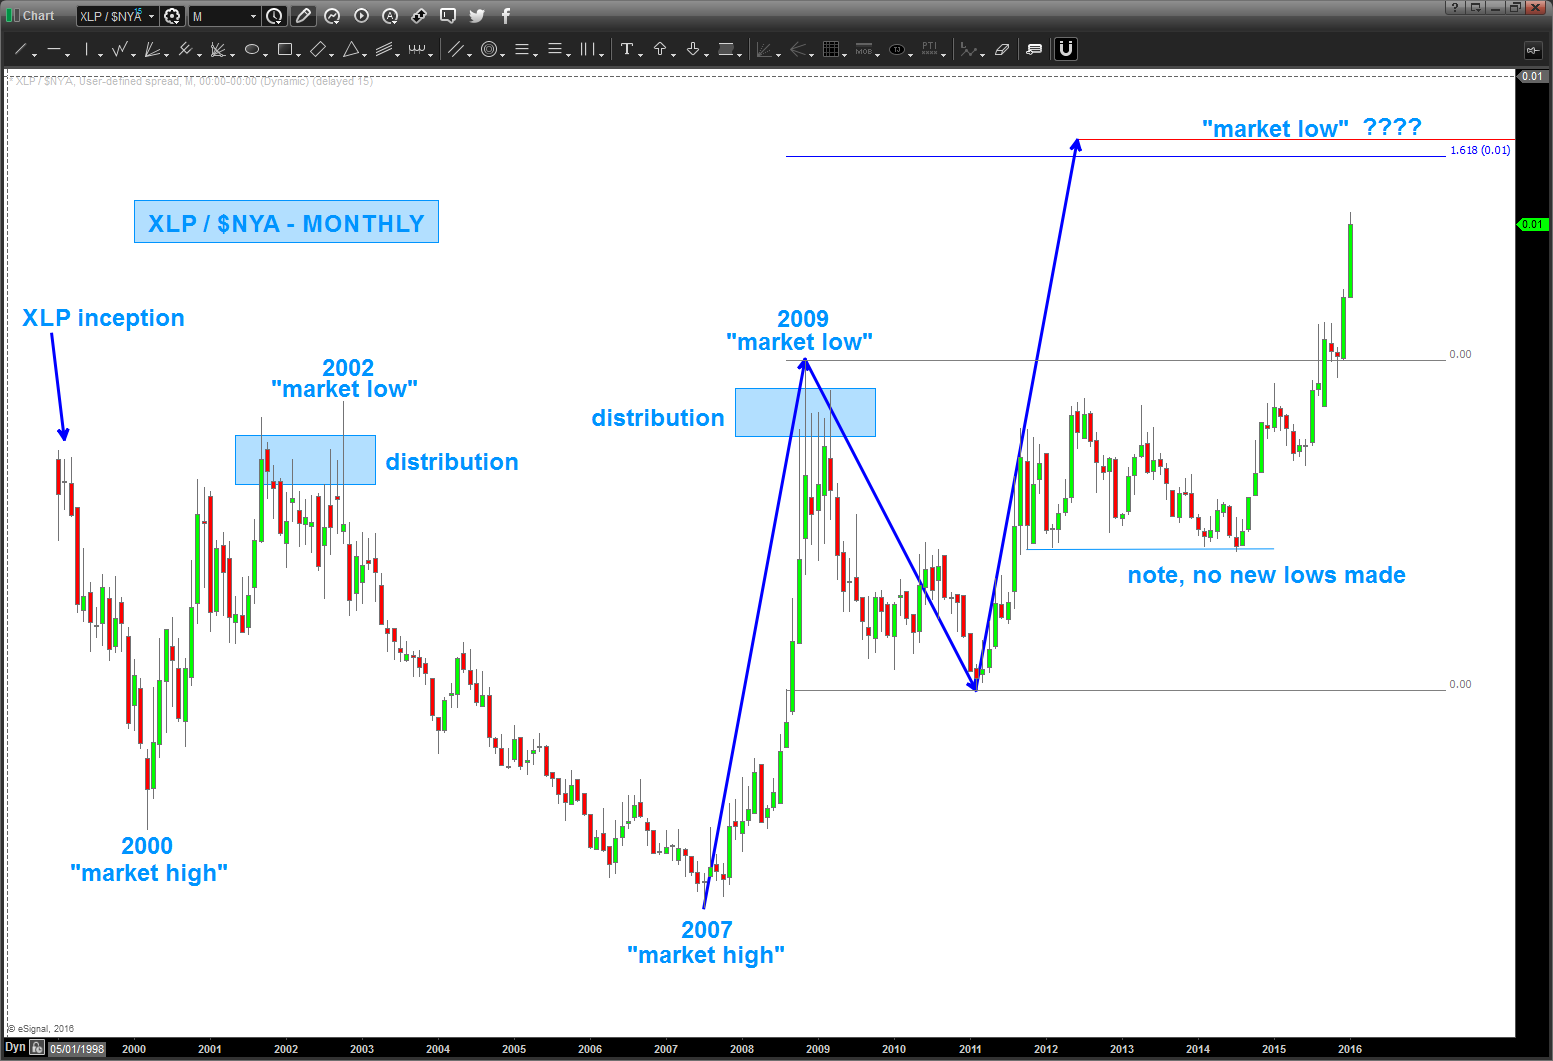
couple things:
- note the pattern a little higher (means more losses for stocks, OBTW). That’s a really really powerful SELL pattern which means Equities go up.
- note the pattern timed – almost exactly – EVERY high and low since 2000. I would suspect it would give us clues for longer periods BUT XLP inception was in 1998.
- note, at “market lows” there was a shit load of accumulation occurring or, in the case of the chart “distribution” at the highs.
- one last, as the market continued to breathe into the stratosphere one would think that the RATIO should have been falling out of the sky right? I mean it was so easy, so good BUT the market was telling you – right here on this chart that we were weak internally AND the big boys weren’t really playing were they? If they were full risk on then this ratio would be going down like it did 2002-2007. It didn’t .. in fact NOT ONE SWING LOW HAS BEEN BROKEN since 2007 ratio low. Think about that for a moment …
So, unless your a swing trader w/ a couple days holding period OR a day trader then I wouldn’t touch equities until this pattern completes.
hope this helps.
B

Hi Bart,
Looks like to me that this ratio has already reached your target.
Do you think the correction is over?
Thanks!
Malcolm
*From:* Barts Charts [mailto:comment-reply@wordpress.com] *Sent:* Friday, January 22, 2016 6:27 AM *To:* mtrevillian@verityinvest.com *Subject:* [New post] turn off the talking TV pundits, the endless Twitter feeds and defy human nature …
BART posted: “”defy human nature and do the work …” Jim Twentyman folks, the market is giving us a road map and, if we get our “heads out of the airplane” you can see it … what’s the “best” road map, in my HUMBLED opinion? Ratio analysis using pattern recogni”
Malcolm, great to hear from you and hope your enjoying this storm! 35″ here in Leesburg. Unfortunately, the ratio has not reached the target yet. Still has some more to the upside to go. For that reason, believe we need to stay put until the target is hit. Does that make sense?
Thanks for visiting the site!
Bart