Using ratio analysis to look for inflection points …
I like ratio analysis .. it shows rotation, strength vs weakness and a bunch of stuff.
Greece and Eurozone have been all the rage and, well, rightly so – I guess.
But I’m trying to tune all that out and just draw some pictures.
Here’s the deal .. when the DAX underperforms the NYA (the candles go down) then the EURO bottoms and goes UP against the dollar (red line)
So, we just finished a SELL PATTERN of RELATIVE STRENGTH of the DAX vs NYA. So, the DAX should underperform and, if 2015 is any guide, then the EURO should bottom and start up for a tradeable long.
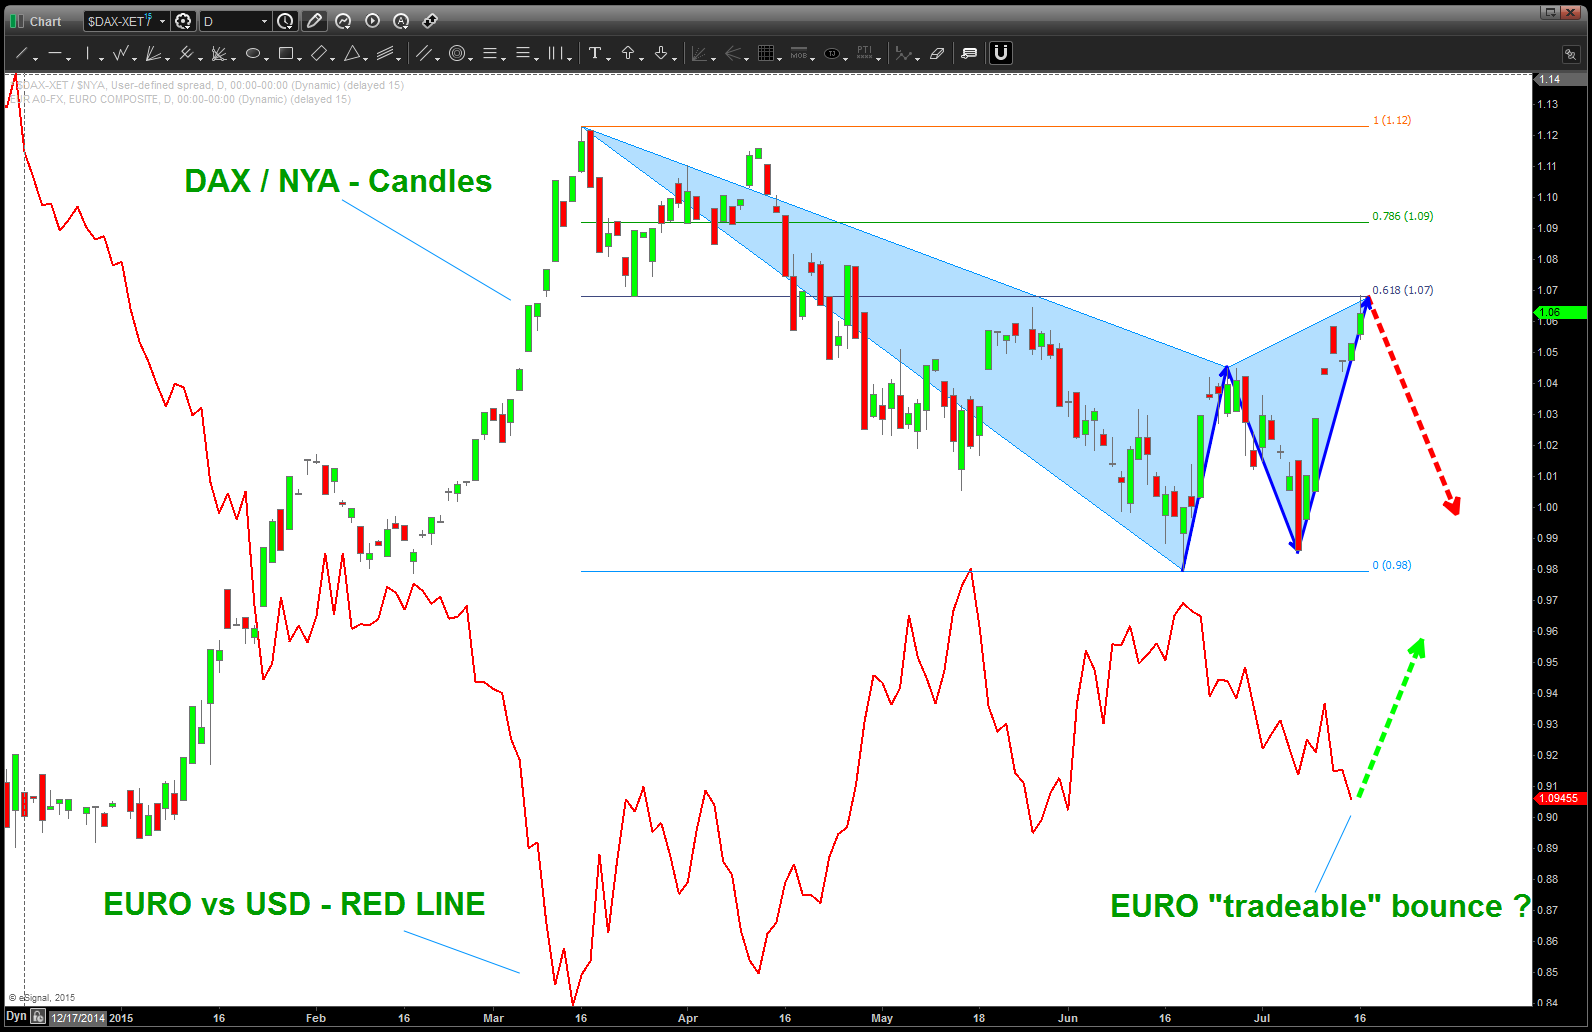
candles is the relative strength of the DAX vs NYA. the line is the EURO vs USD. NOTE the inverse relationship …
