Where did that Crude Oil Support Trend Line Come From?
Cliff Notes: if your new to this blog you’ll find that it’s all based on geometry and pattern recognition. If you take a look at weekly crude it’s not hard to see that beautiful support line that’s been holding crude up since September 2009. So, when I see that I say “why” and “what’s important about that from a geometrical stand point.
1. Draw a line down from the all time high on crude into the crash low in the low 30’s. That vector is aligned in PRICE and TIME and gives rise to a natural angle.
2. Get a protractor and draw a 90 degree angle. (shown by the purple 90 degree angle shown up at the top of the all time high)
3. Now just “copy/paste” the red vector lines and create squares.
4. note the trend lines that have been “bounding” crude oil (bold red lines)
5. now, be patient and watch price as these lines are “attacked” so, no matter what the fundamentals say, we have our targets and ranges to play and add in additional tools that fit your style, techniques and fundamentals.
6. get a glass of wine or whatever fits your fancy, blow this chart up and look at gaps, consolidation you’ll find there is a lot of action …
Bart
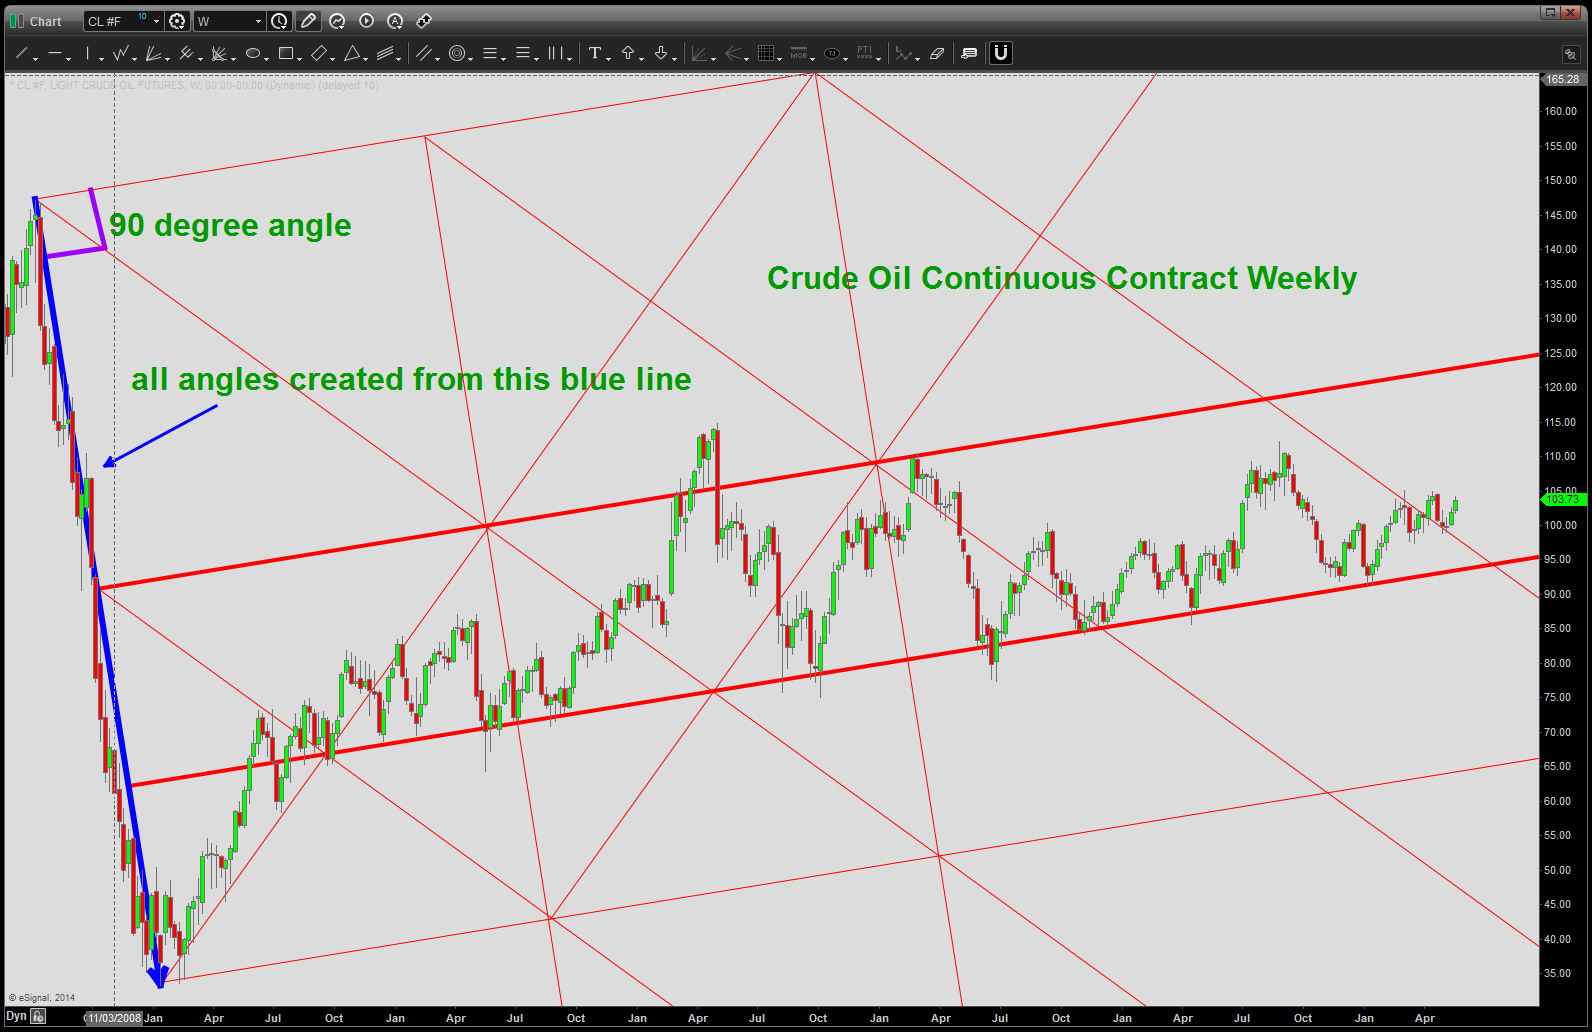
Crude Oil Trend lines from the dark blue line
