Loonie vs the USD and how to build a case for managing risk …
CLIFF NOTES: I think the “blue box” will be major support.
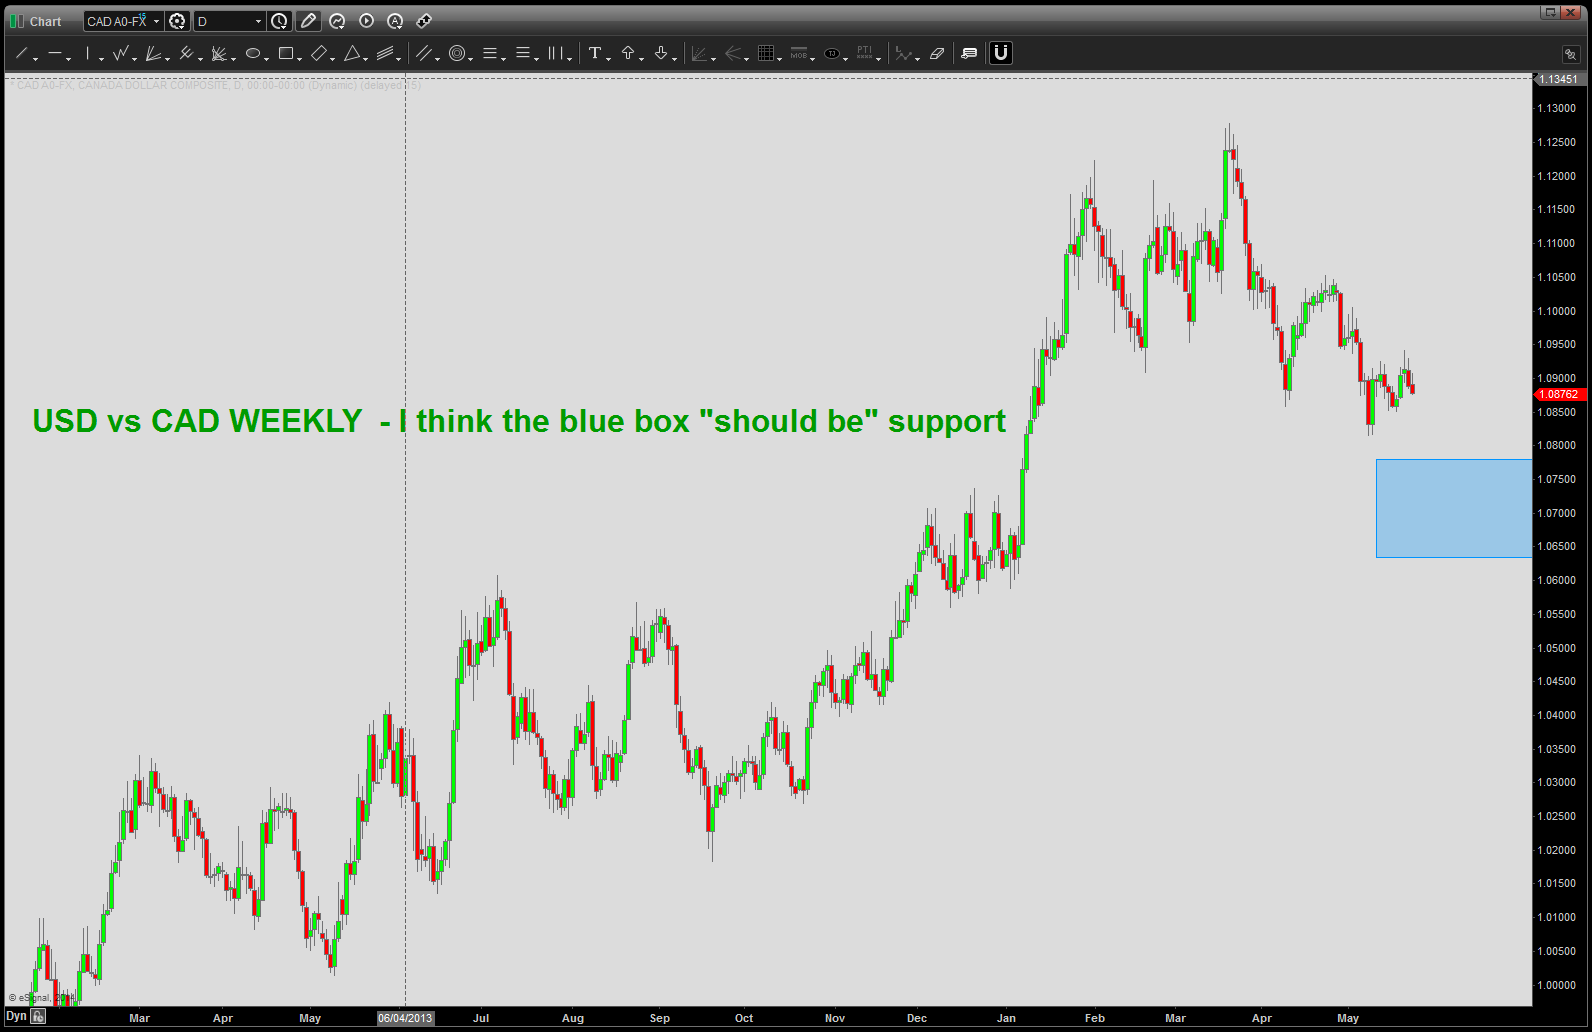
the BLUE BOX
On more than one occasion I’ve been asked if flying F-14’s has helped me investing. The answer is YES and NO. Yes because it made you appreciate risk, be methodical and “check list” oriented and, believe it or not, become somewhat analytically motivated. But, it has also HURT because of the detail oriented nature that it takes to be a strike fighter aviator these days. Let’s face it, margin for error is EXTREMELY low and therefore, at the expense of slippage, I try to get it too much to a “gnat’s ass” then is necessary in the fluid and dynamic ecosystem of the liquid markets. I’ve come to accept that so I’ll let moves go because they never made my level ….
in flying off an aircraft carrier you get to that point where you do ask yourself – “have I done everything I can to not become fish food?” in tension, w/ the thumbs up and the pilot saluting your about to go on “Mr. Toad’s Wild Ride …” It’s the same thing trading/investing. So, the ride is now the Spot FX market so let’s see what ride is waiting for us …

have we done everything to manage risk .. here comes Mr. Toad’s Wild Ride …!
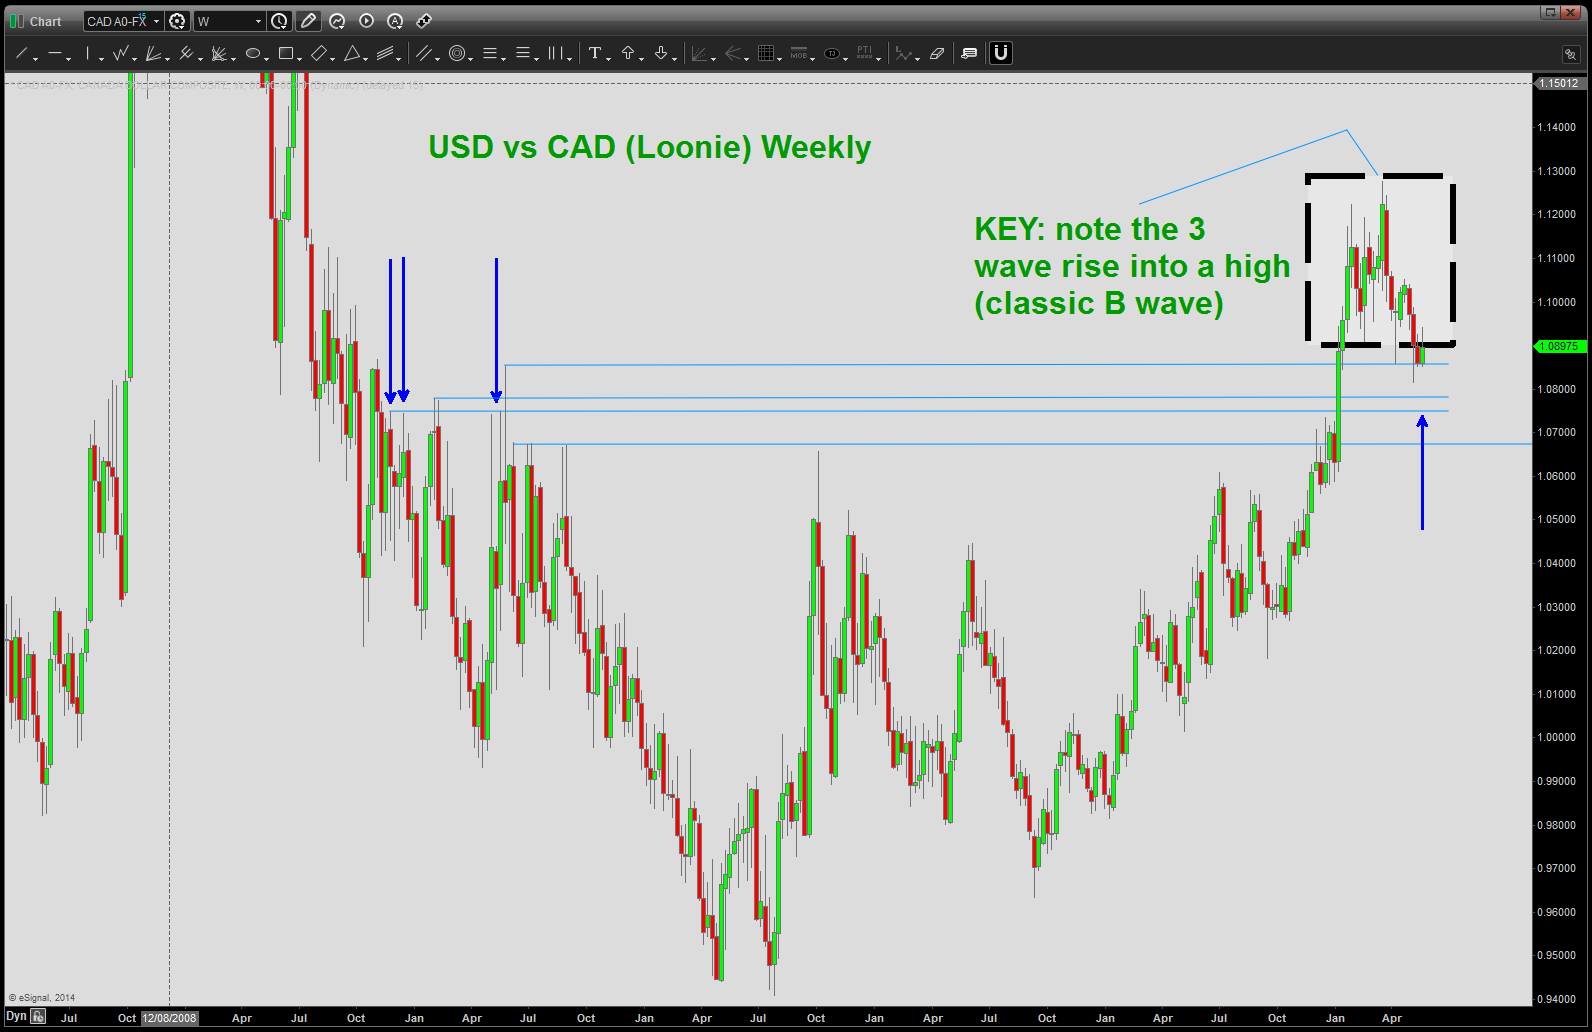
1. USD vs CAD (Loonie) – look for polarity. Having a PATTERN smack against the brick wall (resistance or support) of polarity increases probability
2. try (the operative word) to figure out past/former corrective moves in PRICE and TIME. Note, since the BIG yearly correction (10/2011-09/2012) the current move has been the “longest” in TIME. shown below is the black arrows down at the low and pasted on current price action. it takes us right down into the two blue horizontal lines (polarity) that is good ….I am going to remove them so as not to cloud the picture.
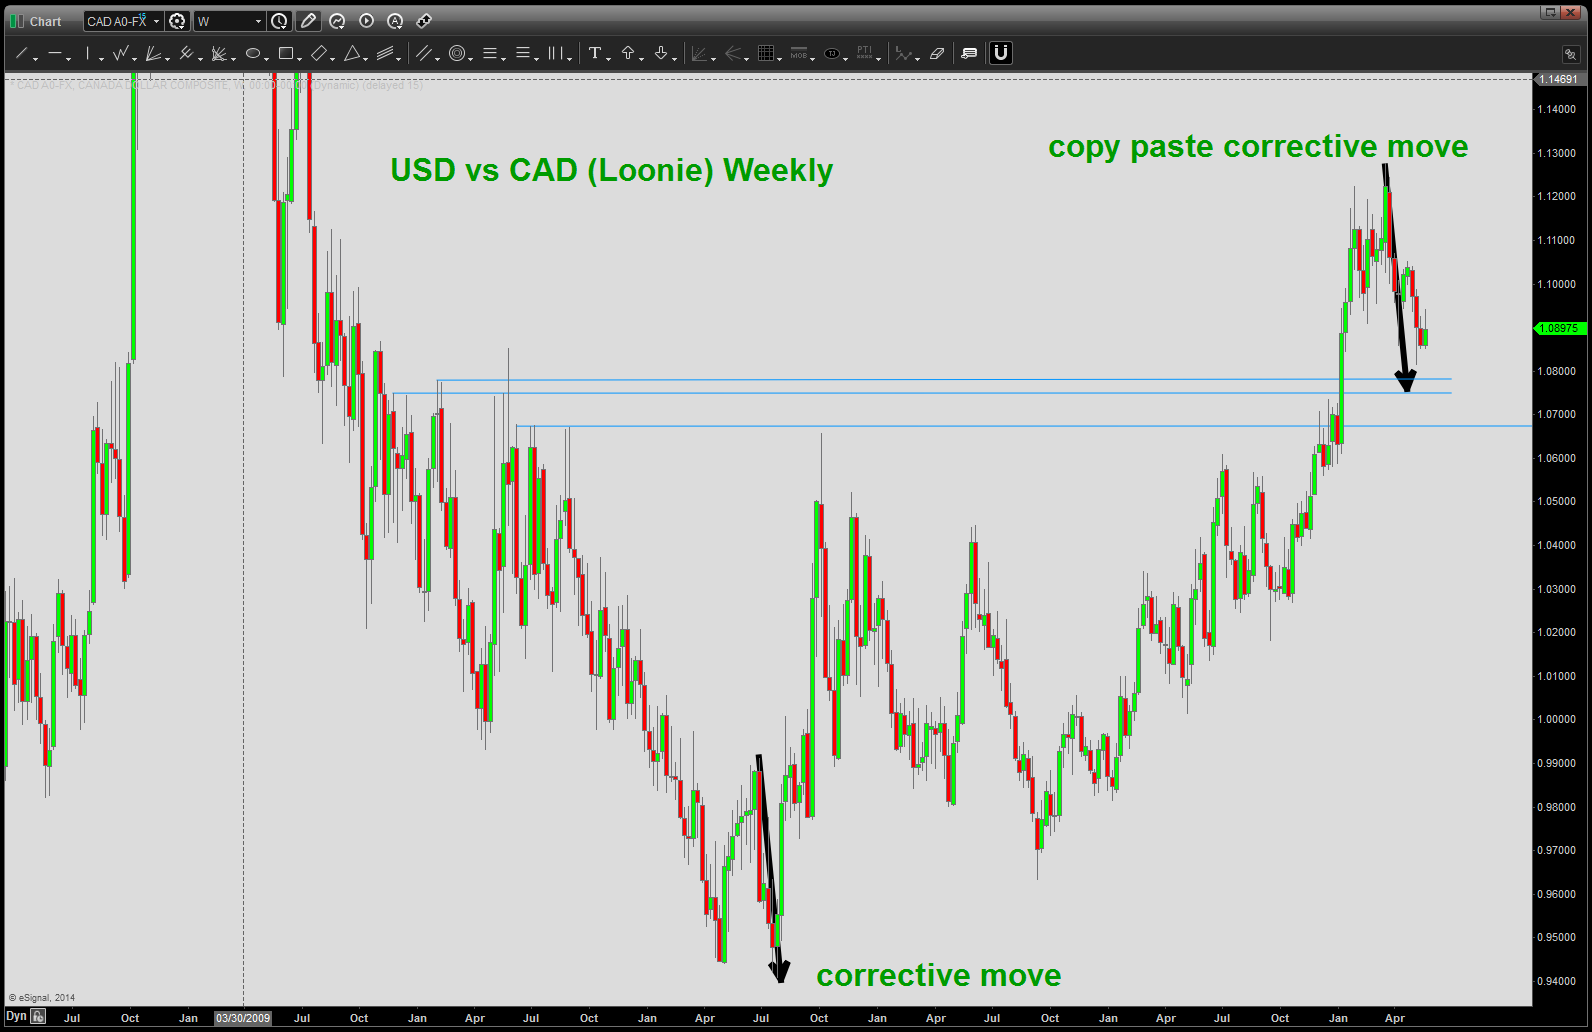
note the black arrows – equal corrective moves
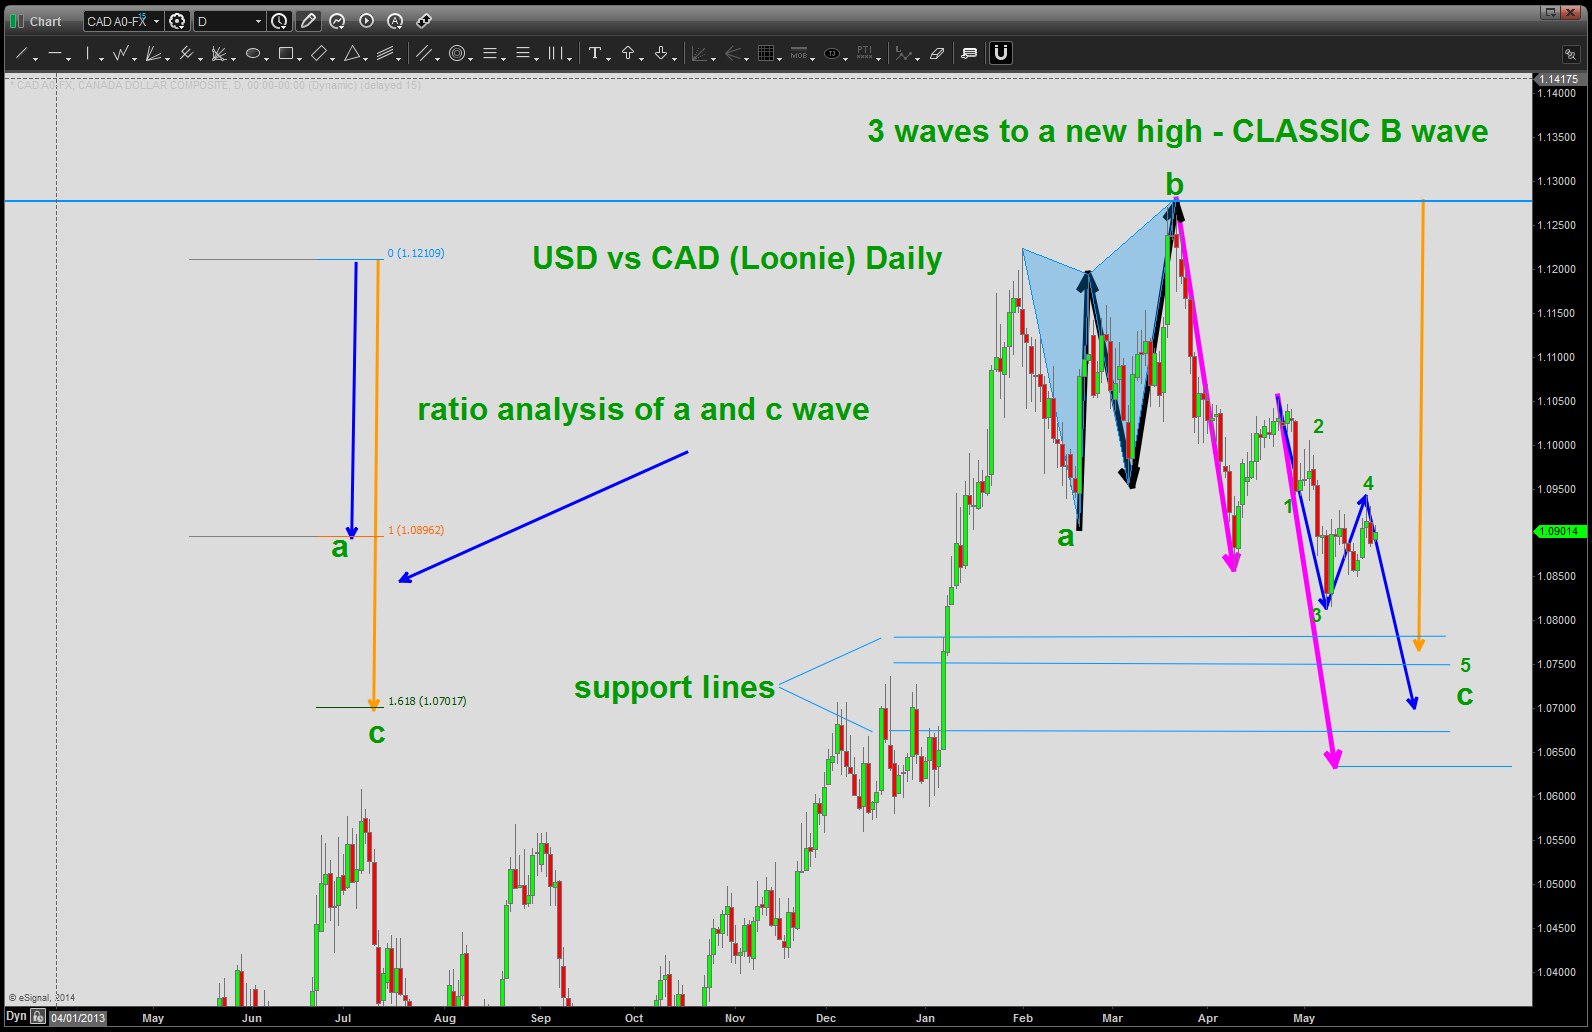
3. now, before we do some projections I want to go into some “basic” Elliott wave corrections. Note, the first chart that had the dashed box around it? We are seeing a three wave into a new high. quite frankly, that is what this entire analysis of a BUY USD vs CAD is banking on. this is a classic “B” wave correction. Right now, current price action down is a C wave and that denotes we are coming to an end of move. below you will find a daily chart showing the 3 wave move up. also note, typically in an expanded flat (the correction which is unfolding) the C wave is 1.618 of the A wave. Also shown is a “classic” butterfly topping pattern (shaded blue triangles – it looks like a butterfly) Also make you see the purple and blue projections into the shaded blue areas. To finish here, typically (as a rule of thumb) corrections tend to go or stop at the previous 4th wave of a lower degree. I have cleaned up the chart to show this .. note the classic 5 wave triangle of a,b,c,d,e and then the thrust up into the high. Well, that’s the 4th wave of a lower degree and guess what? our blue shaded region is right in this area. so, additional confirmations to add to the PROBABILITY.
the key to this analysis is an expanded flat
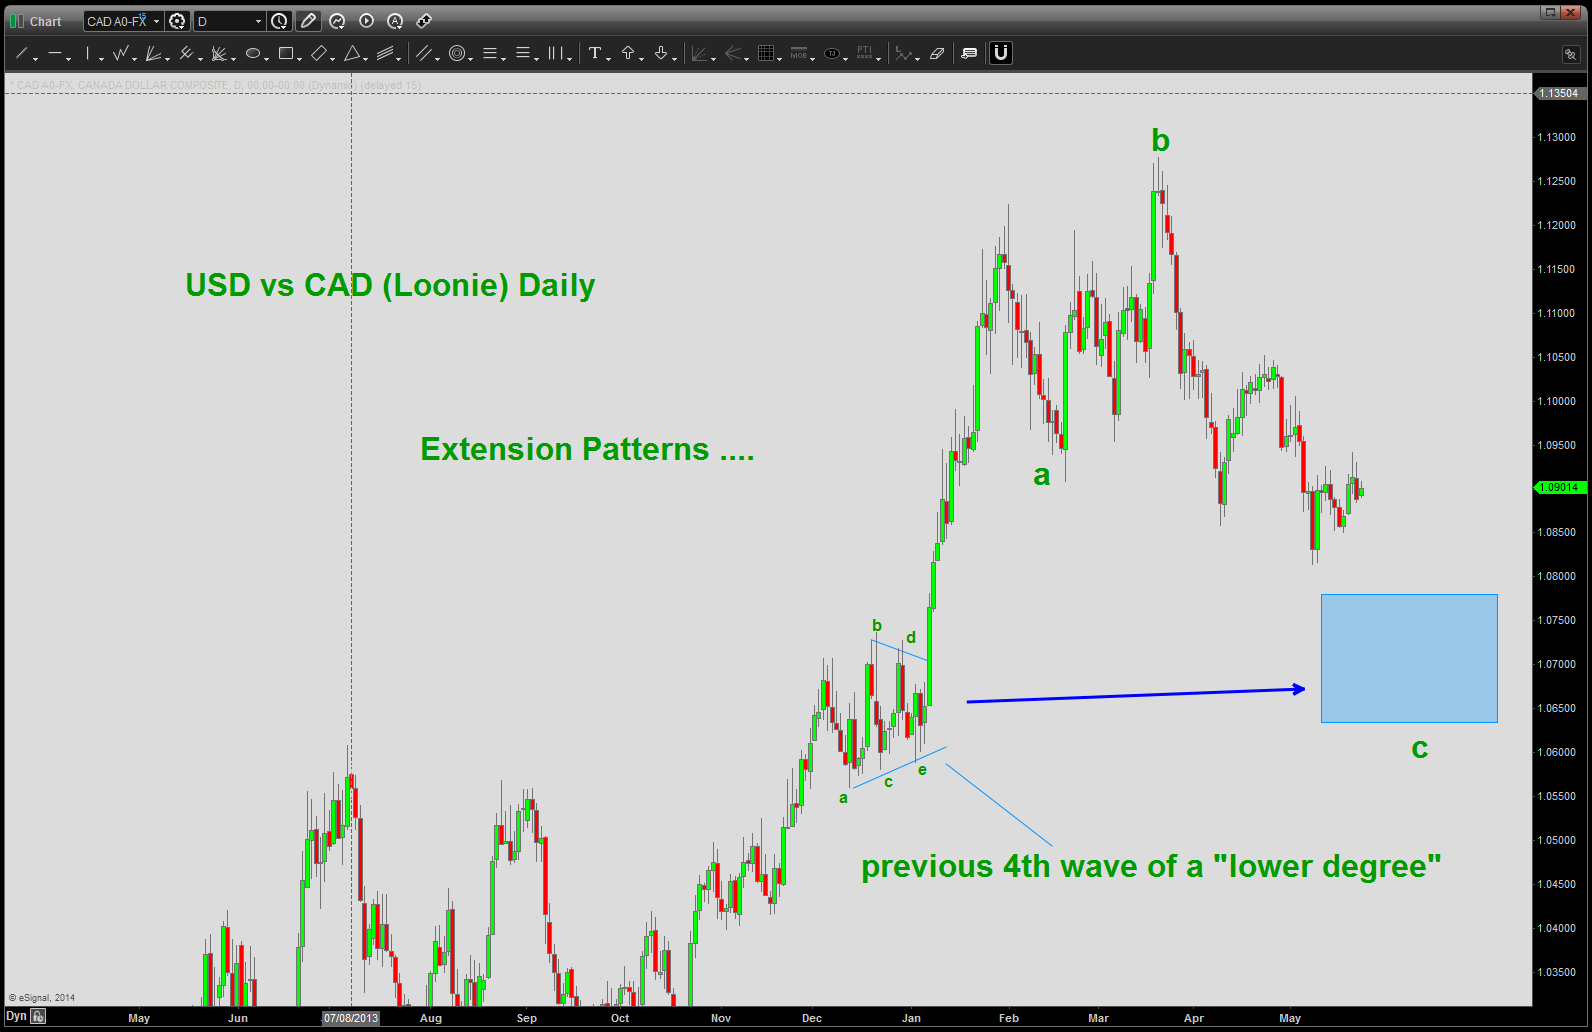
previous 4th wave triangle of a lesser degree lines up w/ shaded blue area
4. now, we are going to add in some extension PATTERNS. Note, we are starting the extensions from wave a and have the .14142 and 1.618 extensions right in our shaded blue area and then we do an extension from the last low in/around 1.080 to complete the 3 drives to a bottom a shown by the black arrows. note – all of these extensions are taking us into the blue shaded region.
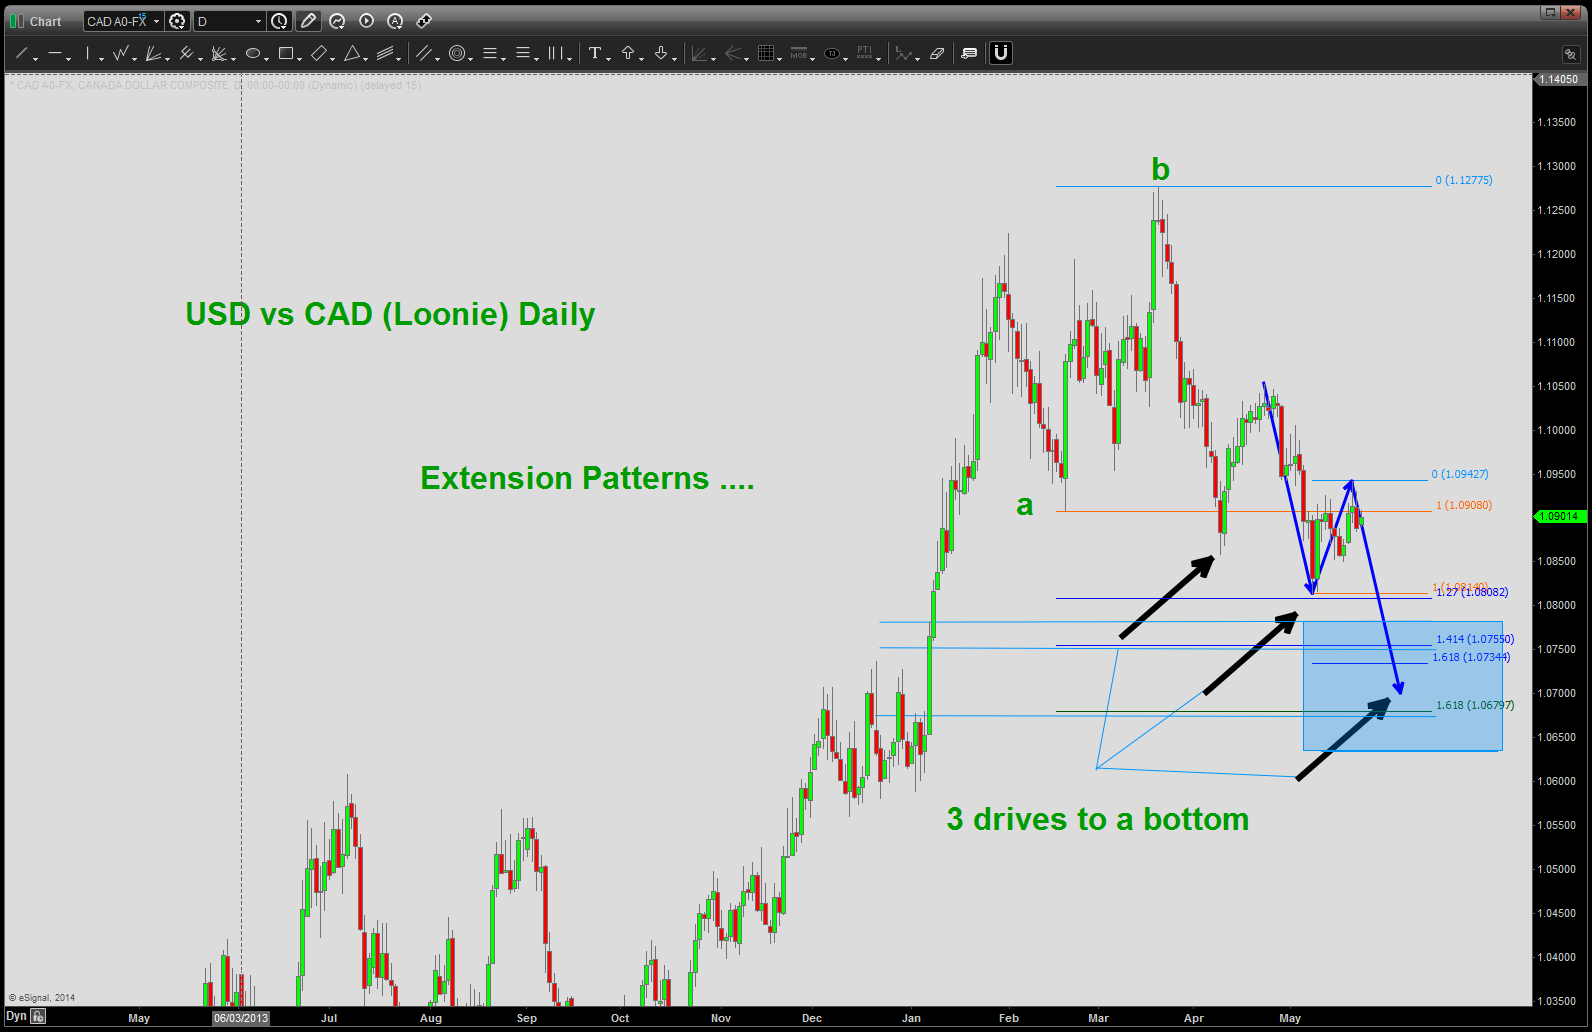
extension targets
5. do retracement grid.
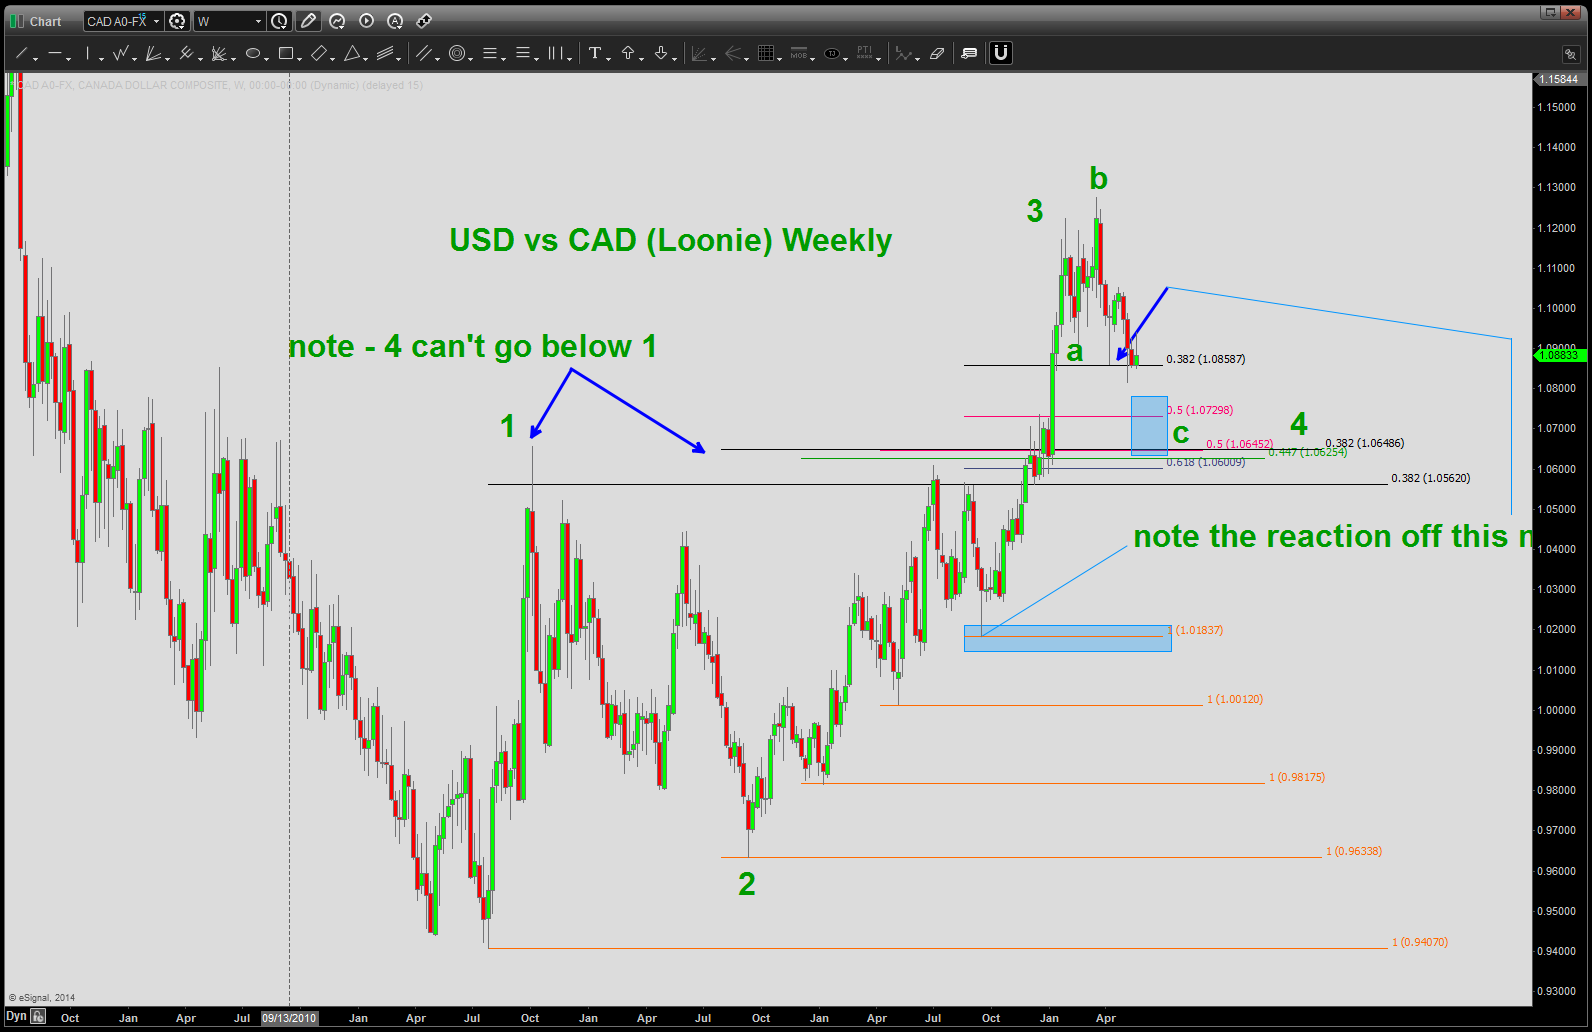
retracement grid and note the RULE that 4 can’t go below 1
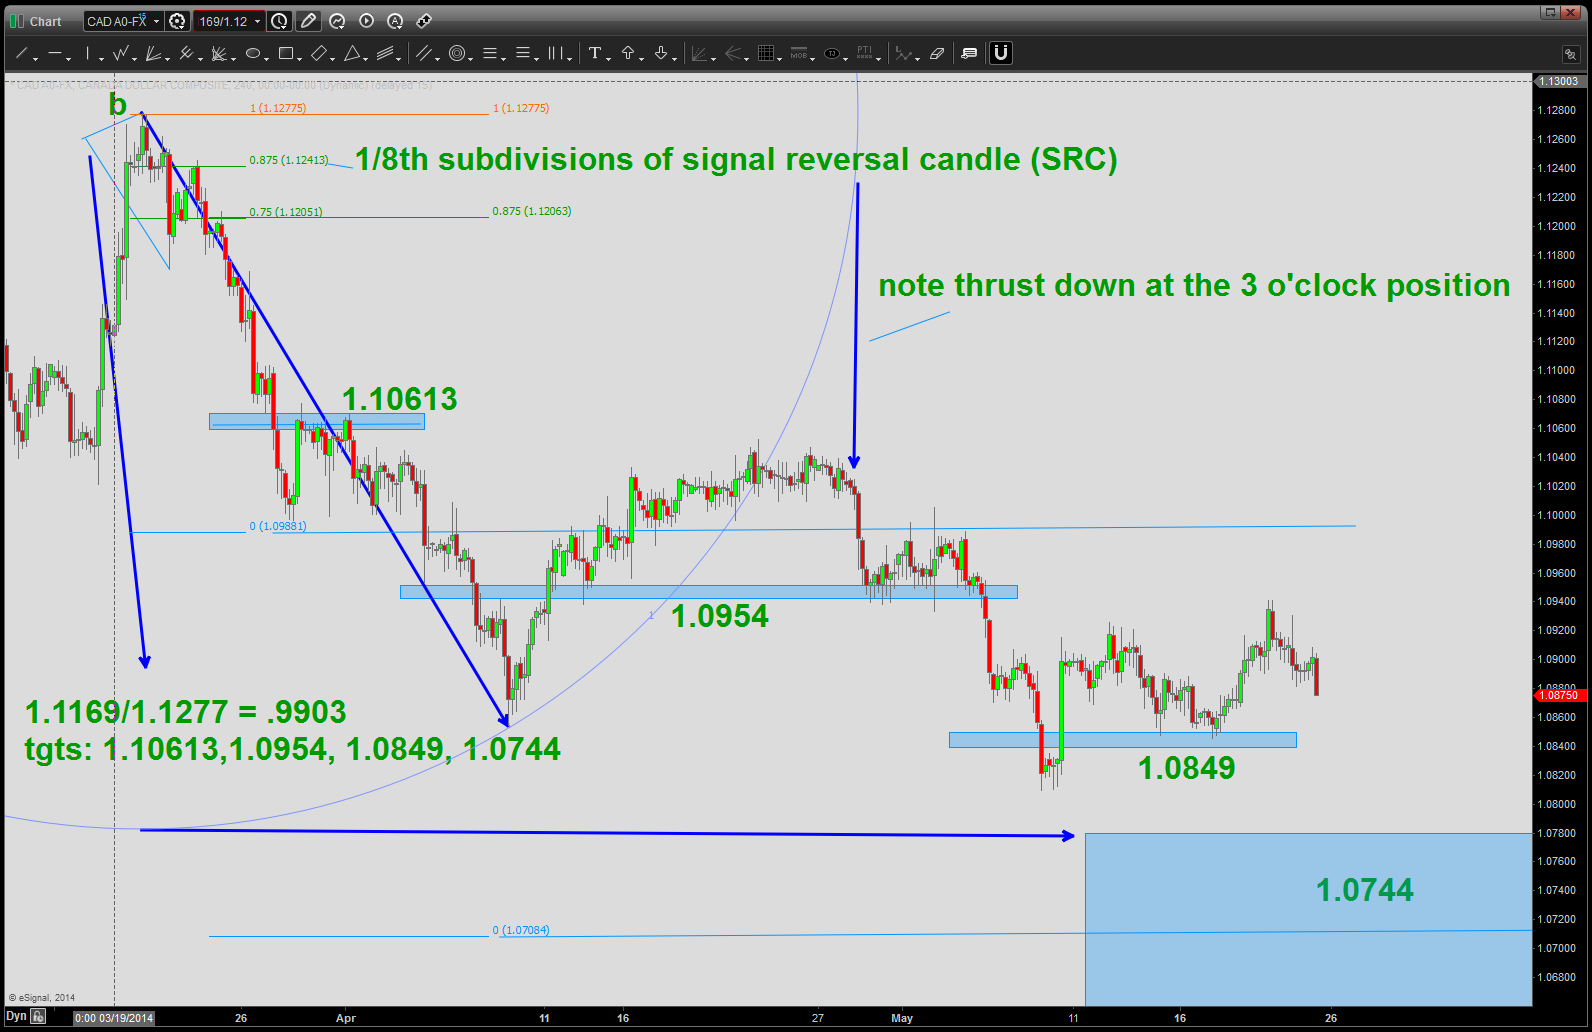
6. do other stuff that nobody else believes works …
7. I want to mention is how the USD vs LOONIE used to be inverse/opposite and was a good indicator to look for a SELL index and BUY USD vs LOONIE. That relationship, for whatever reason is synced. Believe it might come uncoupled sooner or later but make sure to keep an eye on it.

8. here is the FXC ETF – might have bottomed?
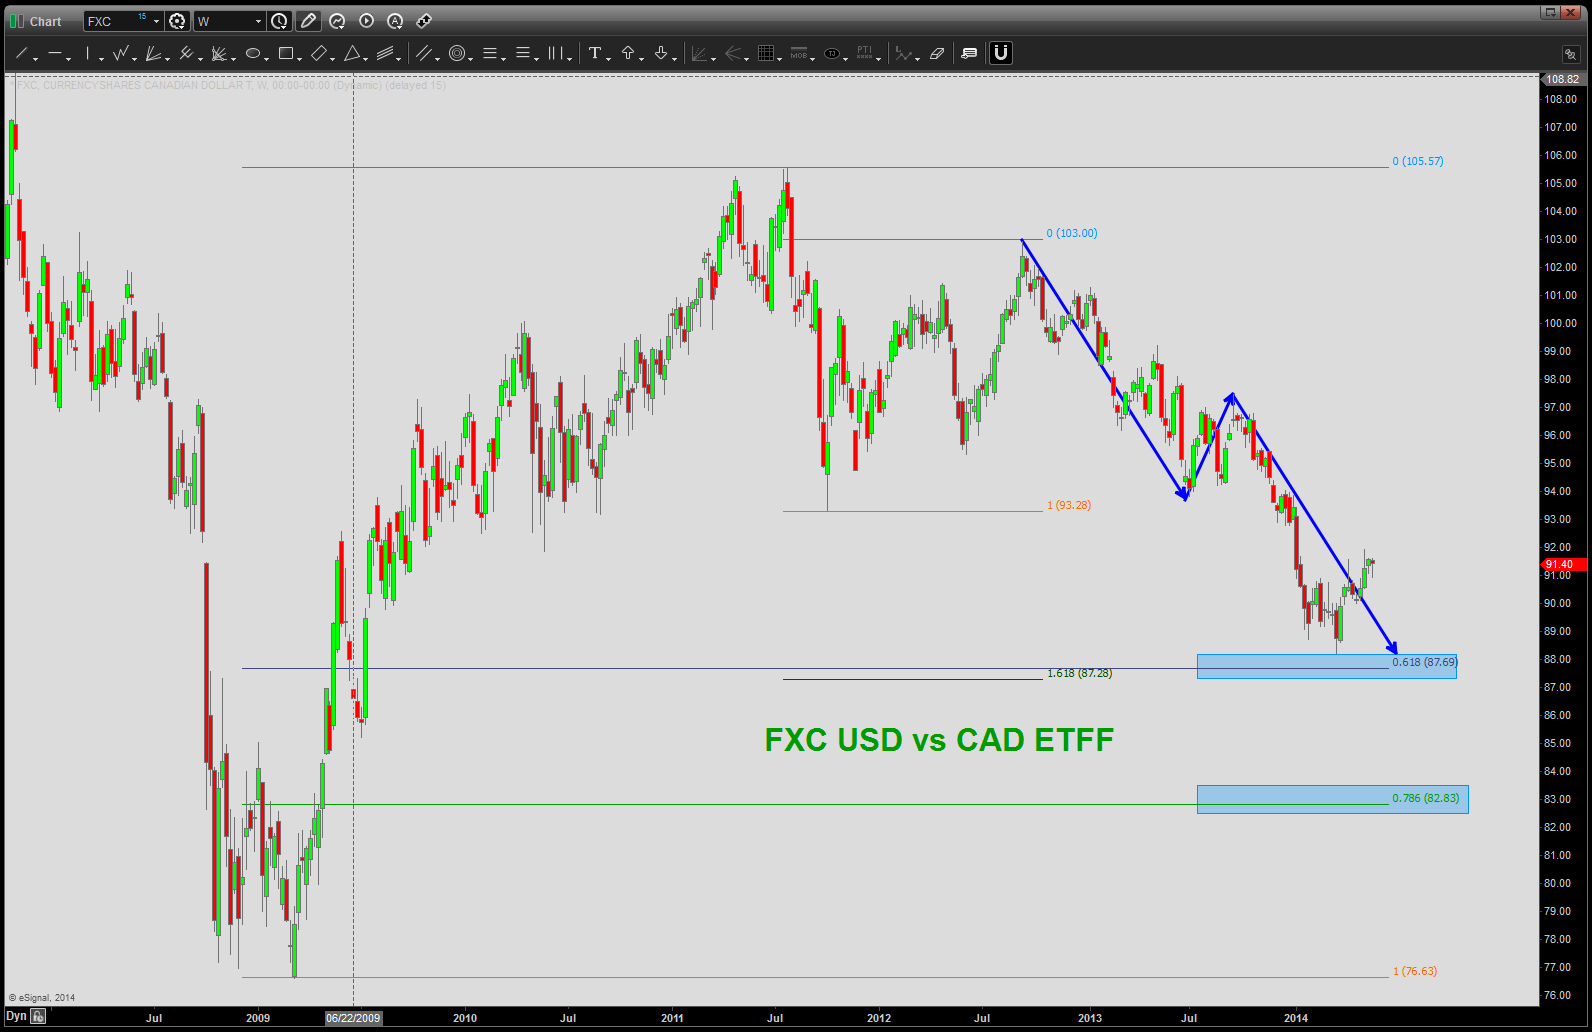
FXC
9. RSI weekly and daily
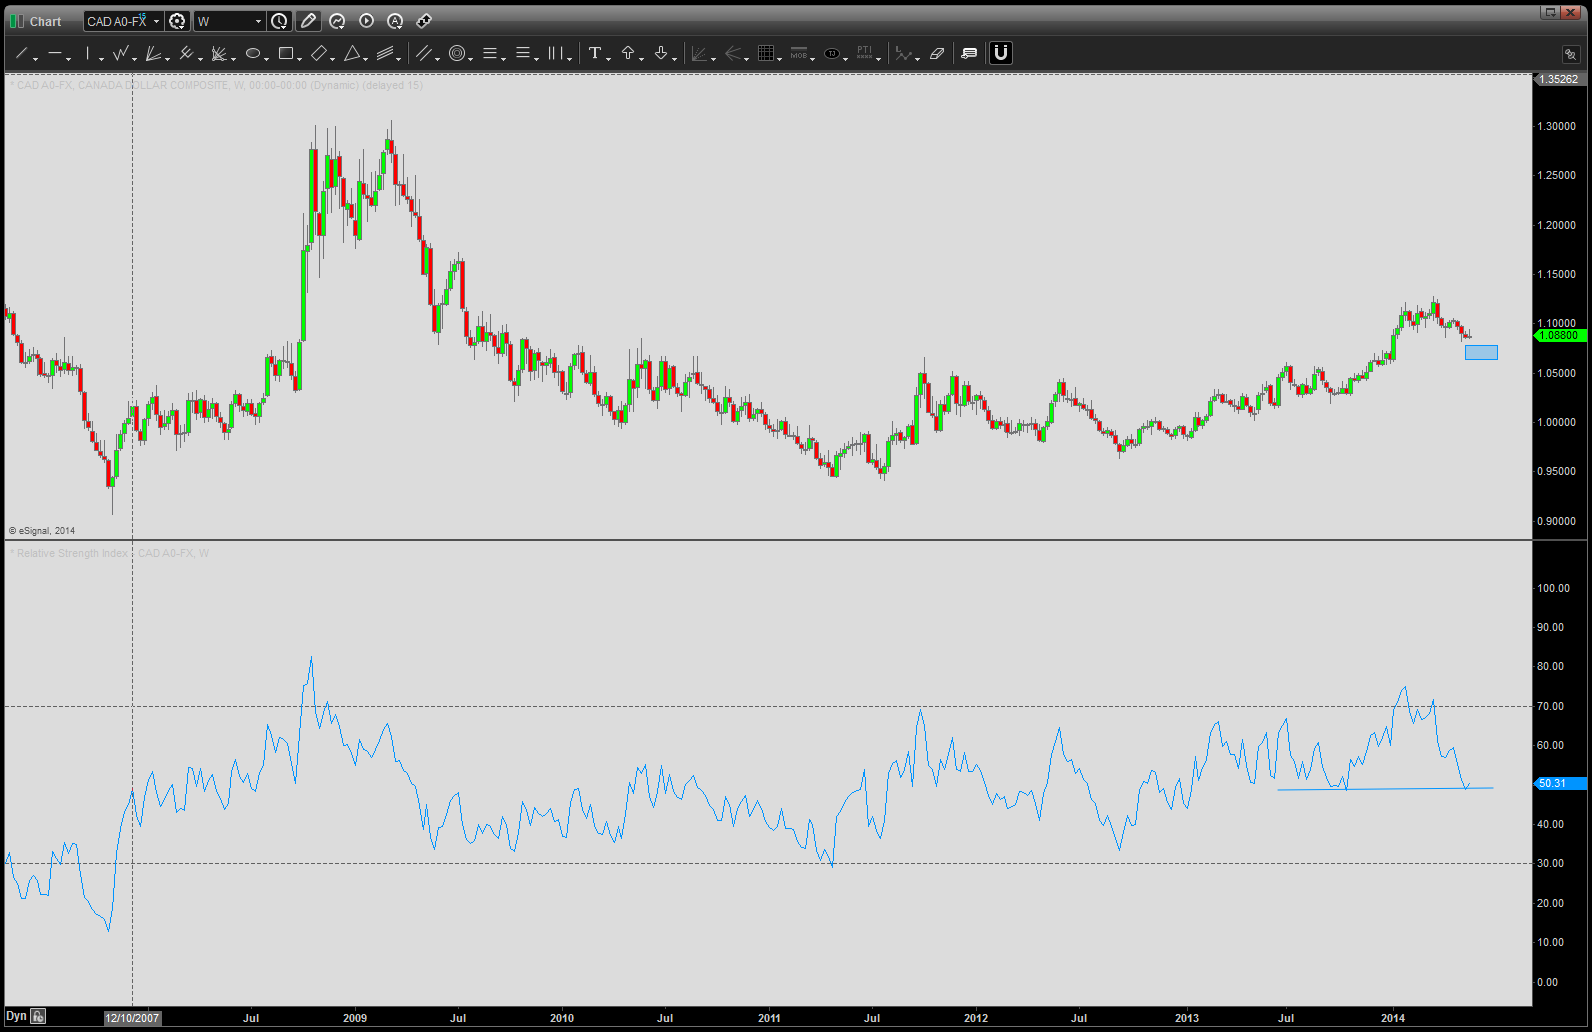
RSI weekly
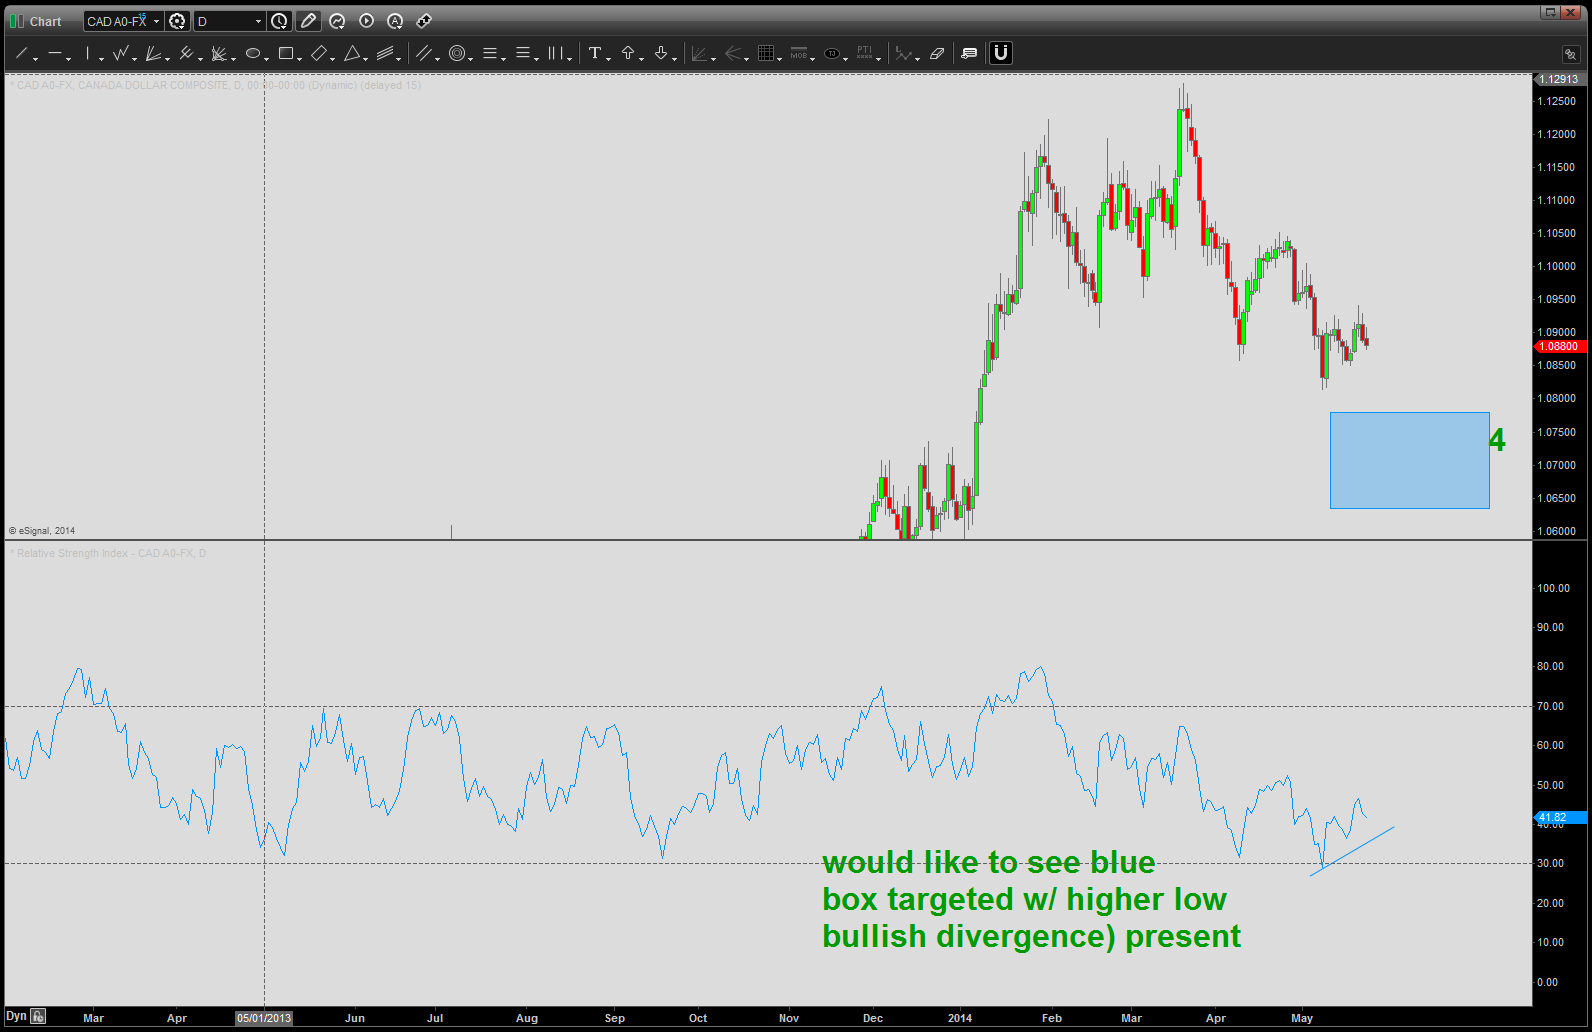
Daily RSI
