#hype, #bubbles everywhere, #irrational exuberance, #caveat emptor for $TWTR
certainly could be quite the story if Twitter marked the top in the market …
anyway, below is Twitters first day of trading – no patterns or anything like that, yet but I did want to show you a 1 minute chart and how most, if not all, of the swings were being governed by the numbers that we use …no moving averages, bollinger bands, oscillators or anything like that … just key numbers that put probability in your favor and allow you to work and play w/ your edge.
pretty interesting that it basically closed where it opened …and, I find it also interesting that this amazing IPO occurred when it’s index (the NAZZIE) was DOWN roughly 2% and that it basically closed where it opened … things that make you go hmmmmmm
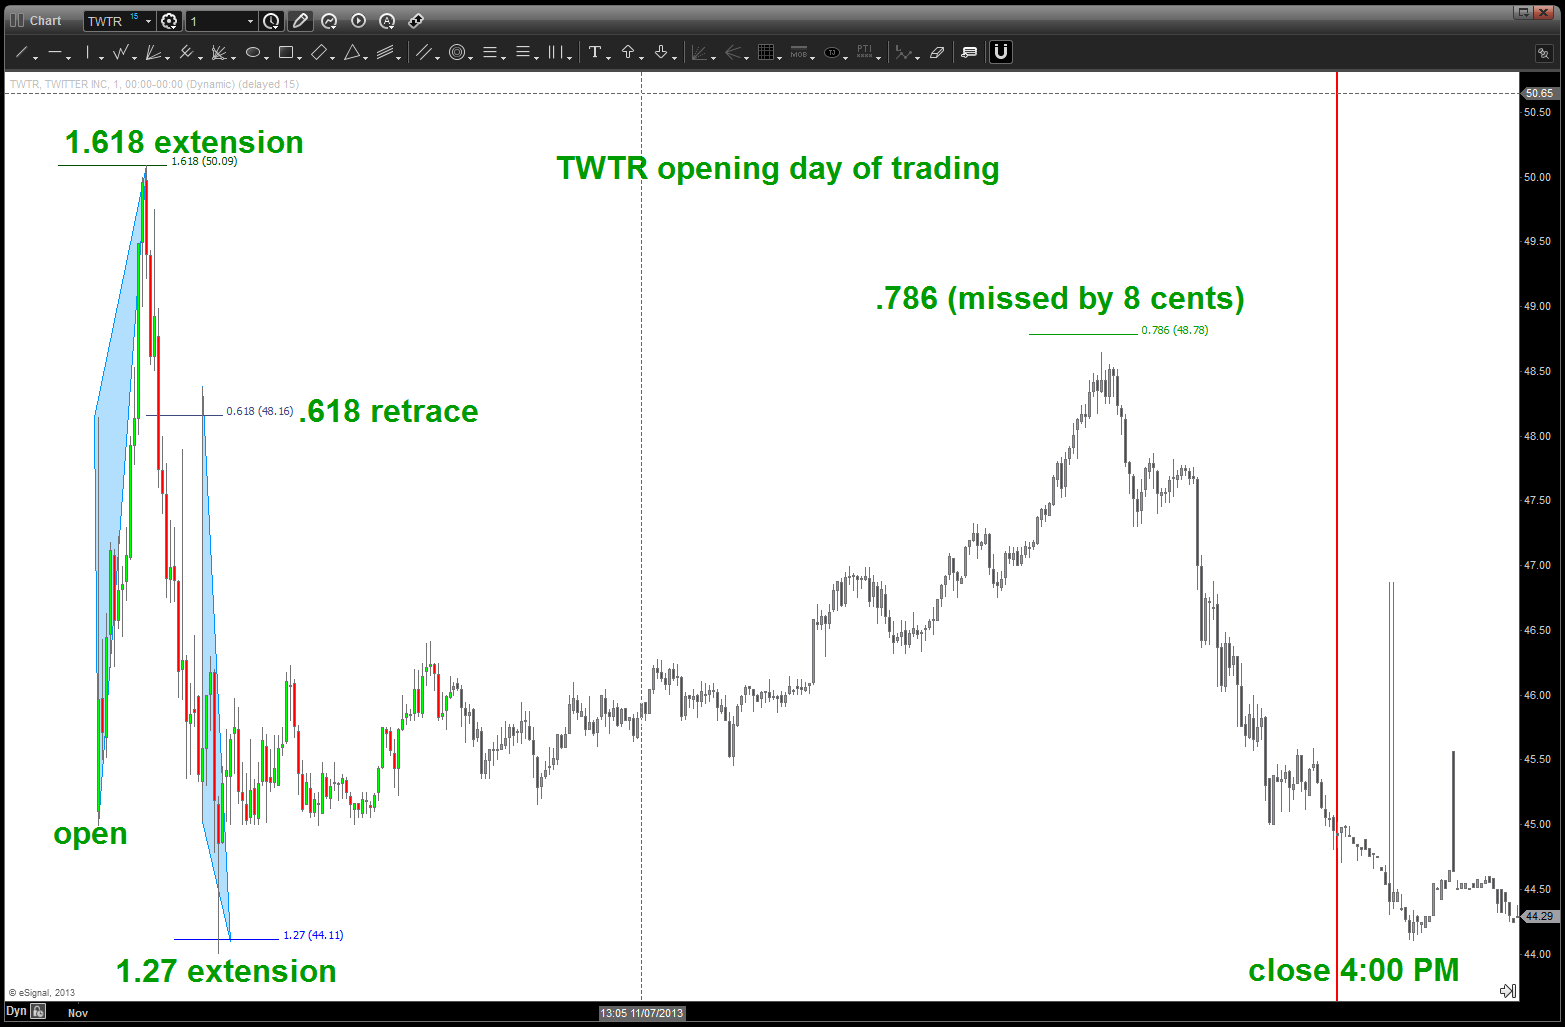
TWTR first day of trading intraday chart
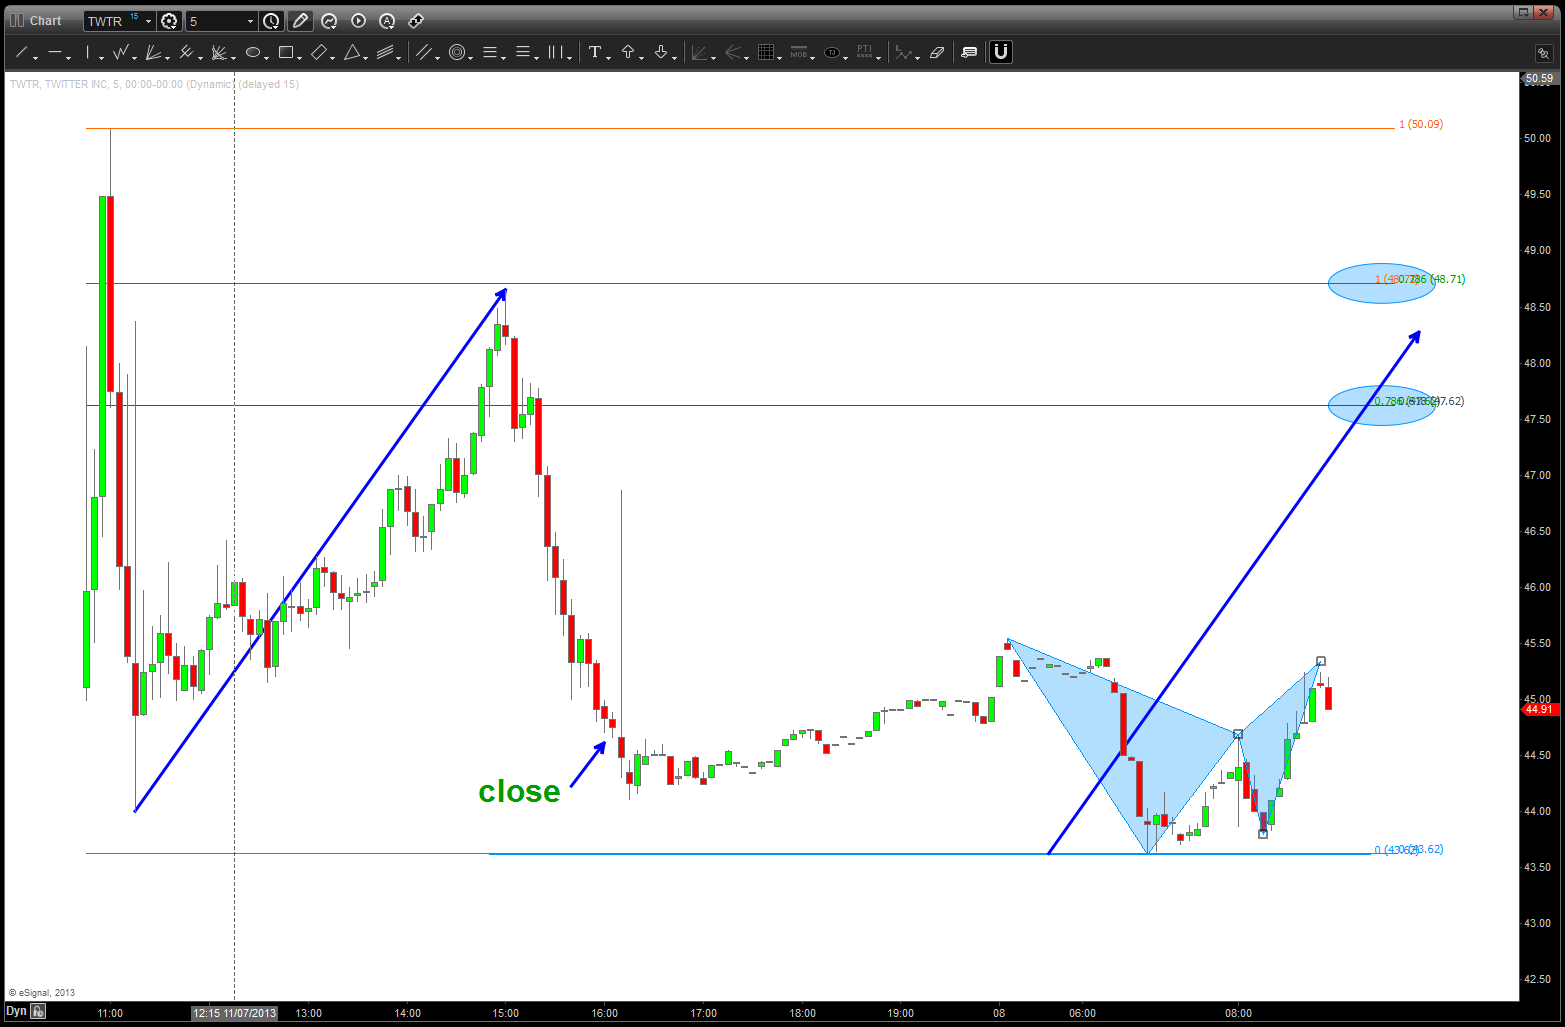
TWTR second day of trading and premarket
note, a nice little SELL pattern in the pre-market….just saying. upper targets (note w/ blue ellipses) are where the “should I stay or should I go” will come into play …
B
