Sir Issac Newton and $AAPL Fell From the Tree
Had another opportunity to post for JC on $AAPL. Please see: http://allstarcharts.com/bartelloni-parabolic-advances-and-their-devastating-corrective-moves/
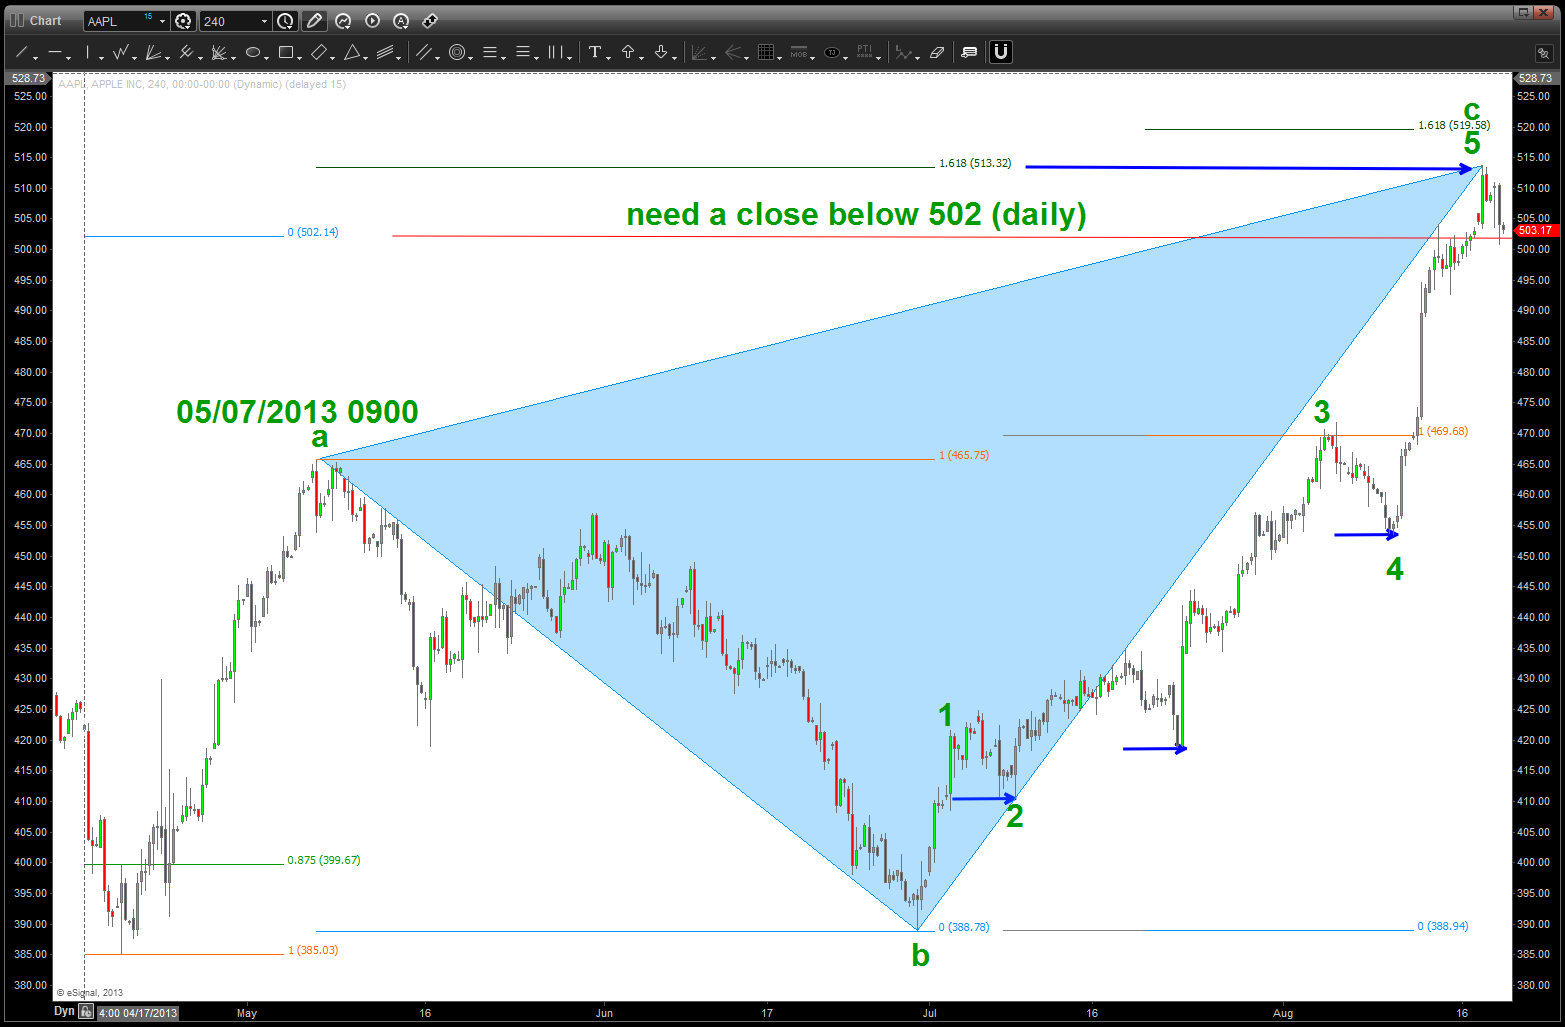
Let’s revisit and then ask where do we go from here….the charts below are the basic geometry that we learned in elementary school on drawing arcs and connecting three points to form a circle. Also, some log-counts and a host of “other” geometry went into looking for the 700 ish to be important. (All of these charts are real time w/ no “could have, would have, should have)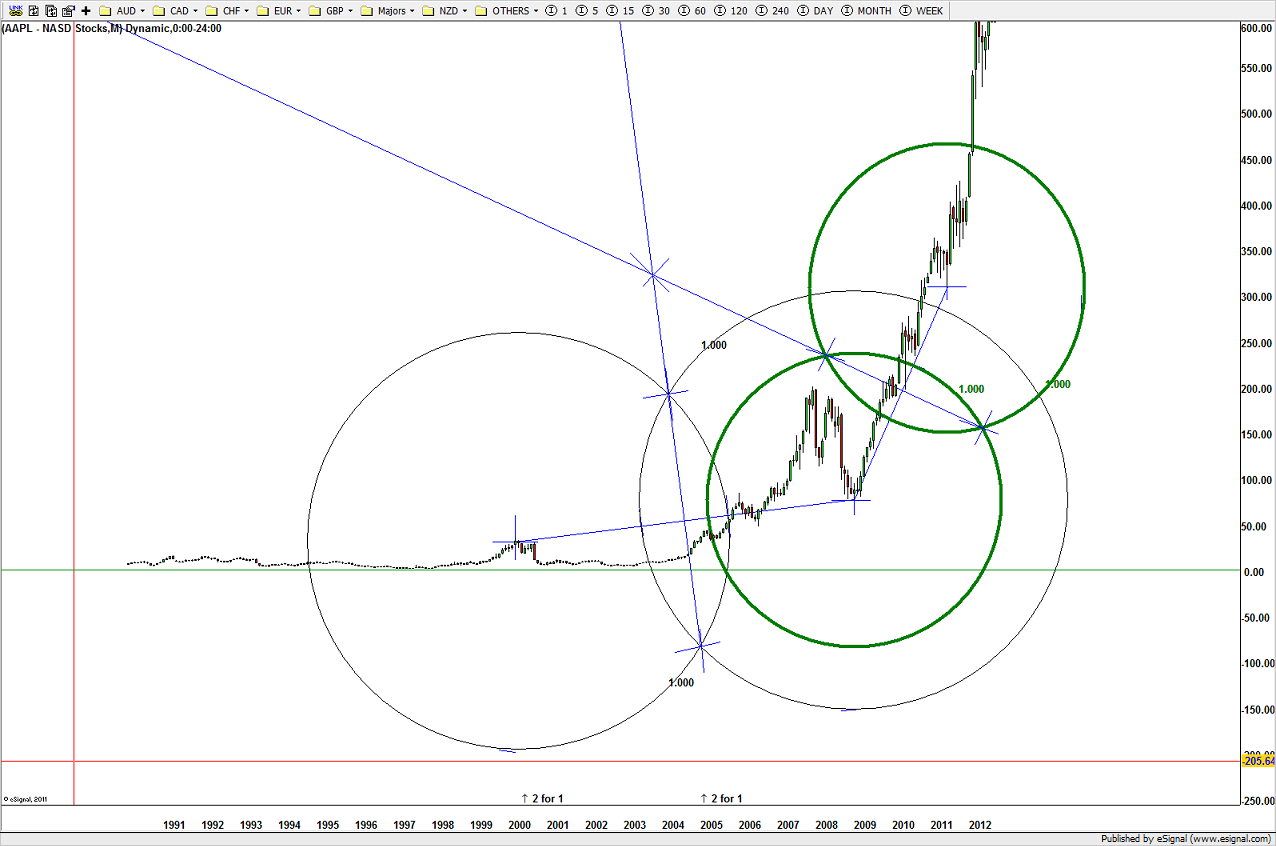
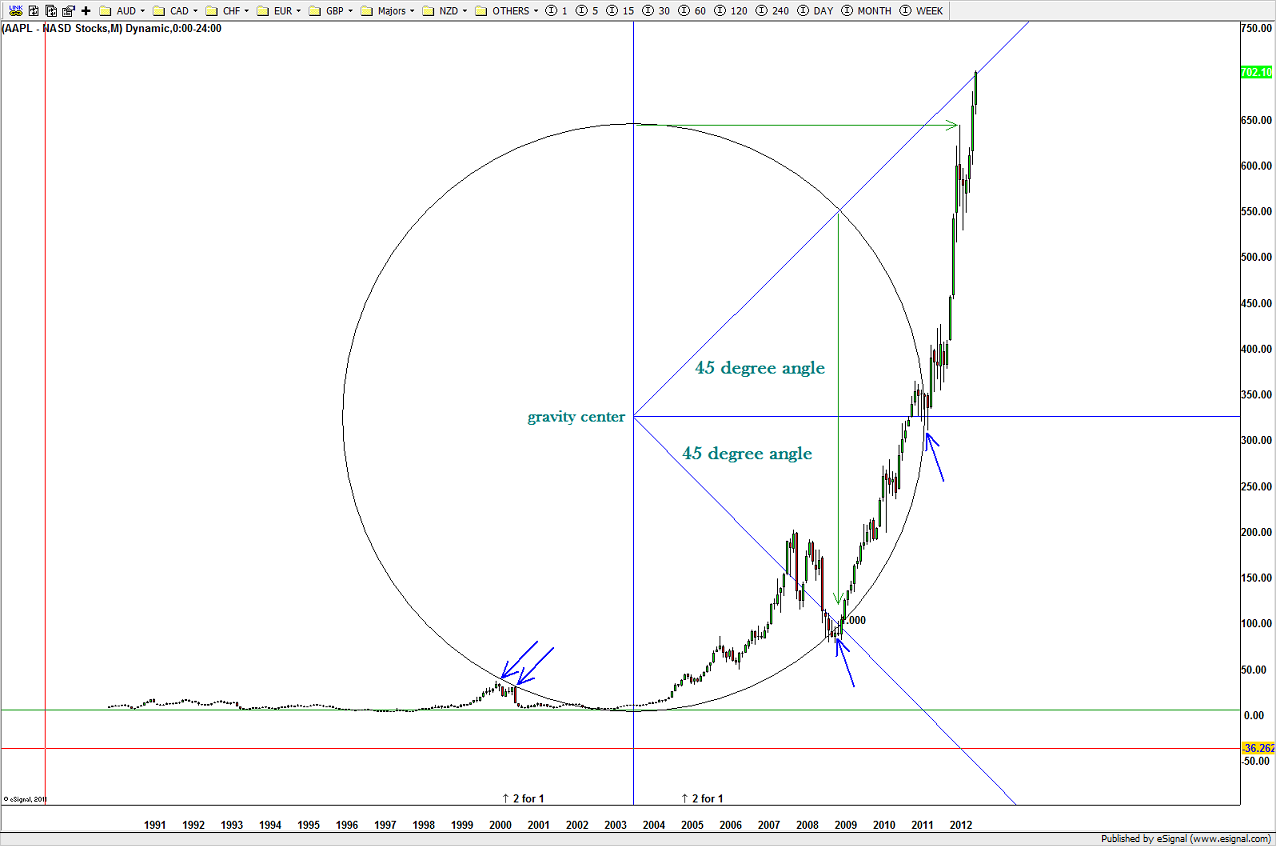
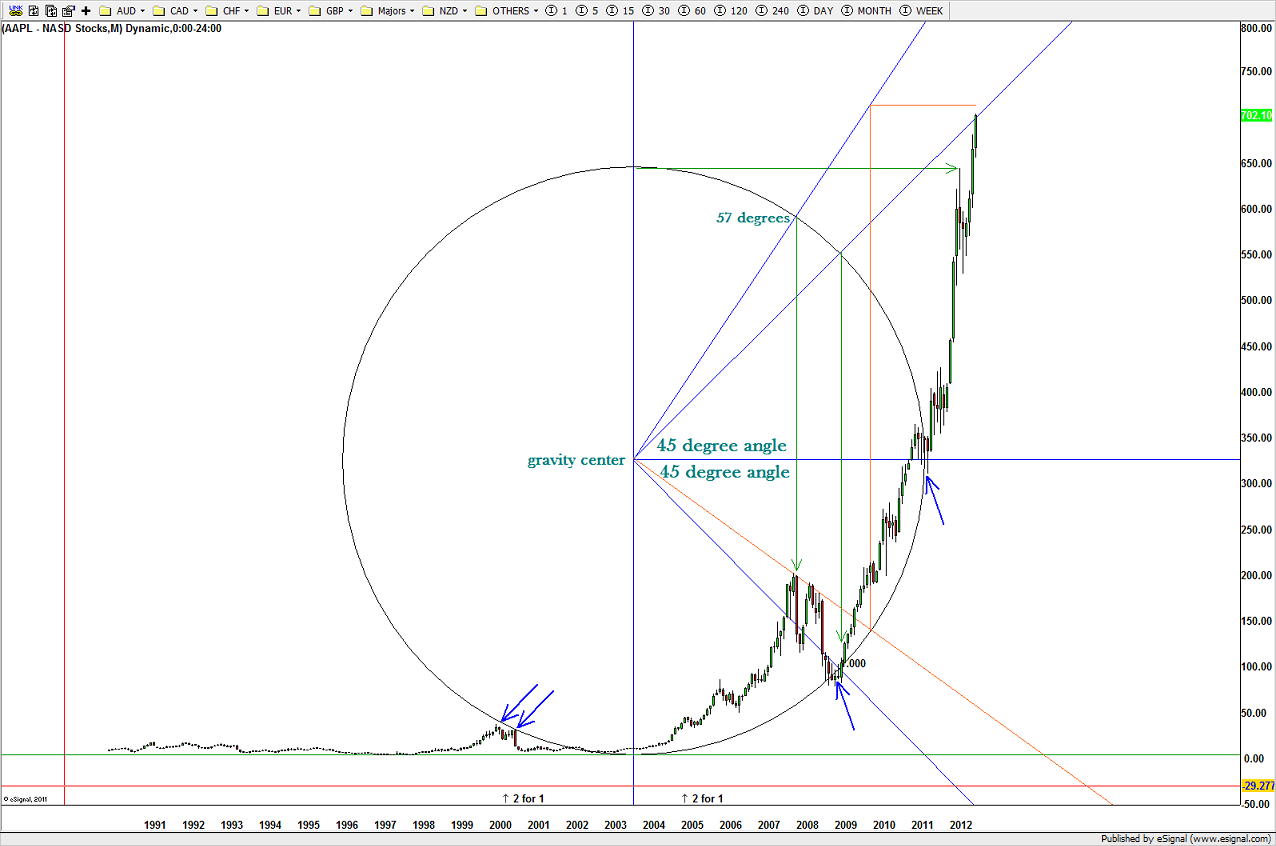
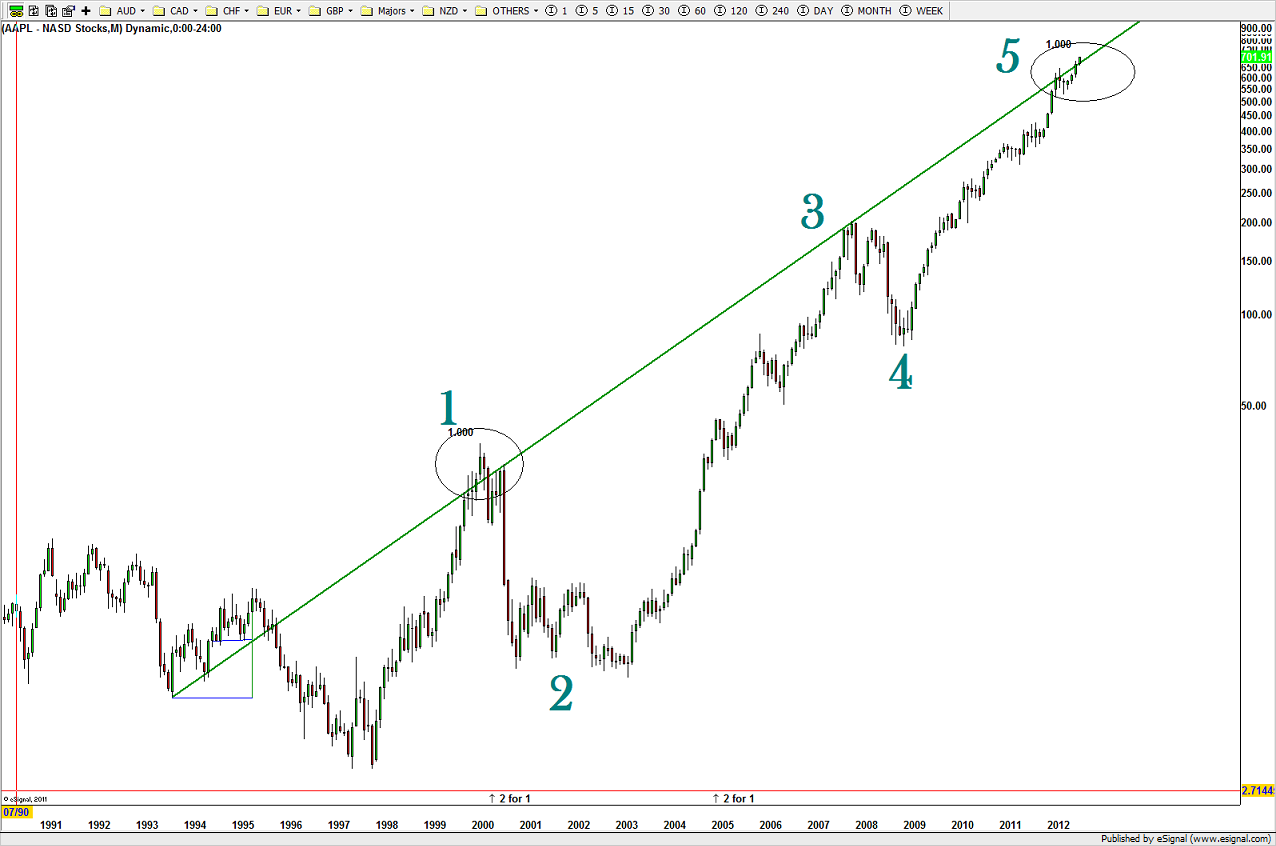
From here, we all know what happened. How about now? Note, a strong rally has occurred, however it is in the same PATTERN (inverted) that occurred in 2008. the market exploded in late 2008. Is the same, except inverted, going to happen at current levels? Again, stay tuned ….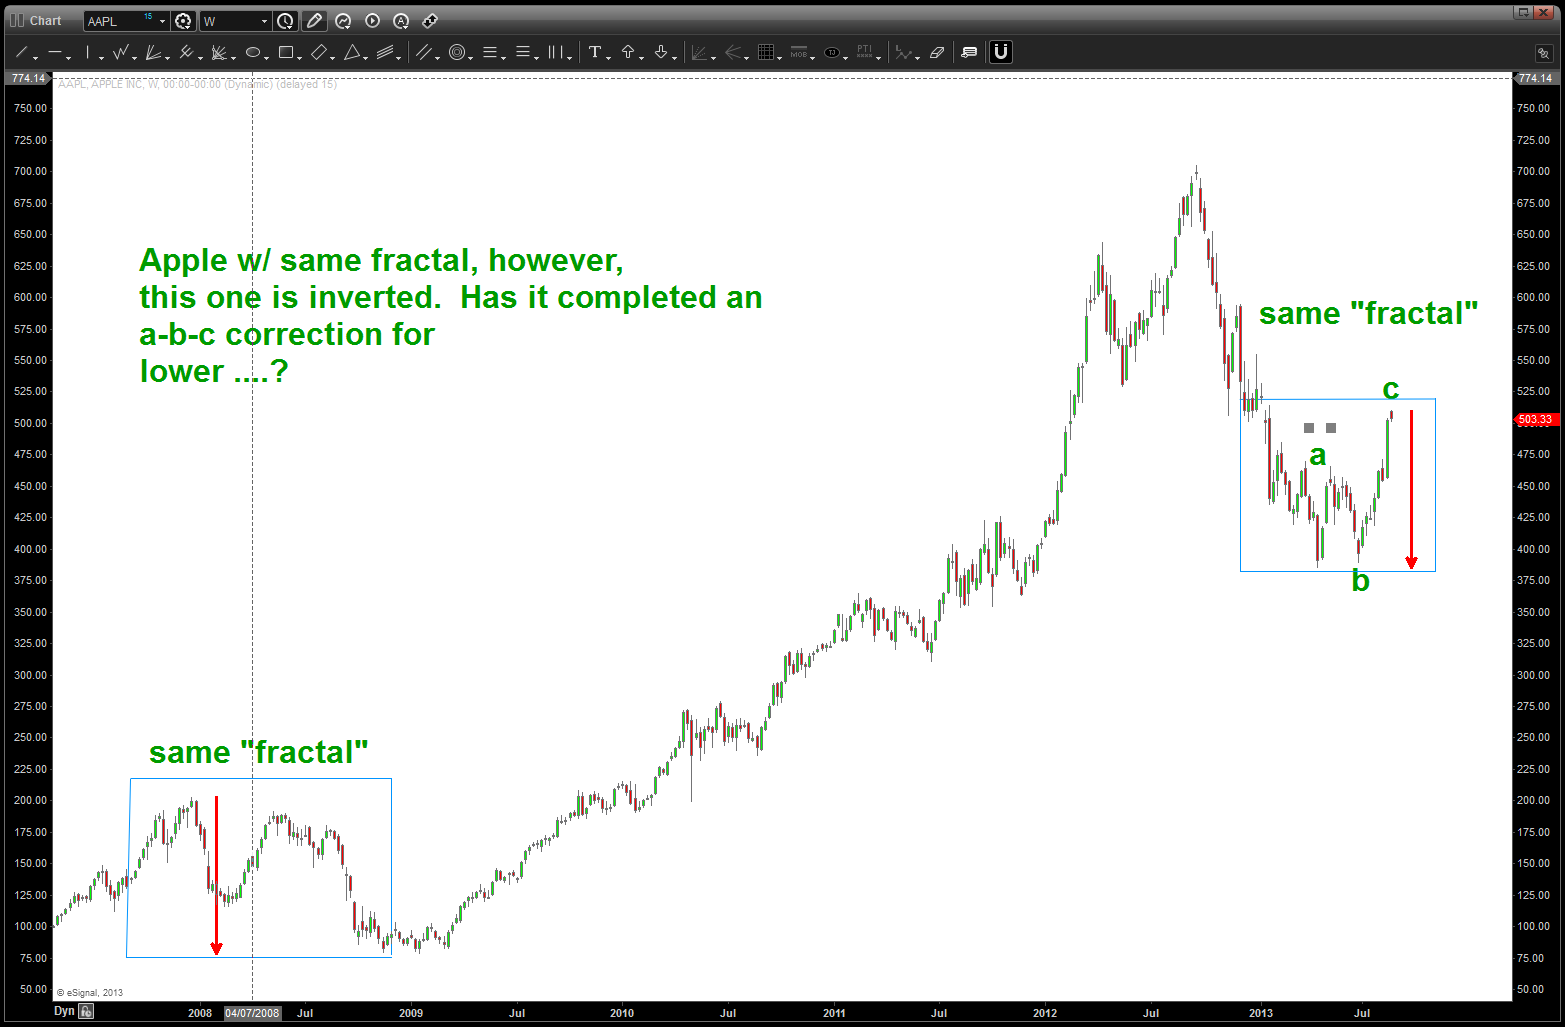

Pingback: TSLA, Patterns and dogfighting an F-14 in afterburner (check fuel!) | Bart's Charts
would love to know if this makes sense! LOL
Pingback: AAPL and GOOG patterns completing … | Bart's Charts
Pingback: another chart (Biotech IBB ) w/ a parabolic rise … Sir Isaac Newton is STILL yet to be proven wrong | Bart's Charts
Pingback: the method behind finding the EXACT top in IBB | Bart's Charts
Pingback: IBB last bit of juice squeezed out … ? | Bart's Charts
Pingback: Parabolic Moves have NEVER ended well … | Bart's Charts
Pingback: Apple Nearing Major Wave Completion: AAPL Price Targets | See It Market