Fixed Income Revisited
First off, I would like to thank JC Parets of http://www.allstarcharts.com for finally pushing me to start blogging … “JC, thanks….”
JC gave me the unique opportunity to “guest post” on his blog site a couple times and one of my earliest posts was the following: http://allstarcharts.com/are-interest-rates-at-a-key-inflection-point/
Let’s revisit fixed income, as it is getting, rightly so, some significant exposure……
As you can see, we got “lucky” on our pattern at the top in/around the 153 level. One thing I was seeing and now I’m simply putting it out there is this count might not be complete. When we look at the long term chart we can see that we are at an extreme in price and time for corrections in this 30 year BULL MARKET and, going down to a weekly chart, we can see an orderly pullback in a “a”-“b”-“c” corrective move. Perhaps a little lower and then, believe it or not, a potential rally to slight new highs ….? Call me crazy but calling it like I see it. At a minimum, this move is very oversold so a bounce in/around here is a real potential. Stay tuned …..
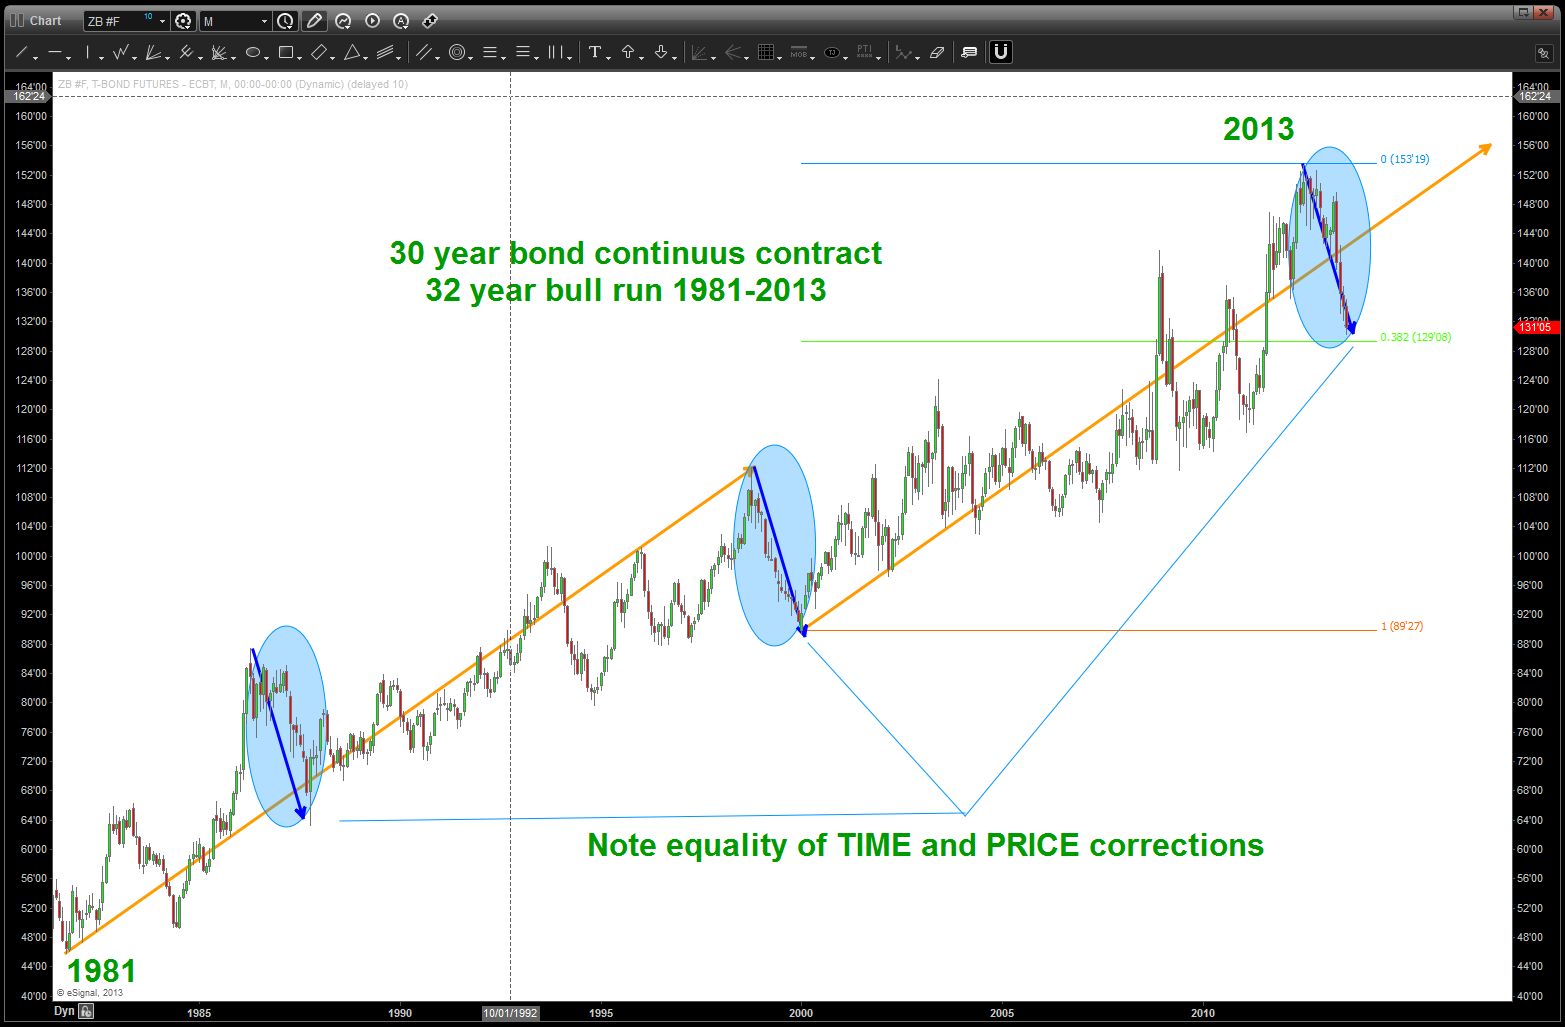
30 year continuous contract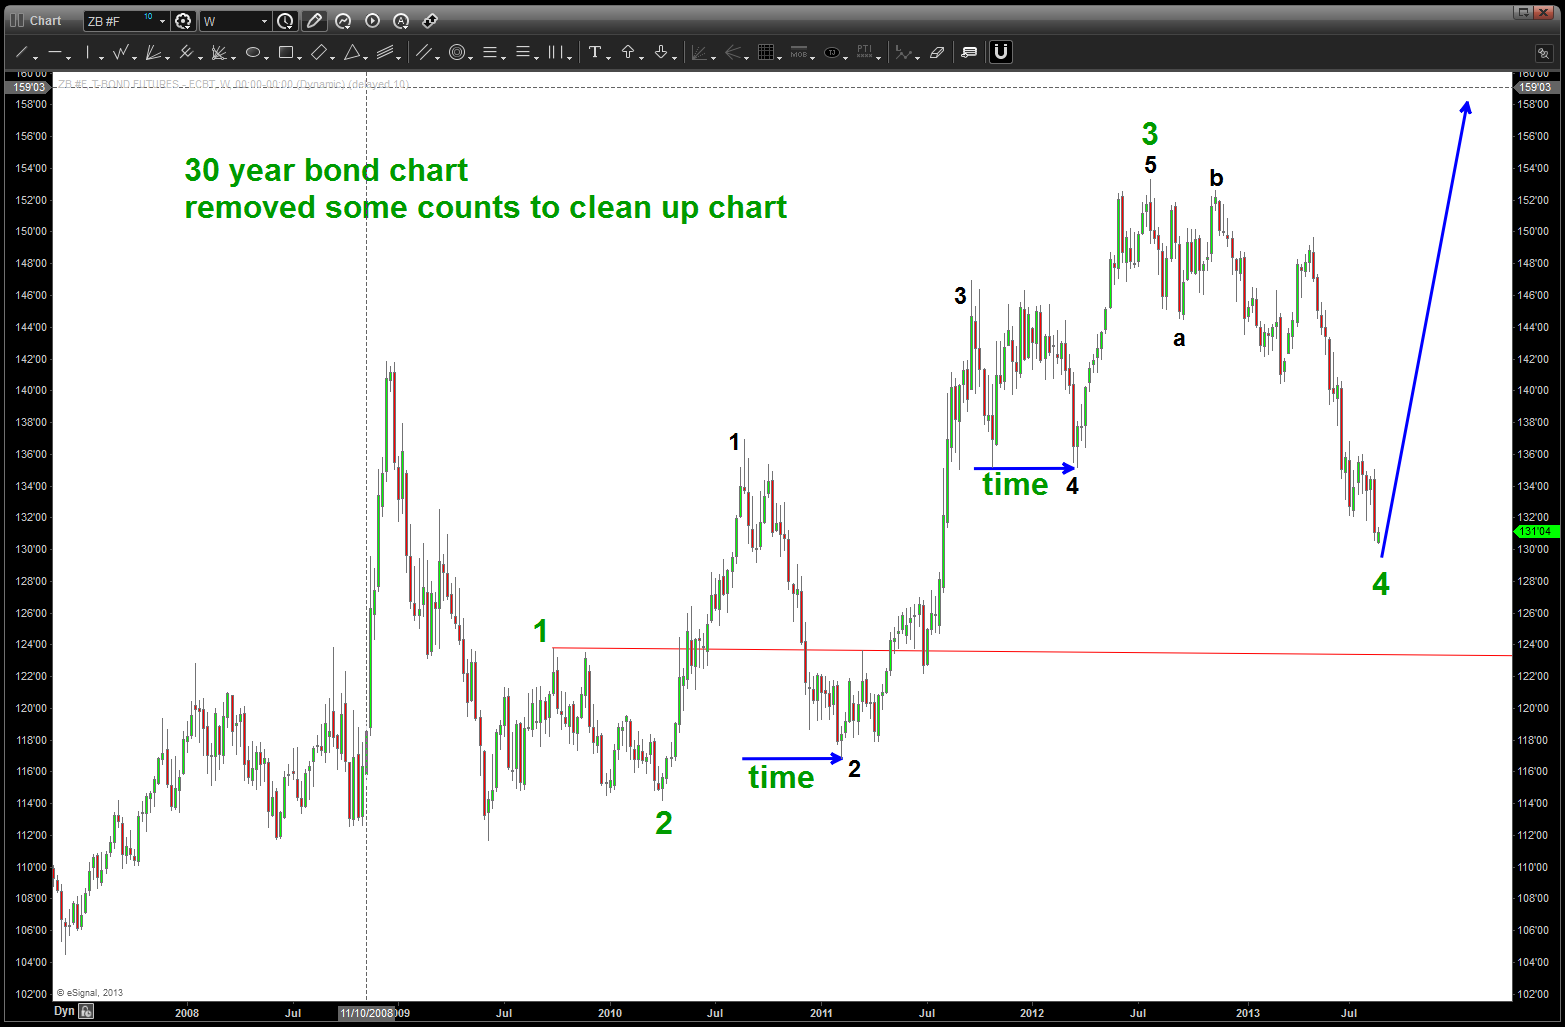

Pingback: Plotting the next move in fixed income … | Bart's Charts