Geometry – March 11, 2025

Tonight, I was taking a peak at MSFT and I was just in the zone and thought – this would be a good moment to post something fun – dare I say interesting – about the ‘right brain’ aspect of Technical Analysis? Man, we should come up w/ a different name …time out.
Back, time for some Fibonacci Fiesta …!
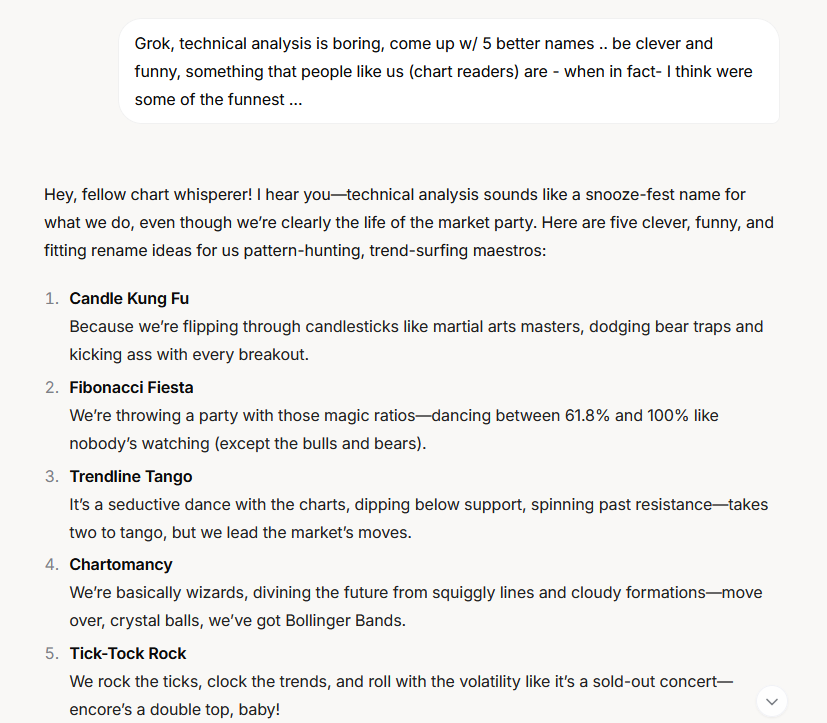
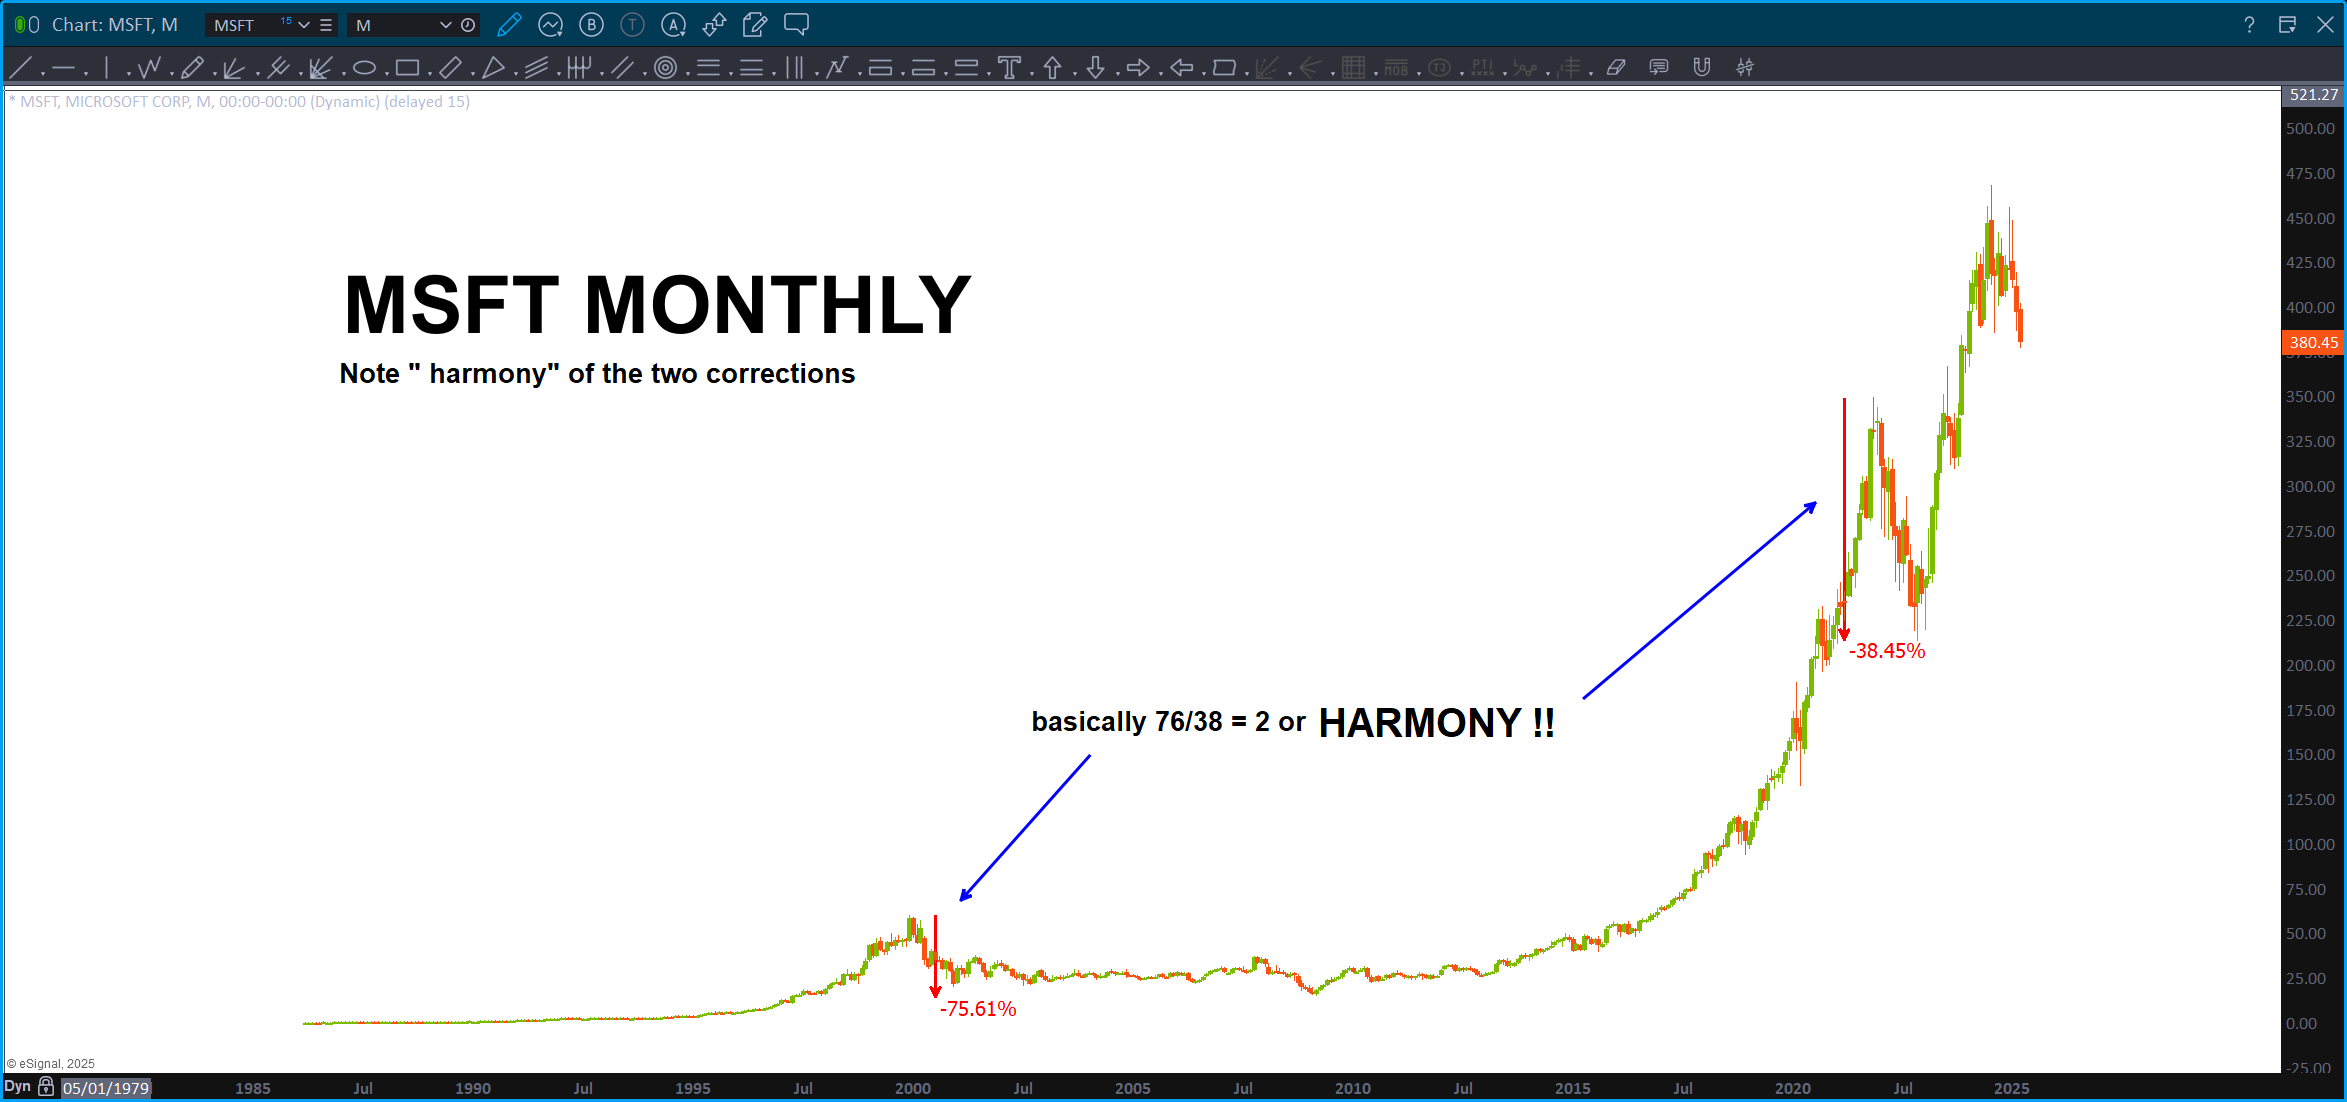
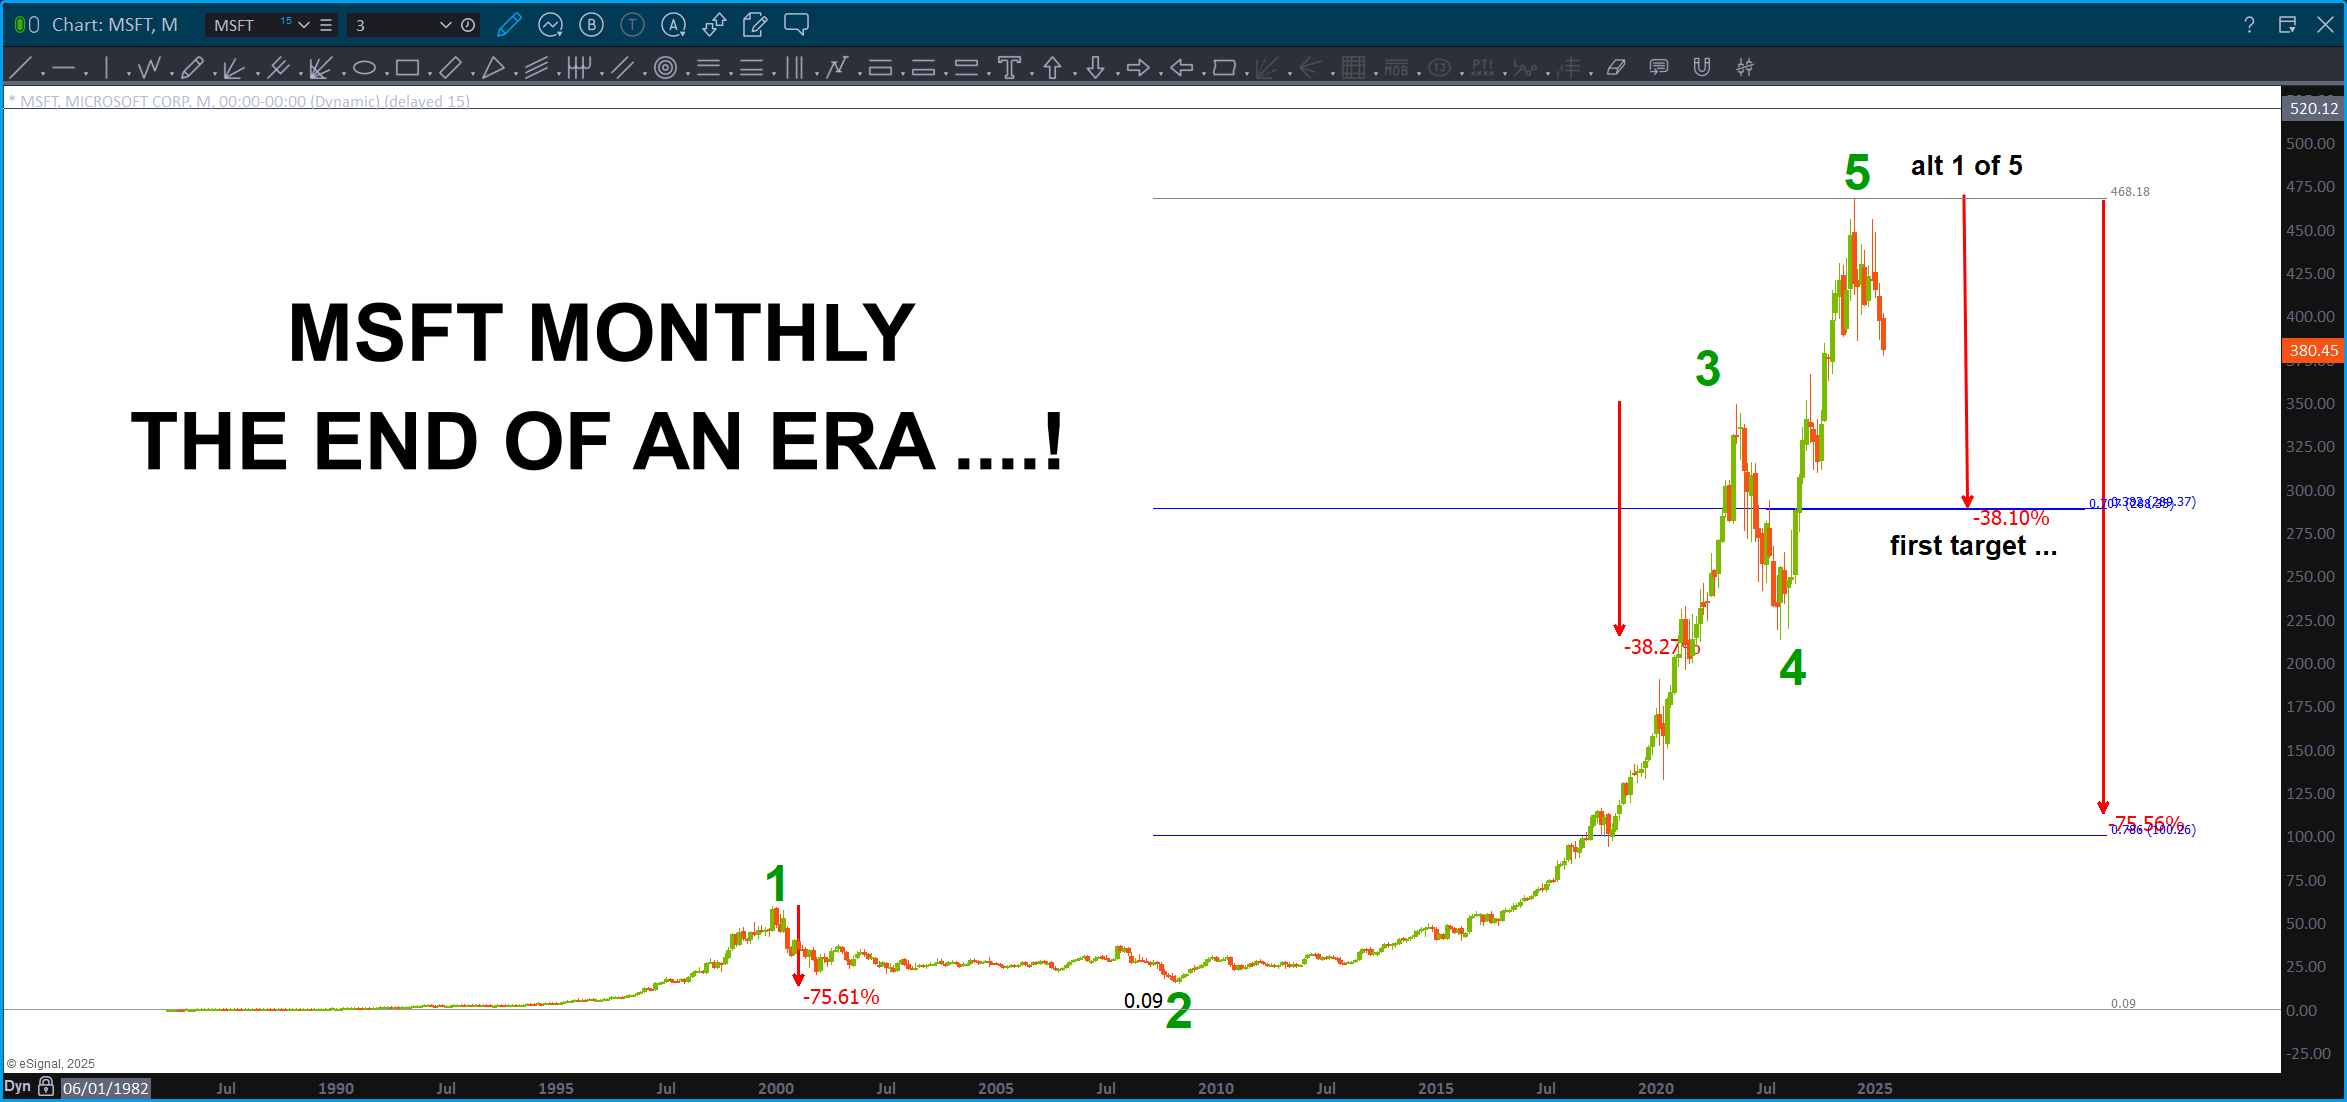
So, I really like to use LOG charts for percentage move corrections and projections – in fact – I just did it w/ the NFLX post. Anyhoo, I noticed that the last “big” percentage corrective move was .382. That doesn’t happen often …
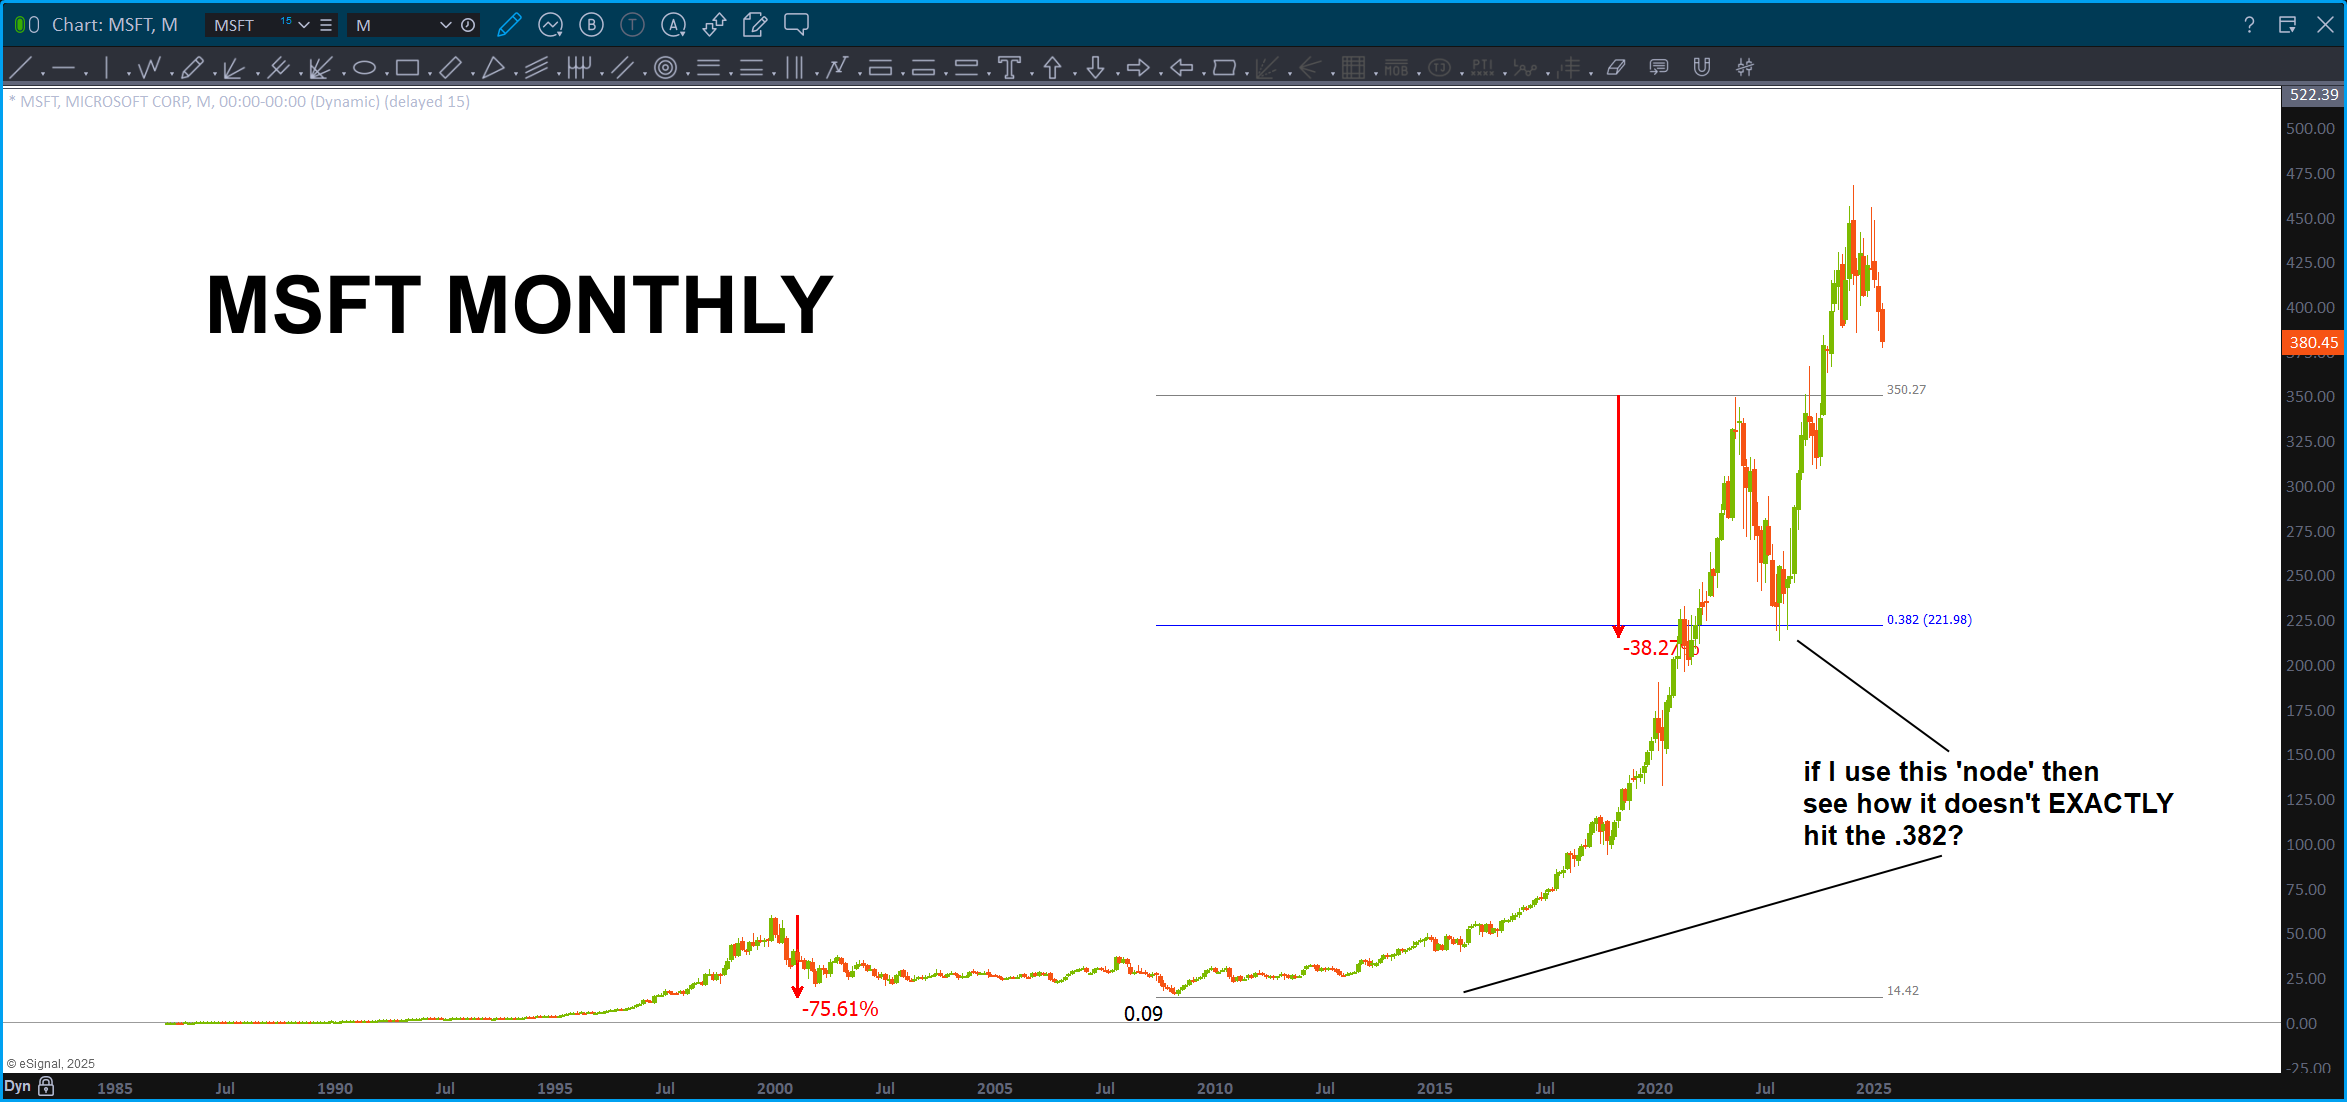
Why is that a big deal? Because now I have the correct ‘node’ to use and that ‘should’ increase the probability for a nice BUY w/ a couple good projections down …
This is how I got the ‘first target’ … amazing when you step back and look at that chart that some MAJOR technological shift is going on right now folks. I’m calling it … you wait. Where am I wrong on this count?
I’m wrong that this is – perhaps – the 1st wave up. OK, sure but I sense/ feel a rough wave 2 down.
Nah – something is up at MSFT or … soon there will be …or, I’m dead wrong! Always told ya my counting was like my golf game folks …

BART,
Are you saying MSFT is maybe due for one more uptick than death spiral after that never to regain?
it looks to have topped and completed 5 waves. The bullish scenario would be this is just a wave 1 of 5 of the 5th … let’s see what plays out, in the ‘near term’ see some big resistance.