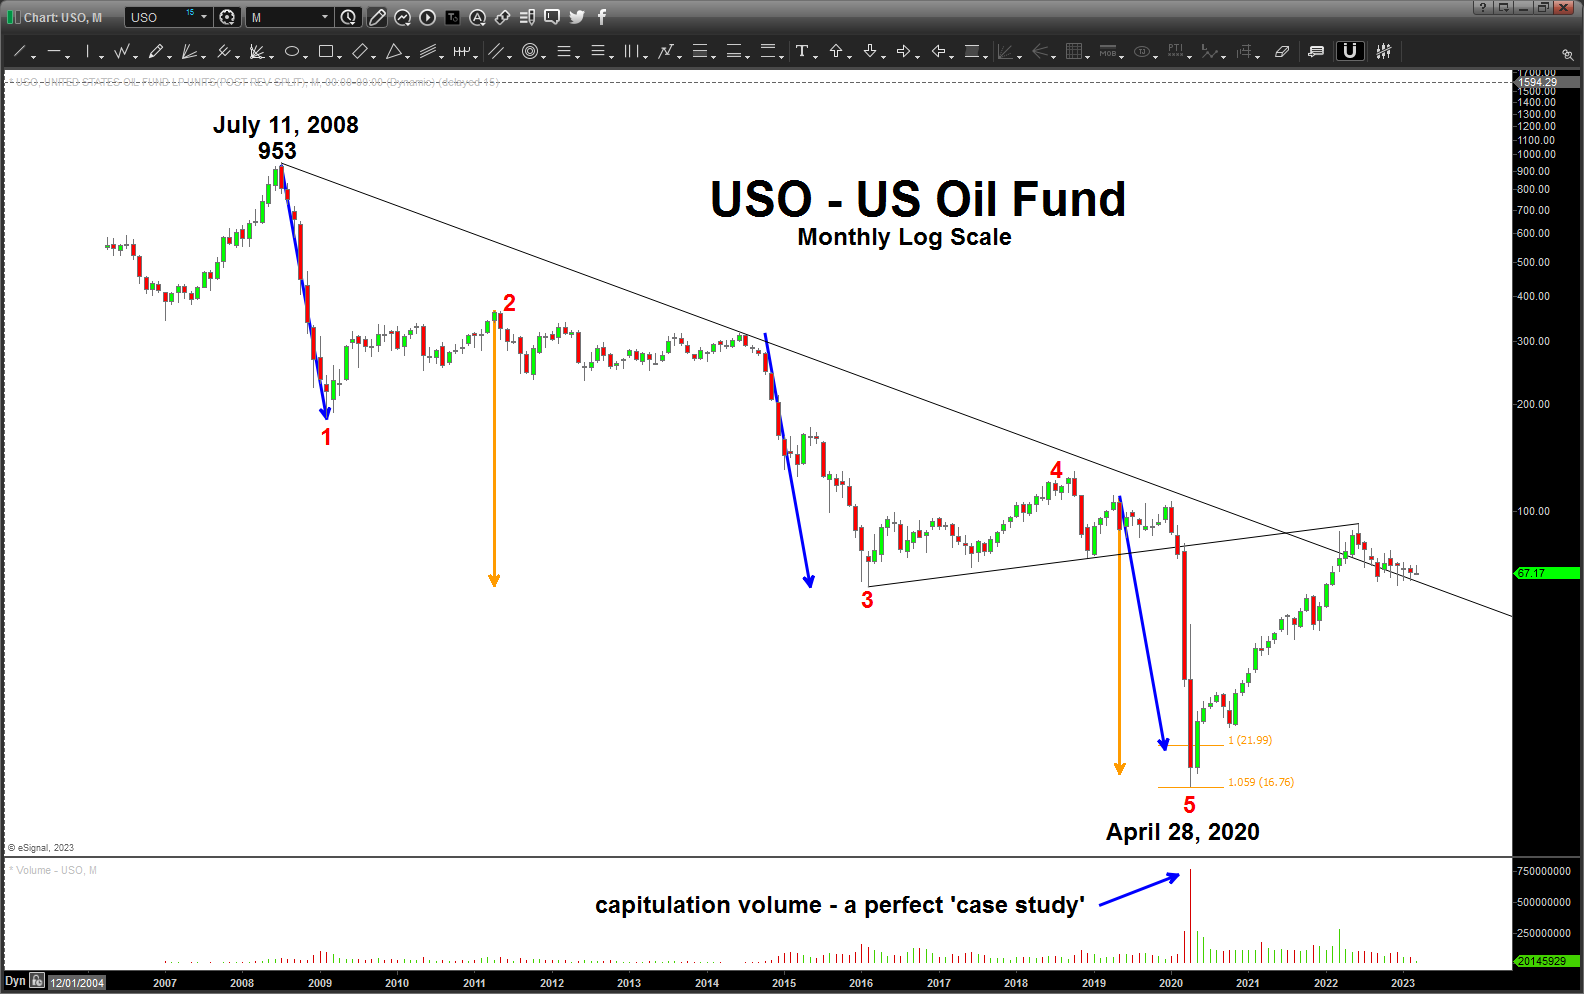
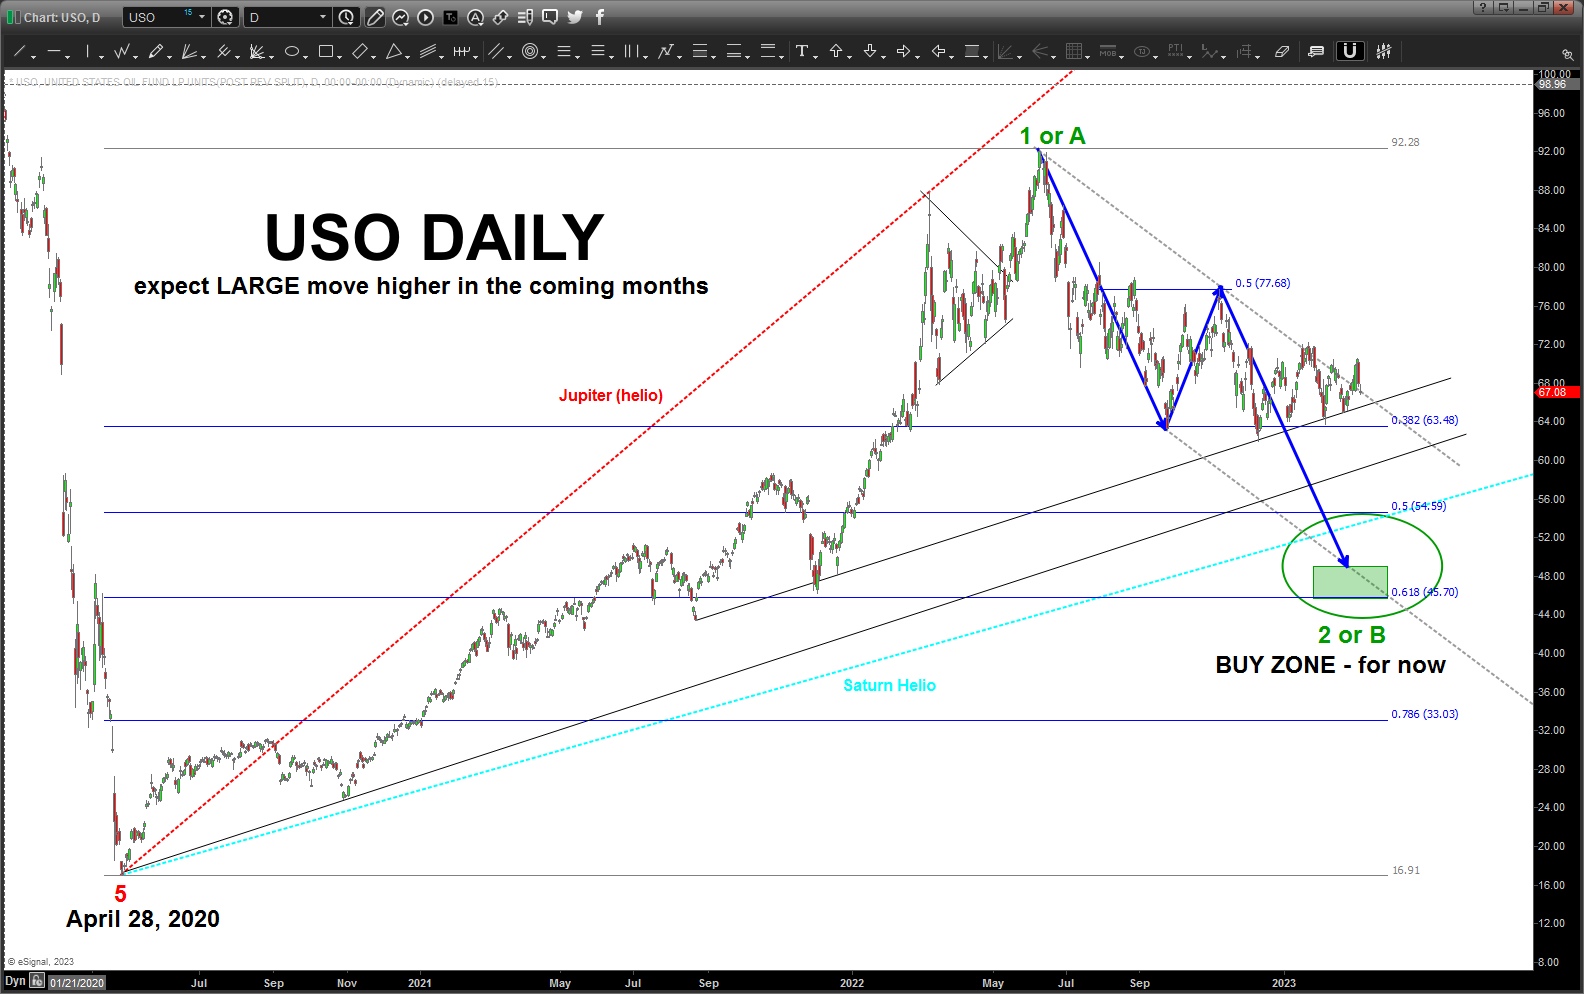
USO chart shows a buy zone down at 45 bucks, and an expected move blue line pointing down. Yet the narrative shows a big move up. I am confused. Is your theory that the trend line of expected move was broken?
Paul – I believe the 2nd wave pullback is incomplete w/ another move lower to finish the sequence. The equal measured move sends it down to the 45-50 area. From there … a big move will start. For now, this thesis is supported by a trendline break of the one that has been holding price. Sorry for any confusion.
One day I’ll be able to read your Bart Charts better.. Until then, Thanks for the update to my understanding.the USO chart.