$NFLX another short swing at the bat? Perhaps? UPDATED 12/7/2017
12/7/2017 – binging on Narco’s right now. Awesome series .. binged on Stranger Things w/ family. All that being said, no change since October … just thinking it’s too risky to establish a LONG here …
=————————————————————————————–
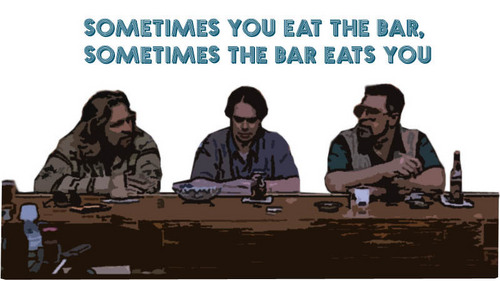
10/1/2017 – going to start this post w/ the image that I used before to describe my love affair w/ NFLX. The patterns have been strong and it’s blow thru many levels sighted below. I BELIEVE in PATTERN RECOGNITION as an AMAZING TOOL to manage risk and put probability in your favor. NFLX has been an amazing run …and it has the bar eating me, right now. Enough said! 🙂

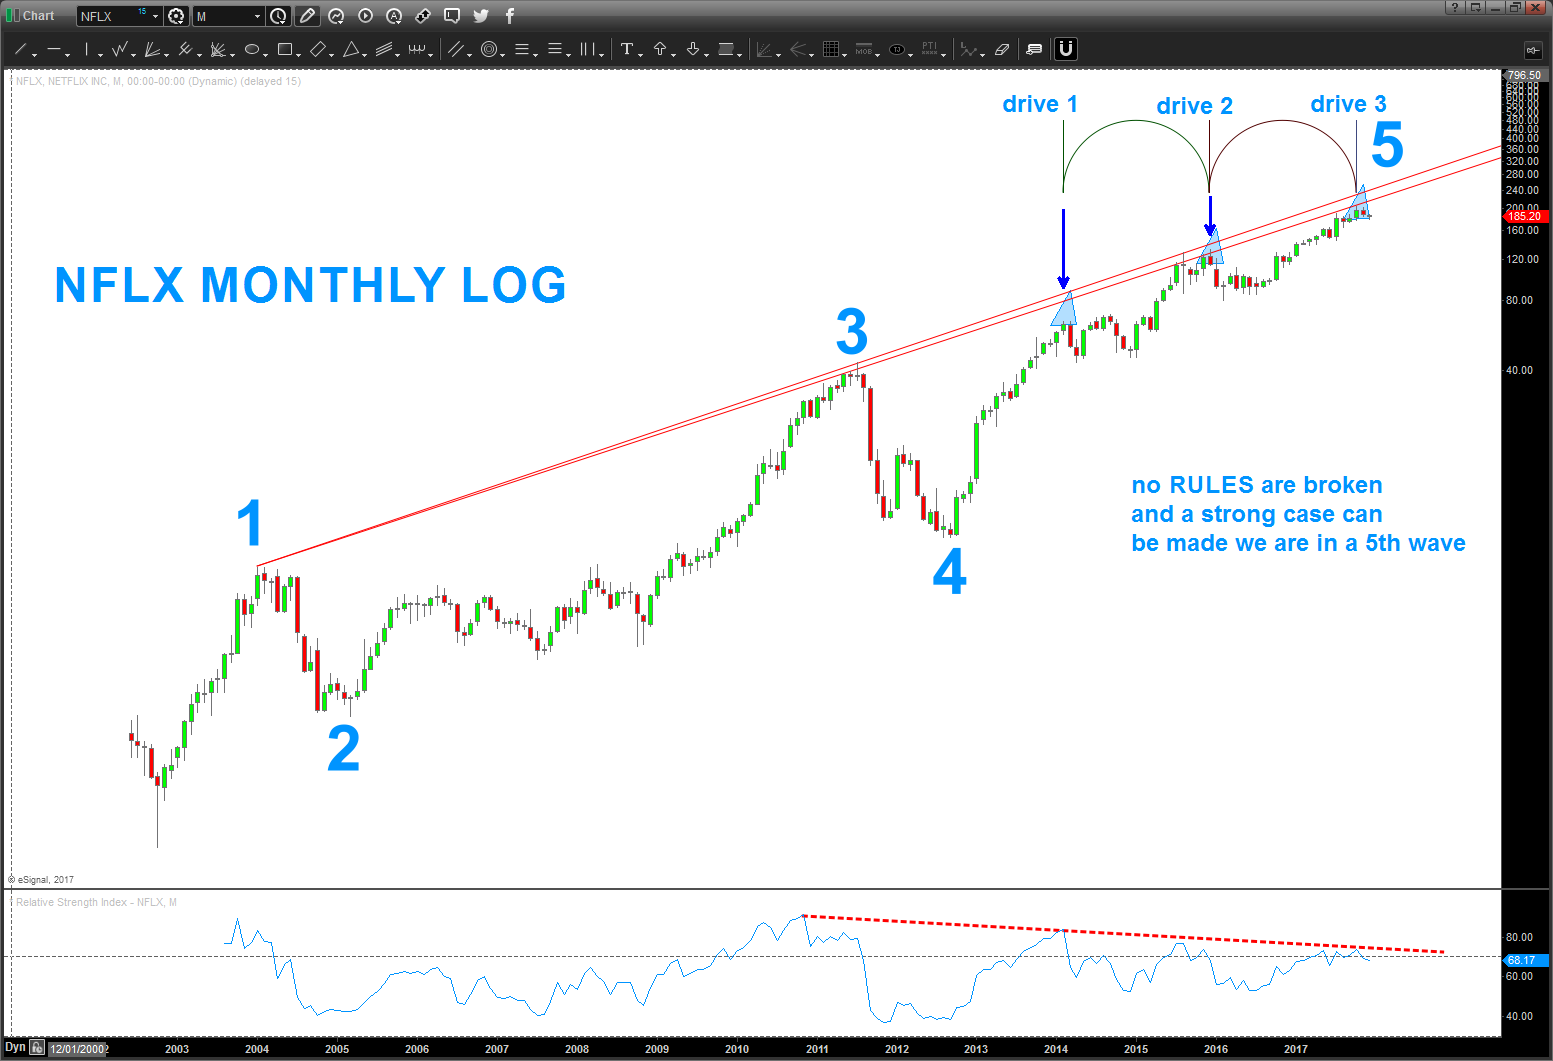
since my last post in April, NFLX is up roughly 20 percent. Pretty darn good … but, again, I’m just trying to remove any bias and simply take a look at what I SEE and NOT BELIEVE. You’ll see in the chart below that 1) the patterns have failed on this puppy and it’s strong strong strong! 2) we have some factors coming into it which SHOULD (the operative word) cause resistance or a stall or a fall from in/around current levels.
roughly 5 people from all over the world (pretty cool hugh?) have asked me to take a look at NFLX. I waited till the end of the month to see wha the monthly candle would bring …it’s a doji. In the PAST this has led to strong explosive moves UP. I still SEE 5 waves but until we get a monthly signal reversal candle (look for a close beneath 160 on a weekly level as a first sign) then the beat goes on …
now that the quarter has ended I sense/believe and, yes, want the market to reveal itself this first week of October …
thanks for reading ..
Bart
—————————————————————————————————————————————————————-
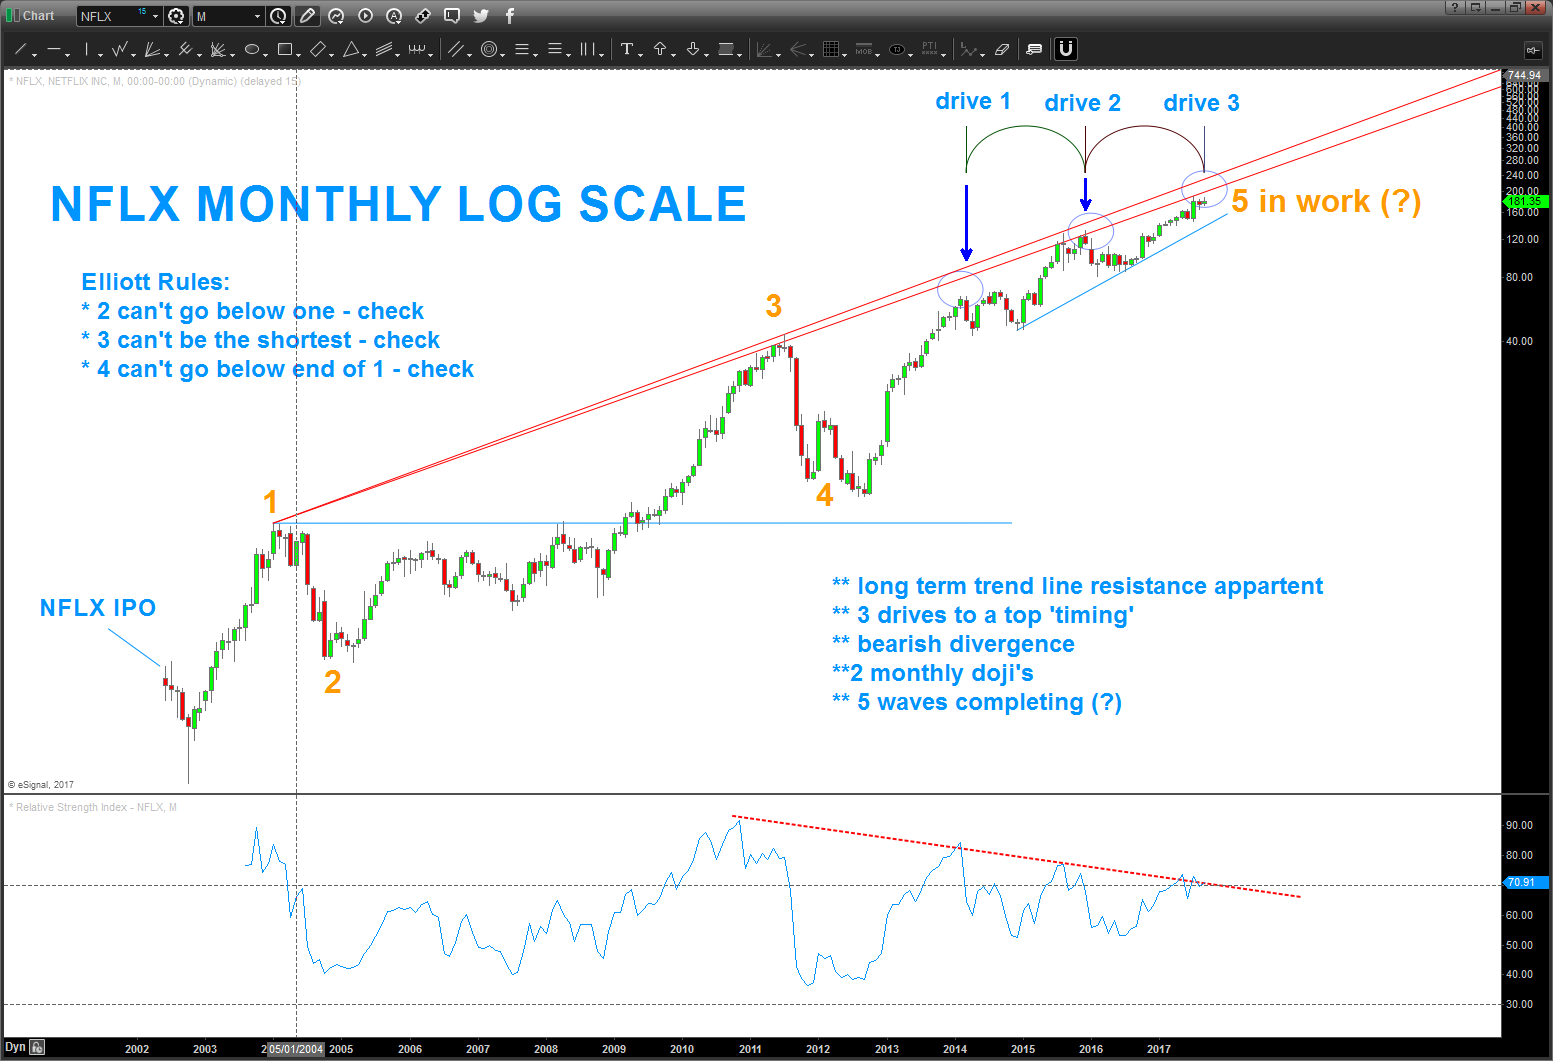
04/22/2017 – trade what you see, not what you believe. NFLX has been “topping” since January 2017. shown below are the key gap areas and the looming trend line …but folks, it hasn’t moved lower. unless we get a weekly close below 133 – step aside. the ‘math’ stopped it but it sure seems strong to me, for now …

2/14/2017
- basically hit the target zone we were identifying. now it gets interesting as you can see, on the daily, we have many gaps staring from this past summer. if we can break thru the 133-137 level then the gap 100-112 seems like a reasonable target for now.
our assumption is we have completed 5 big waves per the below so … could get interesting? Or, the stock will never go down, right? the market only moves up.
Bart
1/12/2017 – well if at first you don’t succeed, try again. doesn’t matter this its NFLX, in the world I live in, it’s just a ‘chart’ so here we are at it again …
well, the GAP from the former congestion area into new highs was powerful BUT note that we have been selling off since the gap and IF (the big if folks) we close back below the dashed orange trend line AND close the open gap (a gap down back below is ‘technically’ the island reversal THEN guess what things could get going to the downside. so use those levels noted below as your guide.
some key stuff:
- note the monthly
- that’s some pretty large bearish divergence
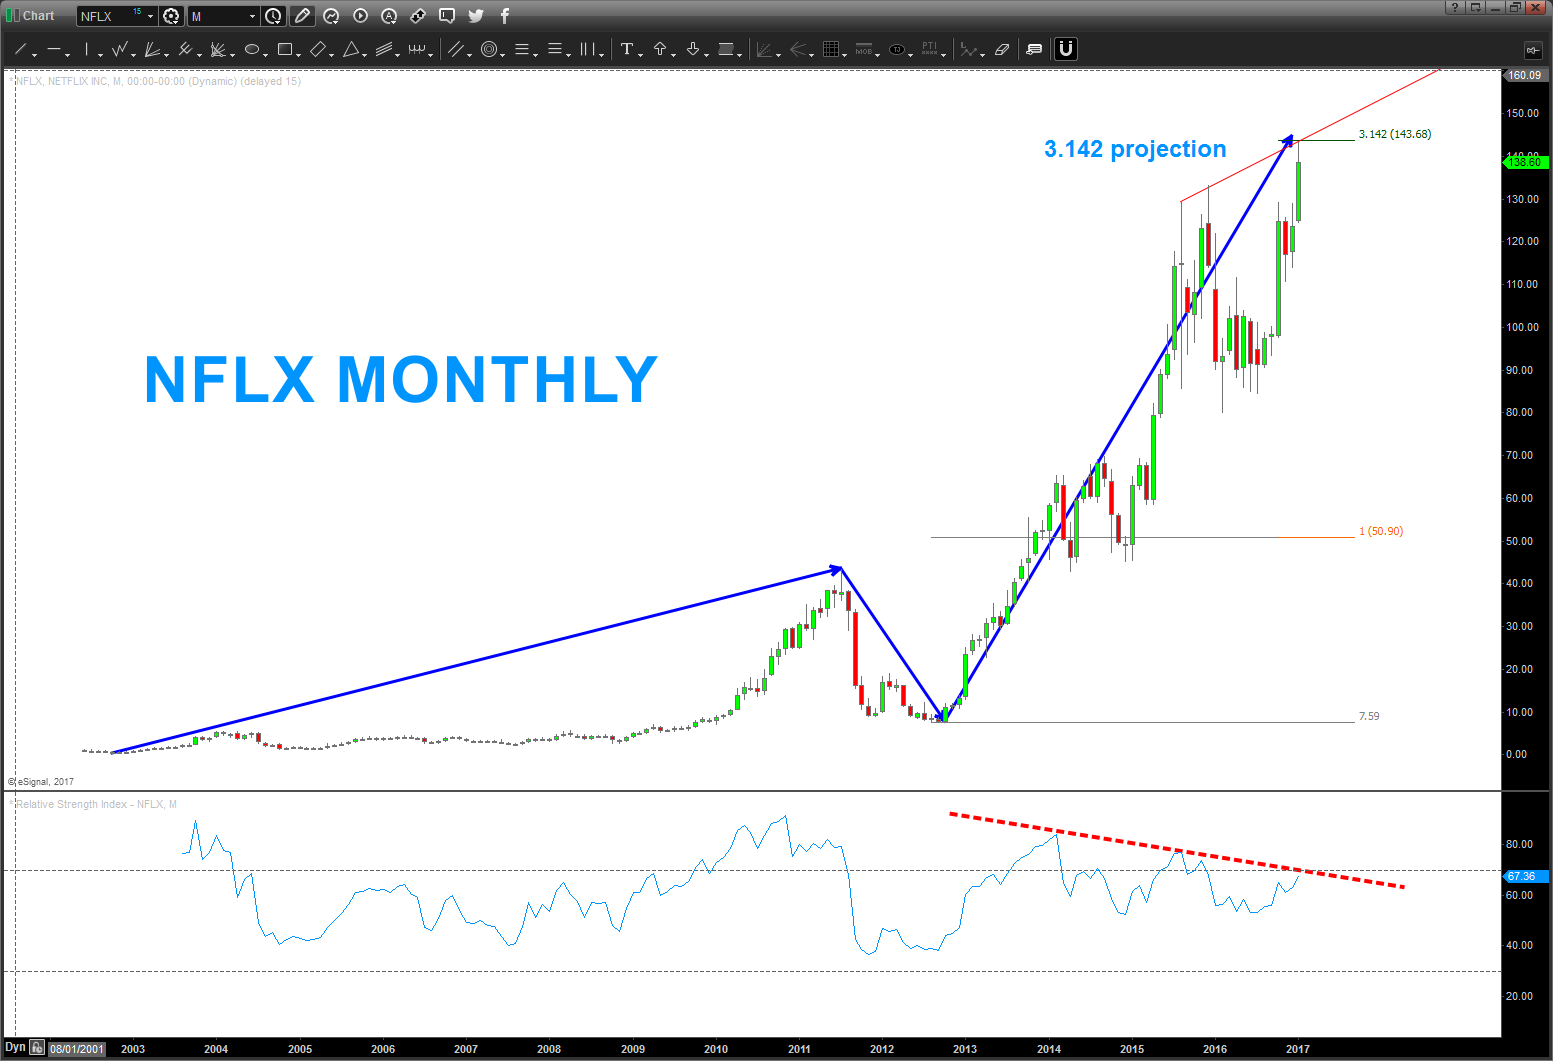
- also note, from the first move up way back when it ‘perfectly’ hit the 3.142 (PI) projection
- also note the top trend line … a daily close above that is VERY bullish but right now, banged right into it as resistance
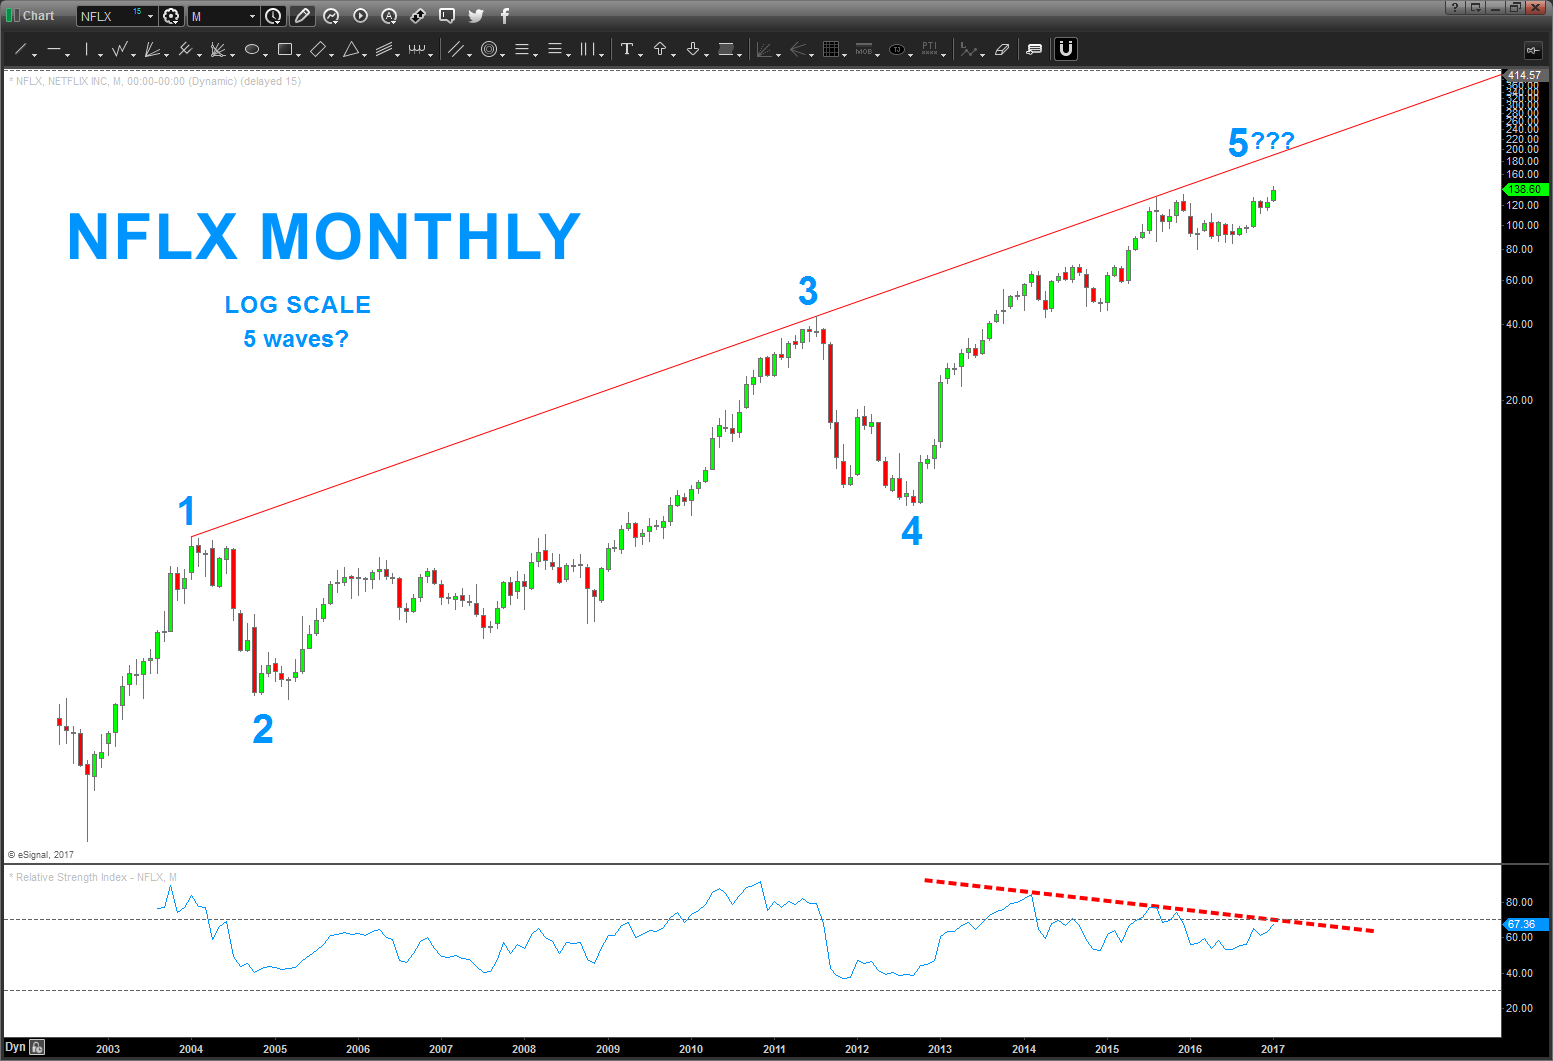
- note the monthly ‘log’ chart
- the top trend line held price at bay (that caused the consolidation IMHO) but if we keep going that top trend line would be the next logical target
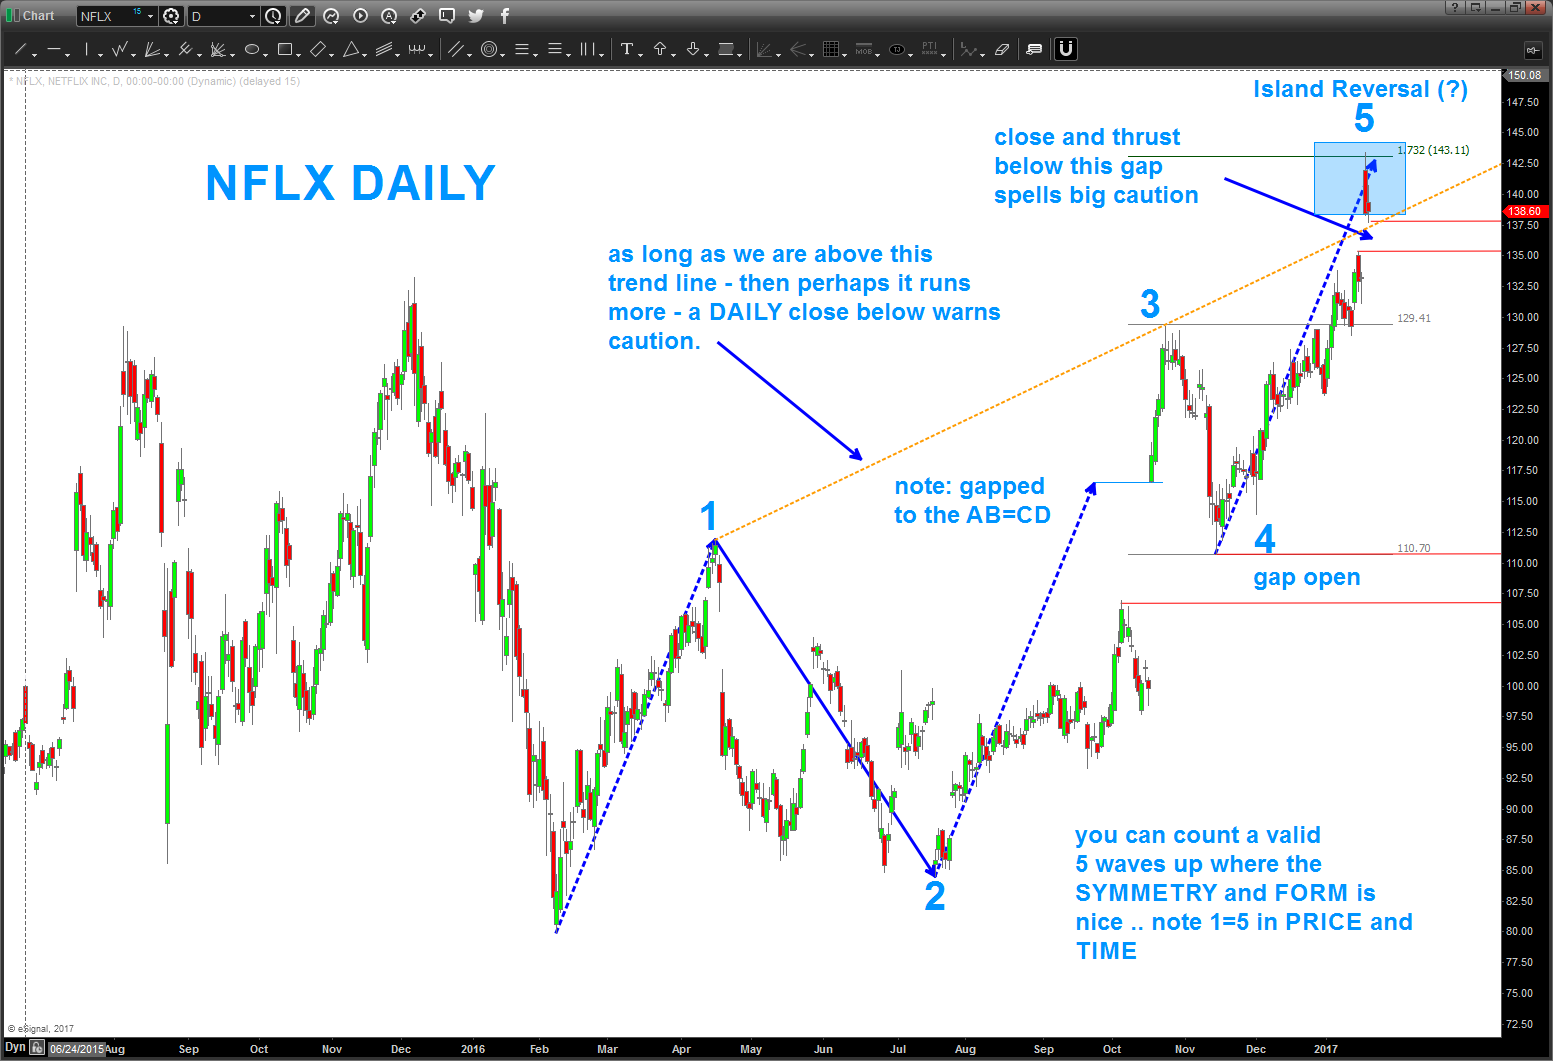
- note the daily
- see the orange dotted trendline … that’s the one to really watch for now
- I REALLY like that wave 1 up and wave 5 up are equal in PRICE and TIME
- note how wave 3 gapped rigth up to the AB=CD where wave 1=3 and then ran ….
- REALLY pay attention to the gap that was left a couple days ago – that’s the one which, if gapped down below will cause the island reversal
perhaps NFLX will kick my butt again … we’ll see.
cheers!
B
if you look thru or have been reading my blog you’ll realize that the patterns do fail .. invariably when this occurs I’ll go back to the drawing board and come up w/ another PATTERN. check out WYNN … you never know what’s going to happen and the PATTERNS do fail. manage the risk …
$NFLX has beaten me – alot. Uncle ….
https://bartscharts.com//?s=NFLX
that being said, I hit erase all on $NFLX chart and took a fresh look at it … I still see 5 waves up w/ no RULES broken so the count is valid and there’s monthly bearish divergence and we are about to tag the upper long term trend line that is roughly 10 years old. I still say be careful up here but .. again … UNCLE.
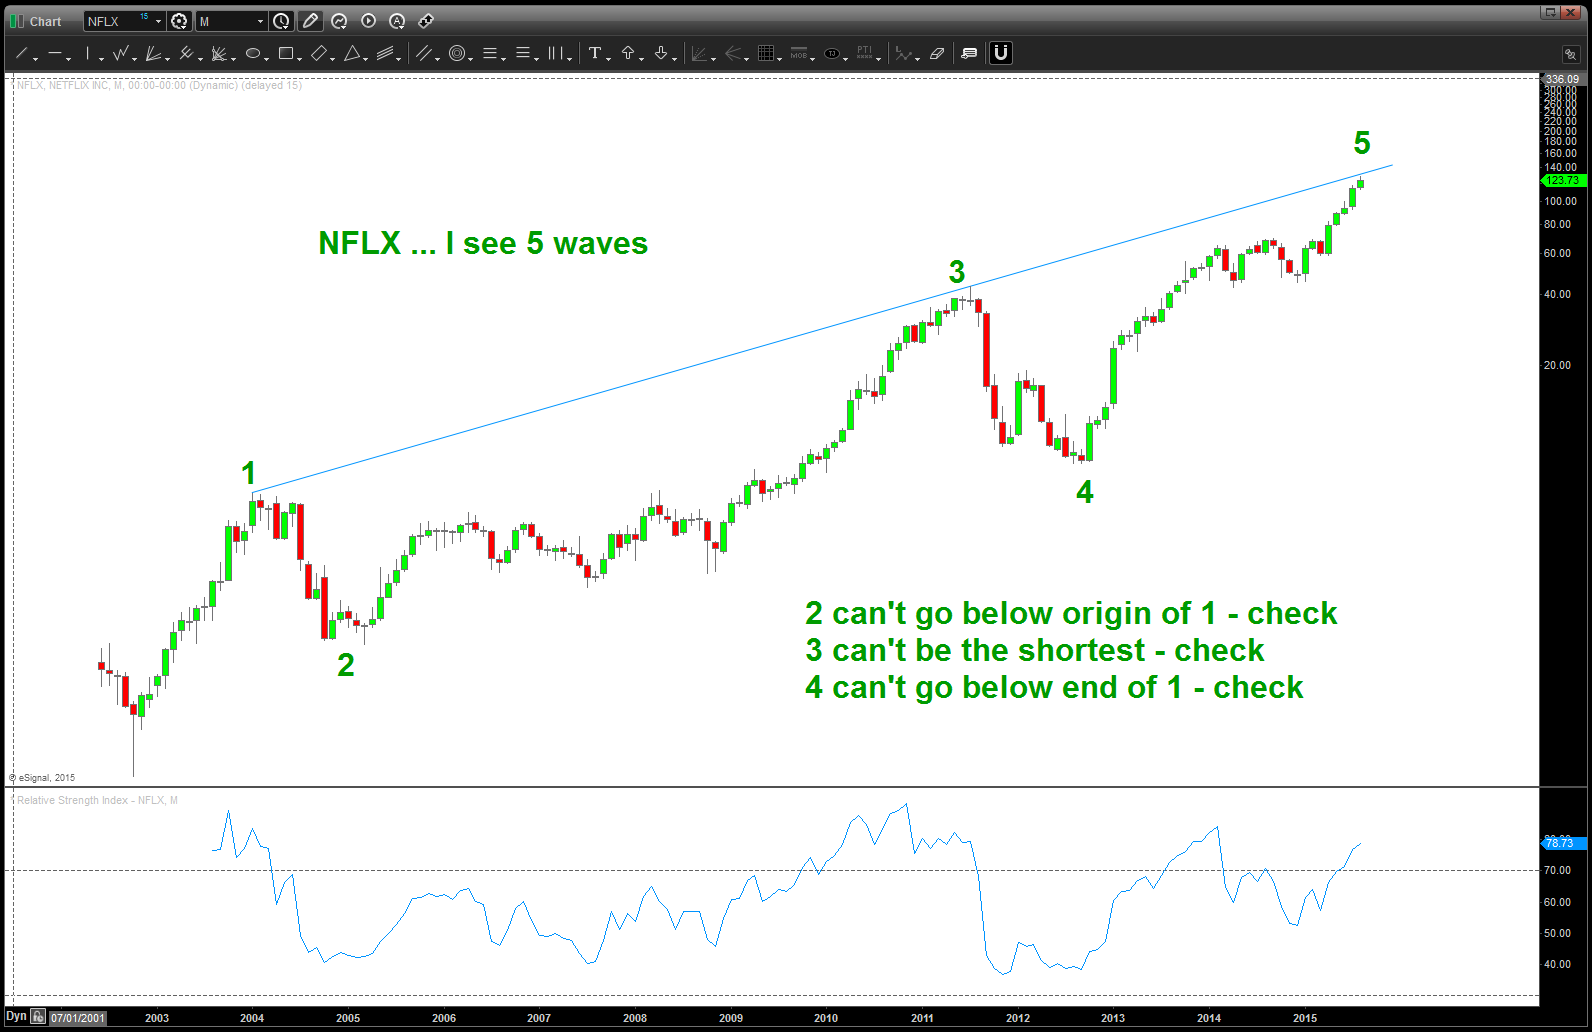
NFLX Monthly
but what’s the next pattern or set of target areas? No flipping idea …nope, not going to do it.
“f’it dude, let’s go bowling”