$TSLA – nice BUY pattern emerging
09/10/2017 – here’s an update to TSLA. I know another 16% drop from current levels seems excessive .. BUT in that area we have polarity, a bunch of ratios and a SQUARE ROOT target. Also, if you look closely, we have a WEEKLY gap from 282-285 to monitor. It’s still open.
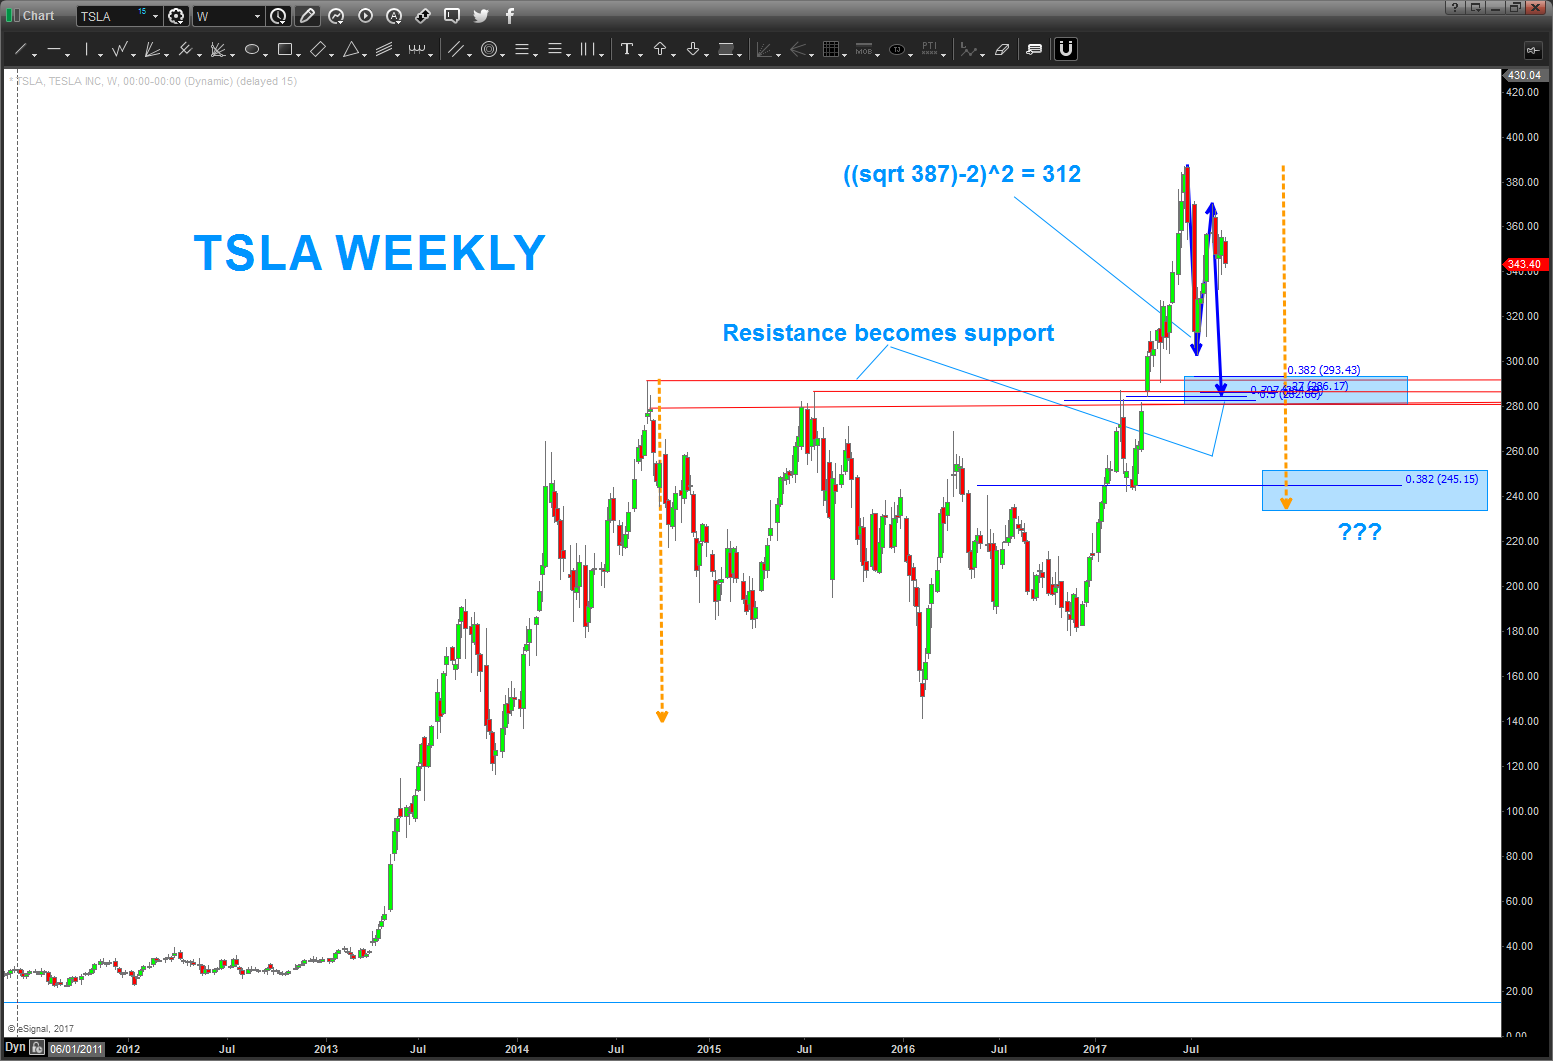
Over the coming weeks, would certainly LIKE a drop to occur.
Again, not sure (am never sure) if this will occur. If we lose the first support/buy level then 240’s is a reasonable next target…a weekly close above 372 would negate this possibility.
Bart
_____________________________________________________________________________________________
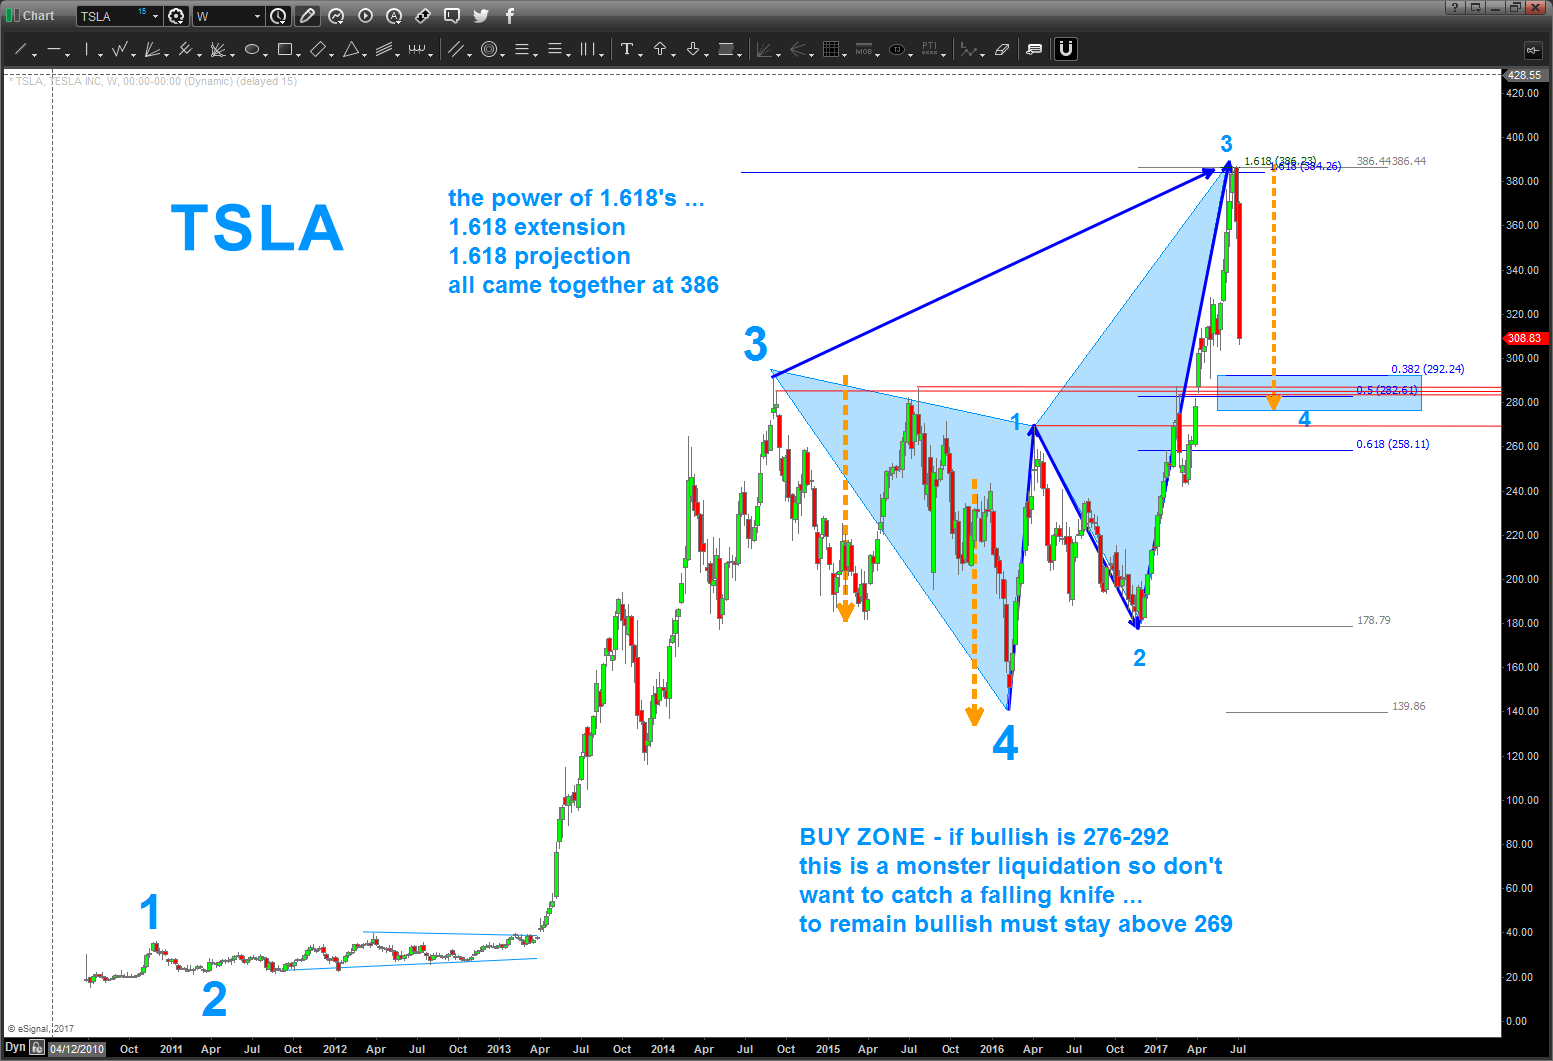
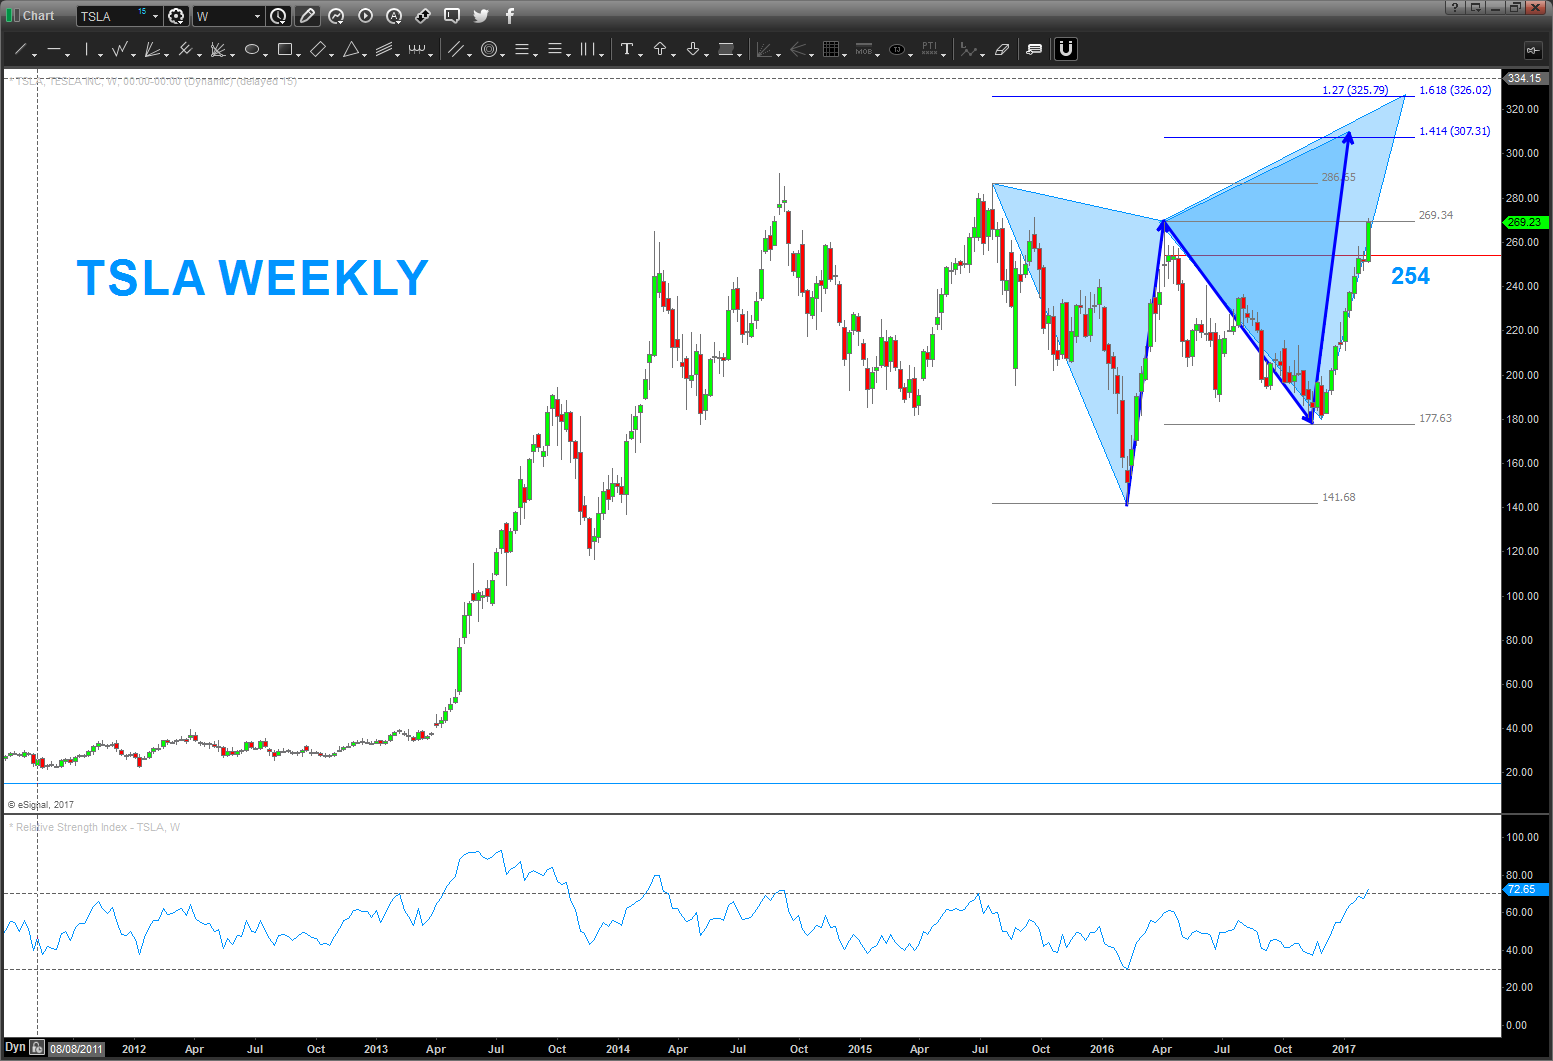
07/06/2017 – as you can see below it appeared that TSLA was ready to run … i apologize for not keeping up with this one and you know i hate to do could have would have should have type of stuff BUT I wanted to show you this near picture perfect butterfly sell pattern.
the power is in the 2 1.618 ratio’s coming together .. we have a projection and an extension lying right on top of each other. That usually equals market magic.
if you don’t believe me, ask the blind man because he saw it also …
____________________________________________________________________________________________
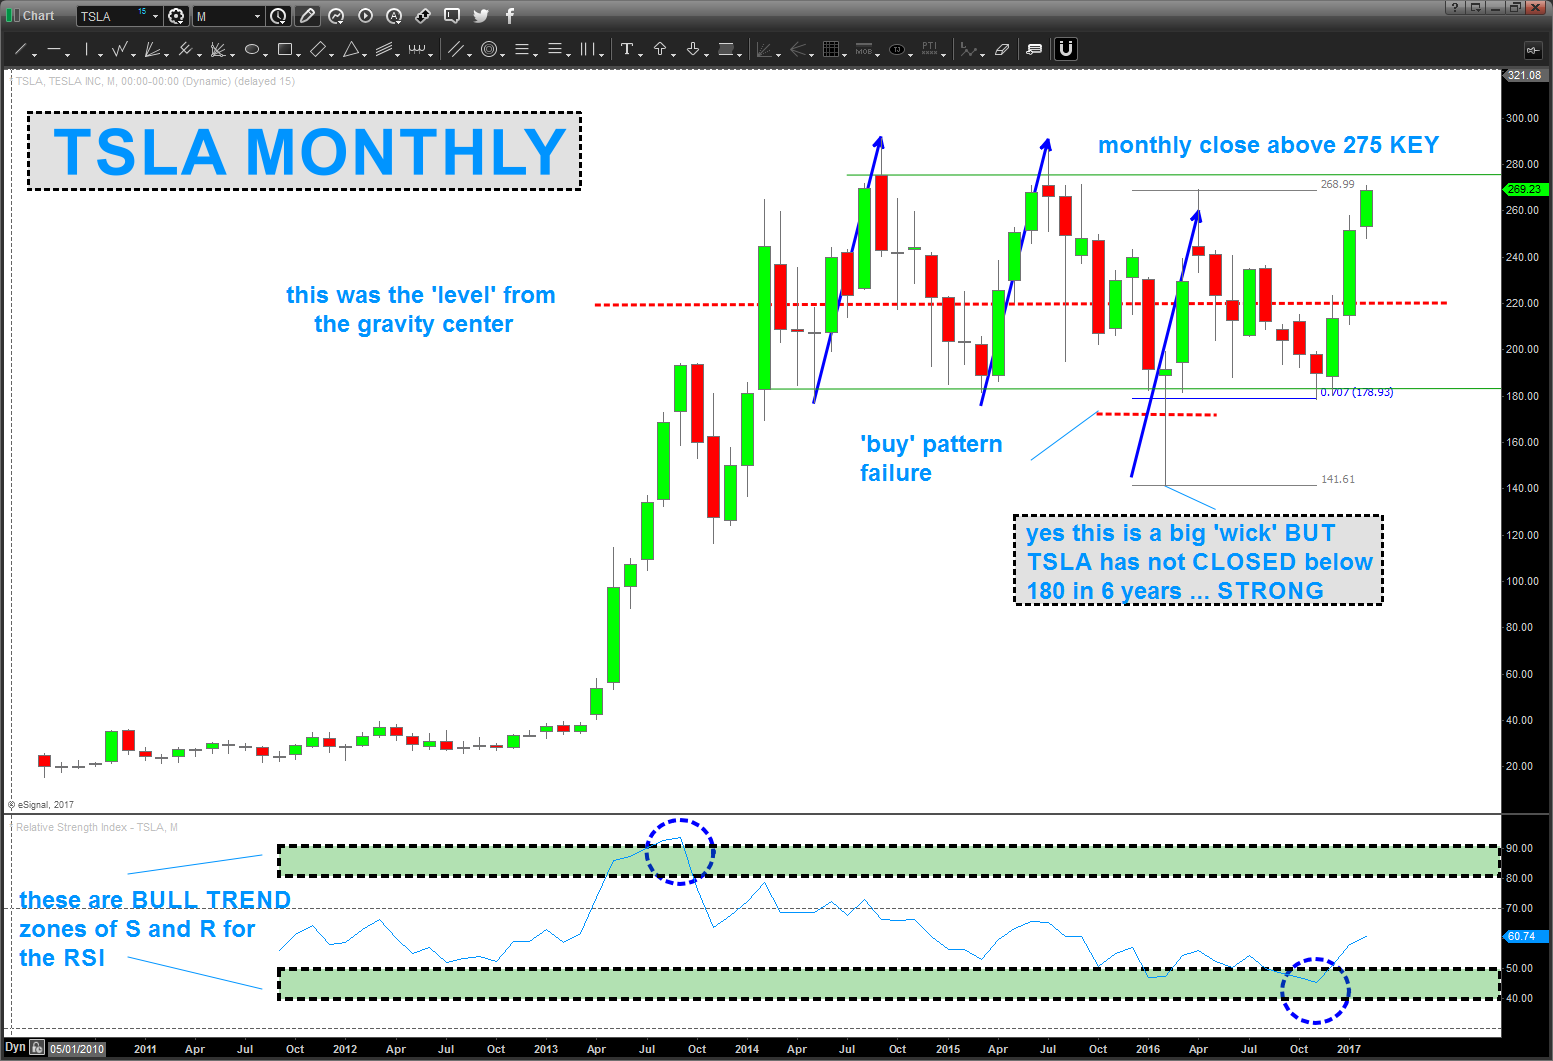
02/11/2017 – can’t believe it’s been since April 16 since I blogged about $TSLA. Tons going on in my life .. all good.
As you can see – the measured move (blue arrows below) stopped the market around 260 and it fell 80 bucks BUT the move out of the 180 area is STRONG and the BULL TREND RSI zones are telling us that this stock (car) has some juice.
Note, i’ts NEVER MONTHLY closed below, basically, 180. Say what you want about the stock and it’s fundamentals (I claim and rightly so DO NOT know a thing about them) BUT a weekly close 280 and/or a MONTHLY close above 275 tells me this puppy should target 307 and then 326 has two key ratio’s coming together. For the next couple months, would be watching those levels.
WEEKLY close below 250-254 would render the above WRONG.
Cheers and rock on, ok?
Bart
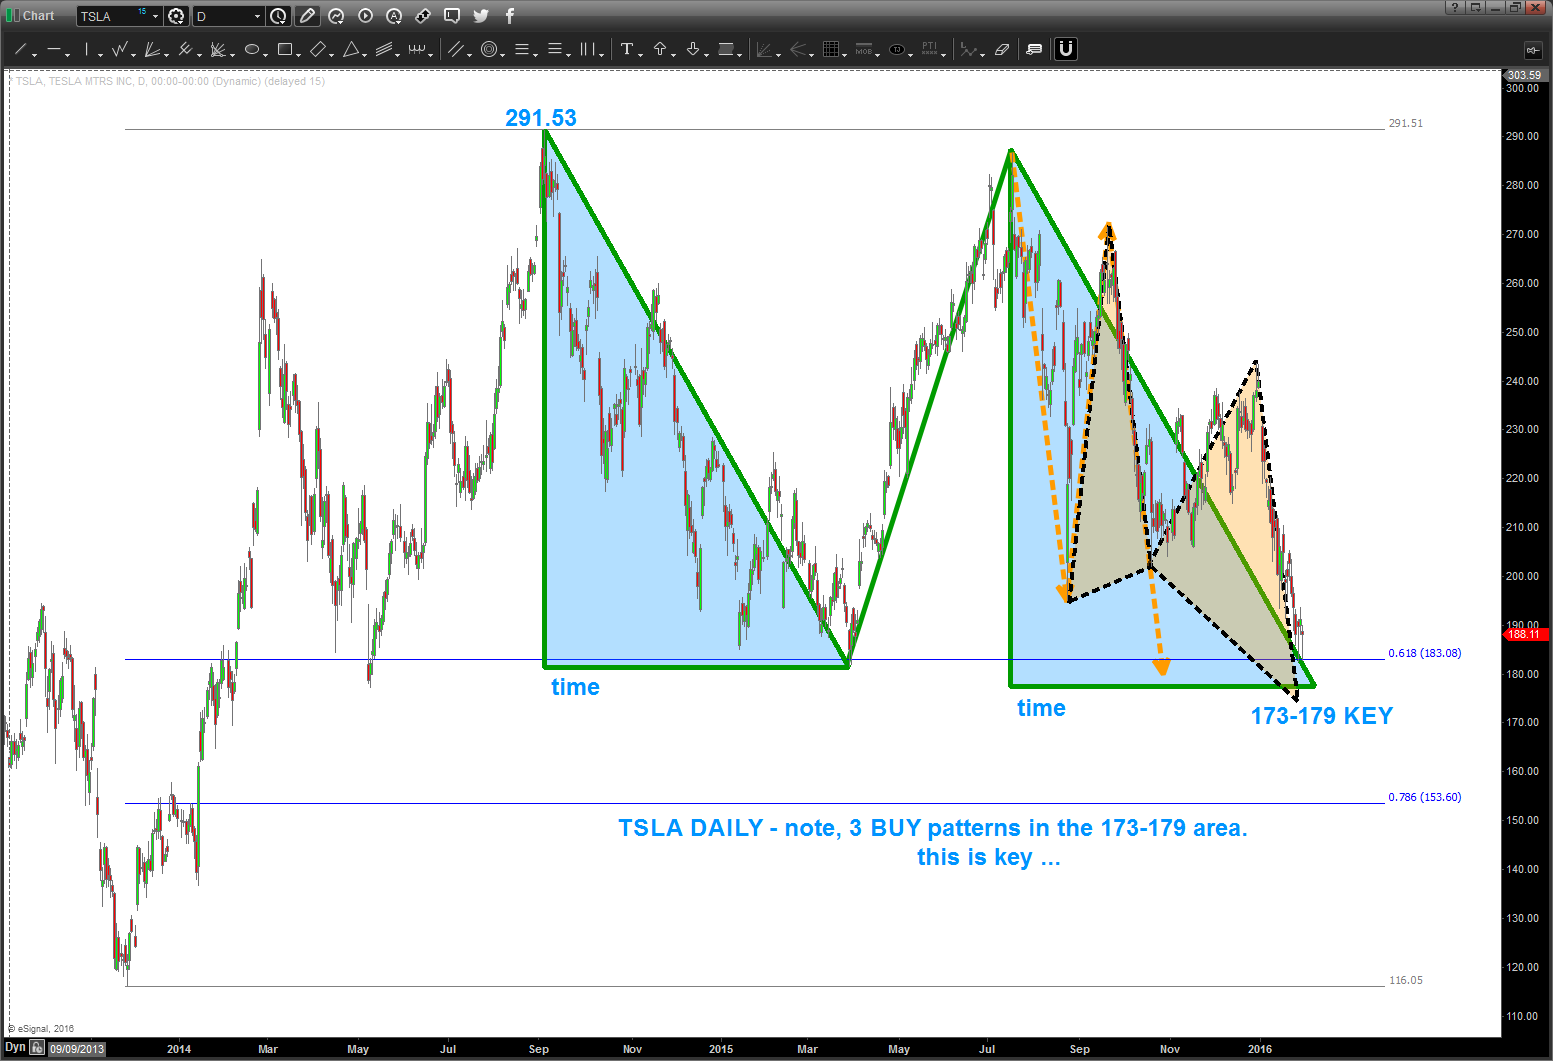
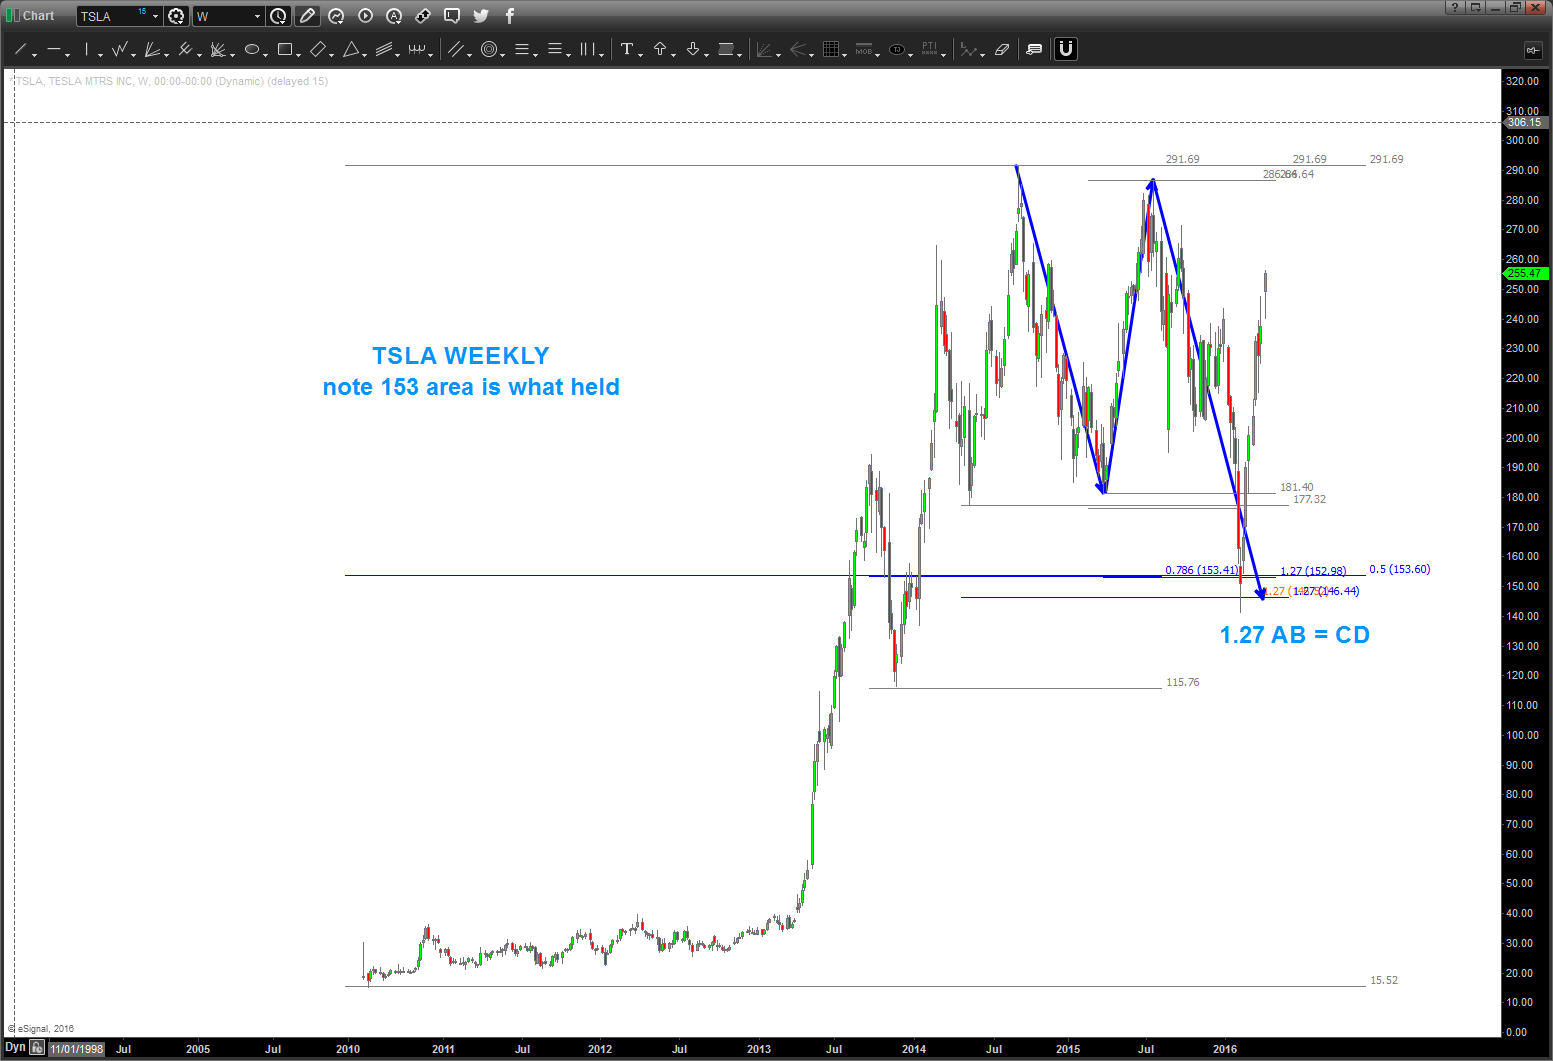
04/05/2016
As you can see the pattern in/around 173-179 got smoked. Folks, they don’t all work … but you also see I mentioned 153 would be the next stop.
so, patterns work and patterns fail. want to show you the NUMBERS that led to the next target (I hate the could have would have should have but just want to show) and also note the measured moves UP that TSLA has done. don’t be greedy, were at an important level right now.
Bart

so from my fellow geek technician JC he always loves the “from failed breakdowns/ breakouts come strong moves” well here is a possible set up.
as a PATTERN guy what I have found is – totally technical – there is a reason for the market to stop at resistance or support.
in this case for TSLA you can see it’s “respecting” the .618 retracement from the last low … EVERYONE is watching this level and horizontal support.
and, if it breaks down, then “everyone” shorts and right below this breakdown level? 3 patterns coming in 173-179 ….
- pay attention to the “shaded blue triangles” as they represent equality in both PRICE and TIME. Appears 2/10 is the time frame for this level to be really equal in price and time. TBD …
- this type of pattern is a classic “FLAT” Elliott Wave correction … so, if TSLA is to go higher, believe this level needs to hold.
watch this level closely.
as a corollary, if we have a daily close below 173 then we have 153 and then, potentially, lower in the future.
let me know if you have any questions.
B