Natural Gas carving out a low?
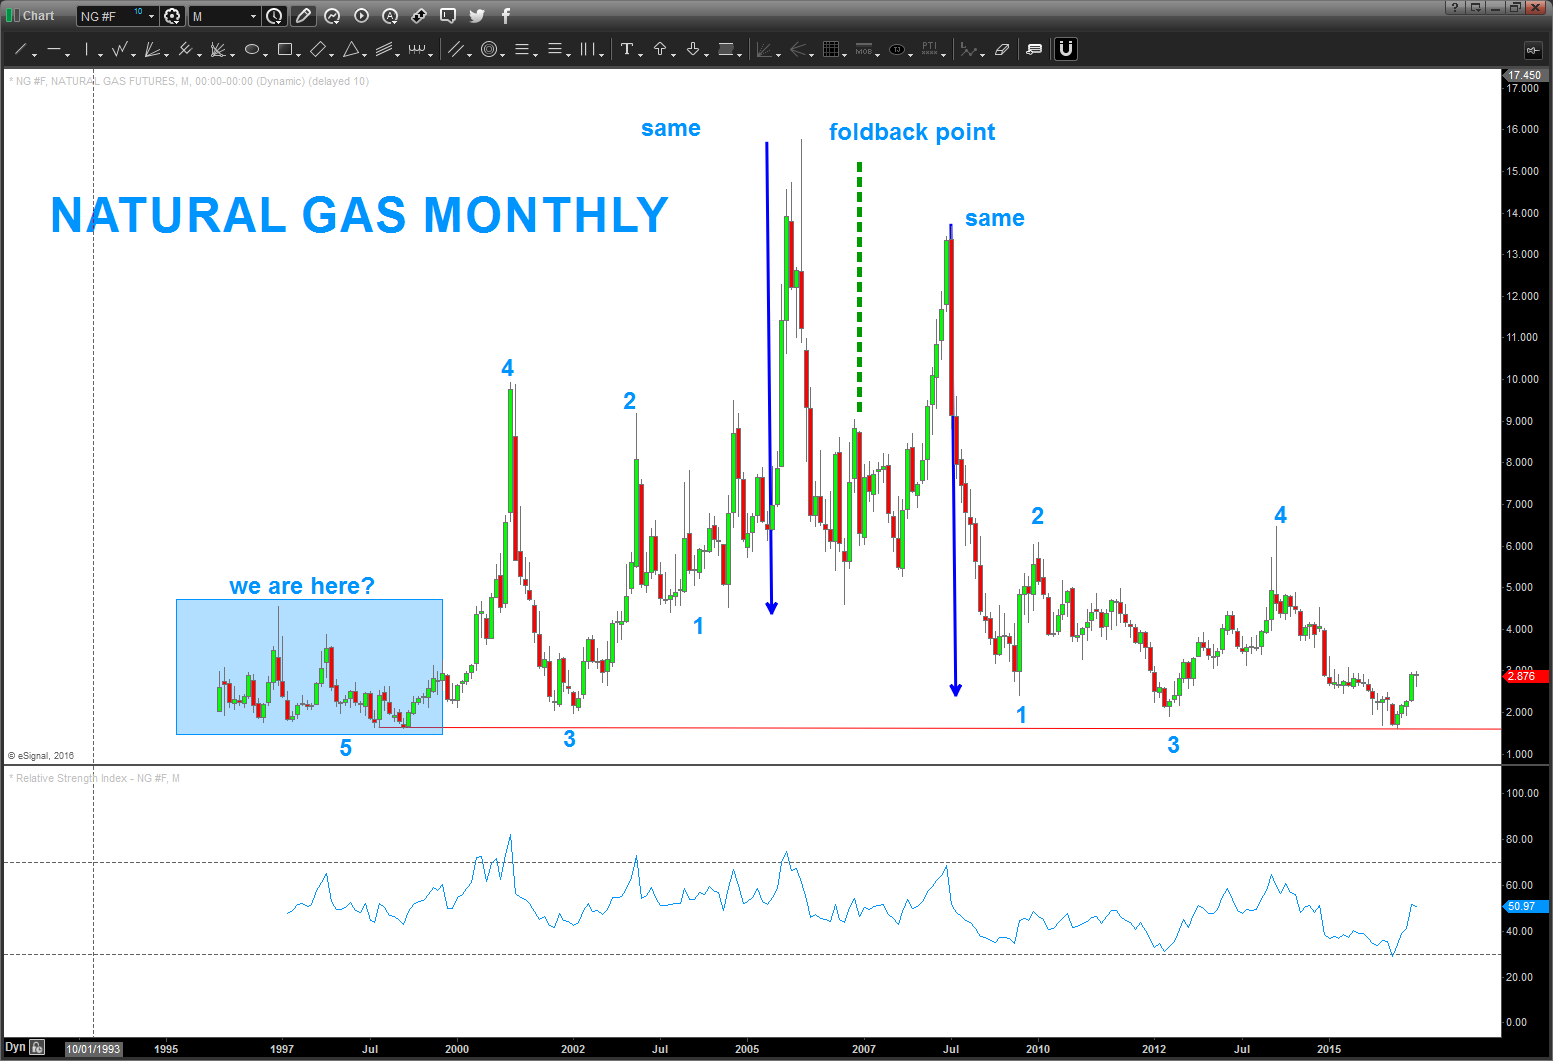
08/05/2017 – was asked to take a look at NATGAS again … I still feel we are in a consolidative or bottoming period. and the “we are here” from my last post is still valid.
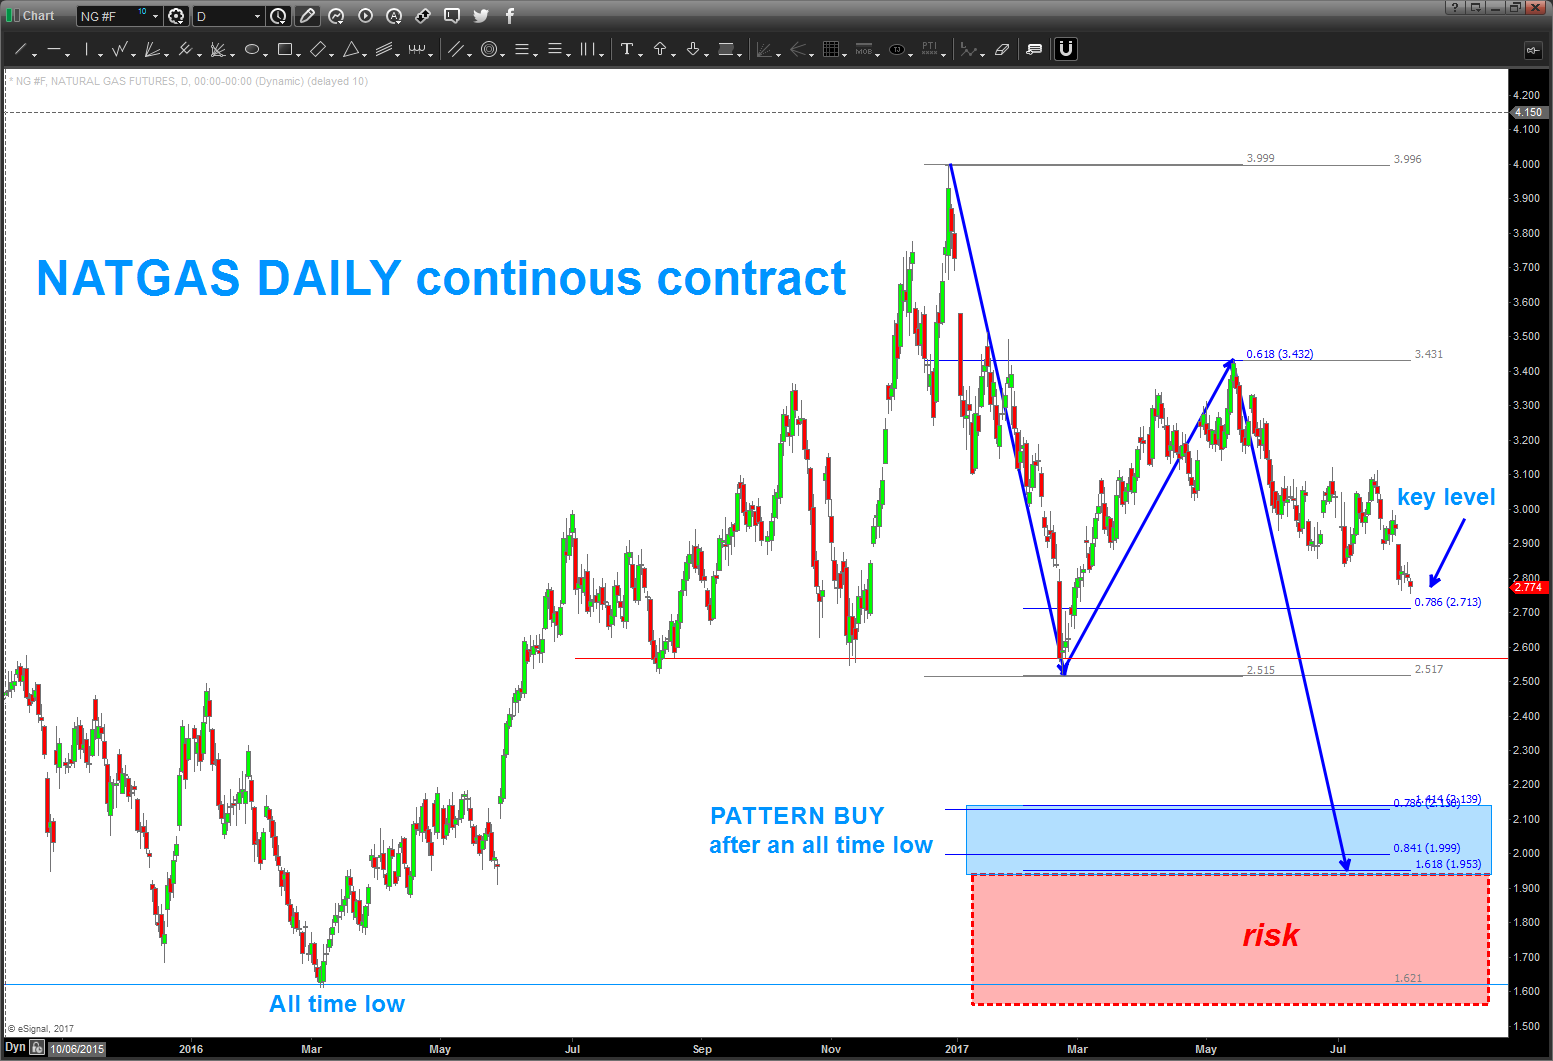
- note we have a head and shoulders forming .. key support is the .786 at 2.713 and then the neckline around 2.51-2.57
- we have a buy pattern in/around 1.953-2.139.
- note, the apex to neckline projection takes us below the all time low in/around 1.621.
- roll /w the buy pattern and then use the all time low as the shaded red box defining risk? Perhaps …?
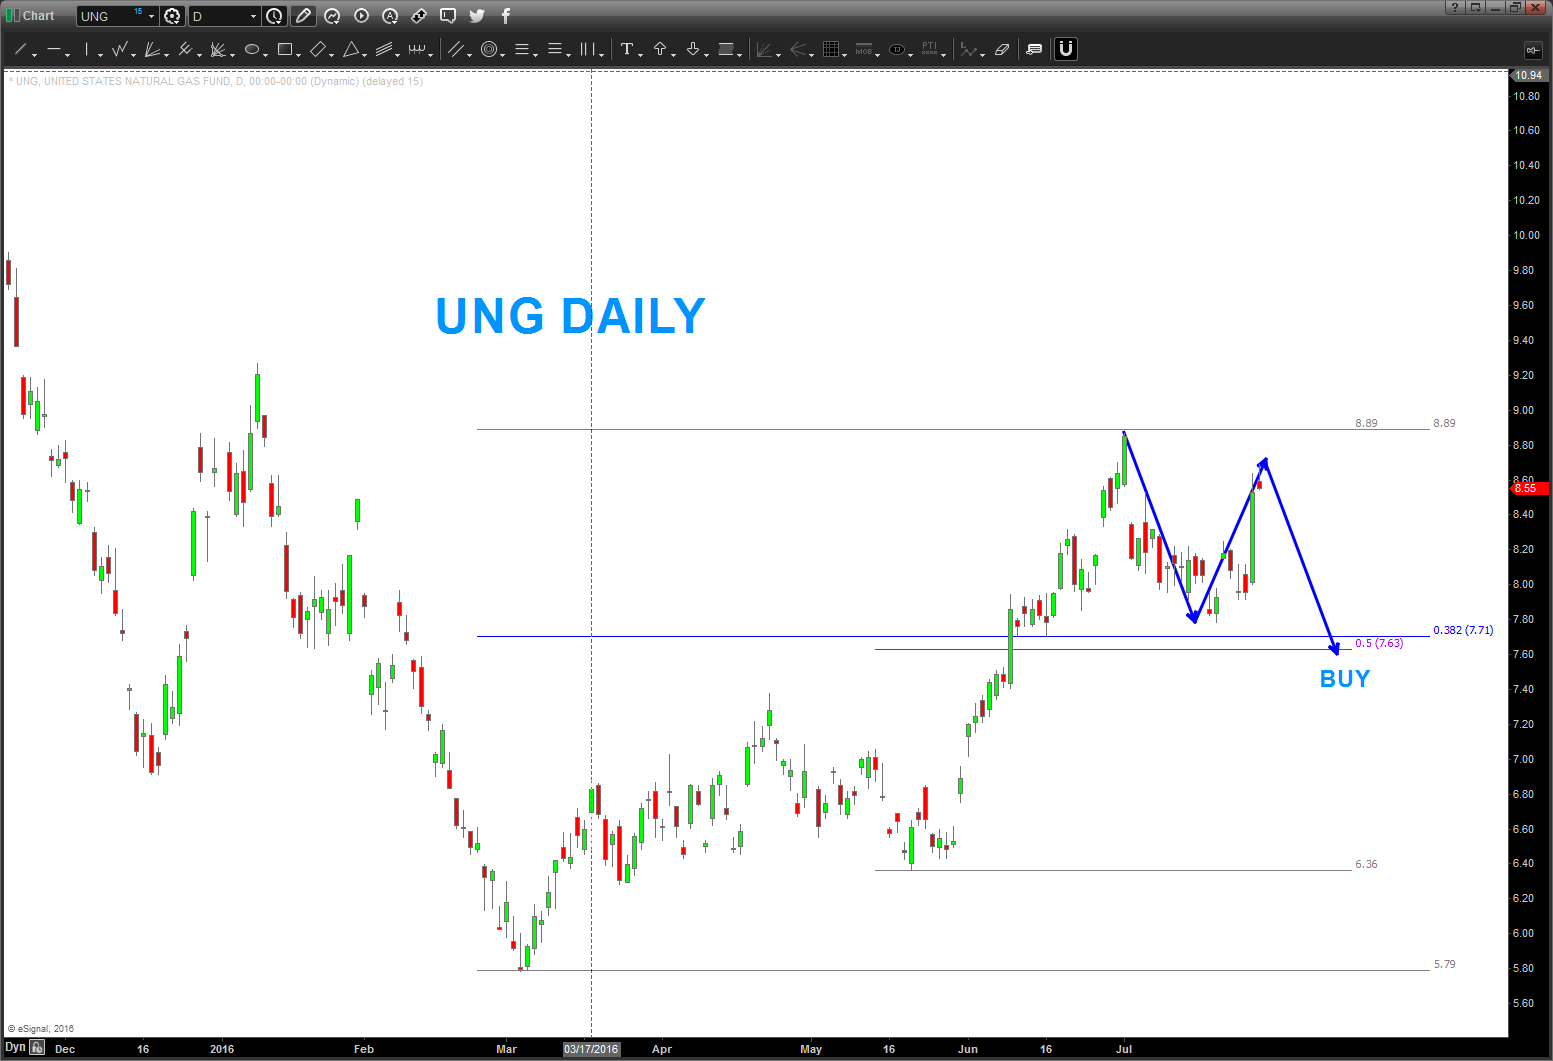
as for UNG – note the last post had a pretty nice BUY pattern and it hit then tallied up to the 9.45 area. sure looks like a BUY in/around here w/ a stop out below 5.75 could be a play IF this is going to rally.
hope this helps ..
folks, for those of you have been following me for a while you know that sometimes you eat the bar and sometimes the bar eats you. (man I love that movie … the Big Labowski)
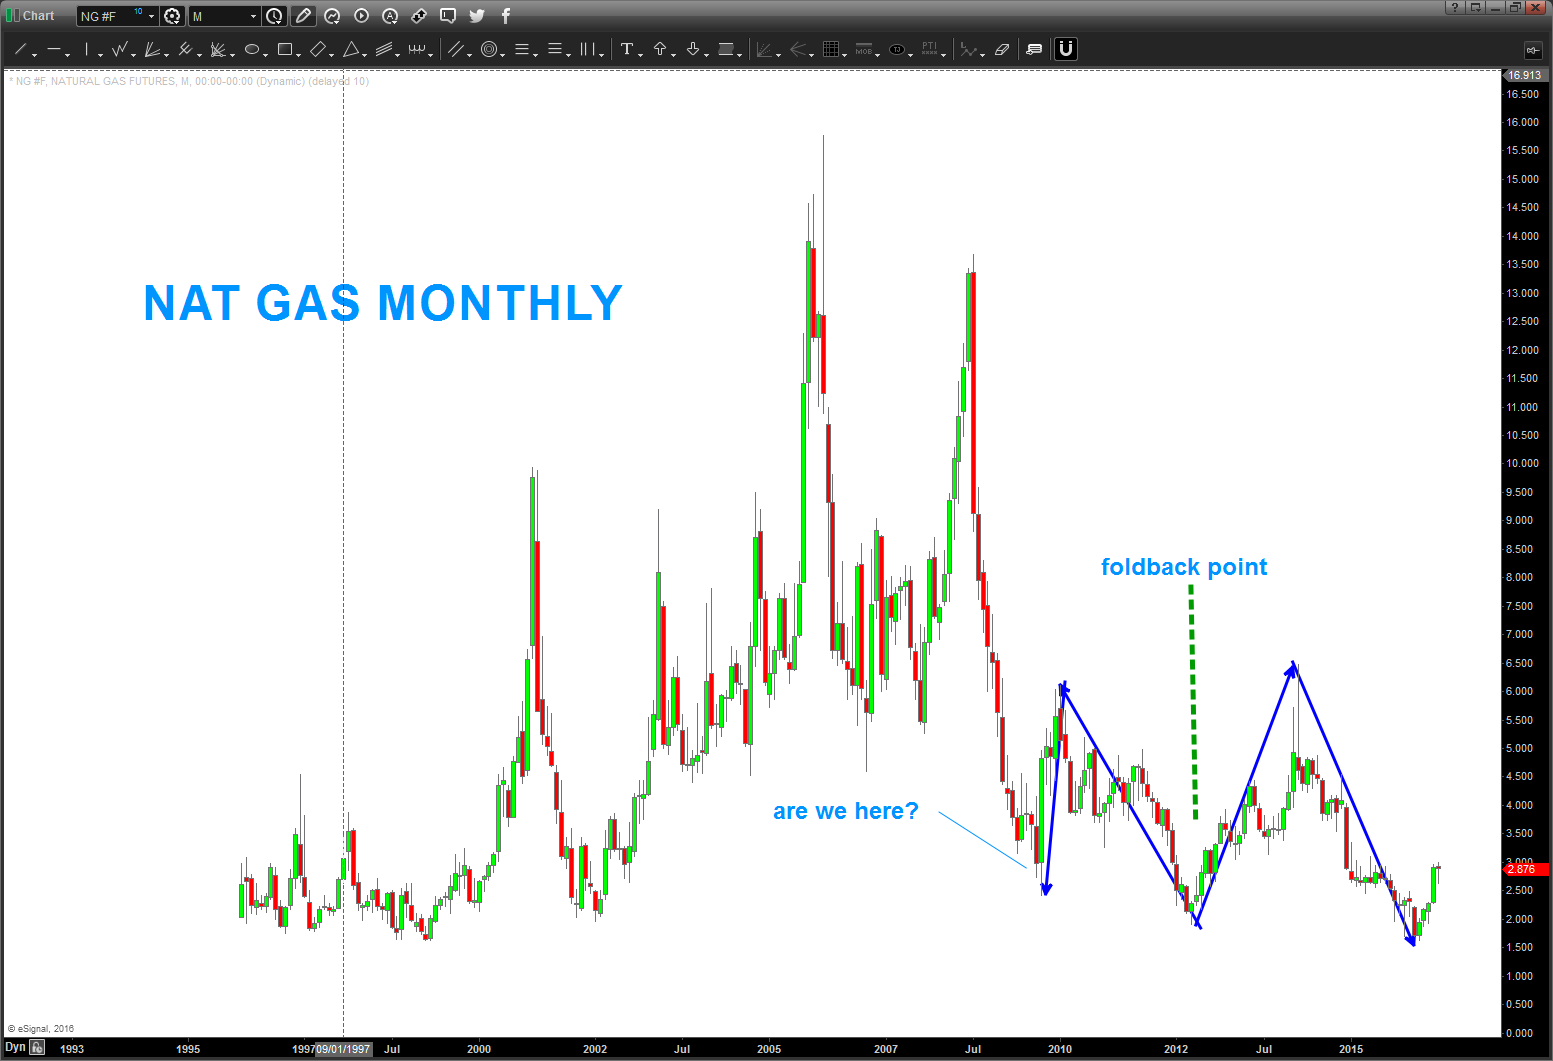
anyway, the “bar has eaten me” on Natural Gas. I played w/ a foldback pattern that REALLY looked nice and it basically failed below the levels – BUT the PATTERN still appears to be working …perhaps?
either way, I think we have a big low in place on Natural Gas and I haven’t looked at it for a WHILE after it kicked my butt. looking at it today – I see another potential foldback potential.
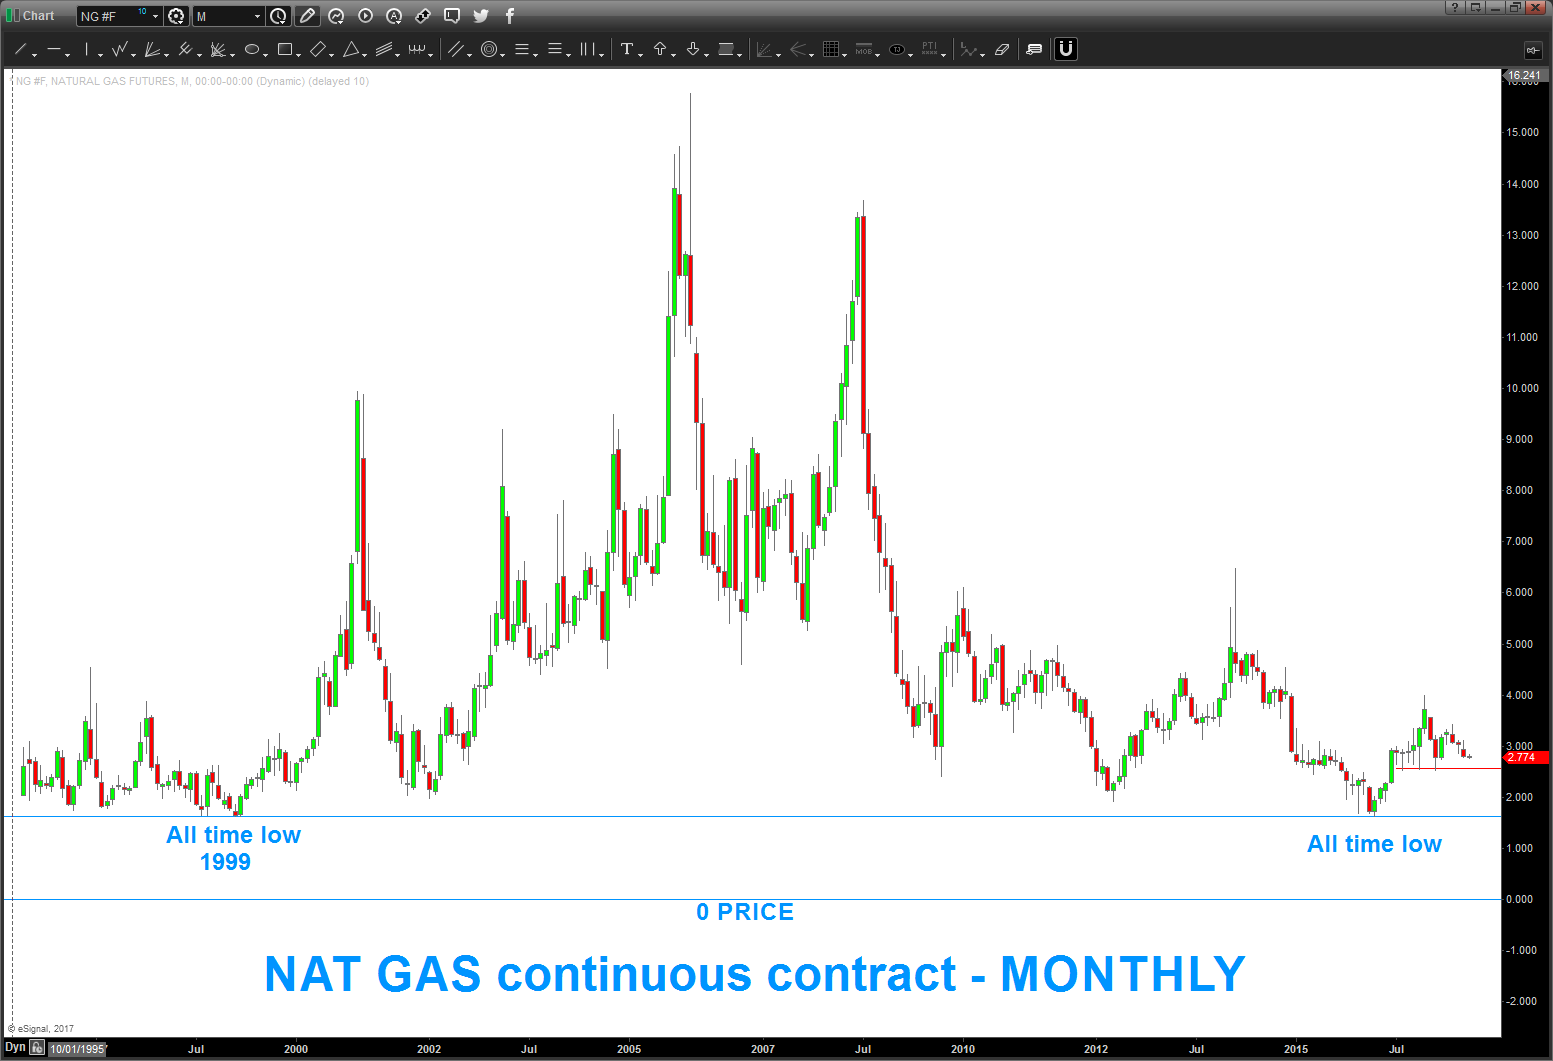
man, I wish I had more data on Natural Gas prices …
here’s the “other” foldback that kicked my ass …the form and symmetry sure look nice, don’t they? If right, natgas is about to rip higher ..
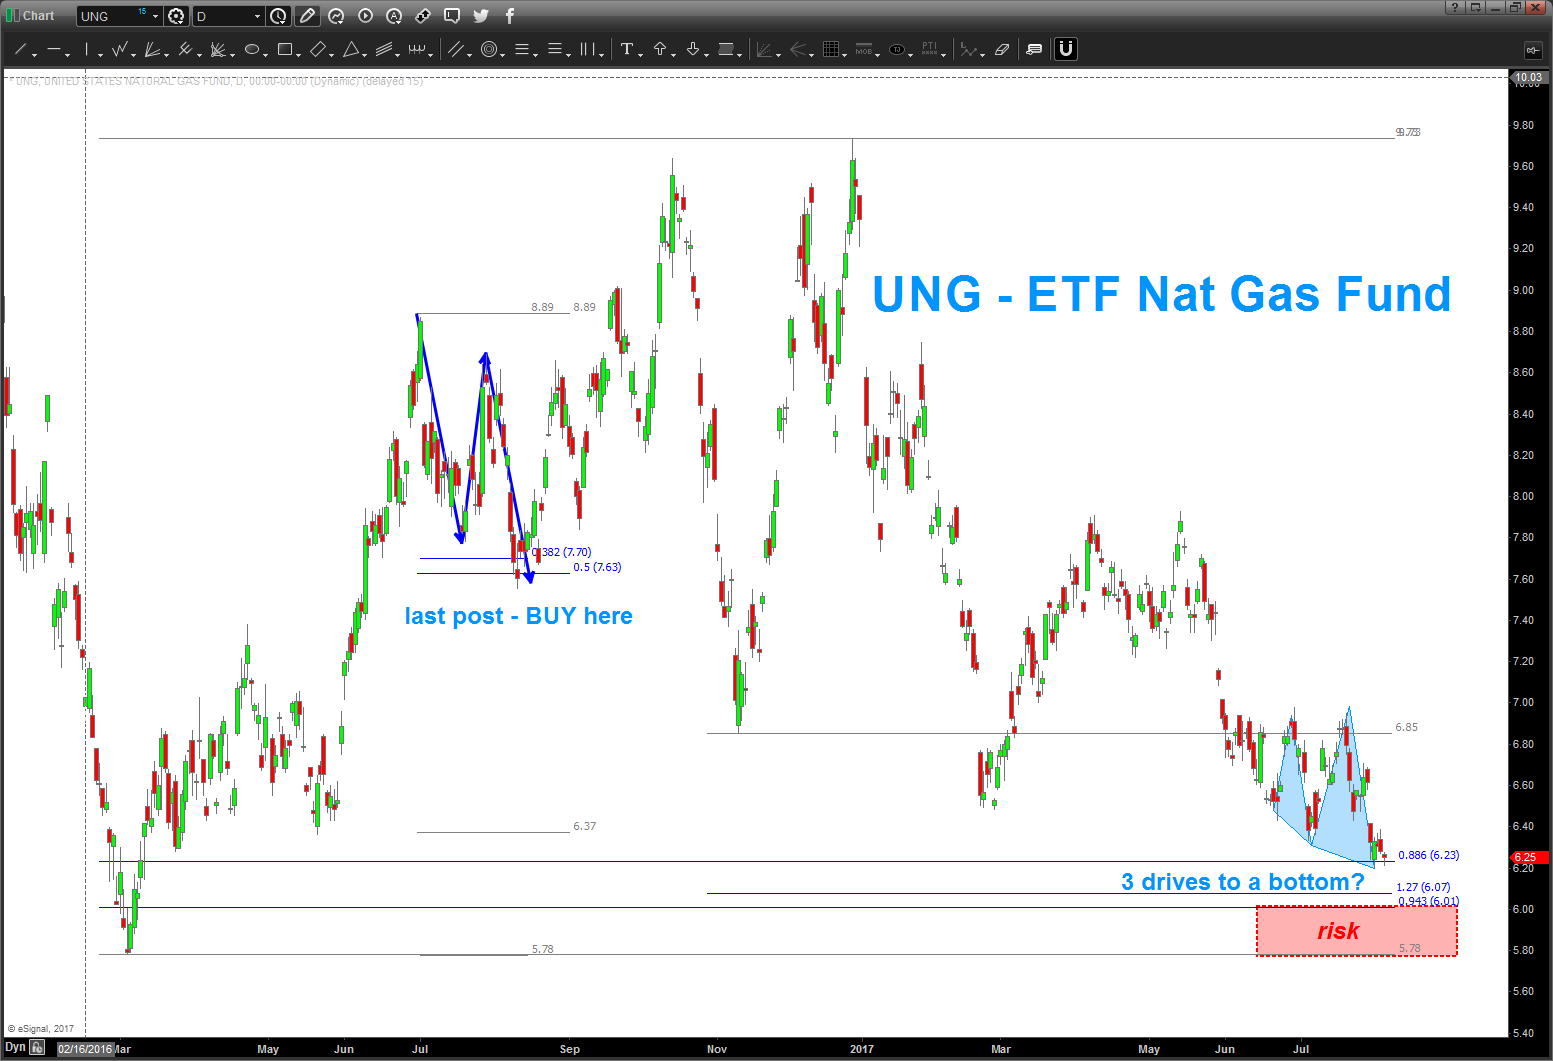
here’s a look at $UNG