heads up the party’s going into the late night … might want to call Uber
12/17/ 2016 – it’s been since June that I’ve posted about the ratio. for more information see below …bottom line is when the party is raging the “big dudes” bail out of conservative plays (consumer staples) and roll into tech and other more ‘risky’ assets. If you look at the below – purely from technical terms, we are doing nothing more than returning to the break out resistance (now support – polarity) that held for 13 years. additionally, the rsi is at the ‘usual’ level where it has held as support – every single time since the inception of the XLF ETF. So, yes the party is raging, but it might be time to move to water or soda or download the uber ride home … this hangover is going to hurt.
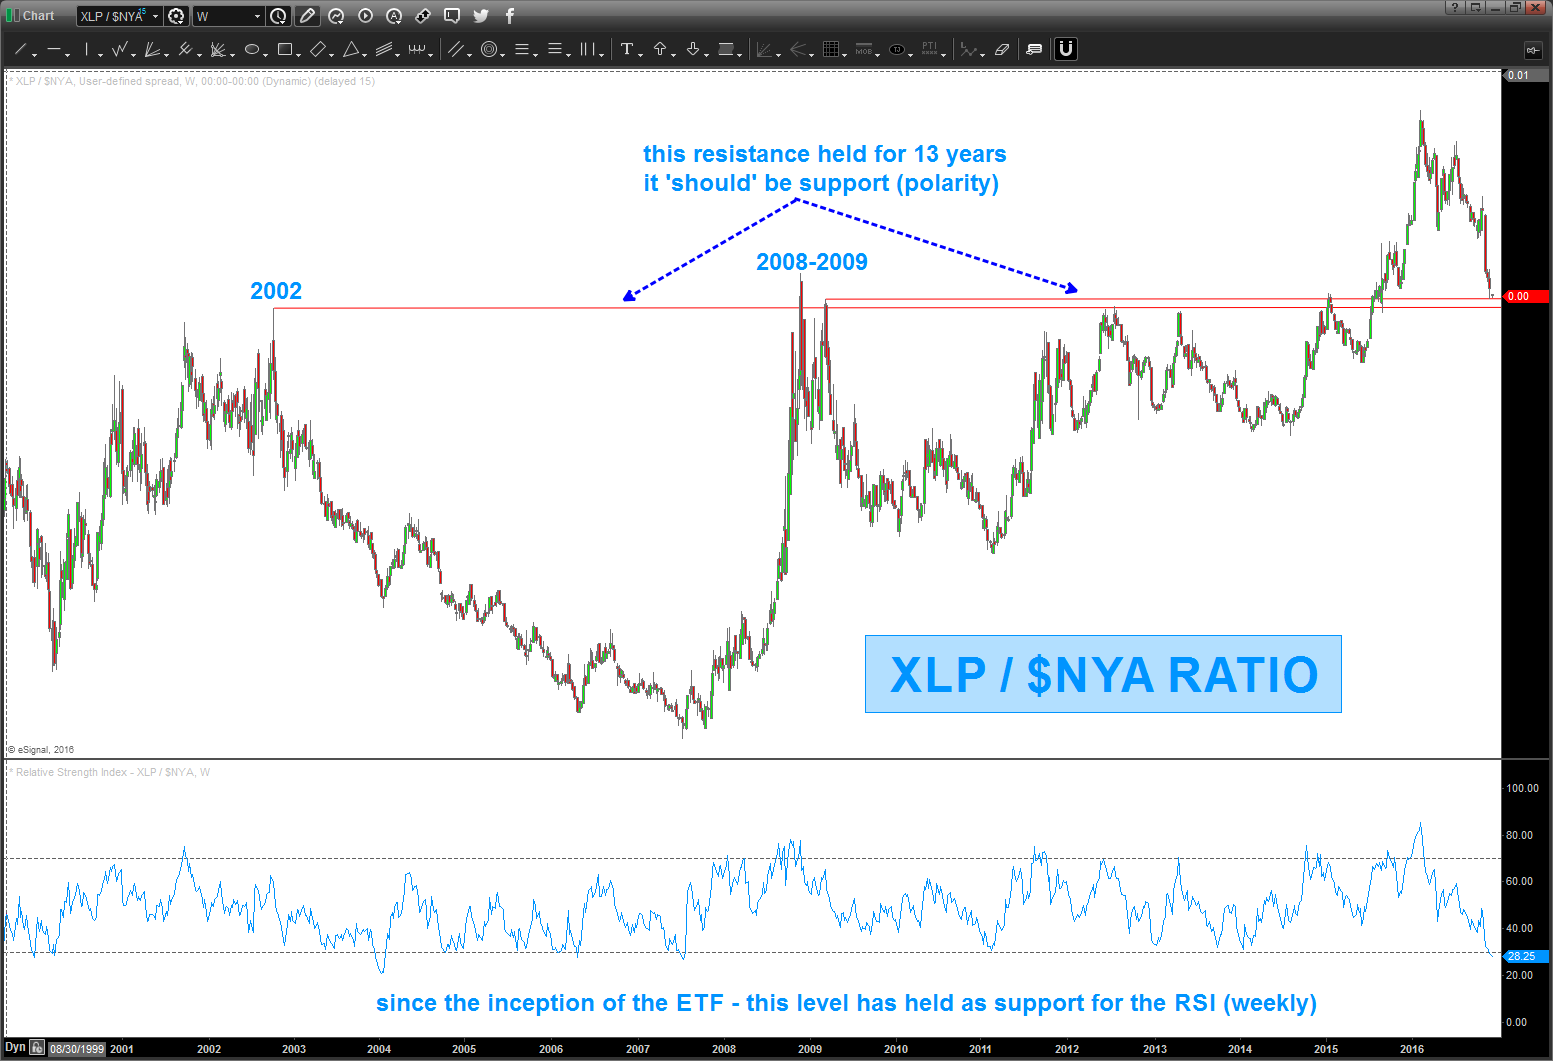
here’s the power of this ratio:
- https://bartscharts.com/2016/05/08/xlp-nya-update/
- ratio BOTTOMS, at the BUY pattern of the ratio – SELL equities
- https://bartscharts.com/2016/03/30/xlp-nya-update-pay-attention/
- when the ratio TOPS then BUY equities
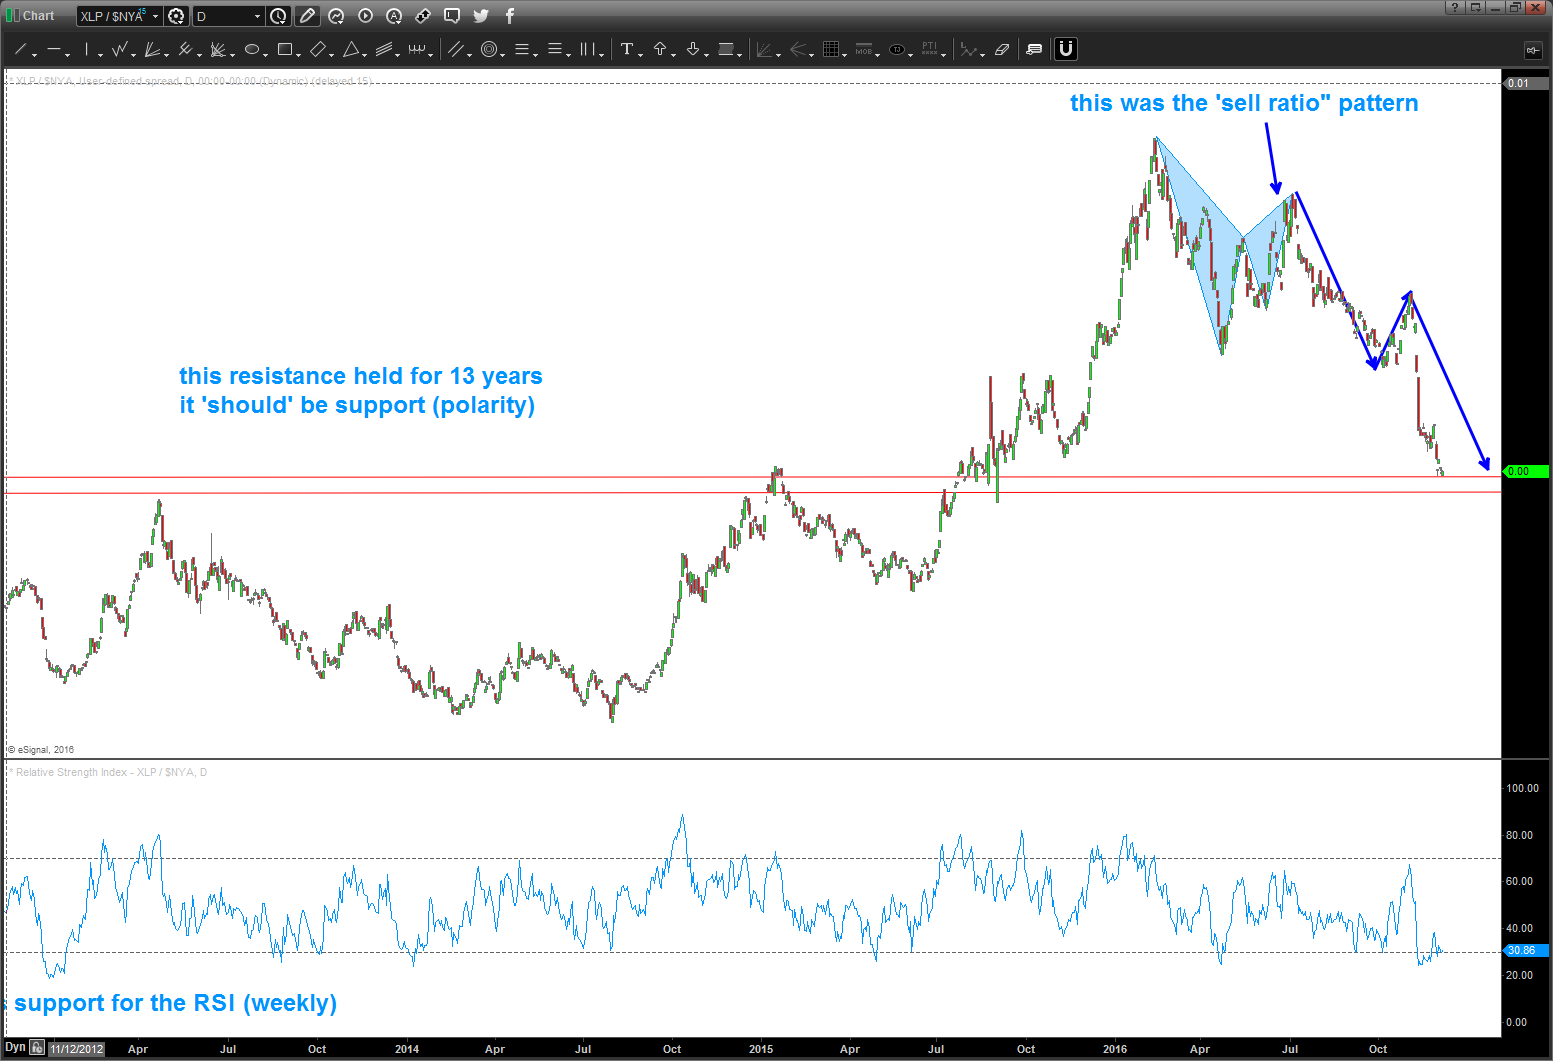
- we have a wonderful SELL the ratio pattern which means Equities should be bottoming for a BUY swing trade of the US equity structure.
DANGER WILL ROBINSON … if/when the patterns fail (and they do) the market breathes in the direction of the failure. Note, we have some VERY strong thrust into the pattern level and this “usually” means the pattern will fail BUT you never know do you? So now for the best part of the pattern recognition world the “if-then”.
IF the pattern works, equities should bottom for a nice BUY (swing trade – not long term for now … )
IF the pattern fails, equities will continuing selling off and we should look for the NEXT pattern to play … make sense?
Here’s the “perfect” sell pattern:

