an ideal scenario – TO SHORT!
if you read this blog, then you’ll notice I’ve been pretty silent. why? well, this is all playing out to plan … MAJOR patterns completed and, well, they took a long time to form and work to be quite honest. But, read below the two horizontal lines and you’ll see the PATTERN was calling for major resistance basically right where the NYSE index hit.
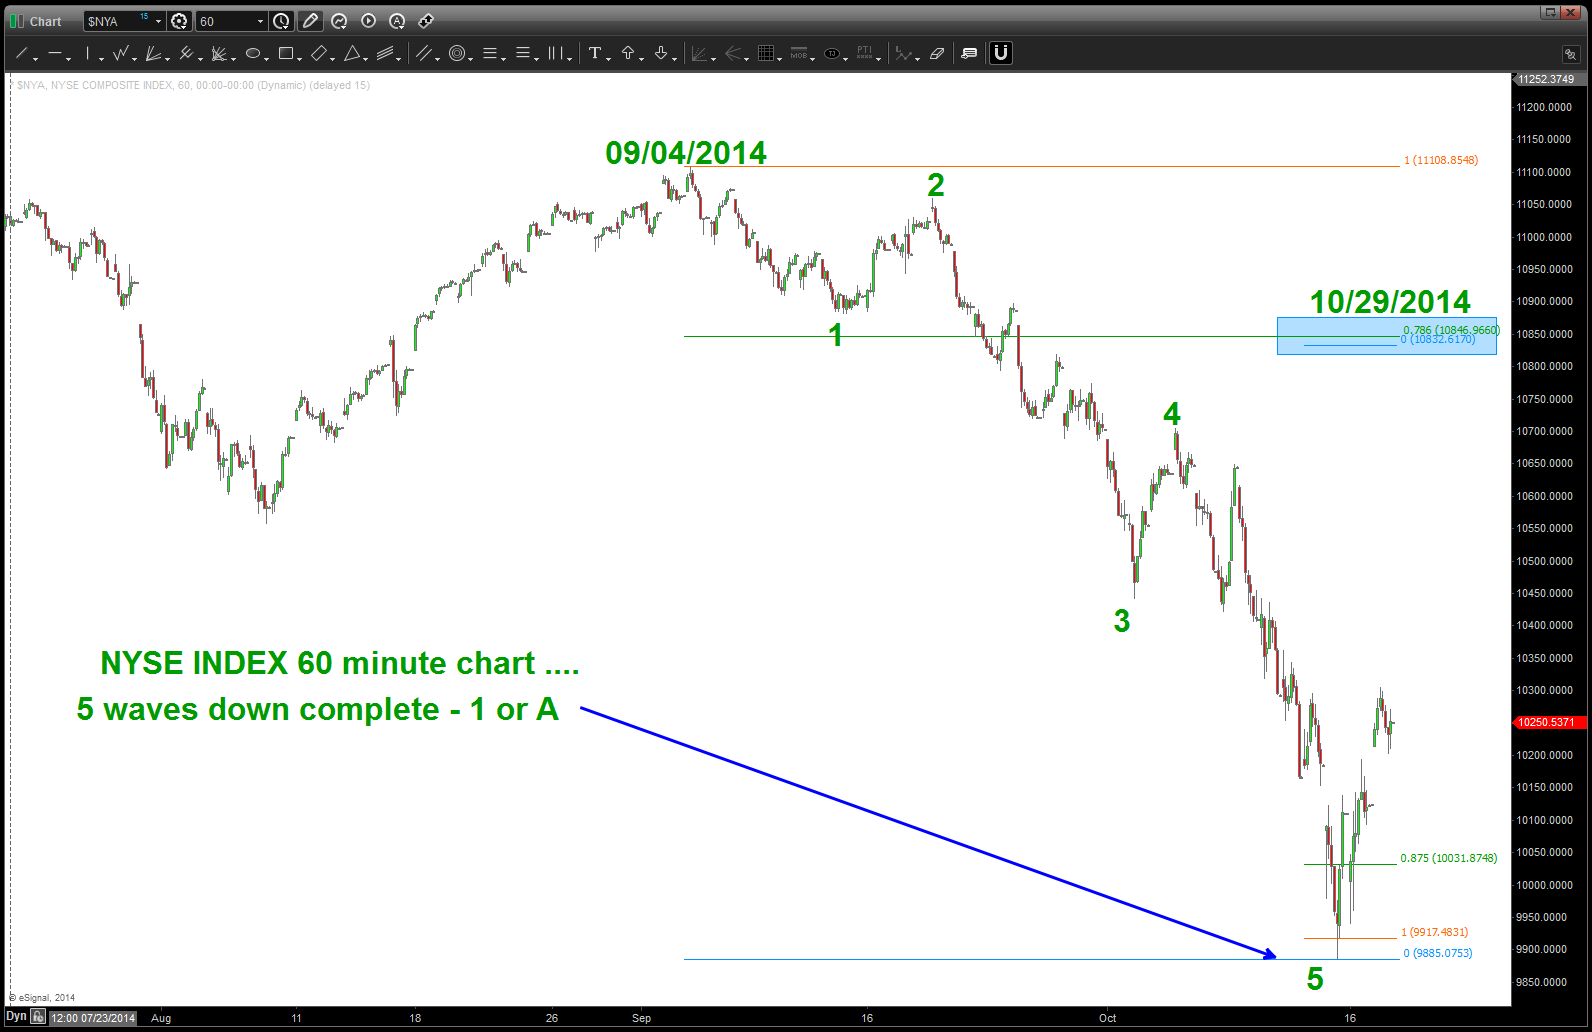
of note, now, is that we completed a pretty easy 5 waves down so the rally which is happening now 1) is to be expected and 2) is just that – a rally. IF OUR COUNT is correct we are correction w/in a B wave and a C wave will follow. What is the ideal situation? Well, a rally up into the end of the year and then the next leg down? Why? In 1929, 1987 the market crashed 55 days after the TOP WAS ALREADY IN …
so, don’t get out your BULL HATS just yet … the pattern, if corrective A-B-C is not complete and we are working thru B OR the bearish implication is we just complete 1 and we have 2,3,4,5 to go.
relax, enjoy the fall weather and remember it’s always better to be OUT of the market wishing you were in than IN the market wishing you were out ..
rock on, ok?
Bart
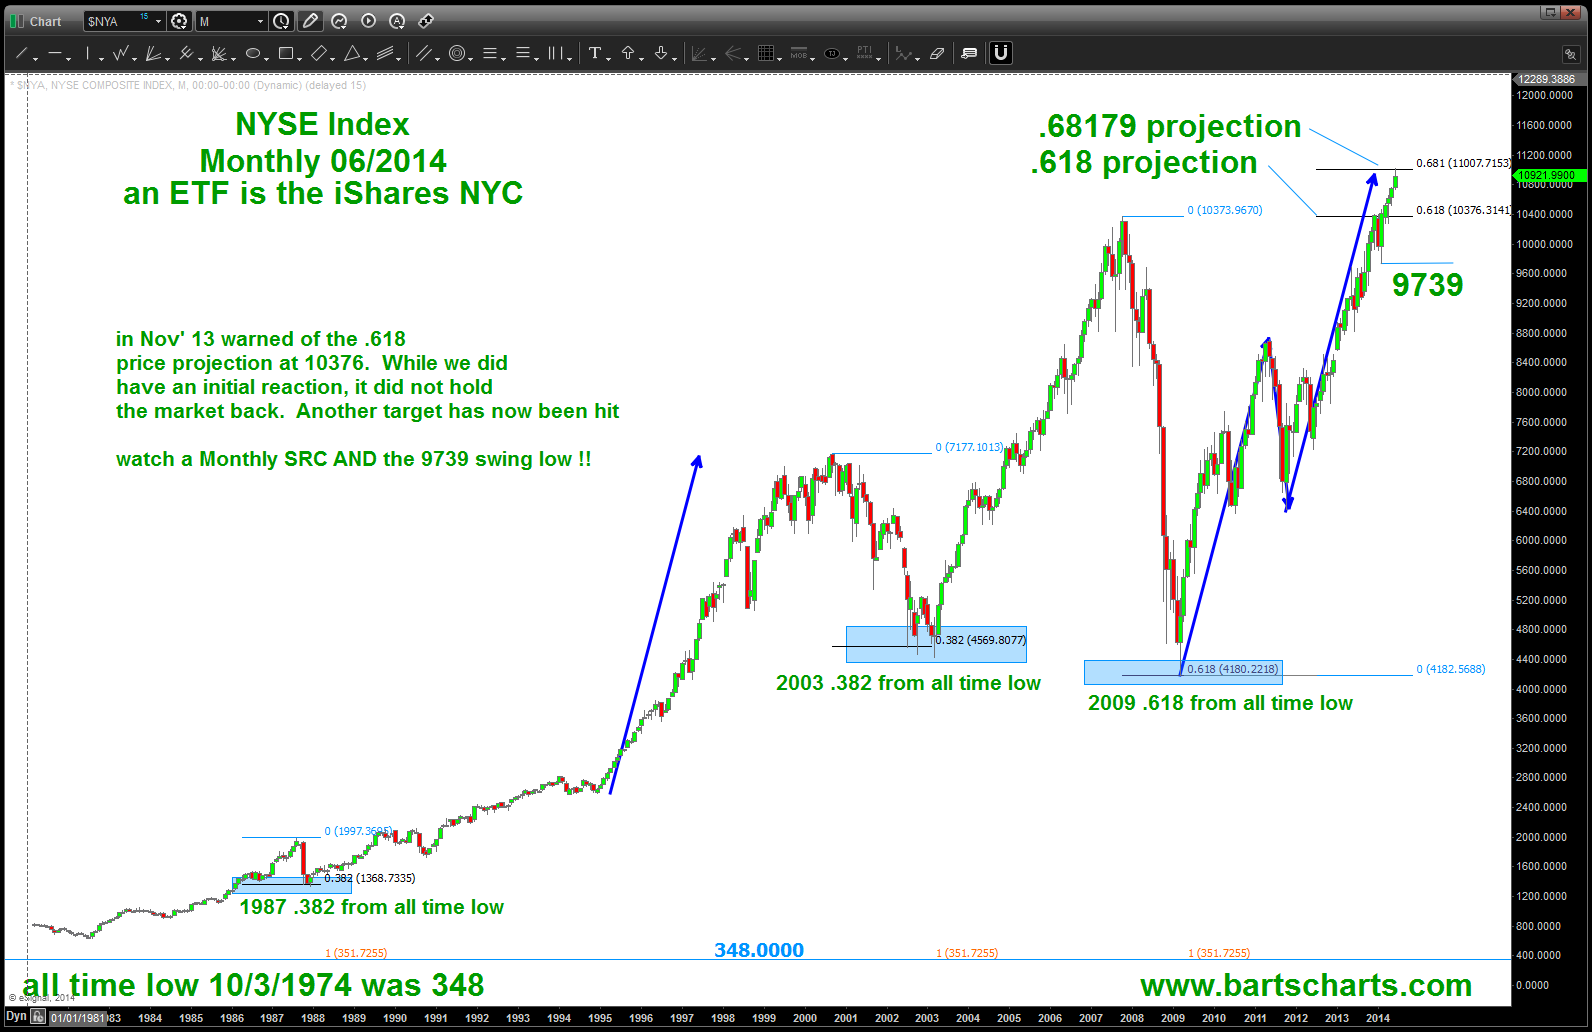
NYSE INDEX
CLIFF NOTES: in November 2013 I posted that a .618 price projection was hitting in/around 10376 level. while it did cause a month of selling AND gave a monthly signal (go look at the chart) the market subsequently “recovered” and caused the pattern to fail. Now, we have “another” pattern completing as shown below. Patterns do fail. That’s been proven .. however, a majority of the time they WORK. So, watch the swing low (it’s a monthly) and keep your powder dry. Also, the musical note F# ratio of the equal octave scale is 1.68179. Just showing that a .68179 projection works also … it’s all music.
Folks, a 10,20,30% correction is NEEDED.