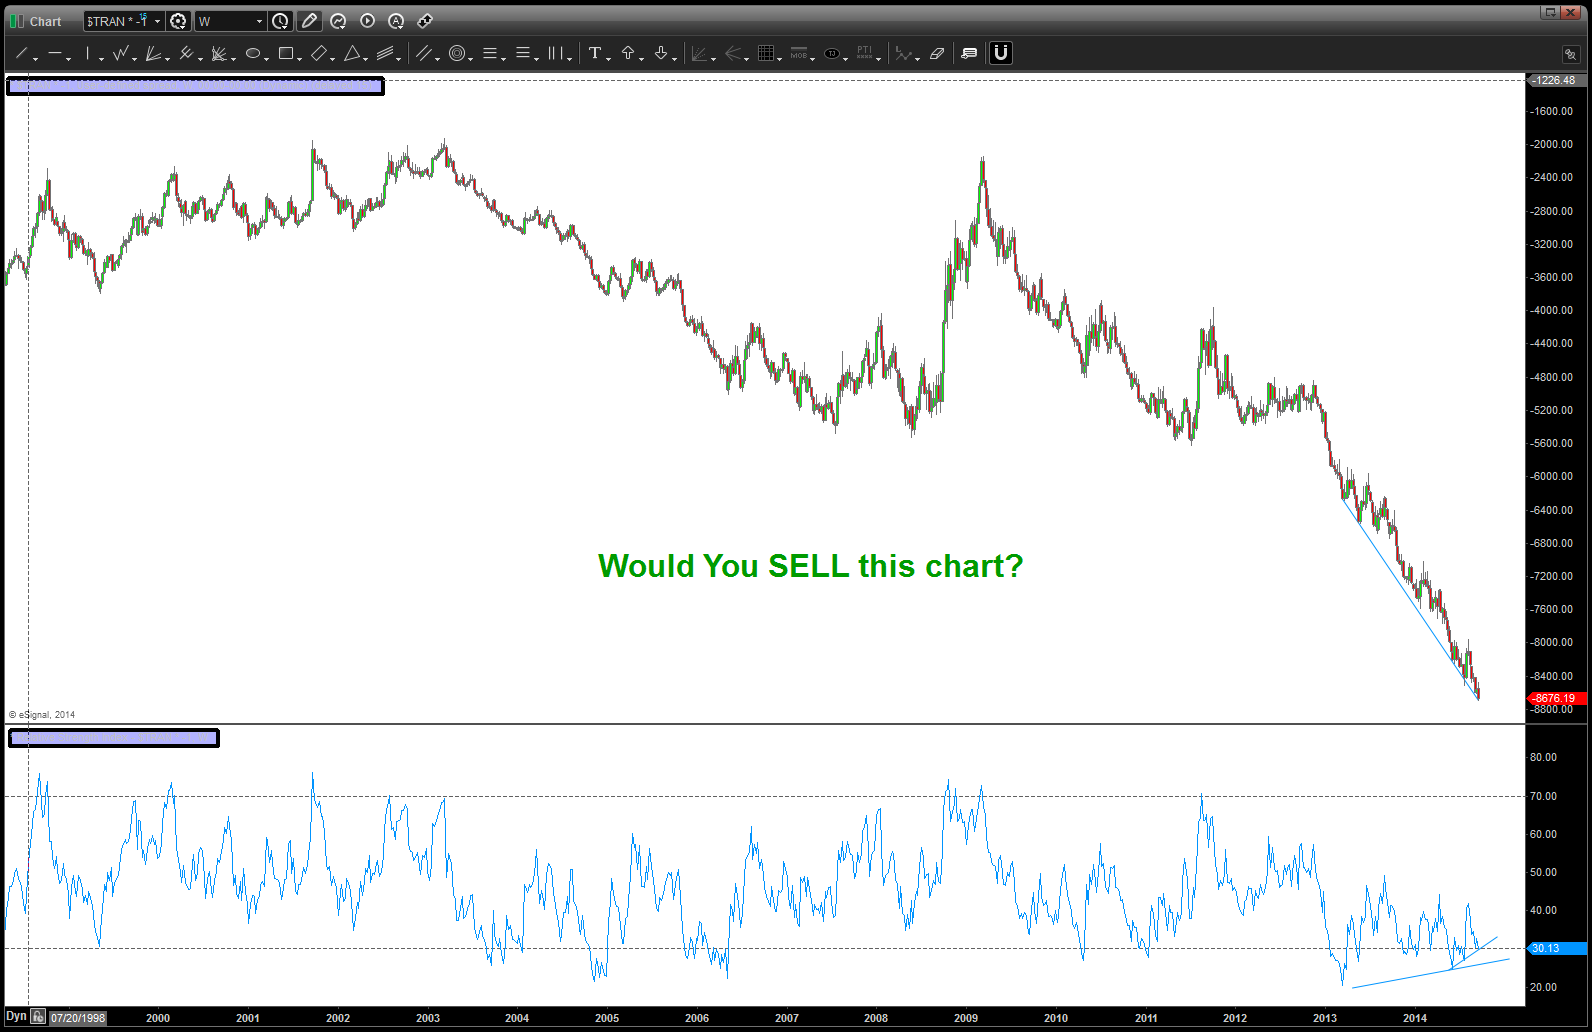
Would you SELL or BUY this chart?
Been active on Twitter and for my readers about some cycles hitting and square outs occurring and, well, blah blah blah. So as any technician is EXPECTED to do when the PATTERN has failed pretty dramatically, I hit “erase all” and went back to work. Asked myself … so, if the PATTERN SELL has failed then would you BUY it? In order to answer that question I inverted my chart and simply said – would I BUY this chart in it’s inverted state?
Would you BUY or SELL this chart?

I would stand aside. The trend is clearly negative, but extended. Not breaking down out of distribution and no way to tell from this chart where to define a stop loss and risk management.
Nice … notice the BULLISH divergence and waterfall DOWN? I certainly wouldn’t sell but do believe it’s due for a reversal … it’s an inverted chart of the Transports! Good to hear from you Brent …