Fixed Income Pattern and October 1987
there are some very interesting things to point out regarding fixed income tonight …
in the chart below note the following:
- a swing low has never been broken in this bull market run that started 33 years ago. they are shown by the dashed green lines
- we think a MAJOR top is at hand in the 153 area // this bounce is expected.
- the blue triangle represents the same corrective move that we just completed in both PRICE and TIME. NOTE — this same correction happened before in October 1987. Also note, there was no panic crash in the bonds. I’m not implying the market will crash – I’m saying the exact same PATTERN appeared and we have completed the exact same PATTERN.
- the largest corrective move in fixed income occurred during the 2008-2009 panic. the magnitude of that correction takes us to 123-124 if we do it again.
- SUMMARY: still believe a major top is at hand//breaking a swing low will confirm//bounce occurring now is expected
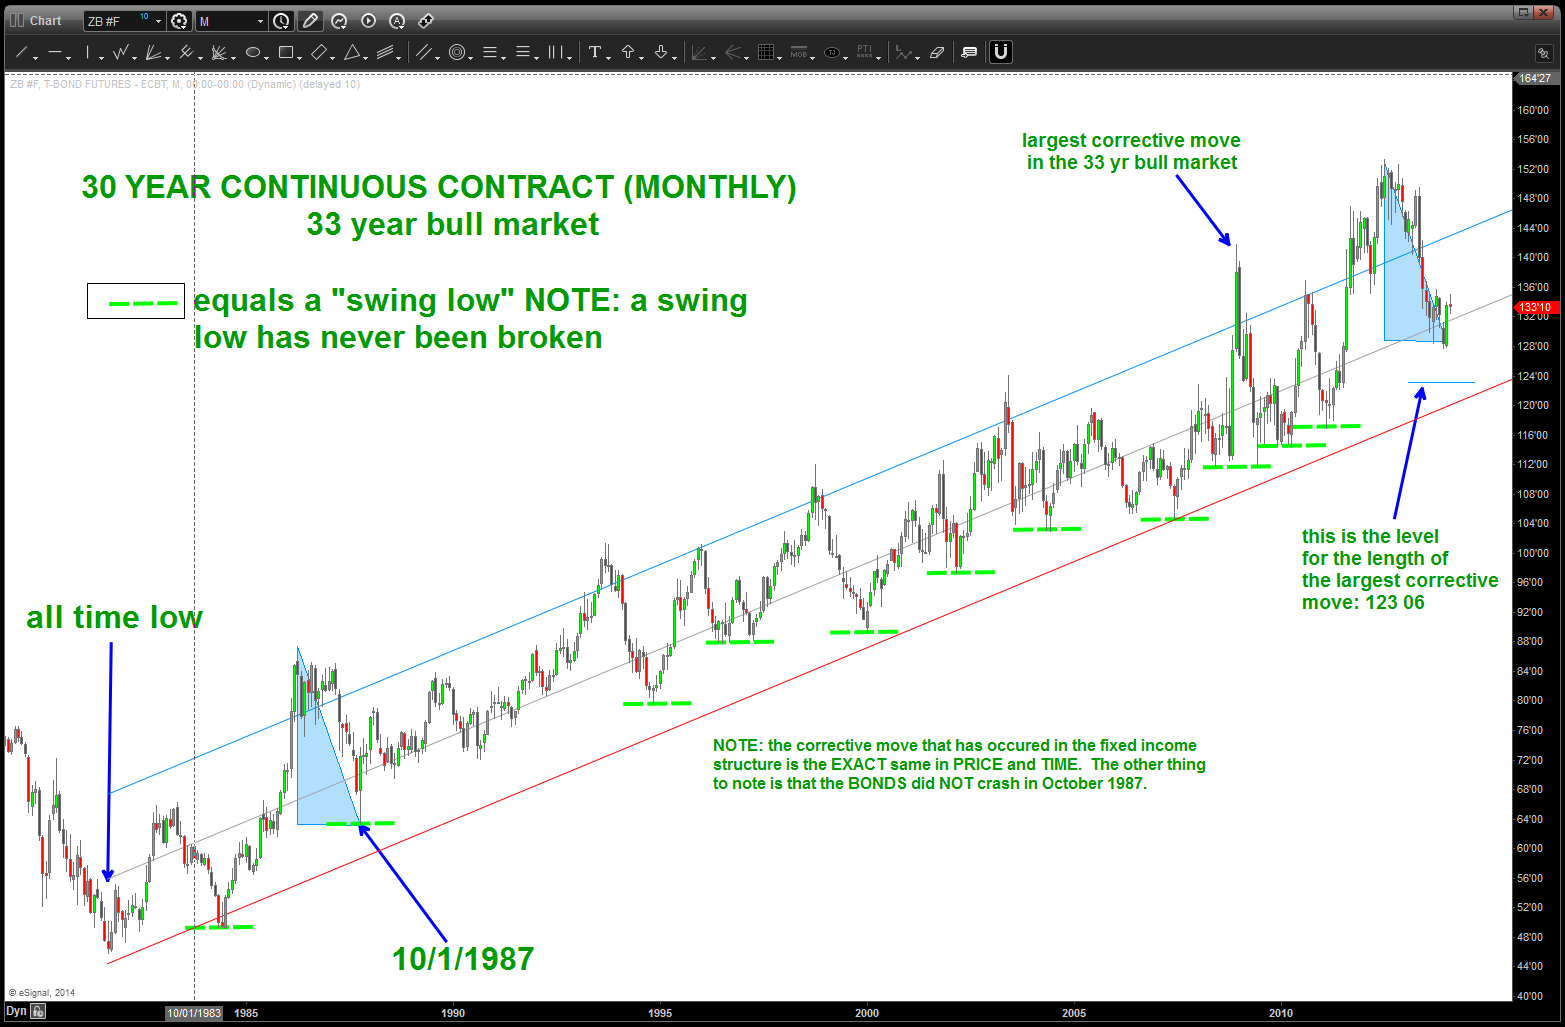
30 year bond continuous contract
next chart is the 10 year treasury yield monthly chart from 1995-2014. Data is not as good as the long bond, but we also have some very interesting developments.
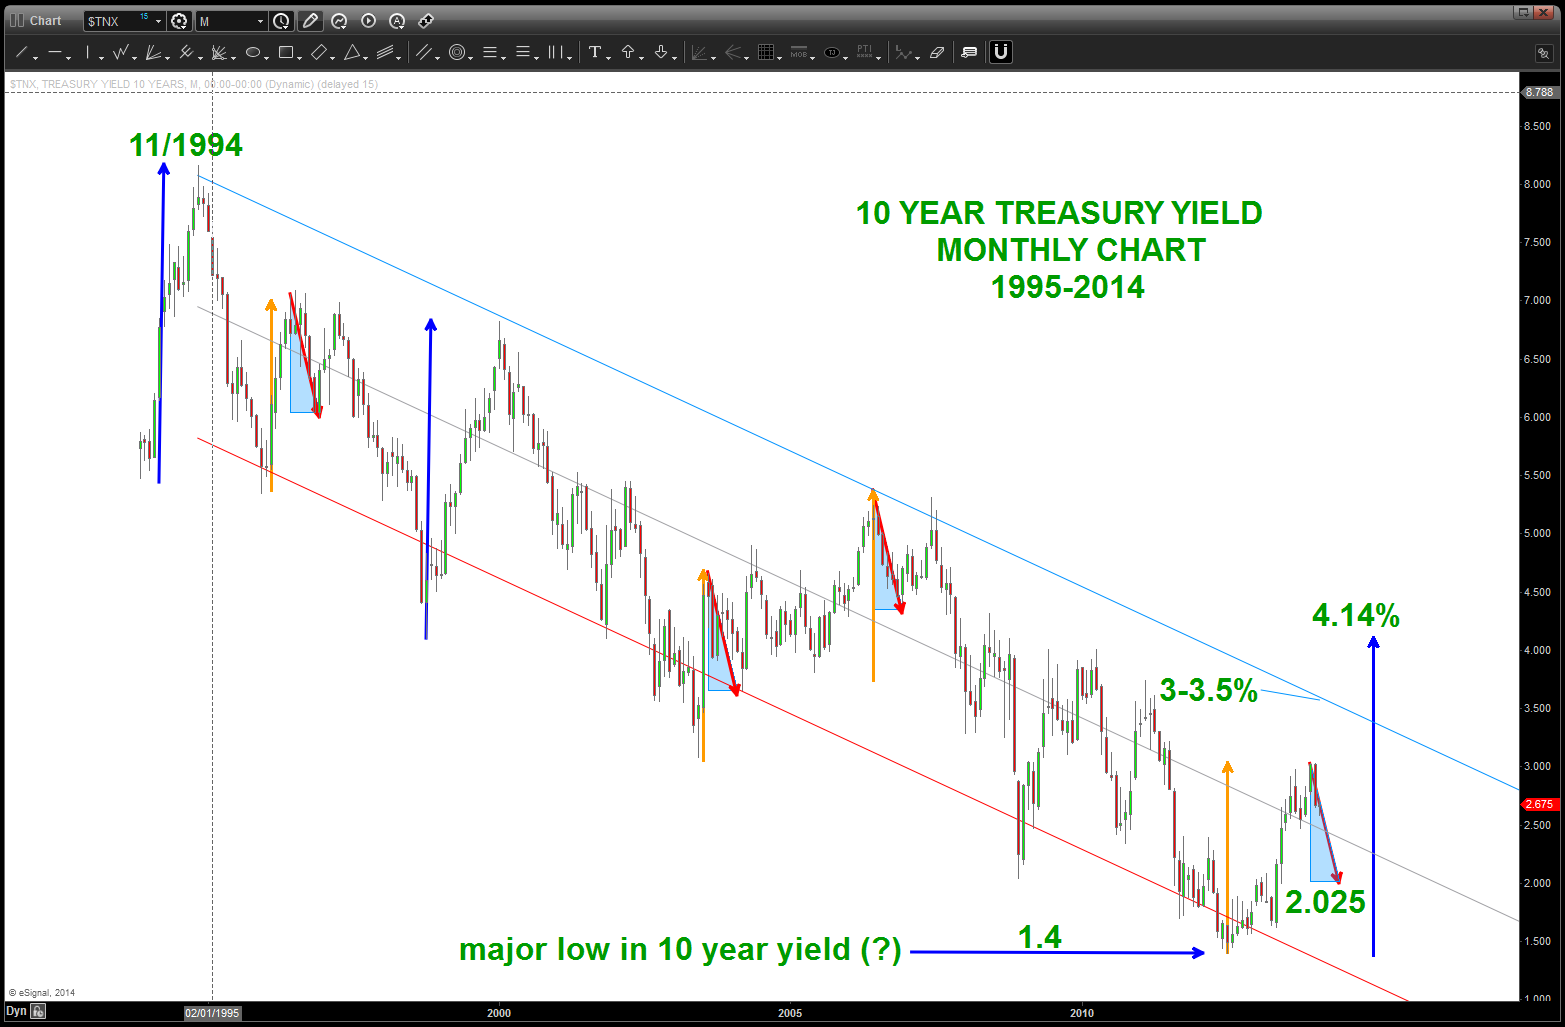
10 year yield
- note the UP orange arrow w/ the DOWN red arrow and how these arrows are overlaid by a blue triangle. the 5 wave sequence UP from the low at 1.4 is equal to the orange arrow UP so the PATTERN is the same so a correction down to the red arrow level would be an opportune time to BUY rates.
- the blue arrows show the largest move up by the interest rate structure shown …to complete that same move again will take rates to 4.14% and out of the channel which is defined by resistance in/around 3-3.5%.
- SUMMARY: believe a major low was made, we have just finished wave 1 of 5 and currently working thru a 3 wave corrective sequence. Would be looking to BUY after the corrective pattern is complete.
next chart is the Montly 30 day Federal Funds Futures … basically, this is what traders think w/ regard short term interest rates and the Fed’s policy from month/month.
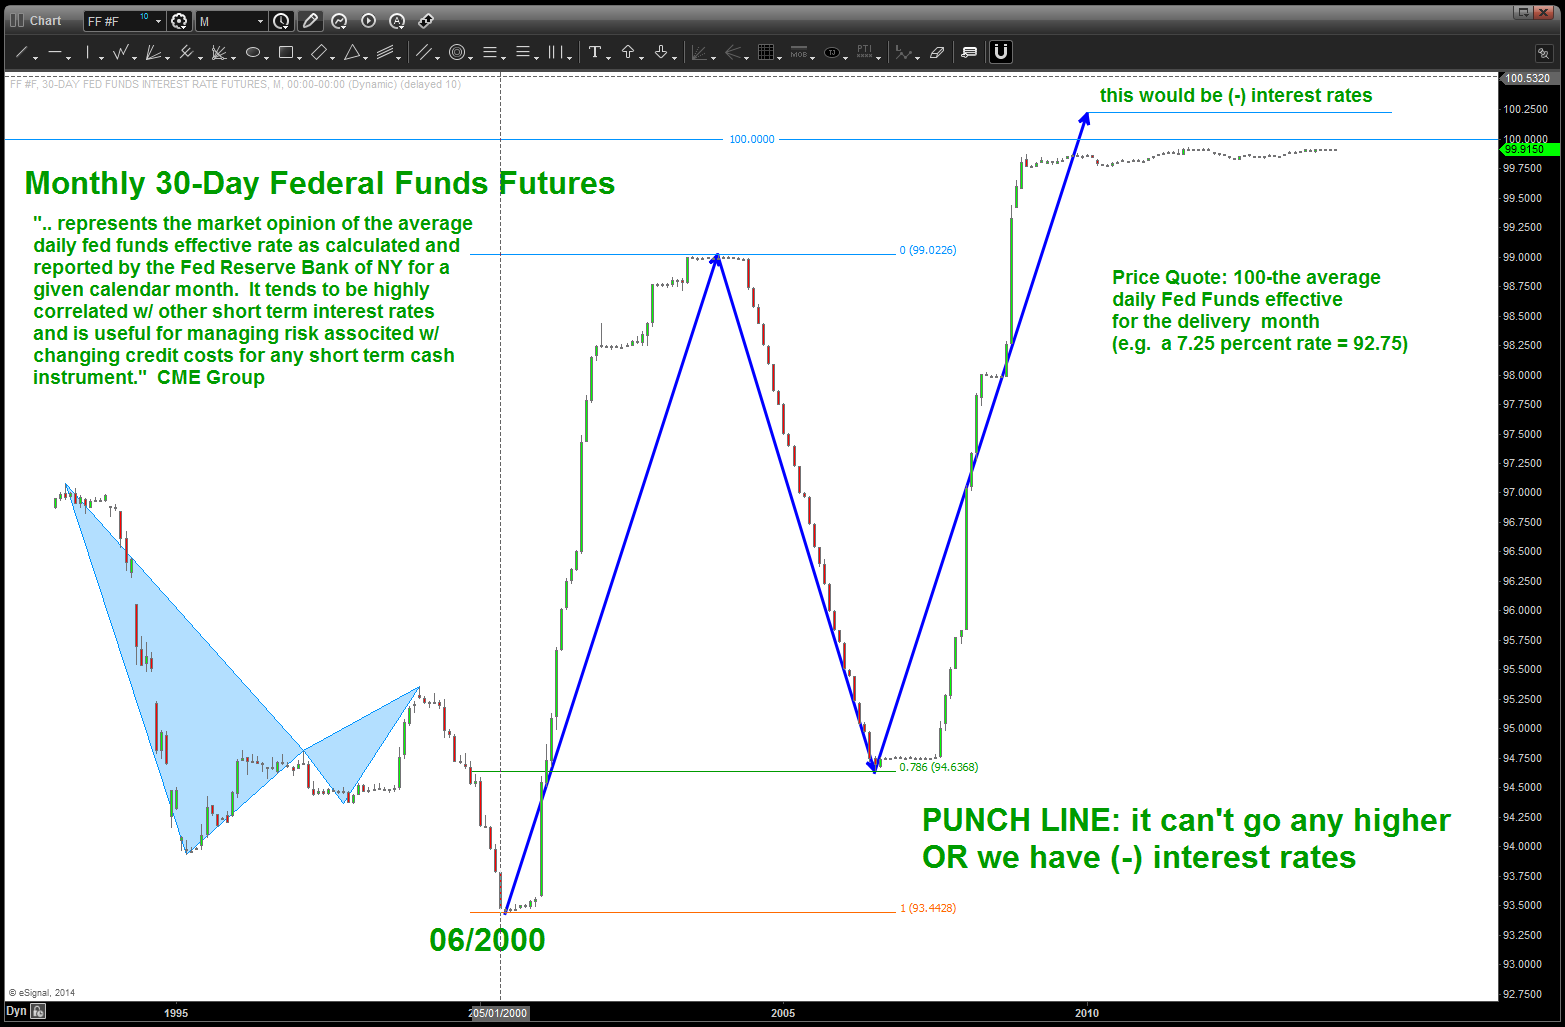
30 day fed fund futures
- NOTE: rates found resistance right at the .786 retracement. Again, the rates stopped going UP and found resistance at .786 retracement. did the fundamentals have anything to do w/ it or not?
- IF we continue the projection it goes above 100. That’s negative interest rates. Don’t think that will happen … (?) BUT for all intensive purposes, it can’t go any higher. It really hasn’t budged, which makes sense. So, if you don’t like playing the LONG side of RATES down here at these levels THEN monitor the Fed Funds for a breakdown. Believe it will be a big move to the downside, ultimately, but will be a nice confirmation of a generational low in interest rates has had it’s day and the “trade of our lifetime” to go LONG RATES is at hand.
make it a great weekend and watch the levels on the long bond AND the fact that the same PATTERN in PRICE and TIME has occurred, just like coming into a low in October of 1987.

Pingback: is it LIVE or is it MEMOREX – what is going on w/ fixed income? | Bart's Charts
Pingback: Key level on Fed Fund futures destroyed today @seeitmarket | Bart's Charts